Texto 2 Social Protection and Employment System Chile Solidario-Sence.

A Review of Department of Social
Protection Employment
Support Schemes
Department of Social Protection November 2012

2
Contents
Title Page
Introduction ……………………………………………………………………………………........... 7
Chapter 1 Labour Market Context ………………………………………………………………... 9
Labour Market Overview ……………………………………………………………... 9
Macroeconomic Context ……………………………………………………………… 9
Employment Trends …………………………………………………………………... 9
Sectoral Employment ………………………………………………………………..... 10
Occupational Trends ………………………………………………………………….. 12
Employment Flows ………………………………………………………………….... 13
Unemployment ……………………………………………………………………….. 15
Live Register …………………………………………………………………………. 18
Community Employment/DA/OPFP –
Persons in Receipt of Payments not on the Live Register …………………………… 19
Labour Force ………………………………………………………………………… 20
Outlook ………………………………………………………………………………. 21
Conclusion …………………………………………………………………………… 23
Chapter 2 Activation in the Department of Social Protection……………………………… …. 24
Introduction …………………………………………………………………………. 24
National Employment Action Plan ………………………………………………….. 24
Other Activation Initiatives ………………………………………………………... .. 27
Current Developments in Activation Policy ………………………………………... 28
Future Activation Policy in the National Employment and Entitlements Service …. 30
Pathways to Work …………………………………………………………………... 33
Conclusion ………………………………………………………………………….. 34
3
Chapter 3 Activation review of individual schemes ……………………………………….…. 36
Criteria for assessment …………………………………………………………….. 36
A. Work Programmes ……………………………………………………………. 38
A.1 Community Employment (CE) – comparison with activation criteria ………... 38
CE – Conclusions ………………………………………………………….. 41
CE – Recommendations ………………………………………………….... 41
A.2 Tús – comparison with activation criteria ……………………………………. 43
Tús – Conclusions …………………………………………………………. 46
Tús – Recommendations …………………………………………………... 47
A.3 Rural Social Scheme (RSS) – comparison with activation criteria …………... 48
Rural Social Scheme – conclusions ……………………………………….. 50
Rural Social Scheme – recommendations ………………………………..... 50
A.4 Job Initiative (JI) – comparison with activation criteria ………………………. 52
JI – Conclusions ………………………………………………………….... 53
JI – Recommendations …………………………………………………….. 53
A.5 General Conclusions and recommendation on Work Programmes …………... 54
B. Internship/ Work Placement Programmes ………………………………….... 56
B.1 JobBridge – comparison with activation criteria …………………………….... . 56
JobBridge – relationship with the WPP …………………………………….. 58
JobBridge/WPP – Conclusions ……………………………………………... 59
JobBridge – Recommendations …………………………………………….. 59
C. Programmes supporting participation in education/training …………………….. 60
C.1 Back to Education Allowance (BTEA) – comparison with activation criteria … 60
BTEA – Conclusions ……………………………………………………….. 63
BTEA – Recommendations ……………………………………………….... 65
C.2 Part-time Education Option (PTEO) and Education Training and
Development Option (ET&D) – Comparison with activation criteria ………… 67
PTEO/ET&D – Conclusions ……………………………………………….. 69
PTEO/ET&D – recommandations …………………………………………. 69

4
C.3 Activation and Family Support Programme (AFSP) –
Comparison with activation criteria ………………………………………… 71
AFSP – Conclusions ………………………………………………………. 73
AFSP – recommendations …………………………………………………. 74
C.4 TESG (Technical Employment Support Grant) and
TATS (Technical Assistance Training Scheme) – comparison with activation criteria 75
TESG and TATS – conclusions and recommendations ………………….. … 78
C.5 General Conclusions on programmes supporting participation in education/training 79
D. Programmes supporting self-employment/enterprise ……………………….. 81
D.1 Back to Work Enterprise Allowance (BTWEA) and
Short-term Enterprise Allowance (STEA) – comparison with activation criteria 81
BTWEA/STEA – Conclusions …………………………………………….. 84
BTWEA/STEA – recommendations ………………………………………. 85
D.2 Credit Union Loan Guarantee Scheme – comparison with activation criteria … 86
Credit Union Loan Guarantee Scheme – conclusions and recommendations 87
E. Miscellaneous supports ……………………………………………………….. 88
E.1 Part Time Job Initiative (PTJI) – comparison with activation criteria ………... 88
PTJI – conclusions ……………………………………………………….... 89
PTJI – recommendations …………………………………………………... 89
E.2 Employer Job PRSI Incentive scheme – comparison with activation criteria…. 90
Employer PRSI scheme – conclusions ………………………………….... 93
Employer PRSI scheme – recommendations ……………………………... 94
Chapter 4 Summary Conclusions ……………………………………………………………... 95
Background and Approach ……………………………………………………….... 95
The temporary work programmes …………………………………………………. 96
Internship/Work Placement Programmes ………………………………………...... 97
Programmes supporting participation in education/training ………………………. 97
Programmes supporting self-employment/enterprise …………………………….... 99
Unifying programmes with similar objectives …………………………………….. 100
Conclusion …………………………………………………………………………. 101
Annexe 1 ………………………………………………………………………………………....... 102
5
Figure List
Title Page
Figure 1. GNP and Employment Volume Annual Growth Rules……………………………. 9
Figure 2. Employment Rate (%) 1998 – 2011 ………………………………………………. 10
Figure 3. Employment Trends in the Goods Producing Sectors ……………………………. 11
Figure 4. Services Sector Employment Trends by Sub-Sector ……………………………… 11
Figure 5. Occupational Change 2007 – 2011 ……………………………………………….. 12
Figure 6. Regional % Emp. Change 2007 – 2011 …………………………………………... 13
Figure 7. Employment Flows (running 4 – Quarter Totals) ………………………………… 14
Figure 8. Share of Unemployed who are Long-Term ………………………………………. 16
Figure 9. Unemployment Trends by Broad Occupational Groups …………………………. 17
Figure 10. % Share of Unemployed by Educational Achievement ………………………….. 18
Figure 11. % of Live Register on JA/JB …………………………………………………….. 18
Figure 12. Inactive Payments ………………………………………………………………... 20
6
Table List
Title Page
Table 0.1 Trends in scheme expenditure, working age income and Live Register……………7
Table 1.1 Flows into Employment by Occupation 2011 …………………………………….. 15
Table 2.1 Referrals and Interviews NEAP 2005 – 2011 …………………………………….. 25
Table 2.2 Analysis of NEAP referrals ……………………………………………………….. 26
Table 2.3 Case Officer Cases under Activation Programme ………………………………… 28
Table 3.1 2012 Estimated Numbers & Expenditure all Activation Schemes ………………... 37
Table 3.2 CE Numbers and Expenditure …………………………………………………….. 38
Table 3.3 Tús Numbers and Expenditure …………………………………………………..... 43
Table 3.4 RSS Numbers and Expenditure …………………………………………………… 48
Table 3.5 Job Initiative Numbers and Expenditure ………………………………………….. 52
Table 3.6 JobBridge Numbers and Expenditure …………………………………………….. 56
Table 3.7 BTEA Numbers and Expenditure ………………………………………………… 60
Table 3.8 AFSP Numbers and Expenditure …………………………………………………. 71
Table 3.9 TATs Numbers and Expenditure …………………………………………………. 75
Table 3.10 TESG Numbers and Expenditure ………………………………………………… 75
Table 3.11 BTWEA & STEA Numbers and Expenditure …………………………………… 81
Table 3.12 Credit Union Loan Guarantee Fund Numbers and Expenditure ………………… 87
Table 3.13 PTJI Numbers and Expenditure …………………………………………………. 89
Table 3.14 Employer Job PRSI Incentive scheme Numbers and Expenditure …………… 91
Table 3.15 Employment/occupation breakdown of 2012 jobs on PRSI scheme………….. 94

7
Introduction
This policy review covers a range of programmes funded from the programme subhead “Working Age –
Employment Supports” in the Vote for Social Protection. The most significant programmes covered and
recent trends in expenditure, the average live register figures and total expenditure on working age income
supports, are set out in the table below.
Table 0.1 – Trends in scheme expenditure, working age income and Live Register
Programme Expenditure (€ millions)
2007 2010 2011 2012
(Out-turn) (Out-turn) (Estimate) (Estimate)
Community Employment Programme 357.5 368.3 356.7 315.2
Rural Social Scheme 47.8 46.0 46.1 45.7
Tús - Community Work Placement
Scheme
0.0 0.0 30.0 84.0
Job Initiative 40.0 30.2 28.5 27.2
Back to Work Allowance 71.0 87.9 91.5 137.9
National Internship Scheme - JobBridge 0.0 0.0 20.0 65.8
Back to Education Allowance 64.1 179.8 198.8 183.0
Other programmes reviewed (est.) 10.0 16.0 17.3 15.0
Total above 590.4 728.2 788.9 873.81
Expenditure on Working Age Income
Supports
3,491.5 6,669.2 6183.4 5,700 (est.)
Average Live Register (‘000) 195 442 445 440
Ratio Employment supports/Income
supports
0.17 0.11 0.13 0.15
Employment supports expenditure per
‘000 on LR (€ million)
3.03 1.65 1.77 1.99
1 The total estimate for the sub-head for 2012 is €964.4 million. This includes a number of expenditure programmes not covered
in this review:- the Community Services Programme (€45.4 million); the Wage Subsidy Scheme and the Supported Employment Programme, both targeted at people with disabilities (€10.8 million and €8.6 million, respectively; and the cost of the Local Employment Service (€19.1 million).

8
"Passive" income maintenance expenditures rose very rapidly as unemployment climbed after 2008; the
response in terms of expenditure on labour market programmes inevitably lagged somewhat, so the ratio of
programme spend to income-maintenance spend fell from 0.17 to 0.11. More recently, programme
expenditure has risen relative to income maintenance spending.
The review is focused primarily on assessing the contribution these programmes can make to the
Department of Social Protection’s activation policy stance, which aims to ensure engagement with
customers of working age, who are in receipt of specified social welfare payments/benefits, in order to
support them and their families in progressing into employment and/or other appropriate progression2. The
terms of reference are set out in Annexe 1.
Chapter 1 sets out the labour market background, recent and prospective, that will provide the context for
implementation of the Department’ policies in the short-to-medium term future.
Chapter 2 reviews the development of the Department’s policy approach to activation to date, and the
changes planned with the introduction of client profiling and case management. It summarises current
activation policy as set out in the Government’s Pathways to Work statement, and locates the schemes under
review in the context of that policy approach.
Chapter 3 sets out a number of criteria to be used in assessing programmes in terms of their contribution to
activation policy, reviews each of the schemes/programmes individually by reference to these criteria, and,
where appropriate, recommends changes designed to enhance the programme’s activation contribution.
The approach followed in the individual programme reviews has drawn on elements of an evaluation
framework developed by Forfas.3 In mid-January 2012, the relevant management teams were requested to
draw up a detailed analysis of each scheme using a programme logic model approach. The analysis in each
case set out to define programme objectives, to review how, and how successfully, the resources and
processes of the programme are deployed to meet these objectives, and to identify specific improvements
that management considered would enhance scheme performance.
The review in Chapter 3 draws heavily on the material from these programme logic models, and on the
insights of managers, while seeking also to put this information in the broader context of the assessment
criteria identified at the beginning of the Chapter.
2Community Services Programme supports voluntary and community organisations to provide essential services and businesses
to their communities. While Service providers are required to provide employment opportunities with an emphasis on employing the long term unemployed, and other marginal groups there is no requirement for the employing organisation to seek further progression for the employee given the nature of the grant and the programme objectives being pursued which focus on service delivery. For this reason CSP was not considered in this review.
3Framework for the Evaluation of Enterprise Supports, Forfas, May 2011.
9
Chapter 1 – Labour Market Context
Labour Market Overview
Macroeconomic Context
Four years on from the start of the recession, the economy, in common with much of Europe, continues to
face major challenges. GDP is expected to grow by less than 1 per cent in 2012, largely driven by continued
growth in net exports.
Employment Trends
The weakness of the economy has had a significant impact on the labour market. The numbers in
employment in Ireland have fallen by over 330,000 since employment peaked at 2.16 million in Q4 2007.
Employment continued to decline in early 2012, down 0.2% (-4,000) year-on-year in Q3 2012 to 1,841,000.
While the numbers at work have continued to decline, the rate of decline was significantly slower than in the
period up to mid-2011.
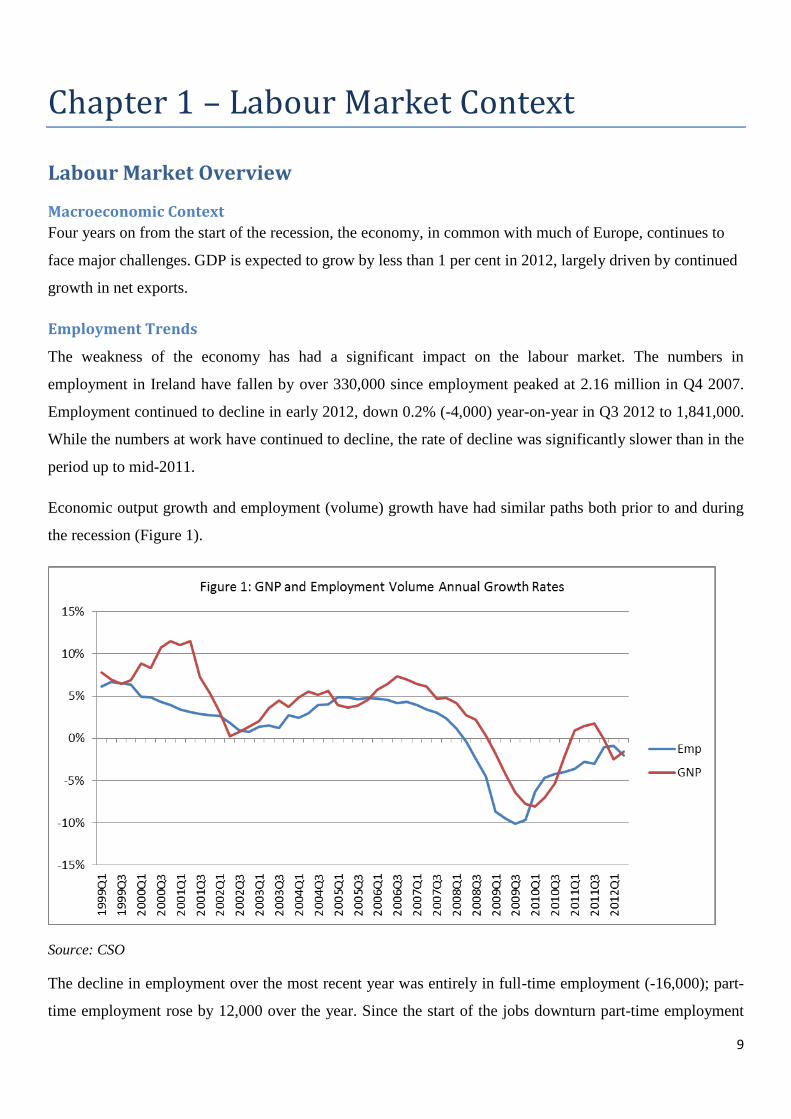
Economic output growth and employment (volume) growth have had similar paths both prior to and during
the recession (Figure 1).
Source: CSO
The decline in employment over the most recent year was entirely in full-time employment (-16,000); part-
time employment rose by 12,000 over the year. Since the start of the jobs downturn part-time employment

10
has increased by almost 40,000 while full-time employment has fallen by about 370,000. Involuntary part-
timers – those who would prefer to work longer hours – have accounted for an increasing share of all part-
time work; their numbers have risen by over 60,000 over the course of the downturn to 150,000.
The numbers at work are now at the same level as in 2003 while the employment rate4 is back to its 1998
level of 59% having reached 70% at the peak of the employment boom (Figure 2).
52.0
54.0
56.0
58.0
60.0
62.0
64.0
66.0
68.0
70.0
72.0
Q1
98
Q3
98
Q1
99
Q3
99
Q1
00
Q3
00
Q1
01
Q3
01
Q1
02
Q3
02
Q1
03
Q3
03
Q1
04
Q3
04
Q1
05
Q3
05
Q1
06
Q3
06
Q1
07
Q3
07
Q1
08
Q3
08
Q1
09
Q3
09
Q1
10
Q3
10
Q1
11
Q3
11
Q1
12
Q3
12
Figure 2: Employment Rates 1998-2012
Source: CSO
Sectoral Employment
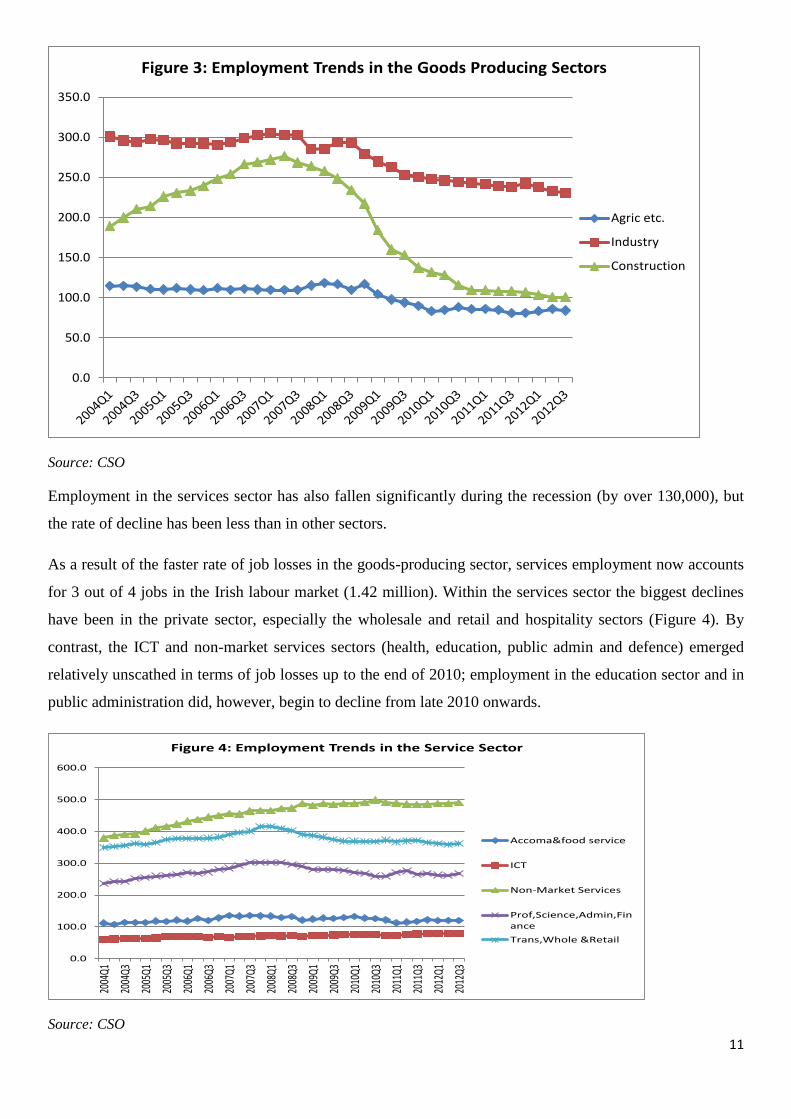
Employment in the construction sector has fallen by over 170,000 since its peak in mid-2007 (Figure 3).
More recently, the number of construction jobs has remained relatively unchanged at around 100,000 during
2012. This suggests that the precipitous decline in construction employment that occurred during the earlier
years of recession may have finally come to an end.
Employment in the industry (primarily manufacturing) sector, having stabilised in 2011, appears to have
weakened slightly in 2012, totalling 230,000 in Q3, down by 8,000 from Q3 2011. Overall, industrial
employment has fallen by just over 70,000 in the last 4 years. In addition, agriculture, the smallest of the
three goods-producing sectors, has also seen employment fall, down by 30,000 over the course of the
recession.
4 The employment rate measures the percentage of the population aged 15-64 who are in employment.
11
0.0
50.0
100.0
150.0
200.0
250.0
300.0
350.0
Figure 3: Employment Trends in the Goods Producing Sectors
Agric etc.
Industry
Construction
Source: CSO
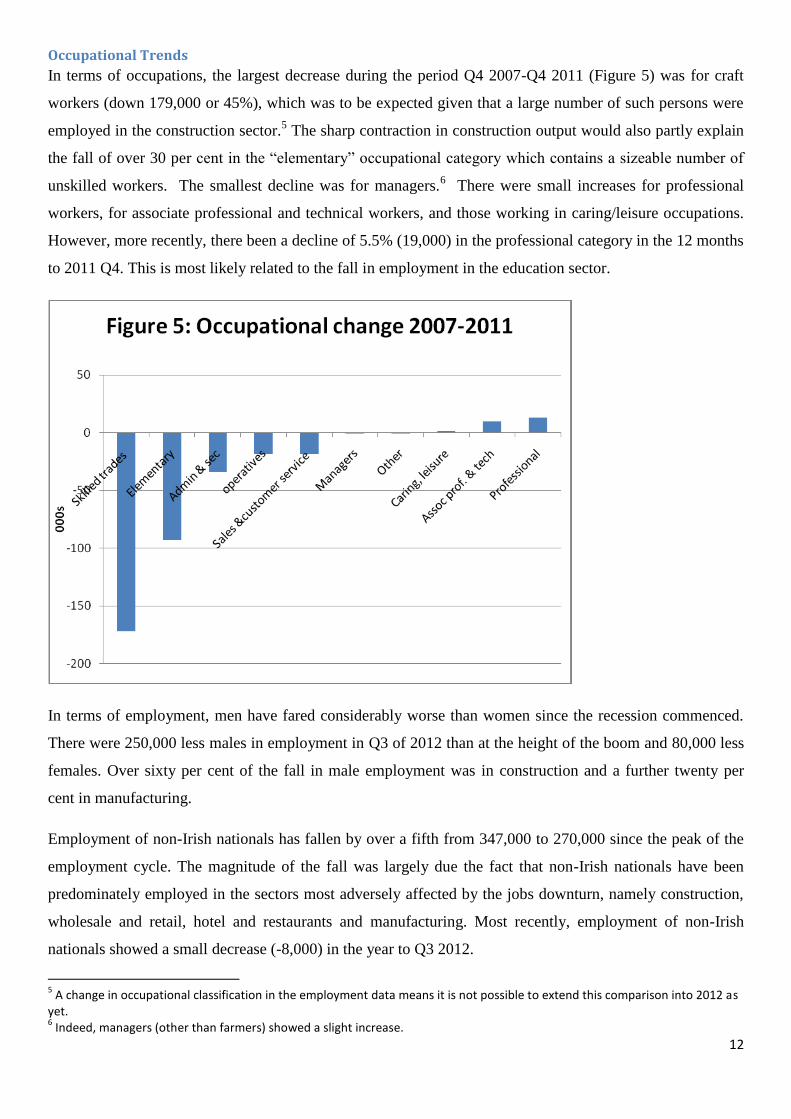
Employment in the services sector has also fallen significantly during the recession (by over 130,000), but
the rate of decline has been less than in other sectors.
As a result of the faster rate of job losses in the goods-producing sector, services employment now accounts
for 3 out of 4 jobs in the Irish labour market (1.42 million). Within the services sector the biggest declines
have been in the private sector, especially the wholesale and retail and hospitality sectors (Figure 4). By
contrast, the ICT and non-market services sectors (health, education, public admin and defence) emerged
relatively unscathed in terms of job losses up to the end of 2010; employment in the education sector and in
public administration did, however, begin to decline from late 2010 onwards.
0.0
100.0
200.0
300.0
400.0
500.0
600.0
2004
Q1
2004
Q3
2005
Q1
2005
Q3
2006
Q1
2006
Q3
2007
Q1
2007
Q3
2008
Q1
2008
Q3
2009
Q1
2009
Q3
2010
Q1
2010
Q3
2011
Q1
2011
Q3
2012
Q1
2012
Q3
Figure 4: Employment Trends in the Service Sector
Accoma&food service
ICT
Non-Market Services
Prof,Science,Admin,Finance
Trans,Whole &Retail
Source: CSO
12
Occupational Trends
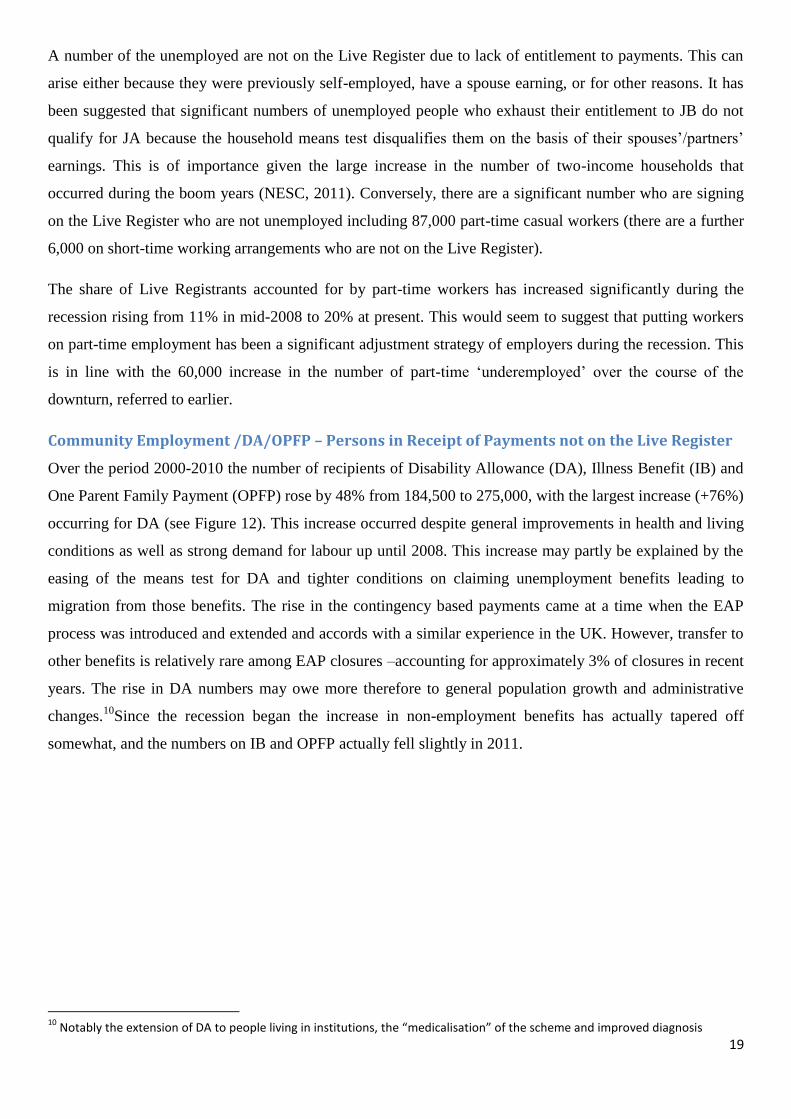
In terms of occupations, the largest decrease during the period Q4 2007-Q4 2011 (Figure 5) was for craft
workers (down 179,000 or 45%), which was to be expected given that a large number of such persons were
employed in the construction sector.5 The sharp contraction in construction output would also partly explain
the fall of over 30 per cent in the “elementary” occupational category which contains a sizeable number of
unskilled workers. The smallest decline was for managers.6 There were small increases for professional
workers, for associate professional and technical workers, and those working in caring/leisure occupations.
However, more recently, there been a decline of 5.5% (19,000) in the professional category in the 12 months
to 2011 Q4. This is most likely related to the fall in employment in the education sector.
In terms of employment, men have fared considerably worse than women since the recession commenced.
There were 250,000 less males in employment in Q3 of 2012 than at the height of the boom and 80,000 less
females. Over sixty per cent of the fall in male employment was in construction and a further twenty per
cent in manufacturing.
Employment of non-Irish nationals has fallen by over a fifth from 347,000 to 270,000 since the peak of the
employment cycle. The magnitude of the fall was largely due the fact that non-Irish nationals have been
predominately employed in the sectors most adversely affected by the jobs downturn, namely construction,
wholesale and retail, hotel and restaurants and manufacturing. Most recently, employment of non-Irish
nationals showed a small decrease (-8,000) in the year to Q3 2012.
5 A change in occupational classification in the employment data means it is not possible to extend this comparison into 2012 as
yet. 6 Indeed, managers (other than farmers) showed a slight increase.

13
The regional impact of the jobs downturn over the period 2008 – 2012 can be seen from Figure 6 below. The
Border region was the worst affected with the number of people with jobs down 20%. The South East fared
the next worst (down 19%). The smallest decline was for people living in the Mid-East (down 11%) - many
of whom would actually be commuting to work in Dublin. The Mid-East decline was significantly below the
rate of the national decline of 14%. People living in Dublin itself experienced a decline of 14%, in line withn
the national decline.
-25%
-20%
-15%
-10%
-5%
0%
Figure 6: Employment Change by Region 2008 - 2012
Source: CSO
At the peak in 2007 there were 340,000 young people (aged under 25) in employment but their numbers had
fallen to 156,000 by 2012. There are several reasons for this decline. Young people, typically, suffer
disproportionately from job losses in recessions as they tend to have entered employment more recently, and
are more likely to hold temporary contracts and to be employed in cyclically sensitive industries than older
workers7. Equally, young people who might have entered employment in more favourable times have
remained longer in education. Finally, the number of young adults in the population has fallen by over
110,000 over the last four years, largely due to cohort affects (relating back to smaller numbers of births in
the early 1990s), but also reflecting changed migration flows.
Employment Flows
Even in a period when employment is falling, there are very large flows of people into as well as out of
work. As shown in Figure 7, it is estimated that between 2002 and 2007 entries to employment from non-
employment8 were running at between 250,000 to 300,000 per annum, while exits from employment were
running at between 150,000 and 200,000. Entries fell to 170,000 in the year to mid-2009. At the same time,
7Scarpetta, S., Sonnet A. and Th. Manfredi (2010), Rising Youth Unemployment during the Crisis: How to Prevent Negative Long-
Term Consequences on a Generation?, OECD SOCIAL, Employment and Migration Papers, No. 10

14
employment fell by over 180,000 in twelve months, implying that exits from employment had surged to an
annual rate of almost 360,000.
Figure 7 also shows that entries to employment recovered after 2009, reaching almost 230,000 2011 before
weakening somewhat in early 2012; exits, though falling, remained high – at about 238,000 in the year to
mid-2012, so that employment fell by 33,000 over the year.
The most recent occupational data for flows into employment are for the full year 2011, when entries to
employment totalled 229,000. The occupational breakdown of these flows is shown in Table 1 below. The
majority of movements during the year were into routine service jobs and to skilled and unskilled manual
jobs. One interesting feature of the data is the number of people entering construction craft jobs, at almost
14,000. In addition, there were also 10,000 persons entering labouring jobs, a significant number of whom
would have been employed in the construction sector.
8 These flows are estimates based on analysis of CSO QNHS micro-data. They include only flows of persons from non-
employment (unemployed or not in the labour force) into jobs. Job-openings a) taken up by people moving between jobs and b) taken up directly by people immigrating to the country are therefore not included in the data. The data should be treated as tentative pending up-dating of the micro data to reflect recent upward revisions to the headline QNHS totals.

15
Table 1.1: Flows into Employment by Occupation -2011
Managers and Administrators 7,500 3%
Professional Occupations 23,000 10%
Teachers 8,700 4%
Business/finance 4,900 2%
Engineering and science including ICT 5,900 3%
Associate Professional and Technical Occupations 16,600 7%
Cultural, artistic and sporting 4,200 2%
Nursing 2,100 1%
Engineering and science including ICT 2,900 1%
Clerical and Secretarial Occupations 21,000 9%
Craft and Related Occupations 37,500 16%
Construction crafts 13,800 6%
Mechanical crafts 9,300 4%
Production crafts 14,400 6%
Personal and Protective Service Occupations 23,100 10%
Sales Occupations 34,600 15%
Plant and Machine Operatives 17,700 8%
Other (elementary) occupations 47,800 21%
Manual 10,400 5%
Service 37,400 16%
Total 228,600 100%
Unemployment
Unemployment has almost tripled since the second half of 2007 from 112,000 to just over 318,000
(seasonally adjusted) in Q3 2012. In the year to Q3 2012, the number of persons classified as long-term
unemployed increased by 1,400 (+0.7%), bringing long-term unemployment to 193,000. As a result, long-
term unemployment accounted for 59% of total unemployment in Q3 2012 compared with 30% in 2007.
The rise in long-term unemployment has however, slowed significantly over the last year. Meanwhile,
inflows into unemployment have slowed recently as reflected in a fall in short-term unemployment of 5,000
(-3%) to 129,000 between Q3 2011 and Q3 2012.
Over the course of the recession, the male unemployment rate has risen from 5% to 18%, while the
corresponding rate for women also rose, albeit at a slower pace, from 4% to 11%.

16
0%
10%
20%
30%
40%
50%
60%
70%
Q198
Q498
Q399
Q200
Q101
Q401
Q302
Q203
Q104
Q404
Q305
Q206
Q107
Q407
Q308
Q209
Q110
Q410
Q311
Q212
Figure 8: % of Unemployed who are Long-Term
Source: CSO
The younger groups had rates as high as 41% (ages 15–19) and 28% (ages 20–24) in the first nine months of
2012 compared to 14% for prime age workers (ages 25–54). This reflects both the rise in the numbers
unemployed at the beginning of the recession, and the sharp fall in the size of the labour force in these
younger age-groups.
Despite their higher unemployment rates, it should be noted that the absolute number of young unemployed
continues to be much less than that of unemployed prime-age workers because the latter are a much larger
proportion of the workforce; for example, there were 71,000 young unemployed aged 15–24 on average in
the first nine months of 2012 but 97,000 aged 25–34 and 127,000 aged 35–54. The absolute number of
young unemployed has in fact been falling since it peaked in 2009.
Regional differences in unemployment rates have also widened over the course of the recession. In Q1 2008
some two percentage points separated the lowest rates in the Greater Dublin Area (Dublin and Mid-East
Regions) from the two regions with the highest rates. By Q3 2012, the South-East had a rate of 19 per cent
while the Greater Dublin Area had a rate of 13 per cent.
In quarter 4 2011, crafts persons accounted for the greatest share of total unemployment (22%). However,
the share of crafts persons had declined significantly, from 28% in quarter 4 2009, as the absolute number of
unemployed crafts persons fell over this period as overall unemployment continued to rise. Crafts persons
and labourers were at the highest risk of unemployment during 2011, with unemployment rates in these
occupations significantly exceeding those recorded for other occupations. In quarter 4 2011, professionals
(4.3%), managers (5.8%) and associate professionals (7.4%) had the lowest unemployment rates. While the
unemployment rate increased for all occupations between quarter 4 2007 and quarter 4 2011, the increase for
high skilled occupations (managers, professionals and associate professionals) was not as pronounced as that
for other occupations (Figure 9). The greatest rise was observed for crafts persons, labourers and operatives:

17
the unemployment rate for these occupations rose by between 13 and 16 percentage points over the period
quarter 4 2007 to quarter 4 2011.9
Figure 9: Unemployment Trends by Broad Occupational Groups
Source: Analysis by DSP based on CSO data
The unemployment total of nearly 302,000 in Q4 2011 included 150,000 persons with higher secondary
level qualifications (including post-Leaving Certificate non-third level) and over 90,000 who had attained at
most lower secondary standard. These two groups combined accounted for nearly 80 per cent of total
unemployment (see Figure 10). Over the course of the downturn, the unemployment rate for those with the
lowest qualifications has risen from 8% to 25%, while the rate for those with third level qualifications rose
from 3% to 8%; the unemployment rate gap between the two groups thus widened by twelve percentage
points. (Attention has been drawn elsewhere to the particularly sharp relative rise in unemployment among
persons described in the QNHS as having “post-Leaving Certificate” qualifications. This is almost entirely
the result of the increase in unemployment among craft workers, as the apprenticeship-based qualifications
held by such workers are included in the “post-Leaving Certificate” category in the QNHS).
Although the absolute number of unemployed people with third level qualifications has risen rapidly, this
has been from a small base, and reflects primarily the growth of the numbers with such qualifications in the
labour force overall. At the end of 2011, persons qualified to third level accounted for 41% of the labour
force, for 21% of the unemployed, and for about 16% of the long-term unemployed.
9 As a result of the re-classification of occupations referred to earlier, this time-series comparison cannot be extended into 2012
as yet. A similar restriction applies to longer-term comparisons of the educational attainment of the unemployed.

18
Source: CSO
Live Register
The seasonally adjusted Live Register total was 174,000 in December 2007 but 443,000 three years later, an
increase of almost 270,000. While the overall number signing on the Live Register has fallen slightly, from a
seasonally-adjusted peak of 449,000 in late 2011 to 432,000 in November 2012, there has been a noticeable
change in both the duration on the Live Register and by extension the payment composition. Long-term
claimants now account for 45% of the Live Register having increased from 150,000 to 187,000 between
November 2010 and November 2012. This has fed into the number applying for the means-tested
Jobseeker’s Allowance (JA) with a resultant rise of 23,000 to 303,000 while Jobseeker’s Benefit (JB) claims
have actually fallen by 38,000 to 81,000 (Figure 11)
0%
10%
20%
30%
40%
50%
60%
70%
80%
1994
M11
1995
M08
1996
M05
1997
M02
1997
M11
1998
M08
1999
M05
2000
M02
2000
M11
2001
M08
2002
M05
2003
M02
2003
M11
2004
M08
2005
M05
2006
M02
2006
M11
2007
M08
2008
M05
2009
M02
2009
M11
2010
M08
2011
M05
2012
M02
2012
M11
Figure 11: Live Register by Claim Type
JA
JB
Source: CSO
19
A number of the unemployed are not on the Live Register due to lack of entitlement to payments. This can
arise either because they were previously self-employed, have a spouse earning, or for other reasons. It has
been suggested that significant numbers of unemployed people who exhaust their entitlement to JB do not
qualify for JA because the household means test disqualifies them on the basis of their spouses’/partners’
earnings. This is of importance given the large increase in the number of two-income households that
occurred during the boom years (NESC, 2011). Conversely, there are a significant number who are signing
on the Live Register who are not unemployed including 87,000 part-time casual workers (there are a further
6,000 on short-time working arrangements who are not on the Live Register).
The share of Live Registrants accounted for by part-time workers has increased significantly during the
recession rising from 11% in mid-2008 to 20% at present. This would seem to suggest that putting workers
on part-time employment has been a significant adjustment strategy of employers during the recession. This
is in line with the 60,000 increase in the number of part-time ‘underemployed’ over the course of the
downturn, referred to earlier.
Community Employment /DA/OPFP – Persons in Receipt of Payments not on the Live Register
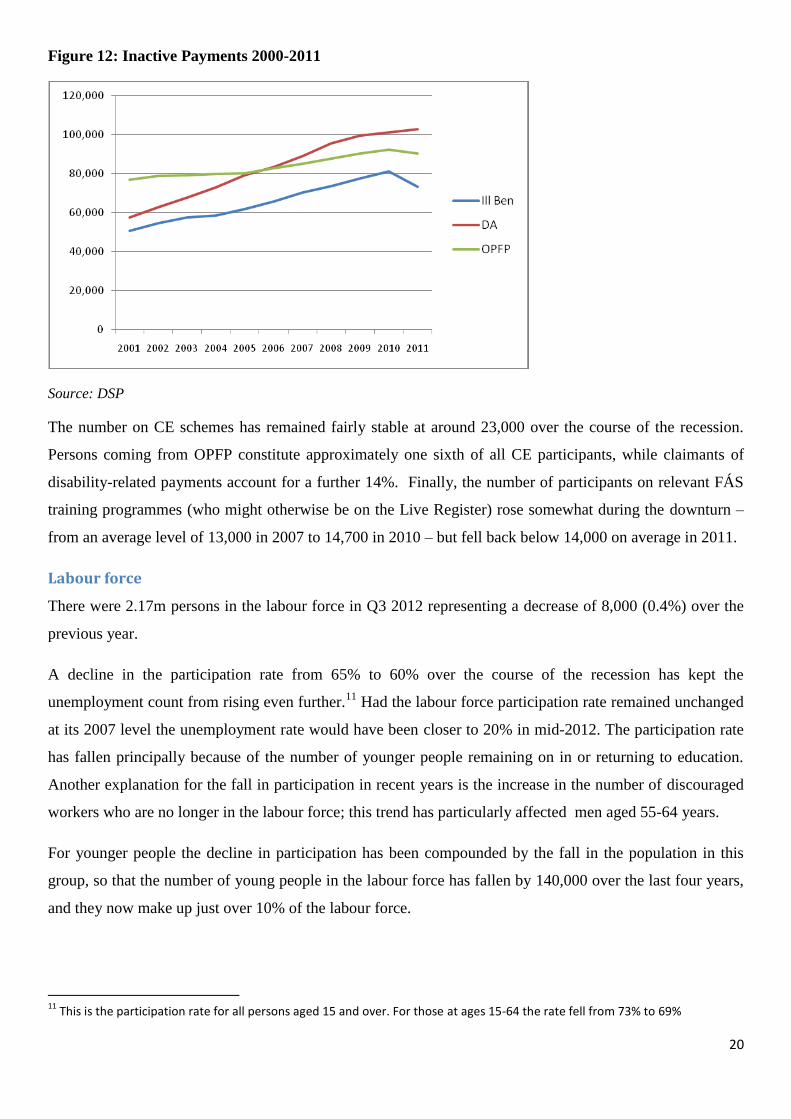
Over the period 2000-2010 the number of recipients of Disability Allowance (DA), Illness Benefit (IB) and
One Parent Family Payment (OPFP) rose by 48% from 184,500 to 275,000, with the largest increase (+76%)
occurring for DA (see Figure 12). This increase occurred despite general improvements in health and living
conditions as well as strong demand for labour up until 2008. This increase may partly be explained by the
easing of the means test for DA and tighter conditions on claiming unemployment benefits leading to
migration from those benefits. The rise in the contingency based payments came at a time when the EAP
process was introduced and extended and accords with a similar experience in the UK. However, transfer to
other benefits is relatively rare among EAP closures –accounting for approximately 3% of closures in recent
years. The rise in DA numbers may owe more therefore to general population growth and administrative
changes.10
Since the recession began the increase in non-employment benefits has actually tapered off
somewhat, and the numbers on IB and OPFP actually fell slightly in 2011.
10
Notably the extension of DA to people living in institutions, the “medicalisation” of the scheme and improved diagnosis
20
Figure 12: Inactive Payments 2000-2011
Source: DSP
The number on CE schemes has remained fairly stable at around 23,000 over the course of the recession.
Persons coming from OPFP constitute approximately one sixth of all CE participants, while claimants of
disability-related payments account for a further 14%. Finally, the number of participants on relevant FÁS
training programmes (who might otherwise be on the Live Register) rose somewhat during the downturn –
from an average level of 13,000 in 2007 to 14,700 in 2010 – but fell back below 14,000 on average in 2011.
Labour force
There were 2.17m persons in the labour force in Q3 2012 representing a decrease of 8,000 (0.4%) over the
previous year.
A decline in the participation rate from 65% to 60% over the course of the recession has kept the
unemployment count from rising even further.11
Had the labour force participation rate remained unchanged
at its 2007 level the unemployment rate would have been closer to 20% in mid-2012. The participation rate
has fallen principally because of the number of younger people remaining on in or returning to education.
Another explanation for the fall in participation in recent years is the increase in the number of discouraged
workers who are no longer in the labour force; this trend has particularly affected men aged 55-64 years.
For younger people the decline in participation has been compounded by the fall in the population in this
group, so that the number of young people in the labour force has fallen by 140,000 over the last four years,
and they now make up just over 10% of the labour force.
11
This is the participation rate for all persons aged 15 and over. For those at ages 15-64 the rate fell from 73% to 69%

21
Net outward migration flows have also contributed to the reduction in the labour force over the course of the
recession. Between April 2009 and April 2012 the CSO estimate that there was net outward migration of
approximately 90,000 for the 15+ age group. Net outward migration for Irish nationals was approximately
59,000 for this period (this is a total figure as the CSO does not publish migration flows by nationality by
age). This would suggest that more than half of the net outward migration for persons of working age over
this period was accounted for by Irish nationals emigrating. Net outward migration for Irish nationals was
particularly pronounced in the year to April 2012 (26,000).
Outlook
The Eurozone and domestic fiscal crises continue to impact on both domestic and export markets. Domestic
demand remains weak while the export sector is finding conditions increasing difficult (notwithstanding
recent improvements in both productivity and cost-competitiveness – the latter partly arising from the
depreciation of the Euro). Current forecasts all point to, at best, modest economic growth over the short-to-
medium term. GDP is expected to grow by 0.9 per cent in 2012, and by 1.5% in 2013. Expectations of
slightly faster growth in 2013 are predicated on some recovery in external demand; a high degree of
uncertainty attaches to this forecast.
During the ‘boom-to-bust’ period, the fall in output translated very quickly into falls in employment – much
more immediately in Ireland than in many other countries. This is indicative of the particular impact of the
downturn on labour-intensive sectors, and of the flexibility of the Irish labour market. If, as seems to be the
case, at least the early stage of recovery is concentrated in more capital-intensive sectors, it may be some
time before we see any economic upturn translated into a corresponding increase in employment.
Hence the outlook for the labour market is even less encouraging than for the economy as a whole. While
the employment decline is expected to come to an end in 2013, no significant net employment growth is
envisaged over the short term; looking slightly further ahead, employment is expected to increase by just
over 2% (40,000) between 2013 and 2015.
Up until now, the impact of the jobs downturn on unemployment has been moderated by a combination of
emigration and reduced participation, and this trend should continue, although the scope for further declines
in participation is likely to be less than it was. Even so, no significant fall in the unemployment rate is
foreseen over a 2-3 year time horizon. Based on the anticipated level of employment growth, the
unemployment rate is expected fall slightly, to about 13.0% in 2015.12
Moreover, current measured
12
The employment and unemployment forecasts for 2015 are from Medium-Term Fiscal Statement, Dept. of Finance, November
2012

22
unemployment is likely to understate the numbers who will seek employment when the labour market
recovers.
The expected trend in the unemployment rate would see the actual numbers unemployed fall from an
average of about 310,000 in 2012 to 270,000 in 2015. Although the share of all unemployment that is long
term may rise further from its current level of approximately 60%, the numbers of long term unemployed
should fall slightly, from about 185,000 in 2012 towards 170,000 on average in 2015.
Based on recent relationships between unemployment and the Live Register, these trends would see an
average Live Register figure of 380,000 in 2015 (as compared with a likely out-turn of 436,000 for 2012).
The numbers on the Live Register for a year or more are likely to average about 180,000 in 2015.
Even in these circumstances, it is worth bearing in mind that employment opportunities for jobseekers will
arise as a result of job turnover as firms look to replace workers who leave due to retirement, maternity leave
etc. Indeed, the flow of new job opportunities has already risen significantly from the depressed level seen in
2009 and, as employment stabilises and starts to increase, it is likely to rise further, from the level of
230,000 in 2011 towards the annual level of 250,000+ seen in the earlier part of the last decade.
The occupational pattern of these emerging opportunities will reflect sectoral developments in employment
as the economy moves back to a “normal” structure after the boom-bust cycle of recent years. One
characterisation of such a normal structure is that given in the most recent ESRI medium term forecasts for
2015 (although the date by which this restored medium-term equilibrium can expect to be reached is now
likely to be some years later than that). The implications of this sectoral structure for occupational change
were explored in a FÁS/ESRI manpower forecasting study13.
Because movement back towards “normality” will involve an increased role for domestic demand and for
construction, this will imply that some of the largest increases in employment in the recovery are likely to
come in the building, clerical and sales occupations that have been most affected by the recession. This
should reinforce the predominance of these types of occupation in inflows to employment, as shown in
Table 1 earlier, for 2011.
The anticipated growth in employment in some occupations, particularly those related to construction, will
of course be from a relatively depressed base. Given the numbers looking for work, competition for these
job opportunities will continue to be intense.
13
J. Behan and C. Shally, Occupational Employment Forecasts 2015, February 2010.

23
Conclusion
After several years of decline, employment appears to be stabilising, and is now expected to grow
moderately over the next few years. Unemployment has already stabilised, albeit at a high level and due in
part to a reduction in the labour force arising from migration and falling participation. Current forecasts are
for unemployment to fall somewhat over the next few years, but to remain relatively high by recent
historical standards. Long-term unemployment also seems likely to remain stubbornly high.
Even in the downturn, there has been a continuing flow of job opportunities arising in the economy. This
flow has already recovered substantially from the depressed levels seen in 2009, and can be expected to
increase further as overall employment growth resumes. A large proportion of the opportunities that arise
each year are in the kinds of jobs for which most of the unemployed are reasonably qualified – routine
service jobs and skilled and unskilled manual jobs.
Ensuring that as many as possible of these jobs are taken up by unemployed people – particularly those from
the Live Register – is a major overarching objective of the Department’s (and broader Government’s)
activation policies. The development of these policies is reviewed in Chapter 2.

24
Chapter 2: Activation in the Department of Social Protection
Introduction
This chapter aims to outline the past and present activation policies pursued by the Department of Social
Protection (DSP) and examine future plans in this area. The national employment action plan (NEAP)
introduced in September 1998 has been the primary strategy pursued by the Department in recent years. This
strategy was preventative in nature and referred unemployed people to FÁS on reaching specified duration
thresholds on the live register. The plan provided for a systematic engagement with FÁS employment
services for guidance and job-search advice, and for possible referral to a range of training, employment
scheme and education opportunities.
National Employment Action Plan
Under NEAP all persons between the ages of 18 and 65 years who are approaching 3 months on the Live
Register14
are identified by the DSP and referred to Employment Services15
for interview with the aim of
assisting them to enter/re-enter the labour market. The process is a key element in addressing the
progression needs of those on the Live Register.
Up to late 2010, all customers were referred on an individual basis by DSP to FÁS for one-to-one
interviews. Under a new initiative, aimed at increasing the capacity and the efficiency of the process, some
jobseekers are now being referred to group engagement sessions. At the engagement presentations are given
that provide relevant information and advice and arrange follow-on individual appointments where
appropriate. In 2012, approximately half of all referrals were made initially to group engagement.
Analysis of NEAP activity
Table 2.1 outlines the amount of people referred and interviewed under the NEAP from 2005 to2011.16
14
This duration threshold has changed over time – see Appendix 2.1 to this chapter 15
Until 31st
December 2011, the employment service formed part of FÁS; from January 2012 the service was integrated into the Department of Social Protection 16
This table is taken from year-end NEAP reports, and relates only to persons referred for the first time in the year concerned and to their interviewed/non-interviewed status as at January of the following year. It therefore understates the overall volume of activity involved. In 2011, for example, when repeat referrals are taken into account, the total number of referrals was just over 121,000 and the number of initial interviews was 80,000.

25
Table 2.1 – Referrals and interviews NEAP 2005- 2011
Year 2005 2006 2007 2008 2009 2010 2011
Numbers referred under NEAP 40,718 37,959 51,452 60,260 86,782 87,011 81,898
% increase/decrease -22% -7% 26% 15% 31% neg. -6%
Numbers Interviewed 28,714 25,186 32,124 40,933 65,600 65,633 65446
% increase/decrease -18% -12% 27% 27% 60% neg. neg.
Number interviewed as % of referrals 71% 66% 62% 68% 76% 75% 80%
The number of persons referred under the NEAP, after falling initially between 2005 and 2006, has risen
steadily since 2007 with a 31% increase in 2009. The initial increase in 2007 reflected the reduction in the
threshold for referral from 6 months to 3 months as from December 2006; the increase in 2009 over 2008
reflected the sharp deterioration in labour market conditions in that year.
There are various reasons why people referred do not avail of the services on offer. They may be able to
access employment or other opportunities by their own efforts or by using self-service facilities available in
employment service offices. Some of those selected for referral may have already have signed off or be
about to sign off by the time they get the notification of referral. Some may not be able to participate
because of deeper problems, for example basic literacy or numeracy, or because they lack the confidence to
accept an offer.
In fact, the numbers interviewed follow a broadly similar, but not identical pattern to the trend in numbers
referred. The number interviewed as a percentage of referral has fluctuated over the time period ranging
from a low of 62% to a high of 79%. These variations have been affected by changes in the referral
thresholds as well as by labour market conditions. For example, in 2007, with referral taking place at three
months (rather than at 6 months as in 2006) increased failure to attend for interview in part reflected the
higher exit rates typical for people earlier in the unemployment spell. By contrast, the sharp increase in
attendance through 2008 and 2009 reflected the deterioration in labour market conditions and a resulting
decline in exit rates at or around the three month referral threshold.
If people do not attend for interview, or subsequently decline offers of training or other assistance, their
cases are referred back to the DSP local office for review to determine if they continue to satisfy the
conditions for receipt of unemployment payments. There is a statutory obligation on recipients of
jobseeker’s payments to be available for and genuinely seeking full-time employment. Persons, who, for
valid reasons, are unable to avail of the opportunities for placement in employment, training or education

26
provided, continue to receive payment. In such cases, the Department can assist them in identifying barriers
to participation and exploring alternative progression routes.
Further analysis of the NEAP process is outlined in table 2.2. The percentage of referrals exiting the Live
Register has varied somewhat over the time period. Initially, the percentage increased in 2007 -- probably
reflecting the reduction in the threshold for referral from 6 months to 3 months as from December 2006. The
exit rate fell sharply in 2008 – reflecting the significant increase in inflows to unemployment in the second
half of that year as labour market conditions deteriorated.
Table 2.2 – Analysis of NEAP referrals
Year 2005 2006 2007 2008 2009 2010 2011
No.’s Referred 40718 37959 51452 60260 86782 87011 81898
Total exits from LR 24282 22280 32359 33919 53638 55193 53334
Total exits as % of referrals
60% 59% 63% 56% 62% 63% 65%
Exits to :
Employment 27% 21% 14% 16% 16%
FÁS/Education 8% 8% 13% 14% 14%
Other17 19% 18% 24% 20% 18%
Unknown 10% 9% 11% 13% 16%
Finally, although the exit rate rose somewhat through 2009 and 2010, this primarily reflected increased
provision of education and training opportunities rather than increased flows into employment.
Performance of NEAP
The most recent evaluation of the impact of NEAP was carried out by the ESRI, based on data for 2006-
2008, and the results have been reported in two separate publications.18
The research results indicate that, relative to a control group with no intervention, unemployed individuals
that were exposed to the interview letter and participated in job search assistance (JSA) were 16 per cent less
likely to have exited to employment prior to 12 months. It was found that the initial referral letter itself had
the standard effect of accelerating exits from the Live Register; the negative impact of intervention
effectively doubled when this influence of the referral letter was removed from the data. The authors
conclude that the research “highlights the need for effective monitoring and sanctions as integral
components of labour market activation programmes”.
17
The 18% figure for “other” in 2011 is made up of “not entitled” (8%), “did not sign” (5%), “moved to other benefits” (2%) and “gone abroad” (2%). 18
Activation in Ireland: An Evaluation of the National Employment Action Plan, ESRI Research Series 20, May 2011, and Carrots without Sticks: The Impacts of Job Search Assistance in a Regime with Minimal Monitoring and Sanctions,ESRI Working Paper 409, September 2011.

27
These results related to persons who, while included in the referral process, had not gone on to participate in
FÁS training. Where people had progressed to training, this was found to have positive effects on
employment outcomes. These varied by training type, with short job-search focussed courses, and longer
high-skill courses having the greatest impact; shorter courses focused on lower-skill occupations or
imparting generic skills were found to have lower or insignificant effects. Overall, the positive impact of
training for those involved was found not to out-weigh the negative effect of the initial referral process
itself; thus outcomes for the group undergoing training were broadly in line with those for the control group.
Other Activation Initiatives The National Development Plan (NDP) 2007 -2013 provided for a Social and Economic Participation
Programme involving an investment of €50m in a new initiative by the DSP.
The main element of the activation sub-programme was to expand the Department's facilitator service, to
cover all parts of the State, with each facilitator having a defined work programme. Facilitators were asked
to provide additional, more intensive assistance, for those that needed it including people who had been
identified by FÁS Employment Services as needing further support. They worked with social welfare
recipients to identify appropriate training or development programmes which enhanced the skills that the
individual had, and ultimately improved their employment chances, as well as helping them to continue to
develop personally. The facilitator programme was designed to be a targeted approach, involving active case
management and the development of an individualised personal progression plan.
The programme provided for under the NDP commenced in September 2008, with provision for the
appointment of an additional thirty facilitators, giving a total of 74. As part of the roll out of Intreo the role
of facilitators has been revised and they are now classified as case officers. Currently there are 59 such
officers working at local level nationwide of which 45 are dealing with targeted activation caseload. Further
positions are vacant as a result of various reasons including retirements.
The original aims of the Activation Programme included -
Facilitate progression regardless of the circumstances that led a person to require income
maintenance
Active case management focused on progression potential
Structured referral, regardless of contingency, to include people with a disability, lone parents,
unemployed and adult dependants
Because of the large increases in the Live Register since 2008, Government further decided that support,
across all labour market measures, should be prioritised for four cohorts of the unemployed. These are –

28
people with low skills or education levels
people who are on the Live Register for long periods
people who are under 35 years of age
people who were previously employed in sectors that have been most affected by restructuring and
where recovery to near previous levels is not in prospect in the short to medium term (mainly
construction, manufacturing and wholesale/retail trade)
From September 2008 to December 2011 case officers dealt with over 64,300 cases under the activation
programme. These cases were selected from the Department’s customer database by the Employment
Support section in Carrick-on-Shannon. Currently, approximately 40 cases are issued from Carrick-on-
Shannon monthly to each case officer.
Table 2.3 – Case Officer cases under Activation Programme
Year Number of cases issued
Number of officers available
2008 3,187 40
2009 20,405 62
2010 19,053 66
2011 20,756 64
Systematic reporting of outcomes of Activation cases has not been present since the start of this process in
2008 and it was hoped that this would be remedied by the roll-out of the Case Management system that was
commenced in late 2009. This, however, has been delayed and is only currently operational in Dublin North
and South. As cases continue to be sent out a 'manual', Access-based, system has been established since
these delays were signalled that can track cases that were sent against ISTS outcomes.
Current developments in Activation policy Under changes in ministerial responsibility announced in 2010, the Rural Social Scheme (RSS) and
community services programmes have transferred to DSP from the former Department of Community, Rural
and Gaeltacht Affairs. The transfer of both the Employment and Community Services divisions of FÁS to
DSP has been completed in 2012.
The transfer of functions is intended to facilitate the delivery of a more targeted, effective and streamlined
response to the needs of the unemployed. Bringing together, under the aegis of one department, the
employment services of FÁS, the expertise of its Placement Officers and the income support services of
DSP as well as the Community Employment Schemes, Job Initiative Scheme, Community Services
Programme and the RSS should offer significant opportunities to generate synergies, improve efficiency

29
and, ultimately, improve service delivery to those availing of those services. In particular, a more integrated
and focussed case management approach is being developed, facilitating a more coherent treatment of
individual unemployed claimants in terms of income support, job search guidance and assistance, and
referral and access to training and employment support programmes.
An initial step has been taken through the introduction of profiling of newly-unemployed claimants to
identify those at risk of becoming long-term unemployed at an early stage.19
This will form the basis for
early intervention of this group for job-search assistance and possible programme referral (as opposed to the
time-based approach to selection for referral under NEAP). Profiling data have been collected on all new
claimants in a number of local offices since mid 2011, and this has been rolled out to all offices by
September 2012.
A new IT system has been designed to replace the existing NEAP selection and referral system. It includes
the facility to schedule individual or group appointments with Employment Services, the Local Employment
Service etc, and is more flexible than the previous system. Trials of the system began in Dún Laoghaire
Social Welfare Local Office at the end of February 2011. The system is now live in nine offices and is due
to be deployed to a further six Intreo offices by end of 2012.
As noted earlier, initial referral to group engagement sessions has been introduced to increase the capacity
and efficiency of the process. An evaluation of the Group Engagement process was completed in June 2011.
Findings indicate that Group Engagement (GE) has resulted in:
A greater level of awareness among customers of their obligations as jobseekers and of the
supports available to them.
The maximisation of interview capacity with over 90% attendance rates at the follow-on one-to-
one interview with the Employment Services Officer, resulting in a much more efficient use of
the ‘slots’ available for referral under the NEAP.
Customers attending those one-to-one interviews were better informed and the interviews were
more focused on their needs.
A more integrated approach to jobseeking customers on the part of the DSP and FÁS.
The potential for referral of increased numbers of jobseekers in the initial period of
unemployment under the NEAP
Referral to group engagement is being rolled out to cover 95% of all appropriate DSP offices during 2012.
19
Based on a statistical profiling model for Ireland developed by the ESRI and outlined in National Profiling of the Unemployed in Ireland, ESRI Research Series No. 10, September 2009. The model uses a range of weighted characteristics such as education, employment experience etc, to generate an estimate (Probability of Exit from the Live Register – PEX ) of the likelihood of a newly unemployed person exiting from unemployment within one year. A Person with a low PEX is identified as being more likely to remain unemployed for long periods.

30
Reduced rates were provided for in the Social Welfare Act 2010, to increase the range of sanctions available
to ensure compliance with the activation process, and encourage jobseekers to engage in actions aimed at
improving their prospects of entry into sustainable employment on a long-term basis.
The reduced rates, which apply to personal jobseeker’s payments, may be implemented where a jobseeker:
i) refuses an appropriate offer of training by an officer of DSP;
ii) refuses, or declines to avail of, an offer of training from FÁS;
iii) declines an intervention under the NEAP-Intreo;
iv) does not attend NEAP-Intreo meetings with a case officer
v) drops out of the NEAP-Intreo process.
Non-attendees are being systematically followed up by DSP which has resulted in some signing off the Live
Register, some claims being disallowed and reduced rates of payment being imposed where there is non-
attendance at a second intervention (be it GE, individual meeting, training course etc).
Future Activation Policy in the National Employment and Entitlements Service
The purpose of activation policy will be to ensure the engagement of the Department of Social Protection
with customers of working age, who are in receipt of specified social welfare payments/benefits in order to
support them and their families in progressing into employment and/or other appropriate progression.
In accepting payment of benefit, assistance and/or support, the customer shall agree to meet the relevant job-
search and availability for work conditions, and avail him or herself of the appropriate support measures
offered during the course of the activation process, including employment, education, training and/or
placement in employment schemes. The activation process complements the control process of the
Department of Social Protection. The payment of benefit will be linked to, and dependent upon,
participation in the activation process.
A detailed project plan for the establishment of the National Employment and Entitlements Service (NEES)
was approved by Government in July 2011. The name was subsequently changed to Intreo - The new
integrated employment and support service in October 2012.
Intreo is a new service model for the DSP. It will integrate the payment of benefits with the provision of
employment support services and will develop a case management approach to client service.
Key characteristics of the new service are:
1. Integrated Services/One-stop-shop.
2. Case Management/Client Profiling

31
3. Rights and Responsibilities
4. Engagement with Employers.
5. Strong links with education/training sector.
6. Control of Fraud
1: Integrated Services/One-stop-shop.
Service integration is designed to streamline processes for clients. Full transfer of FÁS and CWS staff into
DSP was completed on 1 January 2012. To date, four fully integrated offices [Arklow, Parnell, Sligo and
Tallaght] are in place with a further 6 due by end-2012. 2013 implementation and rollout planning is well
underway. .
2: Case Management/Client Profiling
Under the ‘case management’ model all relevant client information (education, training, skills, employment
experience etc.) will be compiled to create a profile of each individual. This profile will inform the
development of a personalised ‘pathways to employment’ progression plan that becomes the focus of the
engagement between the client and Intreo
Case management systems already in use in DSP are informing the development of an integrated system for
Intreo which will bring together the work of the various elements of the service (e.g. employment support,
payments, control, etc) and put the customer at the centre of all activities.
The approach to activation will be tailored based on the results of the client profiling system. The diagram
below sets out how the intensity of support will vary depending on the claimant’s likelihood of remaining
unemployed.
Self Low
Low High
High
Intensity of Support
Job Search
Reference to development
Directive Guidance

32
An activation model has been developed that comprises the following elements:
Case officers [former FÁS Employment Services Officers, former DSP Jobs Facilitators and, in some
offices, a Community Welfare Officer] operate in a team-based structure along with a support team.
These are responsible for;
o Scheduling of Group Engagement sessions based on the client’s profile;
o Follow-on guidance interview [one-to-one] with a case officer where the personal
progression plan is agreed and signed up to by the client – the timing of this interview
depends on the client’s Probability of Exit (PEX);
o Ongoing appointments/activation reviews are systematically in place over a 12-month period
with a case officer and/or the support team to monitor progression towards employment,
training and education – again, the frequency of these appointments will depend on the
client’s profile;
o After 12 months, various levels of activation follow-up by the support team [depending on
the client’s profile and based on the agreed personal progression plan]; and
o Assessment of the level of engagement by the client and, where deemed to be unacceptable,
recourse to a penalty rate of payment or suspension of payment.
3: Rights and Responsibilities
As part of the Intreo approach clients will be expected to accept that along with their right to a payment,
comes a responsibility to seek to overcome their dependency on this payment. Failure to engage in the
progression plan will lead to a reduction, and potentially a withdrawal’ of payments. Legislative authority to
reduce the value of payments in the case of clients who do not participate in the activation process was
enacted in the Social Welfare (Misc Provisions) Act 2010. A Record of Mutual Commitments is also being
put in place that emphasises this dual approach and reinforces the concept of rights and responsibilities.
4: Engagement with Employers.
As part of Intreo DSP will work to establish and manage strong, commercially based, relations with
employers and private sector recruitment agencies. In doing this it will seek to build on existing examples of
close co-operation,

33
5: Strong links with education/training sector.
The service will develop and establish strong links with the further education sector through the new further
education and skills authority - SOLAS. At a corporate level a formal service level framework agreement,
including an operating protocol, will be concluded before the end of the year providing for the Intreo to have
input into the identification and selection of courses to be offered and setting out the terms and conditions
under which its clients can access these courses.
6: Control of Fraud
The minimisation of fraud and error in the social welfare system will continue to be a key focus of the DSP
and will be an integral part of the Intreo approach. The client interviews that form part of the case
management approach will provide an opportunity to assess the client for risk of fraud. This will
complement the on-going work of inspection staff and the Special Investigation Unit.
Pathways to Work
The Government’s activation strategy has been restated most recently in Pathways to Work: Government
Policy Statement on Labour Market Activation. The overarching objective of the strategy is “to maximise
the number of ... new jobs which will be filled by the unemployed”. “Pathways” identifies five major
“strands” or processes that will underpin the strategy:-
More regular and on-going engagement with the unemployed
The aim is that every individual on the Live Register will have deeper and more regular engagement with
Intreo according to their needs, and that they will be offered job search assistance with appropriate
education, training or work experience opportunity to increase their employability and keep them close to
the labour market.
Greater targeting of activation places and opportunities
The Government will invest in a high level of education, training, job placement and work experience places, with a
large percentage of these focused on the unemployed. It is intended to target these resources to maximise the
efficiency and effectiveness of the programmes with a view to delivering a greater focus on keeping the unemployed
close to the labour market.
Incentivising the take-up of opportunities
The Government will ensure that the social protection system incentivises rather than blocks the return to
work for unemployed people, including those with families, through ongoing reform of the system.

34
Incentivising employers to provide more jobs for people who are unemployed
The Government has introduced a range of reforms and incentives to support protect and create jobs,
including through the Jobs Initiative in May 2011 and the ‘Action Plan for Jobs’ in February 2012. A
particular priority is to ensure that employment opportunities go to people currently on the Live Register,
interalia through reform of the Employer Job (PRSI) Incentive Scheme. It is also intended to develop and
improve existing employer services to encourage greater use of these services by employers and to
maximise the flow-through from public sector training and support programmes to full time employment.
Reforming institutions to deliver better services to the unemployed
Intreo as described earlier represents the new service model for DSP. The Department is also examining the
potential of contracting with the private sector as a means of complementing its own resources where
required to deliver service and build up/access new skills and competencies in areas such as case
management of clients, employer engagement and job-matching/placement.
Conclusion
Activation policy has evolved over time, and is now clearly focused on maximising the share of new
employment opportunities that are taken up by unemployed people. Implementation of the policy is through
a complex of processes, broadly comprising:
a) design and control activities in relation to jobseeker’s payments (e.g. earnings disregards that permit
recipients to engage in some paid employment;)
b) deeper engagement with claimants in relation to job-search and referral to training and development
(including the introduction of penalty rates for persons who do not engage),
c) provision and targeting of employment and training scheme places, and
d) more active involvement with employers to maximise the flow-through of job-seeker clients to full
time employment.
The programmes and schemes covered by this review form one part of this overall policy process; their
contribution is particularly relevant to elements b) and c) of the policy mix. The main objective of the
review is to attempt to assess this contribution; this assessment is contained in the next chapter.
35
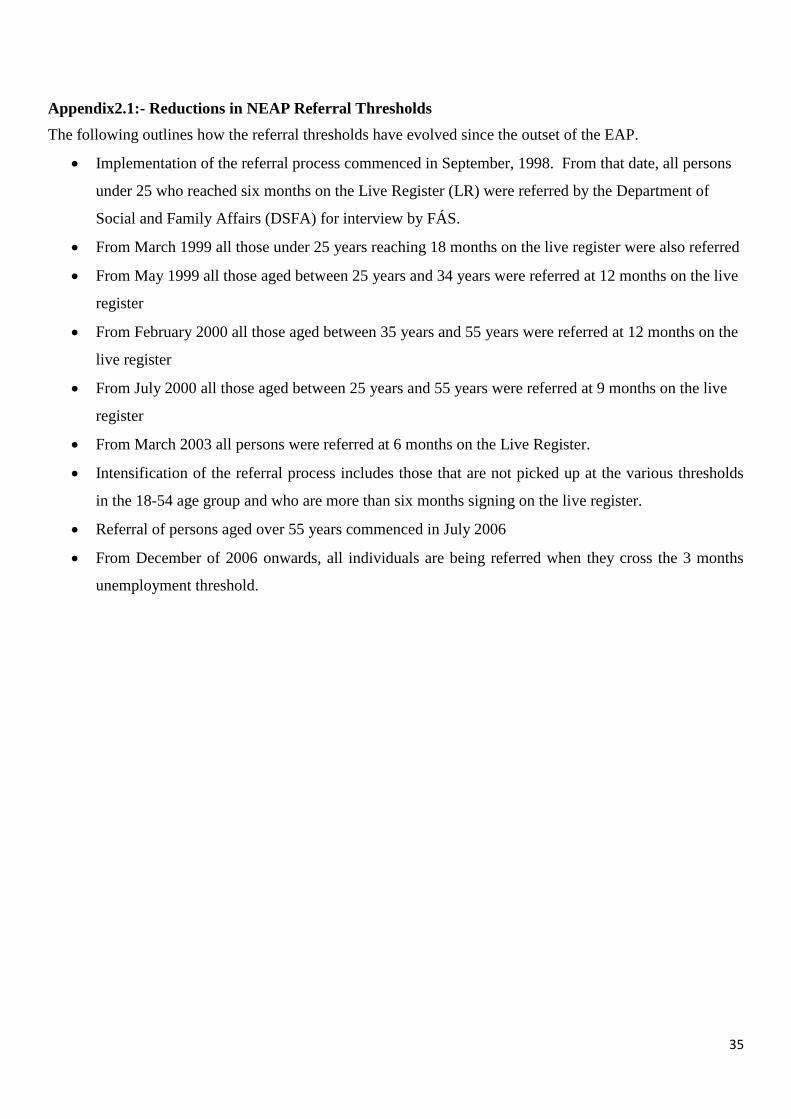
Appendix2.1:- Reductions in NEAP Referral Thresholds
The following outlines how the referral thresholds have evolved since the outset of the EAP.
Implementation of the referral process commenced in September, 1998. From that date, all persons
under 25 who reached six months on the Live Register (LR) were referred by the Department of
Social and Family Affairs (DSFA) for interview by FÁS.
From March 1999 all those under 25 years reaching 18 months on the live register were also referred
From May 1999 all those aged between 25 years and 34 years were referred at 12 months on the live
register
From February 2000 all those aged between 35 years and 55 years were referred at 12 months on the
live register
From July 2000 all those aged between 25 years and 55 years were referred at 9 months on the live
register
From March 2003 all persons were referred at 6 months on the Live Register.
Intensification of the referral process includes those that are not picked up at the various thresholds
in the 18-54 age group and who are more than six months signing on the live register.
Referral of persons aged over 55 years commenced in July 2006
From December of 2006 onwards, all individuals are being referred when they cross the 3 months
unemployment threshold.

36
Chapter 3 - Activation review of individual schemes
Criteria for assessment The main objective of this review is to attempt to assess the contribution of a range of schemes to the
overarching objectives of activation policy. This requires identification of the criteria to be used for this
assessment, across what is a diverse range of schemes.
Given the positioning of the schemes in the context of the evolving activation policy mix, as set out in the
conclusions to Chapter 2, it is possible to identify a number of critical elements of any individual scheme
from an activation perspective:-
Eligibility conditions – is the scheme targeted narrowly on particular priority groups (e.g. based on
background, receipt of particular payments, or on duration of unemployment)? Do these target
groups coincide with the likely main target groups under the DSP’s emerging profiling/case
management approach?
Geographic distribution of opportunities – do they match the distribution of unemployment/other
indicators of need?
Recruitment process – are participants self-selecting/selected solely by project sponsors, or is
recruitment restricted by systematic referral by ES/DSP with follow-up and feedback as to what
happened to those referred?
Relationship of DSP to the projects – is it hands-on, for example, in terms of monitoring participants’
experience and encouraging continuing job-search?
Pay rates and conditions – how these compare with other welfare/income supports and/or wages; do
they create barriers or incentives to move off the programme into regular employment?
Duration of participation that is allowed/encouraged on the scheme – does this involve taking people
away from the active labour market for extended periods?
Performance – where data is available, how many are supported by the scheme and what numbers
become independent of the social welfare system following participation on a scheme?
The remainder of this Chapter examines each of the schemes by reference to these criteria. For the purposes
of analysis, the schemes are grouped into four types – temporary work programmes, internship programmes,
education/ training programmes and programmes promoting self-employment. Table 3.1 below outlines the
estimated expenditure and numbers supported for each group and individual scheme.

37
Table 3.1 – 2012 estimated numbers & expenditure all activation schemes
Strand Programmes 2012 Estimated costs where
available €,000m20
2012 estimated numbers supported
Average participation
New opportunities provided/clients assisted (est.)
Work Programmes
Community Employment 315,194 24,000 11,000
Rural Social Scheme 45,660 2,500 200
Tús Community Work Placement Scheme
84,000 3,800 5,000
Job Initiative 27,156 1,200 0
Part Time Job Initiative 990 200 n.a.
473,000 approx 31,700 approx 16,000
Internships
National Internship Scheme JobBridge
65,780 5,000 8,000
Work Placement Programme - 200 400
65,780 5,200 8,400
Education & Training
Back to Education Allowance 183,021 26,000 11,500
Part Time Education Option - -
Education Training and Development Option
- -
Activation and Family Support Programme
6,380 n.a 8,500
Technical Assistance and Training Scheme
4,500 n.a 7,000
Technical Employment Support Grant
3,200 n.a 9,500
197,101 approx 26,000 approx 36,800
Self Employment Supports
Back To Work Enterprise Allowance & Short Term Enterprise Allowance
137,940 12,000 6,000
Credit Union Loan Guarantee Scheme
20 0 -
137,960 approx 12,000 approx 6,000
TOTAL 873,841 75,000 67,000
20
Estimated expenditure for each scheme is based on published REV figures. Expenditure on individual schemes may vary within the context of the overall budget of the Department.
38
A. Work Programmes
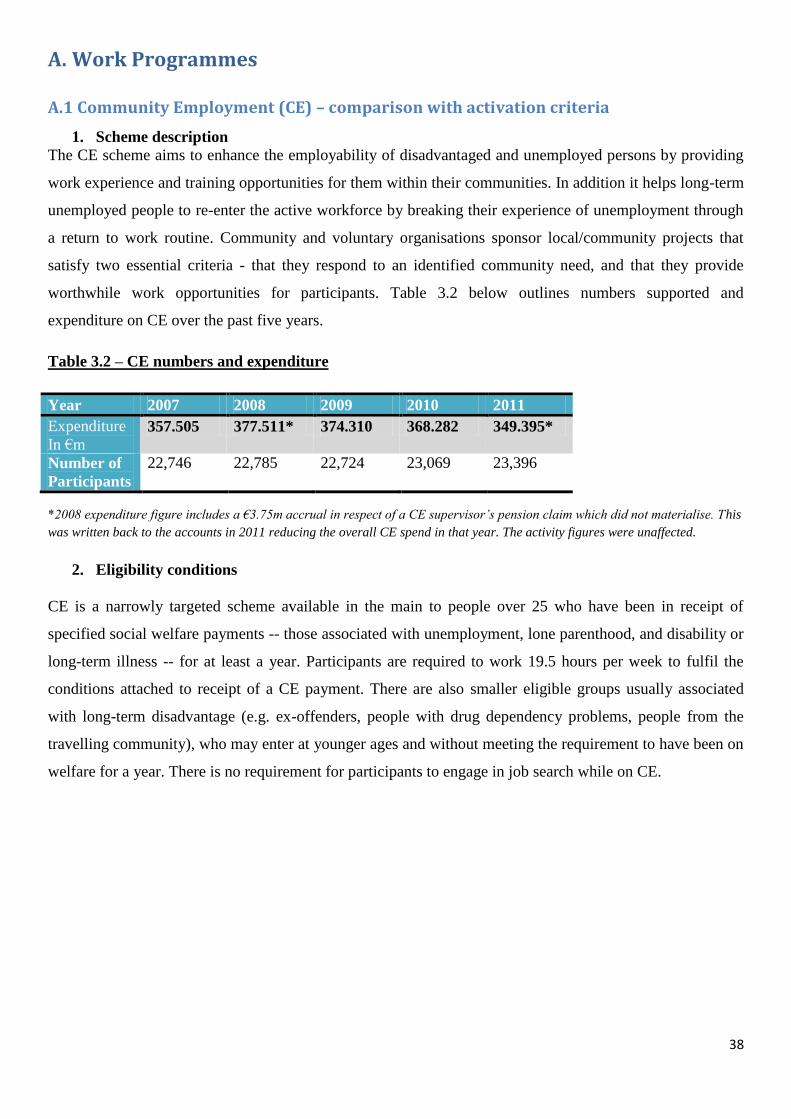
A.1 Community Employment (CE) – comparison with activation criteria
1. Scheme description
The CE scheme aims to enhance the employability of disadvantaged and unemployed persons by providing
work experience and training opportunities for them within their communities. In addition it helps long-term
unemployed people to re-enter the active workforce by breaking their experience of unemployment through
a return to work routine. Community and voluntary organisations sponsor local/community projects that
satisfy two essential criteria - that they respond to an identified community need, and that they provide
worthwhile work opportunities for participants. Table 3.2 below outlines numbers supported and
expenditure on CE over the past five years.
Table 3.2 – CE numbers and expenditure
Year 2007 2008 2009 2010 2011
Expenditure
In €m
357.505 377.511* 374.310 368.282 349.395*
Number of
Participants
22,746 22,785 22,724 23,069 23,396
*2008 expenditure figure includes a €3.75m accrual in respect of a CE supervisor’s pension claim which did not materialise. This
was written back to the accounts in 2011 reducing the overall CE spend in that year. The activity figures were unaffected.
2. Eligibility conditions
CE is a narrowly targeted scheme available in the main to people over 25 who have been in receipt of
specified social welfare payments -- those associated with unemployment, lone parenthood, and disability or
long-term illness -- for at least a year. Participants are required to work 19.5 hours per week to fulfil the
conditions attached to receipt of a CE payment. There are also smaller eligible groups usually associated
with long-term disadvantage (e.g. ex-offenders, people with drug dependency problems, people from the
travelling community), who may enter at younger ages and without meeting the requirement to have been on
welfare for a year. There is no requirement for participants to engage in job search while on CE.

39
3. Geographic distribution of opportunities
Although CE places are widely distributed across the country, there are regional variations in the availability
of places. The greatest concentration is in the West, with 62 places per 1,000 unemployed as measured by
the Live Register. There are more than 55 per 1,000 in three further regions (Dublin, Mid West and North
West), approximately 50 per 1,000 in the South West and South East, and approximately 40 per 1,000 in the
North East and Midlands.
4. Recruitment process
A person can obtain information on a place on a CE project either directly from the relevant project or
through DSP Employment Services, and then applies directly to the sponsor. Selection is thus voluntary and
participants are self-selecting. The sponsor, as an employer, makes an independent decision on whether a
person may participate on a scheme, subject to confirmation of the person’s eligibility by the Employment
Service office.
5. Relationship of DSP to the projects participants
Project Sponsors manage the day-to-day implementation of CE and the supervision of participants on behalf
of the Department. The ratio of participants to supervisor position is on average 15:1 across all CE schemes.
Responsibility for promoting training and development of participants, based on Individual Learner Plans
(ILPs), and their subsequent progression, rests with supervisors on individual CE projects. While there is no
requirement for participants to engage in active job search while on CE, provision is made for the agreement
of an exit plan for each participant at the latest two months before the end of his/her period on the scheme,
and for provision of additional work experience outside the project. The actual extent of job-search support
is felt to be variable across projects.
6. Pay rates and conditions
The minimum payment a participant on CE will receive is €208 per week. Participants entering the scheme
on reduced rate payments are maxed up to the current weekly €188 personal rate of Jobseeker’s Allowance
(JA) plus a top up of €20. If the prior welfare payment actually received by the participant was greater than
€188, which may be for reasons such as allowances paid for adult or child dependants, the CE rate is this
higher payment plus €20. Depending on the number of participants managed and their point on the scale
grant towards wages and employers PRSI ranging from €522.71 to €855.54 are provided for CE supervisors.
Up to Budget 2012, persons previously receiving lone parents or disability payments could also retain their
welfare payment while on CE. This has now been discontinued for new entrants. Existing participants
previously receiving lone parents’ payments, while continuing to retain those payments, are now also paid
only the standard CE weekly rate of €208.

40
For a single person, the basic CE payment represents about 68% of net earnings from a full time job at the
national minimum wage. Given that CE is part-time (19.5 hours per week), and may be combined with other
part-time work, this suggests there are limited financial incentives for participants to move on to low-paid
full time employment.
7. Duration of participation
Permitted participation on CE ranges from 1 year to 7 years for different groups of participants. Duration is
determined by length of time on a welfare allowance combined with age. For participants aged under 35,
duration is set at one year with an optional second year in certain limited circumstances. Applicants between
35 and 54 years have eligibility for CE for 3 years with an extra year for persons on disability allowances.
On the other hand applicants that are 55 years or older can remain on CE for a period of up to 6 years. If that
applicant is on a disability related payment, they can remain for a further year.
Actual average duration of stay on the programme is approximately 2 years for those from the
unemployment and lone parenthood streams, and over 3 years for those from the disability stream. Duration
of stay has risen slightly during the recession – from an estimated 1.7 years in 2007 to 2.0 years in 2011.
8. Performance
As of the end of October 2012, 22,554 persons (including 1,380 supervisors) were engaged on CE schemes.
The share of entrants from an unemployment background, which had fallen as low as 36% by 2008, rose to
57% in 2011; the share of lone parents fell from 30% to 26% and that of people on disability payments from
19% to 10%. The share of those from the disability stream in the stock of participants is higher (17%)
because they tend to spend longer than average on the scheme.
Over a quarter of participants are 55 years of age or older; fully half are aged over 45. Age varies across the
eligibility streams. Among those from the unemployment payment stream, almost 60% are aged over 45,
and only 16% are aged less than 35 years. In the disability payment stream almost 70% are aged over 45.
Lone parents, by contrast, are relatively younger; 40% of them are aged less than 35, and a further 30% are
aged 35-44. Those from the smaller disadvantaged groups are predominantly (75%) aged less than 35 years.
Almost 60% of those starting on CE in 2011 had education qualifications below Leaving Certificate. CE
participants have significantly lower levels of education than does the labour force overall (where 25% have
less than Leaving Cert) or the generality of unemployed people (40%).
For those leaving the scheme, progression rates have been broadly in line with those from FÁS training
programmes; (participation on CE is of course far more resource intensive and of longer duration than a
typical short training course; on the other hand, CE participants have been unemployed for much longer, on
average, prior to joining the scheme).
41
Training is widespread, with up to 60% of participants receiving some certified training; this is subject to
approval and monitoring by DSP.
CE- Conclusions
CE has become a multifaceted programme that aims to satisfy a range of objectives relating to activation of
those participating and delivering much needed community services. There can be tension between these
objectives. The Department’s priority in terms of activation, is having access to a scheme that can provide
referrals with good quality work experience, coupled with training as required which can assist in making its
client’s job ready, while implementation bodies may prioritise ensuring consistent service delivery. The
activation element should remain the priority for the Department in its efforts to further its agenda in this
area.
In terms of its activation objectives, CE has the advantage of reaching a relatively targeted client group by
virtue of the eligibility conditions – particularly the requirement that participants must have been in receipt
of welfare for a year or more prior to entry. This of itself has led the programme to focus on older workers
and those with relatively low levels of education and training.
However, the role of the DSP in recruitment to the scheme is insufficiently active, which reduces the
capacity to identify and refer clients for whom participation would be particularly useful based on their
record of engagement with the Department. In addition, the average duration of participation has risen
gradually over time and greatly exceeds the duration of one year originally envisaged for this type of
programme. This longer duration reduces the number of opportunities that can be offered on the scheme
with any given level of resources; it also runs the risk of participants becoming ‘institutionalised’ on the
scheme itself rather than being encouraged to progress.
CE – recommendations
The following recommendations are made to build on and further develop the contribution CE can make to
the Department’s activation priorities. These recommendations reflect the recommendations made in the
recently published ‘Community Employment Financial Review’. A link to this review is displayed
underneath.
https://www.welfare.ie/en/Pages/Community-Employment-Financial-Review-of-Schemes.aspx
1. Recruitment to the scheme should be mediated and directed, based on referral from DSP
Employment Services only.
2. Duration of participation for new entrants should be limited to one year for participants from the
unemployed and lone parent streams, to two years for those from the disability stream, and to three
years for those entering based on drug dependency.

42
3. For those generally limited to one year, there should as at present be an option for a second year if
they are participating in learning that leads to a qualification at the end of the 2 year period.
4. Eligibility for participation should continue to focus on those who have been receiving payments for
a year or more. As case management evolves for those with shorter unemployment durations but at
high risk of becoming long-term, eligibility could be extended to this group under limited
circumstances.
5. There needs to be a greater focus on ensuring job-search and progression planning for participants
well in advance of their scheduled exit from CE. Work in this area (and outcomes for leavers)
already forms part of the key performance indicators in contracts with projects, but the quality of
implementation is variable across projects. Its importance should be further highlighted and it should
be incorporated more formally in decisions on the extension/renewal of project contracts.
It is recognised that, in addition to its objectives for participants, CE has become important over time in its
role of supporting the delivery of a range of community, sporting, care and other services. While the changes
now being proposed may pose challenges for projects in terms of service delivery over time, if case
managers are consistent in referring suitable clients to meet service delivery demand to projects committed
to the activation agenda this challenge should be minimised. It is reasonable to think both strands are not
mutually exclusive and that a person benefiting from training and work experience and a general positive
experience would in turn be associated with providing quality delivery of services.
However, if this were to become a major difficulty it might be addressed by either:-
re-focusing into two strands (an activation and a service strand) within the scheme itself for
individual projects, with the service strand existing outside the Departments suite of activation
schemes, or
(as suggested by the Department of Public Expenditure and Reform) a move towards lead core
funding of all community projects by the public agency responsible for the relevant kind of service
delivery, with CE supporting only part – generally a minority – of staff in any individual
organisation/project.21
21
Comprehensive Review of Expenditure 2011, CEEU Cross-Cutting Paper No.1, Rationalising Multiple Sources of Funding to Not-for-Profit Sector
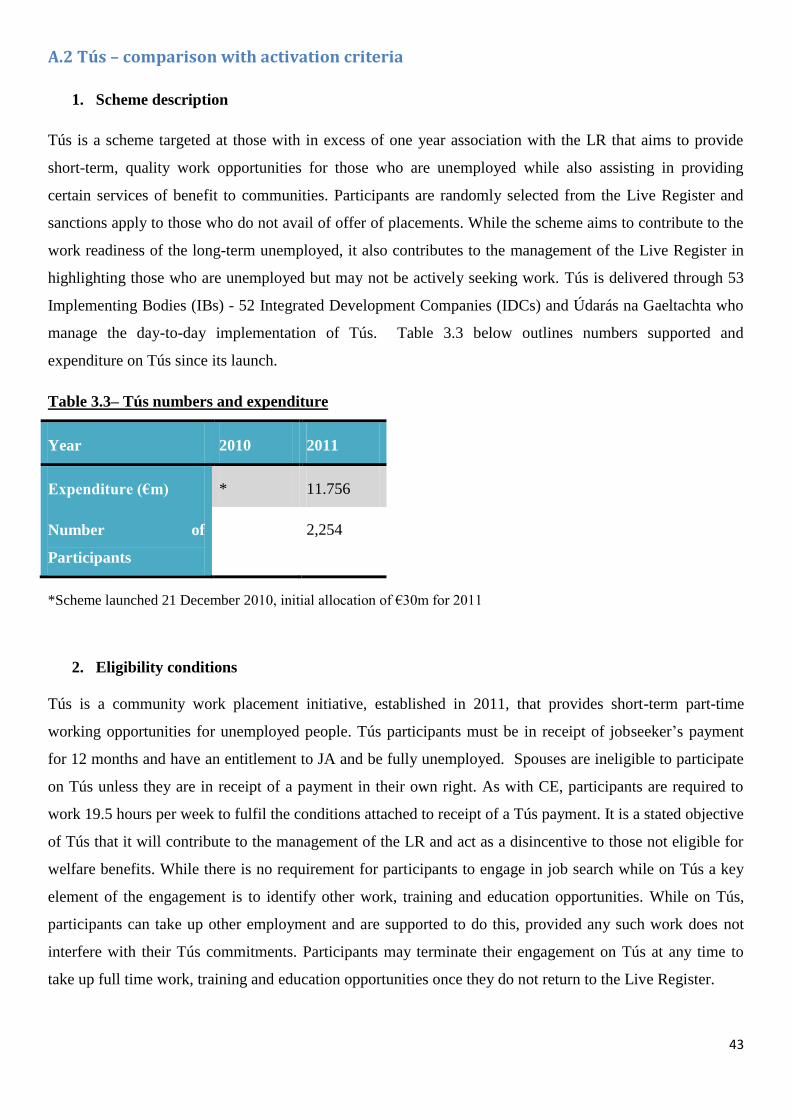
43
A.2 Tús – comparison with activation criteria
1. Scheme description
Tús is a scheme targeted at those with in excess of one year association with the LR that aims to provide
short-term, quality work opportunities for those who are unemployed while also assisting in providing
certain services of benefit to communities. Participants are randomly selected from the Live Register and
sanctions apply to those who do not avail of offer of placements. While the scheme aims to contribute to the
work readiness of the long-term unemployed, it also contributes to the management of the Live Register in
highlighting those who are unemployed but may not be actively seeking work. Tús is delivered through 53
Implementing Bodies (IBs) - 52 Integrated Development Companies (IDCs) and Údarás na Gaeltachta who
manage the day-to-day implementation of Tús. Table 3.3 below outlines numbers supported and
expenditure on Tús since its launch.
Table 3.3– Tús numbers and expenditure
Year 2010 2011
Expenditure (€m) * 11.756
Number of
Participants
2,254
*Scheme launched 21 December 2010, initial allocation of €30m for 2011
2. Eligibility conditions
Tús is a community work placement initiative, established in 2011, that provides short-term part-time
working opportunities for unemployed people. Tús participants must be in receipt of jobseeker’s payment
for 12 months and have an entitlement to JA and be fully unemployed. Spouses are ineligible to participate
on Tús unless they are in receipt of a payment in their own right. As with CE, participants are required to
work 19.5 hours per week to fulfil the conditions attached to receipt of a Tús payment. It is a stated objective
of Tús that it will contribute to the management of the LR and act as a disincentive to those not eligible for
welfare benefits. While there is no requirement for participants to engage in job search while on Tús a key
element of the engagement is to identify other work, training and education opportunities. While on Tús,
participants can take up other employment and are supported to do this, provided any such work does not
interfere with their Tús commitments. Participants may terminate their engagement on Tús at any time to
take up full time work, training and education opportunities once they do not return to the Live Register.

44
3. Geographic distribution of opportunities
The allocation of places on Tús is based on the national distribution, by county, of those meeting the criteria
of over one year unemployed and in receipt of Job Seekers Allowance on 6 December 2010.
4. Recruitment process
Participants falling within the eligibility criteria are selected randomly for participation. The Department
then contacts the potential participants offering them the opportunity to be considered for local employment
as opportunities arise.22
Participants on Tús are therefore chosen and referred by the Department as opposed
to the self-selection nature of many of the Department’s other schemes.
Those who respond to this initial invitation but elect not to participate are interviewed by the local/branch
office and can be excused on the basis of personal circumstances, age, disability/illness, valid offers of work
or training or in limited cases, childcare responsibilities or where participating in Tús would reduce the
family’s net income. Those who do not respond have their payments suspended and are required to attend
the local/branch office to validate the requirement to be genuinely seeking work, to offer a valid excuse or to
agree to have their details referred to the relevant Implementing Body (IB).
5. Relationship of DSP to the projects/participants
IBs manage the day-to-day implementation of Tús and the supervision of participants on behalf of the
Department. The ratio of participants to supervisor position is 20:1. IBs are responsible for identifying
suitable work placements and community groups in their respective geographical locations and are
responsible for advertising, evaluating and selecting work opportunities.
Organisations with a proposed work placement register with the IB in their area. They are then asked to
submit a proposal detailing the work that is proposed to be undertaken and the number of participants
requested. The IB then assesses the proposal and makes a decision on it. Each IB receives a fee for the
delivery of Tús based on the number of participants it has been allocated. Tús does not provide for
exit/progression planning.
In addition, the unavoidable costs of insurance and supervision are also met by the Department, with
additional resources to meet compliance costs in respect of essential training and health and safety
equipment and consumables. Separately, IBs are provided with financial resources to offset the costs of
equipment, inputs, fuels, consumable and essential materials for the delivery of services on its own account
or in community setting where the opportunity to generate local resources are limited.
22
With a view to ensuring that a sufficient number of participants will emerge from the referral process to match the opportunities, the number of initial invitations offered is set at three times the envisaged number of places in each locality.

45
6. Pay rates and conditions
As of September 2012, following from initial findings of this review the payment arrangements attached to Tús
were altered to bring them in line with CE. For new entrants the minimum payment a participant on Tús will now
receive is €208 per week. Participants entering the scheme on reduced rate payments are maxed up to the current
weekly €188 personal rate of JA plus a top up of €20. If the prior JA payment actually received by the participant
was greater than €188, which may be for reasons such as allowances paid for adult or child dependants, the Tús
rate is this higher payment plus €20. Supervisors are paid at a rate of €594.20 per week or €31,005.51 per year.
Prior to September 2012, participants, even those previously in receipt of means reduced rates, received the
maximum rate inclusive, where relevant, of the full qualified adult and child dependant payments. This treatment
differed from CE where as noted earlier, payment is set at the participant’s prior actual DSP payment plus €20,
subject to a minimum of €208. This led to a situation where a person with similar circumstances could receive a
much higher payment if they engaged with Tús as opposed to CE. Given the inequality discovered the
Department moved to implement similar payment arrangements to CE once notified of the anomaly.
As a result, almost 30% of Tús participants received increases of more than €20 over their prior welfare
payment; for 10% of participants the increase is greater than €150. These cases arise where the participant has
significant means – often related to spousal earnings.
7. Duration of participation
Participation is for one year only. Participants are encouraged to remain on Tús for this period unless they
receive an offer of full time employment. In cases where an individual exits Tús for reasons other than full-
time employment, there are provisions for penalising them via a temporary disqualification of their JA
payment.
A participant cannot subsequently re-participate on Tús for a minimum of 3 years.
8. Performance
Funding has been provided for 5,000 placements with the majority of capacity being filled by July 2012.
Male participants account for 74% of the total with 26% female. Over 65% of the total Tús cohort falls
within the 25-49 age brackets, with fewer than 4% aged 60 or over. A further 18.5% are aged 50-59. With
12% of participants being aged under 25 years, the age profile of Tús participants is rather younger than that
of job-seeker eligibility CE participants. As of the end of October 2012 there were 4,491 participants and
245 supervisors engaged on Tús programmes.

46
The Department has commissioned the delivery of a tracking system which is made available to each IB and
will track each prospective participant and activity undertaken with respect to all engagement, placement,
activation or other support that might be provided. It will also track outcomes post engagement with Tús.
This system was rolled out nationally in July 2012 and is expected to be fully populated, including historic
data, by the end of November 2012. The first exits arising from completion of the 12 month engagement in
any significant number from Tús are not expected until late 2012.
Data in respect of the level of co-operation with Tús is also being collated. Initial indications suggest that
around 80% of those randomly selected and offered an opportunity agreed to be considered for a work
placement. Of the remaining cohort randomly selected, feedback from DSP Divisions indicate these divide
50/50 into those unable to take up a work placement offer due to engagement in other activation activity,
education, age, illness or caring responsibilities and those who did not respond or were un-cooperative.
In all cases, local/branch offices may suspend the Job Seekers’ payments pending satisfactory explanations
being provided or move the customer to a more appropriate payment, particularly where health related
factors are identified. Where a claimant offers a valid explanation for not being able to take up the offer of a
placement, local office staff have the flexibility to reinstate the claim, excuse the individual or require the
individual to participate or close their Job Seekers’ claim. Detailed statistics have not been compiled to date
on the outcome or the numbers to which suspension of Job Seekers’ payments was imposed or the nature of
other penalties administered.
Some three-quarters of all persons contacted indicated a willingness to be considered for Tús and these were
referred to the IBs for skill profiling, interview, placement in suitable work positions or referral to other
activation measures. Very low levels of non-cooperation or non-engagement with the IBs have been
reported. However, data in respect of this is limited and final conclusions cannot be drawn until further data
has been collected and verified. Indications from the IBs suggest significant engagement by the prospective
participant with the processes underpinning Tús.
Tús – Conclusions
It is as yet too early to form firm conclusions as to the effectiveness of Tús. It has been in existence for only
a short time, and only reached its capacity of 5,000 placements in mid 2012, numbers have fallen slightly to
October 2012; the first exits from the programme will begin only in the autumn. From an activation
perspective, the scheme already incorporates some of the recommendations made earlier on CE – e.g. in
relation to DSP’s active role in recruitment and to duration of participation on the scheme. Provision for
training and for the agreement of exit plans is however less developed than on CE. Early experience has also
identified clients who put themselves forward for Tús placements but are not chosen by IBs. This cohort

47
may feel they have not had a positive experience engaging with the Department and may become
demotivated.
Tús – recommendations
This review of experience does suggest a number of recommendations for improvements to the scheme:-
There should be a greater focus on ensuring job-search and progression planning for participants well
in advance of their scheduled exit from Tús. At a minimum, Tús would benefit from adoption of the
approach on CE where there is provision for the agreement of an exit plan for each participant at the
latest two months before the end of his/her period on the scheme.
Given the limitation on places in each area, it is possible that some of those referred to IBs and found
suitable will not obtain a placement; procedures should be developed to allow for speedy referral of
these people to alternative supports for progression to employment.
It is essential that the proposed tracking system for the scheme should be fully implemented as soon
as possible. It should include the capability to report at national level on the outcomes at each
separate stage of the processes involved in Tús, including
o The initial DSP invitation to participate, the responses received, and how these are followed
up
o Referral to IBs of those who agree to participate, feedback from IBs on referral outcomes,
and how this is followed up
o Outcomes for participants post Tús.
As has been recommended for CE, as case management evolves for those with shorter
unemployment durations but at high risk of becoming long-term, eligibility for Tús could be
extended to this group under limited circumstances.
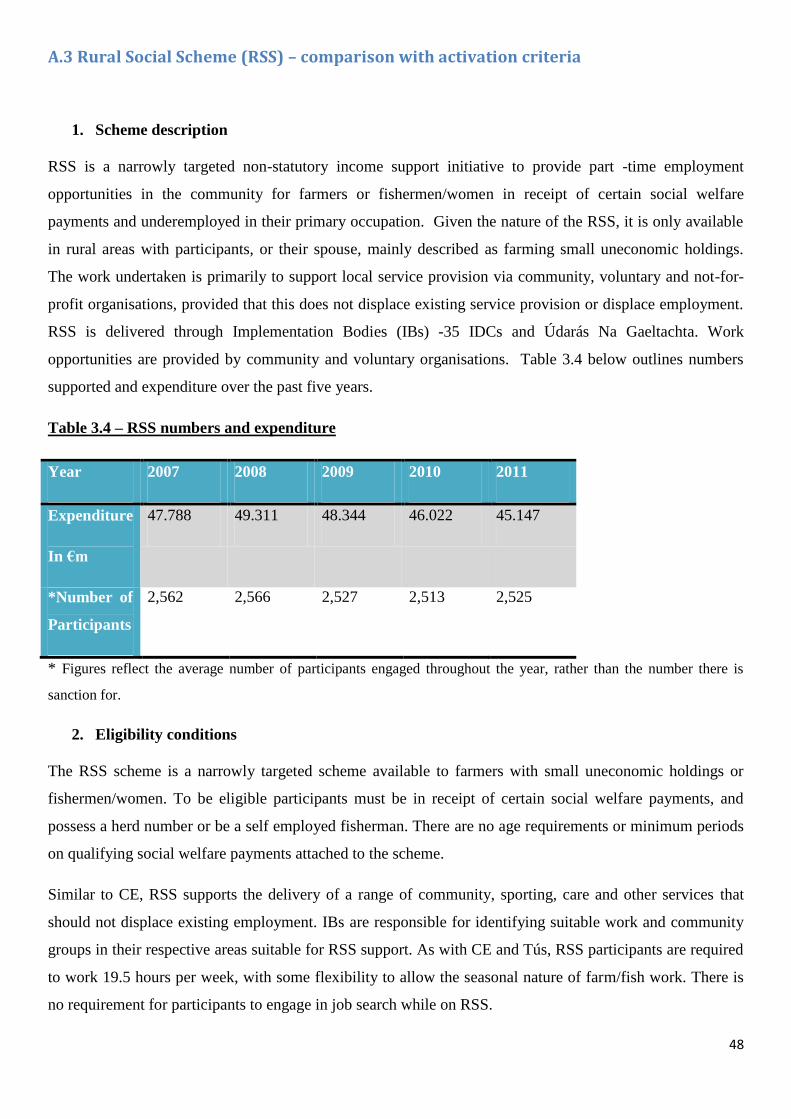
48
A.3 Rural Social Scheme (RSS) – comparison with activation criteria
1. Scheme description
RSS is a narrowly targeted non-statutory income support initiative to provide part -time employment
opportunities in the community for farmers or fishermen/women in receipt of certain social welfare
payments and underemployed in their primary occupation. Given the nature of the RSS, it is only available
in rural areas with participants, or their spouse, mainly described as farming small uneconomic holdings.
The work undertaken is primarily to support local service provision via community, voluntary and not-for-
profit organisations, provided that this does not displace existing service provision or displace employment.
RSS is delivered through Implementation Bodies (IBs) -35 IDCs and Údarás Na Gaeltachta. Work
opportunities are provided by community and voluntary organisations. Table 3.4 below outlines numbers
supported and expenditure over the past five years.
Table 3.4 – RSS numbers and expenditure
Year 2007 2008 2009 2010 2011
Expenditure
In €m
47.788 49.311 48.344 46.022 45.147
*Number of
Participants
2,562 2,566 2,527 2,513 2,525
* Figures reflect the average number of participants engaged throughout the year, rather than the number there is
sanction for.
2. Eligibility conditions
The RSS scheme is a narrowly targeted scheme available to farmers with small uneconomic holdings or
fishermen/women. To be eligible participants must be in receipt of certain social welfare payments, and
possess a herd number or be a self employed fisherman. There are no age requirements or minimum periods
on qualifying social welfare payments attached to the scheme.
Similar to CE, RSS supports the delivery of a range of community, sporting, care and other services that
should not displace existing employment. IBs are responsible for identifying suitable work and community
groups in their respective areas suitable for RSS support. As with CE and Tús, RSS participants are required
to work 19.5 hours per week, with some flexibility to allow the seasonal nature of farm/fish work. There is
no requirement for participants to engage in job search while on RSS.
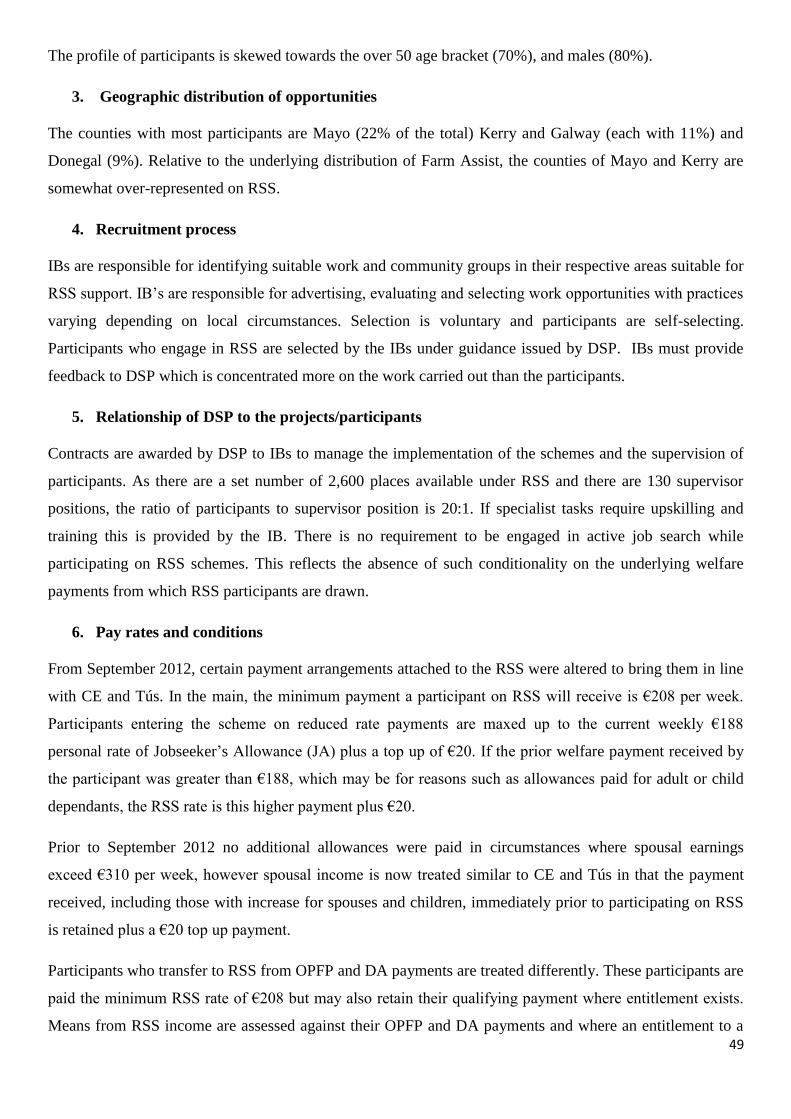
49
The profile of participants is skewed towards the over 50 age bracket (70%), and males (80%).
3. Geographic distribution of opportunities
The counties with most participants are Mayo (22% of the total) Kerry and Galway (each with 11%) and
Donegal (9%). Relative to the underlying distribution of Farm Assist, the counties of Mayo and Kerry are
somewhat over-represented on RSS.
4. Recruitment process
IBs are responsible for identifying suitable work and community groups in their respective areas suitable for
RSS support. IB’s are responsible for advertising, evaluating and selecting work opportunities with practices
varying depending on local circumstances. Selection is voluntary and participants are self-selecting.
Participants who engage in RSS are selected by the IBs under guidance issued by DSP. IBs must provide
feedback to DSP which is concentrated more on the work carried out than the participants.
5. Relationship of DSP to the projects/participants
Contracts are awarded by DSP to IBs to manage the implementation of the schemes and the supervision of
participants. As there are a set number of 2,600 places available under RSS and there are 130 supervisor
positions, the ratio of participants to supervisor position is 20:1. If specialist tasks require upskilling and
training this is provided by the IB. There is no requirement to be engaged in active job search while
participating on RSS schemes. This reflects the absence of such conditionality on the underlying welfare
payments from which RSS participants are drawn.
6. Pay rates and conditions
From September 2012, certain payment arrangements attached to the RSS were altered to bring them in line
with CE and Tús. In the main, the minimum payment a participant on RSS will receive is €208 per week.
Participants entering the scheme on reduced rate payments are maxed up to the current weekly €188
personal rate of Jobseeker’s Allowance (JA) plus a top up of €20. If the prior welfare payment received by
the participant was greater than €188, which may be for reasons such as allowances paid for adult or child
dependants, the RSS rate is this higher payment plus €20.
Prior to September 2012 no additional allowances were paid in circumstances where spousal earnings
exceed €310 per week, however spousal income is now treated similar to CE and Tús in that the payment
received, including those with increase for spouses and children, immediately prior to participating on RSS
is retained plus a €20 top up payment.
Participants who transfer to RSS from OPFP and DA payments are treated differently. These participants are
paid the minimum RSS rate of €208 but may also retain their qualifying payment where entitlement exists.
Means from RSS income are assessed against their OPFP and DA payments and where an entitlement to a
50
means reduced payments exists, this is paid with additional allowances such as increases for qualified adults
or dependent children. This situation where a participant may receive their welfare payments in addition to
the work programme payment is at odds with other DSP work programmes.
Supervisors are paid at a rate of €594.20 per week. Participants must notify their IB if circumstances which
could affect their rate of payment changes while engaged with RSS. Participants may also retain secondary
benefits while engaged in RSS.
7. Duration of participation
As there is no specified duration once eligibility criteria are satisfied there is little or no incentive to move
off the scheme.
8. Performance
As of the end of October 2012 there were 2,597 participants and 130 supervisors engaged with RSS. Over
70% of participants are 5 years or more participating on the scheme and there is relatively low turnover of
about 5% each year. The turnover is mainly attributed to participants reaching the maximum (retirement)
age as opposed to exiting due to employment. The objectives of providing income support to low income
farmers and fishermen/women and the provision of services to rural communities would appear to take
priority over access to training in order to enhance the prospects of returning to employment.
Rural Social Scheme – conclusions
The role and impact of RSS reflects the structure of the underlying welfare payments that apply to the client
group it serves. As the latter have no labour market-related conditionality, the activation role of RSS is
inevitably limited. Rather than being designed to promote progression to further open market employment,
the scheme allows participants to work part-time indefinitely on community projects for an amount
somewhat in excess of their underlying welfare entitlement. As there is no limit to the duration and
participation is by self selection the scheme is of little relevance to the Department in developing future
activation policy or accommodating commitments made in Pathways to Work.
RSS simply serves a purpose in providing services in rural Ireland which are carried out by DSP clients
while retaining their social welfare payment.
Rural Social Scheme – recommendations
In these circumstances it is difficult to identify ways in which RSS could take on a greater activation role.
In the short term the situation where persons previously receiving lone parents or disability payments may
also retain their welfare payment while on RSS should be addressed in line with changes introduced to the
CE scheme in Budget 2012.

51
Eligibility to RSS should be restricted to those engaged in farming and on Farm Assist or actively farming
and in receipt of a Jobseeker’s payment. Given the nature of RSS and its life long duration and relationship
to income support for underemployed farmers, it would be appropriate in current circumstances to restrict
eligibility.
If the scheme is to continue unchanged, there is a need to decide if it is best suited to DSP or should be
moved to a Department or body that is engaged with the development of rural and community services. The
number of places associated with the scheme should not, in any case, be counted as activation places by
DSP.
52
A.4 Job Initiative (JI) – comparison with activation criteria
1. Scheme description
The Job Initiative is a programme that initially provided three years full-time employment for people who –
on entry to the scheme – were 35 years of age or over, unemployed for 5 years or more, and in receipt of
social welfare payments over that period. Further entry to the scheme was suspended in 2004, when those
already on the programme were given the right to remain on the scheme indefinitely. Table 3.5 below
outlines numbers supported and expenditure over the past five years.
Table 3.5 – Job Initiative numbers and expenditure
Year 2007 2008 2009 2010 2011
Expenditure
In €m
40.065 37.734 36.411 30.223 29.678
Number of
Participants
1,608 1,519 1,433 1,349 1,281
2. Eligibility conditions
The Job Initiative (JI) scheme was launched in 1996 and was intended to provide full-time employment for a
fixed-term period of three years to persons who had been long-term unemployed. In November 2004 the
Minister for Enterprise, Trade and Employment decided to allow those already on the programme to remain
until retirement age. Further recruitment onto the scheme was also halted from that date.
3. Geographic distribution of opportunities
JI is heavily concentrated in the Dublin and Mid-West regions – in each case with over 5 places per 1,000 on
the Live Register at the end of 2011. There are relatively few places in the South East, South West, West
and Midlands.
4. Recruitment process
As noted above, recruitment onto the scheme was halted from November 2004.
5. Relationship of DSP to the projects/participants
Managing Agents and participants now view the programme as real jobs. In addition the Department does
not set any targets for progression, including to employment. Positions are therefore viewed as permanent
positions.

53
6. Pay rates and conditions
The grant per participant place is currently set at €433.33 per week, of which a maximum of 4% can be
allocated to administration and overheads, including training. The minimum weekly payment to the
participant is thus €416 – twice the CE rate.
7. Duration of participation
Given the ministerial decision of November 2004, participation is indefinite subject to a maximum age limit
– participants must leave the scheme on reaching age 66.
Actual turnover is minimal – 48 people or about 4% of the total left the scheme in 2011 – and relates
primarily to retirement or death.
8. Performance
As outlined recruitment to the scheme has ceased since November 2004 and existing participants may
remain on the scheme indefinitely. Participation has fallen steadily as some participants leave and are not
replaced. There were 1,256 participants (on 66 projects) at the end of 2011, down from 1,700 participants in
2006. About 70% of participants originally came from jobseeker’s payments, and almost all of the
remainder had lone parents’ entitlements. Males and females are equally represented among participants.
Virtually all participants are aged over 45, with close to half being aged 55 and over.
JI – Conclusions
Given the structure of the scheme, and the fact that it has been closed for some time to new recruitment, JI
does not contribute to the Department’s activation policies.
JI – recommendations
Current policy is to let JI wind down naturally, with no new recruitment and a steady flow of retirements,
and there is little option but to continue with this approach.
(Now that responsibility for the scheme rests with DSP consideration might be given to the option of closing
the scheme; however, any such consideration would have to recognise the existence of Ministerial
guarantees and the fact that, as these employments are now considered permanent there would be significant
IR/ HR implications).
Falling numbers have made, and will continue to make, some individual projects unviable, and to date this
has been addressed by promoting the amalgamation of projects. Consideration should be also given to
recognising JI as being purely support for service delivery, with no active labour market component. In that
case, JI schemes might be amalgamated, on a local basis, with projects now funded under the Community

54
Services Programme. Alternatively, if the recommendations above in terms of the service delivery
component of CE were followed, this too would provide opportunities for rationalisation of JI projects.
A.5 General conclusions and recommendation on Work Programmes
The preceding sections have given separate consideration to each of the work programmes. They also need
to be considered in their totality and in terms of their relationship to each other and to the overall scale of
active labour market policy interventions.
Work programmes like these are common as activation interventions across countries in times of high
unemployment. While international evaluation studies of direct job-creation programmes have generally
been disappointing, the OECD has concluded that public sector job creation schemes can provide a useful,
temporary backstop to activation regimes in a recession for the hard-to-place unemployed, particularly if it is
deep and long.23
According to OECD, “the research suggests these programmes can avoid the “hard to
place” becoming too disconnected from the labour market. However, in order to be effective, any such
schemes must be temporary and should not become a disguised form of subsidised permanent employment”.
More recently, the OECD24
has pointed out that reliance on temporary employment schemes has been
relatively high in Ireland as compared with other countries; that post-programme outcomes remain
disappointing; and that such schemes “should be used as a last resort activation tool”.
23
Grubb, D., S. Singh and P. Tergeist. (2009). Activation Policies in Ireland, OECD Social,Employment and Migration Working Papers No. 75 (08‐January‐2009 24
Economic Review of Ireland 2011

55
While there is no evident “correct” level at which
the scale of temporary employment measures
should be set, it is clear that OECD views the
current level in Ireland as being too high. The
recommendations for reform to individual
programmes in this review are designed to
address some of the scheme-design
characteristics of which the OECD has been
critical. Moreover, long-term unemployment has
risen further since the most recent OECD review
of Ireland in 2011, and seems likely to remain at
an elevated level for some time, as noted in
Chapter 1; this could be seen to strengthen the
case for selective expansion of temporary
employment. Even with the proposed reforms,
however, it would appear to be desirable, as the
economy recovers and unemployment starts to
fall, to reduce the scale of these programmes
relative to other active labour market
interventions.
In the shorter term, the recommendations for CE
and Tús will, if implemented, lead to closer
alignment of the design of these two schemes. In
these circumstances, early consideration should
be given to full amalgamation of the two
schemes.
NESC views on work programmes
The criteria adopted in assessing the activation role of
these work programmes are consistent with the views
expressed on direct employment programmes by the
National Economic and Social Council in section 8.3.1 of its
2011 report on Supports and Services for Unemployed
Jobseekers.
The Council was of the view that projects whose principal
raison d’etre is the temporary employment they provide
“could make a significant contribution to interrupting
otherwise long unemployment spells for a large number of
those now unemployed”. However, concerns that needed
to be addressed in relation to such schemes included:
occupying unemployed people for long periods on
alternatives to preparing and competing for
employment in the mainstream economy may
ultimately reinforce their status as outsiders. This risk
could be further reduced by ensuring that recruitment
into direct employment projects did not ‘lock’
participants out of job-search or from taking steps to
prepare for new careers but, rather, that such efforts
increase as projects near completion
the capacity (in either the non-profit or the public
sector) to identify and deliver on a significant volume of
projects that would, simultaneously, deliver value for
money in enhancing infrastructural assets, and maintain
and enhance the skills of the individuals employed
temporary measures easily create producer interests
that lead to their indefinite retention as not primarily
labour market measures but subsidies for needed local
services
targeting direct employment programmes at the most socially disadvantaged may create a stigma around participation that damages participants’ future employment prospects (while not targeting means money is spent on some participants with less need than many non-participants).

56
B. Internship/Work Placement Programmes
B.1 JobBridge – comparison with activation criteria
1. Scheme Description
JobBridge is an internship scheme whereby host organisations offer internship opportunities of either six or
nine months’ for unemployed jobseekers. The scheme aims to provide those seeking employment with the
opportunity to gain valuable work experience, maintain close links with the labour market and to enhance
their skills and competencies through an internship opportunity, thereby improving their prospects of
securing employment in the future. It is aimed at assisting those seeking employment to successfully bridge
their transition into employment. Table 3.6 below outlines numbers supported and expenditure from the
launch of the programme to year end 2011.
Table 3.6 - JobBridge numbers and expenditure
Year 2011
Expenditure
In €m
€8.2 m
Number of
Participants
3,100
*JobBridge launched 1 July 2011; participant figure is participant stock as at end-December 2011
2. Eligibility conditions
JobBridge came into operation on 1st July 2011; it is an internship scheme whereby host organisations offer
internship opportunities of either six or nine months’ duration for unemployed jobseekers. In order to be
eligible to participate in JobBridge an individual must be currently in receipt of a live claim
(JA/JB/OPFP/DA or signing for social insurance contribution credits) for a total of three months or more in
the preceding six months.
3. Geographic distribution of opportunities
Although there are JobBridge placements in all parts of the country they are particularly heavily
concentrated in the Dublin region which accounts for 34% of all participants. The South East and South
West regions account for circa 13% each with the Midlands, Mid-West and West regions accounting for in
the region of 9% each. The North- East and North West regions represent the lowest take up which is in the
region of 6%. .

57
4. Recruitment process
Host organisations (HOs) complete an online application form to advertise placements which are then
advertised on the JobBridge and Jobs Ireland websites. Jobseekers apply directly to host organisations who
then recruit using their normal recruitment and selection processes. Final recruitment of the selected intern
under the scheme is subject to confirmation of the intern’s eligibility by the local DSP office.
Jobseekers may find information about internship opportunities at the JobBridge website, Jobs Ireland
website, and on WATIS machines in Employment Services offices. Employment service staff have also
been active in informing individual job seekers of opportunities relevant to them. Participants are,
nevertheless, primarily self-selecting rather than being systematically referred.
5. Relationship of DSP to the projects/participants
A standard agreement is signed by both the intern and the HO at the beginning of each placement. The
agreement outlines the rules of the scheme, identifies the intern’s mentor and includes a section that is
completed by the host organisation and agreed with the intern describing the work experience, skills
practice, learning opportunities, training etc. that will be provided for the intern during the internship.
Each month the HO is required to log on and update monthly compliance records to confirm that the intern
is attending and that the internship is being delivered in accordance with the standard agreement.
Interns are encouraged to engage in active job search while on an internship and are allocated time off to
attend job-seeking activities.
6. Pay rates and conditions
Participants retain their current social welfare payment and receive an additional Internship Allowance of
€50 per week for the duration of the internship.
For a single person receiving full rate JA25
, the internship payment represents about 77% of net earnings
from a full time job at the national minimum wage. The similar replacement rate for those on the two
reduced JA rates for younger people are 63% and 50% respectively.
7. Duration of participation
An internship can last for either six or nine months at the discretion of the host organisation, with duration
being set at the time of notification of the internship vacancy.
As the placement is in standard workplaces, it could be seen as bringing participants closer to rather than
removing them from the active labour market. The extent of early leaving – primarily to employment, and
25
Inclusive of the winter fuel allowance, averaged across the full year for the purpose of these calculations.

58
largely outside the host organisation – would suggest that participants are combining their periods on the
programme with continuing active job search.
8. Performance
In the region of 11,670 internships have commenced to date, with 5,262 participants on an internship at the
end of October 2012. About 27% of participants are aged under 25 years, 46% are aged 25-34 years, and
over a quarter of participants are aged over 35.
Although by its design JobBridge might be seen as targeted on the younger short-term unemployed,
particularly recent leavers from education, it has effectively reached significant numbers of older
unemployed people as well.
Indecon Economic Consultants completed the first part of an independent evaluation of the Scheme (5th
October 2012) which found that 52.3% of the 5,600 finisher’s to-date were now in paid employment. 29%
of which found employment with their host organisation and 23% found employment with another
organisation. A further 3.3% of finishers were employed on a short-term contract which had now ended.
In addition, a further 8% of finishers were pursuing further education. 33% of finishers had returned to job
search.
JobBridge – relationship with the WPP
The Work Placement Programme (WPP) preceded JobBridge, and has many similar features. Among the
principal differences between the two schemes,
WPP is open to recipients of certain additional welfare payments (lone parents, disability - Prior to
May 2012 JobBridge was restricted to jobseekers).
WPP provides only for retention of a participant’s prior welfare payment – there is no additional top
up allowance
Persons without any welfare entitlement could participate; these participants receive no payment
under WPP.
WPP has continued to operate since the establishment of JobBridge. However, the number of participants
has fallen from 1,800 in mid 2011 to 214 at end of September 2012, and numbers continue to fall as the
number of new entrants has been running at 40 or fewer each month. From the 28th
May 2012 it was
announced that OPFP and DA recipients will be eligible to participate on JobBridge. As a result, WPP will
be catering primarily for placements where the participant has no welfare entitlement or other cohorts that
are not eligible for JobBridge, and the number of new entrants will fall further – probably to single figures
each month.

59
JobBridge/WPP – Conclusions
Indecon consultants have just completed the first part of an independent evaluation of the JobBridge scheme
which is being considered by the Department. A link to this review is displayed underneath.
http://www.welfare.ie/en/Pages/Indecons-Interim-Evaluation-of-JobBridge.aspx
The report found that in excess of 50% of participants had secured employment and that both participants
and employers expressed a high level of satisfaction with the programme. The evaluation assessed the
design, delivery and impact of JobBridge on the unemployed. This evaluation should assist and inform
future policy decisions and direction of the scheme.
The launch of JobBridge with an additional allowance of €50 per week incentive attached has effectively
undermined the rationale for WPP.
JobBridge – Recommendations
An independent evaluation of JobBridge has just been completed and now must be considered by the
Department.
In the interim, it seems wasteful to continue running the parallel WPP scheme administration to cater for the
small numbers involved – which will now fall further as those on lone parents’ and disability payments are
eligible for JobBridge.
It is recommended that JobBridge should allow the registration of internships where the participant has no
previous welfare entitlement and therefore receives no payment under the scheme. Once this is done, WPP
can be closed to new entrants and the scheme can be closed down entirely in a matter of months.
(Consideration should be given to paying the €50 weekly JobBridge allowance to the small number of
participants without basic welfare payments).
As the profiling/case management approach is rolled out, referral to JobBridge opportunities should become
more systematic, with provision for feedback from host organisations on referral outcomes.

60
C. Programmes supporting participation in education/ training
C.1 Back to Education Allowance (BTEA) – comparison with activation criteria
1. Scheme background
The back to education allowance (BTEA) scheme is a broadly targeted non-statutory second chance
education opportunities scheme for eligible people on certain social welfare payments. A person wishing to
pursue BTEA will have to satisfy a number of conditions such as being a certain age, in receipt of a
prescribed social welfare payment for a specified time period, commencing the first year of a course,
pursuing a full time course of study leading to a recognised qualification in a recognised college and
progressing in the level of education held by the client with reference to the national framework of
qualifications among others. Table 3.7 below outlines numbers supported and expenditure over the past five
years.
Table 3.7- BTEA numbers and expenditure
Year* 2007 2008 2009 2010 2011
Expenditure
In €m
64.14 77.13 107.31 179.85 201.51
Number of
Participants
8,090 8,883 11,646 20,808 25,032
Note: Expenditure based on calendar year while participant numbers are based on academic year. E.g. there were 8,090
participants in the 2006/07 academic year.
2. Eligibility conditions
BTEA is targeted at recipients of jobseeker’s, one parent family and disability/illness related payments
wishing to pursue a full time course of study leading to a recognised qualification in a recognised college. In
general, recipients must have been in receipt of a qualifying payment for three months if entering second
level courses and nine months if entering third level courses. Once BTEA has been awarded, payment will
continue even where entitlement to the original qualifying payment no longer exists. A spouse of a person
receiving one of these payments may also qualify for BTEA even if they are not in receipt of a payment in
their own right. A person applying for BTEA must be aged 21 or over (with certain limited exceptions). The
applicant must be commencing the first year of a course which must also be at a higher level with reference
to the national framework of qualifications, than any qualification already held by the client.

61
3. Geographic distribution of opportunities
BTEA places are dispersed across the entire country. The regions with the highest representation in 2011/12
were the Dublin South region and the southern region, with 21% and 18% respectively. The border regions
have 17% representation and western regions have 14% while the midlands region is the lowest with only
5%. Regional BTEA representation is closely aligned with LR representation. At a more disaggregated
level, participation rates tend to be higher in counties outside Dublin with higher education institutions (e.g.
Sligo, Galway, and Donegal).
4. Recruitment process
Participants who satisfy the eligibility criteria and participate on BTEA are self selecting. While case
officers may assist in directing a person towards a particular course, there is no formal referral system.
A participant awarded BTEA will receive formal provisional approval from DSP. The participant must then
provide written confirmation from the relevant school/college stating that they are registered as a full-time
day student before payment of BTEA commences.
5. Relationship of DSP to the projects/participants
BTEA participants are exempt from active job search. While control exercises are carried out periodically to
ensure the participant is continuing to engage in full time study, there is no other monitoring of the
participant’s progress during the academic year. A form is issued to all awarded participants as the
academic year concludes to ascertain their intentions for the following academic year.
Details in relation to course type, qualification pursued, college etc are collected when applications are
approved, but entry of these into the national database is not uniform across regions. (The system set up to
record these details is dated and not user-friendly; it is not integrated with the ISTS payments system, and its
use is not therefore mandatory in order to approve a BTEA application). There is no requirement for people
to notify the Department of results attained on completion of a course for which they have been supported
under BTEA. These factors greatly curtail the ability to report on BTEA outputs and outcomes.
6. Pay rates and conditions
The minimum payment a participant on BTEA will receive is €188 per week. Participants entering the
scheme on reduced rate payments are maxed up to the current weekly €188 personal rate of their qualifying
social welfare payment. This applies to all participants, including those previously in receipt of means
reduced payments or of the reduced standard rates for younger claimants.26
If the prior welfare payment
actually received by the participant was greater than €188, which may be for reasons such as allowances
26
The standard JA rate for persons aged less than 22 years is now €100, and for people aged 22-24 inclusive it is €144.

62
paid for adult or child dependants, the higher rate is paid under BTEA. About 40%27
of those entering BTEA
in 2011 received increased payments relative to their prior jobseeker’s payments; for 27% of entrants the
increase was more than €50 per week, and for about 12% of entrants the increase was over €100 per week.
Once awarded BTEA, participants retain their maximum payment even in situations where the underlying
entitlement to the qualifying payment has ceased. Where the participant has qualified for BTEA while on
Jobseeker’s Benefit, the remaining entitlement to JB is “frozen” during the period on BTEA.
In addition to the weekly allowance, an annual €300 cost of education allowance is payable. Secondary
benefits may continue to be paid subject to satisfying the relevant conditions. Participants may also engage
in employment and self-employment without affecting their payment.
In most instances, BTEA is paid only during the academic year. However, participants previously in receipt
of One-Parent Family and illness related payments may retain their BTEA payment during the summer
period provided they are progressing to the next academic year.
Participants who qualified from jobseeker’s payments and cannot find employment are entitled to ‘sign on’
for summer periods and will receive a payment if an entitlement exists. Analysis of DSP data suggests that
in recent years the percentage of BTEA participants who return to the LR for the summer months has ranged
from a low of 60% to a high of over 80%.
7. Duration of participation
BTEA supports persons pursuing courses from second level up to higher level 8 in third-level education. A
participant may remain on BTEA for as long as s/he is progressing in approved courses of study. As there is
no requirement to re-qualify for BTEA a person could be supported via BTEA for a number of years where
no underlying entitlement to a primary payment exists. This is unusual, as in the main, participation on the
Department’s scheme is dependent on an underlying SW entitlement. Participants may also engage in
employment and self-employment without affecting their payment, no means test applies.
Average length of courses for second level courses is 1-2 years while third level courses are 3-4 years. A
person entering the BTEA system at second level could potentially be supported for up to 6 years.
Comparison of the stock of participants with inflows in 2010-11 indicates that the average actual duration of
participation on the second level option is 1.4 years (suggesting that approximately one third of participants
27
Further analysis of the 40% reveals - 16% received age related increases, 15% received increases due to ‘other’ reasons such as spousal swaps, previously in receipt of reduced JB and 9% received increases due to previously in receipt of means reduced payments.

63
take two-year courses). The average duration of participation on the third level option is 3 years. For those
who take both options in succession28
, therefore, average participation is 4.4 years.
8. Performance
In the 2011/12 academic year 25,700 people engaged with BTEA, 88% of whom originated from
unemployment payments, 8% from one parent families and the remaining 4% from illness related and carers
payments. Available data29
suggests that 49% of the participants were new entrants in that academic year,
while 51% were resuming courses under BTEA.
Some 61% of recipients pursued third level courses while 39% pursued courses described as being at second
level. Analysis of course type under the second level option suggests a large majority of these courses are in
fact Post Leaving Cert (PLC courses) undertaken in the further education sector. Just under 6% of the
second-level option group (or 2% of all BTEA participants) were pursuing courses at or below Leaving
Certificate level.
Almost 60% of participants were male and over 40% were female. The age profile of participants ranges
from 18 years to over 60 years old. Among those entering the programme in 2011, just under 15% were
aged less than 23 years old, 38% were aged 23-29 years old and 47% were aged 30 years and over.
Overall participation rates in BTEA for Irish and non-Irish people are similar. However, people from
EUAC12 countries represent 9.4% of the LR but only represent 5% of the jobseekers BTEA participants.
Conversely, non EU countries represent 3.1% of the LR but 8.2% of BTEA participants.
A final figure for the 2012/13 academic year is not yet available, as of the end of October 2012 there were
23,747 participants engaged with BTEA, over 91% originating from jobseeker’s payments, while 34% are
pursuing second level courses and 66% pursuing third level courses.
There is limited data on outcomes from BTEA but one possible way to analyse outcome is to track a
participant’s LR status post exit from BTEA. This is possible for those who initially qualified from
jobseeker’s payments and for some one parent family participants. Analysis of the relevant BTEA data on
those originating from Live Register payments indicates that 60% of those who completed or dropped out of
a course under BTEA at the end of the 2010-11 academic year had returned to the LR as at September 2012.
BTEA – Conclusions
As an activation programme, BTEA as currently designed can have the effect of ‘lock in’ for people, by
providing, in some cases after relatively short periods on the LR, for dependency on SW payments for long
28
Almost 1,500 people transferred from the second level option to the third level option under the scheme in 2011. This represents about one quarter of new entrants to the third level option. 29
These data are based on LR participants who accounted for 88% of all BTEA participants in the 2011/12 academic year.

64
periods of time where no job search is required. This dependency, as noted earlier, can continue beyond the
duration of underlying entitlement to the participant’s original jobseeker’s payment. The courses covered by
the scheme are provided on an academic year basis, rather than providing for intake across the year – which
would be more in line with the activation needs of unemployed people.
Access to BTEA is essentially by self-referral, rather than as part of any process where clients agree with
DSP that it is the most suitable intervention for them with a view to progressing towards employment. Such
a judgement/agreement could be based on the client’s circumstances and on actual and expected labour
market conditions (as identified, for example by the expert group on future skills needs).
The data suggests that return to the Live Register after completion of courses under BTEA is high – over
60% for those who completed or dropped out of a course at the end of the 2010-11 academic year.
The scheme also needs to be considered in terms of its interaction with other student supports.
The main other source of public income support for persons attending further and higher education is the
means-tested Department of Education and Skills (DES) student grant scheme. For a person with no means
and classified as non-adjacent i.e. lives more than 45km from the college being attended, the maximum
maintenance student grant is €3,025. The adjacent rate payable is €1,215.
A further special rate amount is available to certain cohorts who are in receipt of the maintenance element
of the student grant, and have reckonable income less than €22,703 which must include an eligible long term
payment prescribed under the scheme. When the addition of the special rate is considered the maximum
payment for non-adjacent eligible students could rise to €5,915 and the adjacent rate could rise to €2,375.
Based on a 36 week academic year, the higher rates are equivalent to €164 per week and €66 per week,
while the student grant exclusive of the special rate equates to €84 per week and €34 per week, respectively.
The Department of Education and Skills believe only 27% of eligible students receive the special rate and
this is spread across adjacent and non-adjacent eligible students. Grant recipients (other than mature
students) are excluded from job seekers’ payments during the summer months.
The standard payments under BTEA are therefore in the main, substantially in excess of the maximum rates
paid under the main student support scheme.
As BTEA expenditure has risen (from €64 million in 2007 to €199 million in 2011) it has grown in
significance relative to other forms of support. It is estimated, for example, that 6,400 people entered
undergraduate third-level studies with BTEA support in 2011; this represents about 16% of all entrants to
undergraduate studies. Somewhat over 20% of all participants on PLC courses are also being supported
under BTEA (as compared with 30%+ being supported under the student grant scheme.

65
Particularly for those at the younger end of the age distribution of participants, there is a risk that BTEA may
come to be seen as an alternative funding stream for traditional access to further and higher education
courses. This would involve substantial associated costs for the Exchequer as BTEA is relatively expensive
in comparison to other options such as the student grant system.
BTEA – recommendations
The conclusions reached above lead to a number of recommendations on BTEA;
While the 3 month eligibility period for second level courses should be retained this should only
apply to those pursuing second chance education leading to a leaving certificate qualification or
below. Post Leaving Certificate further education courses should be subject to the same 9 month
eligibility period as third level courses.
The general minimum age requirement for entry to BTEA should be raised from 21 years to 23 years
of age.
For those pursuing second chance education leading to a leaving certificate qualification or below,
the current age requirement should remain – i.e., over 21 years, or aged between 18 and 20 and out
of formal education for at least 2 years.
In line with other activation schemes BTEA jobseekers participants should establish an underlying
entitlement to JA prior to qualifying for BTEA. Currently, BTEA recipients do not have to be HRC
compliant. The introduction of having an underlying entitlement to JA will address this anomaly.
There should be a requirement to re-qualify for BTEA by establishing an entitlement to a SW
payment for those who complete a course and wish to progress to a higher level course. The practice
of ‘freezing’ JB while on BTEA should also be discontinued in conjunction with this change.
The practice of maxing up payments for participants on means reduced payments should be
discontinued and only the underlying social welfare entitlement should be paid to participant where
an entitlement exists
The current rule of allowing spouses to apply for BTEA based on their spouse’s primary payment,
with the possibility of both spouses receiving a maximum payment, should be reviewed in the
context of the Department’s moves towards a single working age payment.
A review of IT systems should be carried out to ensure that detailed data analysis is possible. The
current situation of having participants recorded across three IT systems is not ideal. The ‘TLA’
system should be updated and integrated into ISTS system in the short term while new systems are
being developed.
The scheme guidelines should be revised to ensure the BTEA is treated consistently across the
various qualifying payments.

66
As case management and client profiling is developed DSP should take on more active discretion on
what clients access BTEA, This would involve assessing the likely contribution courses will make to
the client’s re-employment chances, given the client’s own background and local and national labour
market conditions.
In this context, with a view to moving towards a more targeted scheme, attendance on shorter term,
accelerated and conversion courses which are more suitable to some cohorts on the LR could be
allowed via BTEA.
Looking forward in conjunction with the roll out of Profiling and Case Management where DSP has taken a
more active role in identifying an individual client’s need (based on being profiled as likely to remain
unemployed for long periods), provision should be made for relaxing the eligibility period for BTEA. It
should also be possible in these circumstances for the progression requirement to be waived by a case
manager who felt the most appropriate course for a person was one of a lower level than that already held or
immediate access to a course was necessary.

67
C.2 Part-time Education Option (PTEO) and Education Training and Development
Option (ET&D) – comparison with activation criteria
1. Scheme description
Both the Part Time Education Option (PTEO) and the Education, Training and Development (ET&D) are
designed to facilitate jobseekers who wish to engage in part time day, evening or weekend courses or more
intensive short duration courses of education and training while retaining their jobseeker’s payments.
The PTEO allows participants to attend part-time day/evening or weekend courses of education or training
and retain their jobseeker’s payment while an entitlement exists provided that they continue to satisfy the
conditions of being available for and genuinely seeking employment on an on-going basis. Payment is made
at the same rate as the primary payment and no maximisation of payments occurs.
The ET&D allows participants to attend certain courses of education, training or development of short
duration and retain their jobseeker’s payment while an entitlement exists. Participants are exempt from
engaging in job search but must be available for employment should an opportunity arise.
It is not possible to identify accurately the cost of these schemes; these are included in the overall cost of the
relevant primary payment schemes.
2. Eligibility conditions
There is no age or duration of unemployment eligibility criteria attached to PTEO while a person must be six
months unemployed and over 21 years of age to qualify for ET&D. The principle of progression which is a
fundamental principle of BTEA does not apply to either PTEO or ET&D.
A case officer must approve all ET&D courses. For courses initiated and organised by case officers
participants may be entitled to ‘out of pocket expenses’30
for the duration of the course.
3. Geographic distribution of opportunities
As both schemes have self selection characteristics and participants must be in receipt of jobseeker’s
payments, participants are spread throughout the country.
30
Out of Pocket Expenses are paid at a weekly rate of €32.00 for those in receipt of a jobseeker’s payment who agree to attend a course of study/training
for three days or more per week. The rate is reduced to €20.00 for courses of two days per week or less.

68
4. Recruitment process
PTEO is self selecting in nature, while ET&D may be initiated by a case officer or a person may approach
an officer with a suggested course for their approval. In any event, the case officer must approve all ET&D
courses and be satisfied the course will enhance the employability prospects of the participant.
5. Relationship of DSP to the projects/participants
The Regional Support Unit (RSU) and Employment Support Services (ESS) sections provide a central
support for the administration of both schemes including formulating policy, customer support and
providing guidelines. All persons pursuing part time courses should notify the Department of their intention
to do so and supply details of the course. If a Deciding officer is satisfied that the course is appropriate to
PTEO the PTEO code will be inserted on the IT system. The participant must continue in job search while
pursuing the part time course.
Decisions on the ET&D are approved by the case officers and files are maintained in relevant local offices.
The ET&D participant is exempt from job search for the duration of the course. The case officer may engage
with the participant during and after the course. If out of pocket expenses are claimed proof of attendance
will be required by the officer.
6. Pay rates and conditions
Participants on both PTEO and ET&D continue to receive their jobseeker’s payment while an entitlement
exists and maximisation does not occur. PTEO participants must satisfy the condition of being available for
and genuinely seeking employment and PTEO does not involve any extra allowance. ET&D participants are
exempt from job search. Participants on ET&D courses initiated by case officers may be eligible for out of
pocket expenses.
7. Duration of participation
There is no limit to the duration a person may pursue part time courses under the PTEO, while ET&D
courses are usually of short duration (although there is no precise definition of “short duration” in the ET&D
guidelines). Courses allowed under PTEO in recent years have also diverged from its defined objective.
PTEO is under increasing pressure to accommodate short term full times courses and longer duration part
time courses at all qualification levels.

69
8. Performance
Data on number of participants is weak for both schemes. While it is possible to say that in December 2011
there were 3,292 persons reported as being supported under PTEO and 174 under ET&D this does not
reflect the numbers supported throughout the year.
Centrally-held data on both schemes are poor. There are no data on types of course, duration of payment,
colleges attended, qualification received or impacts of the scheme in getting people back to employment.
Current IT systems do not provide for capture of these data.
IT systems aside, the reliability of data capture and input at the local level is also of concern. The
unreliability of data may be due to a number of factors (including inconsistency in entering the appropriate
codes in local offices, as well as cases where people pursuing part time courses are unaware they should
notify the Department). As a result there is under reporting of assistance afforded to DSP clients in terms of
education and training via these two options.
PTEO/ET&D – Conclusions
These two schemes are similar in nature, supporting unemployed persons to pursue short courses, and the
need for the existence of two schemes in this area is questionable. Awareness of the need to differentiate
between the primary payment and these schemes is weak at local office level, and therefore coding of
participants on the appropriate IT system is often not completed and consequently data is weak in this area.
This has the effect of under reporting assistance afforded to large numbers of DSP clients.
The definition of what constitutes a part-time course is not readily available. This leads to confusion as to
what courses should be allowed under PTEO. The PTEO scheme is being increasingly used for courses
under new initiatives in Department of Education and Skills, such as Labour Market Activation Fund,
Springboard etc; treating these programmes as part-time is stretching this definition beyond its limits in
certain cases.
PTEO/ET&D – recommendations
Given that these schemes are so similar in terms of interventions supplied, consideration should be given to
amalgamating them to provide coherent guidance on when people can continue to receive jobseeker’s
payments while engaging in education.
Any new scheme should distinguish between part-time education – which does not affect the participant’s
job search and availability – and short full-time courses. It is recommended that the Department should, in
consultation with the Department of Education and Skills, set out clear guidelines on what patterns of part-

70
time education (e.g. evening, weekend, etc) are consistent with meeting the conditions for jobseeker’s
payments. Where courses are full time, and thus require the participant to be granted an exemption from the
job-search requirements, clear guidance should be given on the permitted duration of participation (e.g.
number of days or weeks).
As at present, attending part-time courses should be permitted without any requirement as to prior duration
of receipt of the relevant jobseeker’s payment. Consideration could be given to having a prior duration
requirement before permitting attendance at full-time courses. Alternatively, as case management and
profiling of customers is rolled out by the Department, full-time courses should only be available to clients
on direction of their case manager.
The policy of paying out of pocket expenses as currently exists should be discontinued. The out of pocket
expenses budget should amalgamate with TESG/TATs and form part of a discretionary fund available to
case managers as case management and client profiling is developed within the Department. Any supports of
this nature should be paid at a flat rate of €20 per week and should only be paid where case managers
believe it is unreasonable for the client to attend a recommended course in the absences of such allowance.
Systems and procedures should be developed, and implemented consistently, to capture adequate data to
report on the extent of utilisation of these options and to provide for their evaluation.

71
C.3 Activation and Family Support Programme (AFSP) – comparison with activation
criteria
1. Scheme description
The AFSP allows the Department to provide funding to assist local organisations and agencies to implement
projects addressing the disadvantaged personal, social and economic circumstances of recipients of welfare
payments and their families, to enhance their employability through education, training and personal
development opportunities and to improve their quality of life. Projects are generally of short duration.
AFSP may support people under initiatives and programmes that are wholly funded by AFSP or part funded
in association with other agencies and Bodies. Table 3.8 below outlines numbers supported and expenditure
since 2008.
Table 3.8 – AFSP numbers and expenditure
Year* 2008 2009 2010 2011
Expenditure
In €m
5.48
4.81
3.95
2.82
Number of
Participants
16,381 15,165 10,000 8,523
*Programme launched in January 2008
Note: AFSP is primarily involved in supporting training & educational programmes. It can also support information events for
DSP clients which tend to overstate the numbers supported vis-a-vis the expenditure.
2. Eligibility conditions
The Activation and Family Support Programme (AFSP) allows the Department to provide funding to assist
local organisations and agencies to implement projects addressing the disadvantaged personal, social and
economic circumstances of recipients of welfare payments and their families, to enhance their employability
through education, training and personal development opportunities and to improve their quality of life.
AFSP may support people under initiatives and programmes that are wholly funded by AFSP or part funded
in association with other agencies and Bodies.
All participants who are supported by AFSP projects must be in receipt of a social welfare payment or must
be the dependent of a social welfare recipient and/or their families. Qualifying payments include jobseeker’s
payments, one parent family and illness related payments among others. There are no specific criteria in
relation to age or duration in receipt of payment attached to the scheme. Participants do not receive extra
allowances or maximisation of payment but may qualify for out of pocket expenses if the course is initiated
by a case officer

72
It is designed to fund once off projects. Funding applications come from a wide range of organisations
including family resource centres, IDCs, community development companies and advocacy groups. The
fund can also be used to assist individuals.
3. Geographic distribution of opportunities
The distribution of AFSP funds is largely responsive in that as needs are identified by case officers, local
organisations and agencies. There was considerable variation in the level of regional expenditure31
in 2011.
The South and South East regions accounted for the majority of expenditure with 26% and 21 %. The
Western, Border and Dublin South had similar expenditure with 16%, 14% and 12% respectively, while
Dublin North and the Midland Regions account for only 4% and 7%. This distribution is not directly linked
to LR representation in these areas which would suggest uneven engagement in certain regions.
Provisional figures indicate 8,523 participants were supported via AFSP in 2011. The Border and South East
regions account for the highest number of participants with 31% and 25% respectively. As with expenditure
the Midlands and Dublin North account for the least with 3% and 5% respectively.
4. Recruitment process
Funding is generally to projects rather than to individuals; those taking part may be recruited with the
involvement of the Department, or directly by the project organisers.
Case Officers work with social welfare recipients to identify appropriate training or development
programmes which will enhance the skills that the individual has and ultimately improve their employment
chances, as well as help them to continue to develop personally. They work in close co-operation with other
agencies and service providers including VECs, Area Partnerships, the Local Employment Service, FÁS
other education and training providers and the local and community and voluntary sector.
Decisions in respect of applications which involve expenditure up to €5,000 are made by Regional
Coordinators while expenditure in excess of €5,000 requires approval from ESS.
5. Relationship of DSP to the projects/participants
Funding applicants, (a wide variety of primarily local organisations including IDCs, advocacy groups,
community development groups, local VECs, and Family Resource Centres) submit applications to case
officers. Case Officers monitor participant’s progress periodically throughout the programme and records of
attendance must be forwarded to facilitators by course providers.
31
Provisional expenditure figure for 2011 is €2.7m

73
6. Pay rates and conditions
Participants do not receive extra allowances or maximisation of payment but may qualify for out of pocket
expenses if the course is initiated by a case officer. While participants are exempt from job search while on
courses they are expected to accept offers of employment, should they arise.
7. Duration of participation
Courses vary in duration but are predominantly short in nature.
8. Performance
In the region of 8,500 participants were supported via AFSP in 2011. As of October 2012 there have been
5,019 supported via AFSP in the current year.
Course providers must complete course evaluations on completion of courses which are forwarded to case
officers and ESS section. Evaluations should, among others, record data on the number of participants
starting/completing the courses including PPS numbers and progression to employment or self-employment
where applicable. No work has been carried out on analysing this data centrally but case officers will be
aware of evaluation results and will base future decisions on courses and other projects based on this.
The budget allocation is consistently underspent on AFSP. Take up of the scheme varies greatly across the
country with some areas not accessing AFSP with any consistency or vigour. There is a perceived
administration burden associated with the scheme which may dissuade applications. As the work load of
case managers is ever increasing accessing time to initiate programmes is becoming more difficult.
AFSP – Conclusions
AFSP is a relatively new scheme and differs from other activation schemes in DSP in a number of ways.
AFSP funds contribute towards once off programmes and events for DSP clients where a demand exists
which cannot be accommodated by existing programmes. As the scheme is often directed towards more
disadvantaged clients progression to employment may not always be a realistic expectation. However, some
programmes funded by AFSP may be a first step for DSP clients and may facilitate progression in training
and education and for this reason AFSP does have a place in the suite of activation programmes within the
Department.
AFSP is a discretionary fund and is often combined with other public bodies to jointly fund community
projects. This availability of discretionary funds is seen as an important tool in case officers’ armoury when
dealing with other funding agencies. This ability to make financial contributions affords DSP some
discretion in programmes choice and design for its clients and the communities in which they live.

74
On smaller-scale education/training interventions, the programme appears to have a significant level of
overlap with the type of interventions funded under TESG/TATS. Equally, many of the interventions funded
are managed by other public agencies (mainly VECs, IDCs) or NGOs. Here, there may be significant
overlap with provision under the Department of Education and Skills’ (DES) Back to Education Initiative
and the Community Education Programme; both of these provide funding support for community-based
education.
AFSP is sometimes used for part funding jobs fairs and similar one day events which tend to skew the data
on numbers supported via AFSP.
The regional diversity in expenditure and the related under-spend appears to be due to varying
administrative approaches across regions rather than reflecting diversity in terms of need.
AFSP – recommendations
While AFSP is useful as a training and education support to enhance people’s circumstances and improve
their quality of life, it is targeted at some of the most disadvantaged DSP clients and progression to
employment may not be a realistic outcome from this intervention.
It is recommended that AFSP be retained as a flexible fund to support once-off innovative projects only.
Where interventions are felt to have shown themselves to be worthwhile, further funding for their
continuation should be delivered through the relevant DES programmes (for community education projects).
As SOLAS and LETBs evolve capacity to mainstream successful pilots should be developed. It would be
envisaged that such projects could accept referrals from DSP case managers.
Funding and outcome data for one-day events such as job fairs should be recorded separately.
The reasons for regional diversity in expenditure and the related under-spend need to be explored and
addressed in more detail at scheme level. They may be as a result of administration burden or perhaps due to
the time case officers have available to devote to developing such schemes.

75
C.4 TESG (Technical Employment Support Grant) and TATS (Technical Assistance and
Training scheme) – comparison with activation criteria
1. Scheme descriptions
Both TESG and TATS are designed to allow DSP to offer flexible additional help (in the form of access to
training, advice, or support for the purchase of certain goods and services) to a number of categories of
unemployed people.
TESG support can be for purchase of training (where this cannot be provided by a state provider within a
reasonable time) or for certain other expenditures such as purchase of tools, travel costs to job interviews.
Training, with limited exceptions, must be on certified courses.
TATs is more focused on jobseekers with an interest in self-employment, and can assist with the purchase of
training/education/mentoring, equipment, advertising, and public liability insurance. The range of training
eligible for support is wider than on TESG, with less emphasis on certification.
Tables 3.9 and 3.10 outline numbers supported and expenditure for both schemes over the past five years.
Table 3.9 – TATs numbers and expenditure
Year 2007 2008 2009 2010 2011
Expenditure
In €m
3.02 3.03 3.52 4.79 3.16
Number of
Participants
5,633 6,071 7,612 10,654 6,958
Table 3.10 – TESG numbers and expenditure
Year 2007 2008 2009 2010 2011
Expenditure
In €m
2.87 3.11 5.81 5.57 3.13
Number of
Participants
5,000 5,400 9,777 10,285 9,855
2. Eligibility conditions
Both TESG and TATS are designed to allow DSP to offer flexible targeted additional help (in the form of
access to training, advice, or support for the purchase of certain goods and services) to a number of
categories of unemployed people.

76
TESG can be made available to jobseekers who have registered with the Employment Service and
undertaken a guidance process leading to an agreed career plan, and who are in receipt of certain specified
welfare payments.32
Support can be for purchase of training (where this cannot be provided by a state
provider within a reasonable time) or for certain other expenditures such as purchase of tools, travel costs to
job interviews. Training, with limited exceptions, must be on certified courses.
TATS was initially restricted to people who have moved from mainstream welfare payments to set up in
business under the Back to Work Enterprise Allowance scheme; it was subsequently extended to “other
social welfare customers ... who may require training or assistance to enter or re-enter the labour market or
who may be trying to establish an enterprise and need training or other supports”. Support can be for the
purchase of training/education/mentoring, equipment, advertising, and public liability insurance (PLI –
where support is limited to 50% of the cost or €1,270, whichever is the lesser). The range of training eligible
for support is wider than on TESG, with less emphasis on certification.
3. Geographic distribution of opportunities
TESG support was widely distributed in 2011, but there were regional variations. Overall, just over 30
grants were approved per 1,000 people on the LR. The ratio in most regions was close to this average;
exceptions were the South East, where approval levels were high (55 per 1,000) and the South West (20 per
1,000) and particularly the Midlands (12 per 1,000) where approvals were relatively low.
There is less regional variation in the distribution of TATs grants. Overall, just over 16 grants were
approved per 1,000 people on the LR in 2011. The ratio ranged from a low of 11 per 1,000 in the Midlands
to a high of 19 per 1,000 in the West region.
4. Recruitment process
TESG can be made available to jobseekers who have registered with the Employment Service and
undertaken a guidance process leading to an agreed career plan. It is used only where an ES officer identifies
that the jobseeker has a support need in order to enter/re-enter the labour market, and that this need cannot
be met by FÁS or another state provider within a two month period or at a location convenient to the
jobseeker. The majority of those supported under TESG in 2011 were either people referred to the
Employment Service under the NEAP (60%), Local Employment Service clients (10%) or persons case
loaded as a result of company closures (6%). Virtually all of the remainder (20%) were recipients of
jobseeker’s payments who had not yet been case loaded at the date of applying for TESG.
32
Primarily jobseeker’s and lone parent payments as well as payments related to disability and long-term illness. A full list is given in the TESG note in the Annex.
77
The original target group for TATS – those starting their own business under BTWEA – were in a minority
among participants by early 2010; in the first half of that year 24% of recipients were on BTW, 70% were
on jobseeker’s payments and on the LR, and the remainder were on lone parents’ (3%) or disability (2%)
payments. Management and budgetary control on TATS was regionalised in late 2010, since when the focus
of the scheme on supporting BTW participants has been reinforced. The partial regional data available for
2011 indicate that BTW participants accounted for a majority of TATS grants paid in that year.
Even with TATS becoming more focused on the original BTW target group, there remains a substantial
overlap between the two schemes in terms of the population served.
5. Relationship of DSP to the projects/participants
Monitoring of both TESG and TATS is focused on verifying that the service involved has in fact been
delivered to the participant and that payment of the supplier invoice by DSP is warranted. In the case of
TESG, where the intervention relates to training, it is a condition of payment that the participant undertook
the full assessment associated with the course.
In each case, receipt of support under the scheme is not seen as impacting on the participant’s job search or
availability for work. Training interventions supported are almost invariably part-time (specified under
TESG to be in the evening or at weekends); any full-time training supported is generally of only a few days
duration.
6. Pay rates and conditions
The upper limit on grants under TESG is €500 for training and €250 for other supports.33
The upper limit on
TATS is €1,000 (or €1,270 for PLI).
Both schemes are designed to address barriers to the participant’s progression to employment.
7. Duration of participation
As noted above, the programmes do not affect the participant’s job search or availability for work.
33
A very small number of clientswho are being supported under the High Support Process (HSP) may be grant aided up to €2,500 under TESG. HSP is used where a client is experiencing extreme barriers in entering the labour market such as literacy or numeracy problems, health related issues or substance abuse etc and involves multi-agency teams currently involved in the provision of services to the identified client group. APs in each Region are responsible for ensuring that Multi-Agency Teams are in place. There were 38 HSP clients aided in 2011 (0.3% of all TESG grants).

78
8. Performance
Some 13,700 TESG applications were approved for 2011. Virtually all of these were for purchase of
training. Not all applications approved are availed of, perhaps where a provider does not proceed with a
planned course or the Jobseeker’s circumstances change.
Almost 7,000 grants were paid out under TATS in 2011. About 4,400 were for training/education, 1,400
were for equipment, 650 for advertising and 630 for public liability insurance.
As of the end of October 2012 10,267 TESG grants have been awarded, while 5,999 TATs grants have been
awarded.
Many of the training courses delivered under TESG and TATs are short duration and may be a stepping
stone to further education. Outcome data is unavailable for TESG and TATs beneficiaries. Instances occur
where a DSP customer may approach DSP with a job offer but need a specific piece of training in order to
access that job. TESG or TATs may fund such training in the knowledge that an immediate outcome of
employment will result.
TESG and TATS – conclusions& recommendations
These two schemes have been useful in allowing officers to respond quickly and flexibly in addressing
barriers to re-employment for jobseeker clients. The training stream is important to DSP in that it affords
discretion to case officers in providing some short training which they feel will enhance client’s job
prospects, while the enterprise support stream is seen as a valuable assistance to those supported under the
Department’s Back to Work Schemes particularly in the initial years of self employment. Both schemes are
relatively low cost in terms of the interventions they support. There is, however, considerable overlap
between the schemes, which has become more evident as both schemes are now within the remit of DSP.
Initial recommendations are;
1. Given the extent of similarity between the two schemes, it recommended that they should be
amalgamated.
2. The amalgamated scheme should have two strands – one for enterprise supports for those starting
businesses under BTW, and the other being for certified training and for other job-search supports for other
jobseeker welfare recipients
3. The flexibility to offer additional support for the small number of HSP clients should be retained.
4. The new scheme should continue to cover the wider range of short-duration mentoring interventions
currently covered by TATS (e.g. training in CV and interview preparation).

79
5. The IT system currently in use for TESG should be adapted for use for the new overall scheme.
Based on these draft recommendations the Department requested an official to review both schemes in detail
with a view to exploring the best route to implement such recommendations if it found the recommendations
to be practical. Work on this review is nearing completion.
C.5General conclusions on programmes supporting participation in education/ training
Expenditure by DSP on supporting jobseeker clients in undertaking education and training has expanded
rapidly in recent years. The cost to the DSP budget of BTEA has now reached €200 million, and it is likely
that the cost of other provisions such as PTEO and ET&D, though not well identified, are substantial and
growing.34
Overall costs of education programme provision for DSP supported unemployed persons are not
available, but are likely to be significant given the numbers now involved.
As with work programmes, education/training measures are a common element as part of activation
interventions across countries. Evidence reviewed by OECD35
suggests that labour market training provides
the best long-run return of any active labour market programmes, but that a number of factors need to be
borne in mind in considering the contribution of education/training under conditions of continuing high
unemployment:
Training rather than “work first” can have negative effects on return to employment in the short run
because of “lock in” effects. These “lock in” effects are however likely to be of less significance in a
period of high unemployment
Training and return-to-education schemes are relatively high-cost, particularly those of longer
duration
With continuing high unemployment it could be argued that the main problem for the Irish labour
market continues to be on the demand side rather than the supply side. As a result, employment
outcomes from training interventions are likely to remain weak for some time to come
The recommendations made in relation to these schemes are designed to address these factors. In particular,
the recommendations in relation to eligibility conditions and an enhanced role for DSP in the process by
which clients gain access to programmes are designed to reduce the possibility of “lock-in” effects having a
negative effect on return to employment. This is of importance given the relatively long duration of the
typical course being supported under the Department’s programmes.
34
By comparison, income maintenance (paid directly by FÁS rather than DSP) for unemployed people referred to standard short-duration skills courses for unemployed people in FÁS was budgeted at €80 million in 2011. 35 OECD (2006). OECD Employment Outlook, Chapter 3. Paris: OECD

80
One cross-cutting issue that arises is the need to consider allowing certain shorter duration courses such as
short term full time and certain accelerated courses be eligible for BTEA (as an alternative to further
blurring of the definition of “part-time” under PTEO), provided they are providing education in areas where
labour shortage exists. This could have the effect of increasing the throughput through education courses
supported by BTEA and making DSP clients job ready over a shorter period of time which should
subsequently realise savings for the Department. Changes regarding course type supported and possible
relaxation of the progression rules for BTEA may be best approached on a pilot basis to allow early
evaluation before major policy changes. For example this would allow outcome comparison between
standard type and accelerated courses and standard courses and those where employers are central to the
design and contain work placement elements.
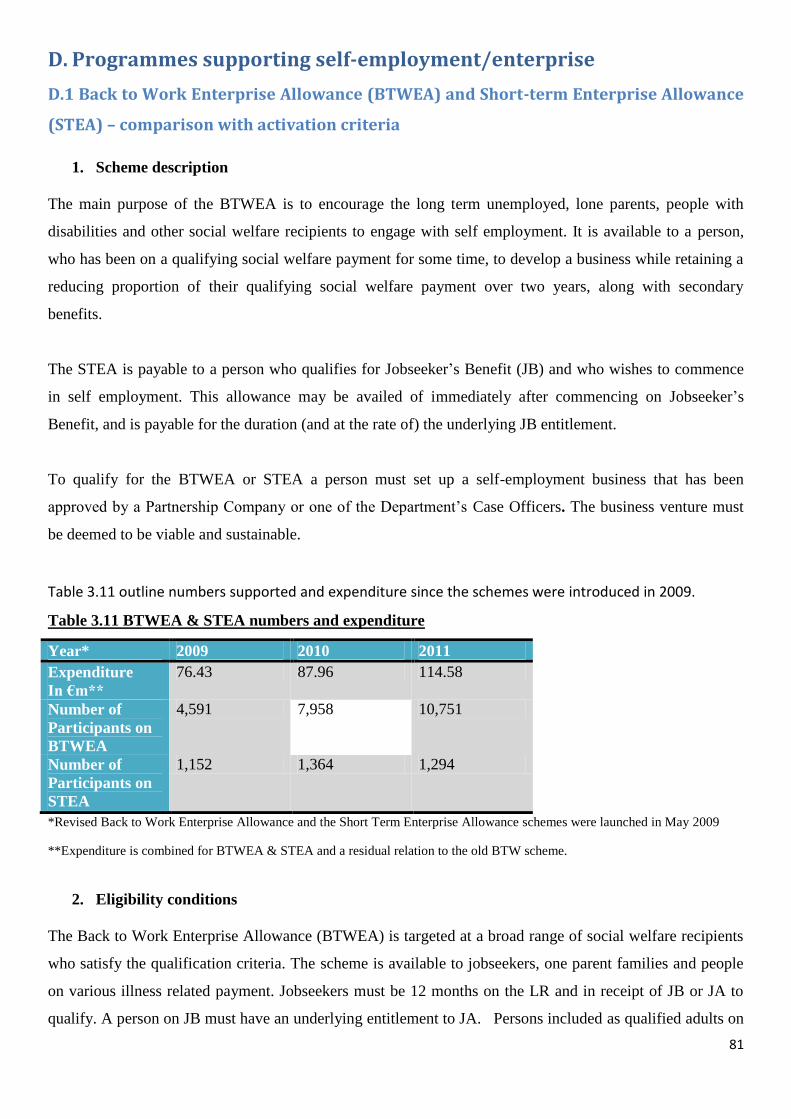
81
D. Programmes supporting self-employment/enterprise
D.1 Back to Work Enterprise Allowance (BTWEA) and Short-term Enterprise Allowance
(STEA) – comparison with activation criteria
1. Scheme description
The main purpose of the BTWEA is to encourage the long term unemployed, lone parents, people with
disabilities and other social welfare recipients to engage with self employment. It is available to a person,
who has been on a qualifying social welfare payment for some time, to develop a business while retaining a
reducing proportion of their qualifying social welfare payment over two years, along with secondary
benefits.
The STEA is payable to a person who qualifies for Jobseeker’s Benefit (JB) and who wishes to commence
in self employment. This allowance may be availed of immediately after commencing on Jobseeker’s
Benefit, and is payable for the duration (and at the rate of) the underlying JB entitlement.
To qualify for the BTWEA or STEA a person must set up a self-employment business that has been
approved by a Partnership Company or one of the Department’s Case Officers. The business venture must
be deemed to be viable and sustainable.
Table 3.11 outline numbers supported and expenditure since the schemes were introduced in 2009.
Table 3.11 BTWEA & STEA numbers and expenditure
Year* 2009 2010 2011
Expenditure
In €m**
76.43 87.96 114.58
Number of
Participants on
BTWEA
4,591 7,958 10,751
Number of
Participants on
STEA
1,152 1,364 1,294
*Revised Back to Work Enterprise Allowance and the Short Term Enterprise Allowance schemes were launched in May 2009
**Expenditure is combined for BTWEA & STEA and a residual relation to the old BTW scheme.
2. Eligibility conditions
The Back to Work Enterprise Allowance (BTWEA) is targeted at a broad range of social welfare recipients
who satisfy the qualification criteria. The scheme is available to jobseekers, one parent families and people
on various illness related payment. Jobseekers must be 12 months on the LR and in receipt of JB or JA to
qualify. A person on JB must have an underlying entitlement to JA. Persons included as qualified adults on

82
a social welfare payment cannot access BTWEA in their own right. Casual signers with 312 days on the LR
and an underlying entitlement to JA may also be eligible.
The Short Term Enterprise Allowance (STEA) is a narrowly targeted scheme available only to people in
receipt of JB who wish to engage in self employment. There is no minimum eligibility period attached to the
scheme, once a person is in receipt of JB they may apply immediately for STEA. A dependent adult on a JB
claim is not eligible for STEA.
For both schemes the proposed business must be approved by an IDC or one of the Department’s case
Officers. The business venture must be deemed to be viable, sustainable and not have potential to displace
existing businesses.
3. Geographic distribution of opportunities
Both BTWEA and STEA places are dispersed across the entire country. Dublin represents the highest
concentration of BTWEA participants with 25%, followed by Cork with 10% and Galway with 7%. There
are 9 counties with between 3% and 4%; Limerick, Kerry, Tipperary, Waterford, Louth, Meath, Kildare,
Wicklow and Donegal. A further 9 counties have low engagement with BTWEA and represent less than 2%
of participants; Monaghan, Cavan, Leitrim, Roscommon, Sligo, Carlow, Laois, Longford and Offaly.
Dublin also represents the highest concentration of STEA participants with over 34%, followed by Cork
with 9% and Galway with 6%. There are 7 counties with between 3% and 4%; Limerick, Clare, Tipperary,
Waterford, Meath, Wicklow and Kildare. Counties Leitrim, Cavan, Longford and Monaghan have less than
1% engagement with STEA.
4. Recruitment process
The recruitment process for both schemes is similar. An eligible person with a proposed business idea will
in the first instance contact their facilitator or Local Development Company to discuss their proposal. If the
facilitator and/or Local Development Company deem the proposal to be viable, sustainable and not likely to
displace similar type business in the area they may make a recommendation to DSP to approve the
application subject to satisfying the remaining eligibility criteria.
Claims are checked by DSP to ensure that all qualifying conditions have been met and necessary details
have been provided including a copy of the business plan, financial projections and documentary proof of
registration with the Revenue Commissioners.
5. Relationship of DSP to the projects/participants
The Employment Support Services section formulates policy and provides central support for both schemes.
All BTWEA cases are reviewed 12 months after award, while STEA is paid for a maximum of 12 months.

83
As participants are paid predominantly via EFT there is no requirement for regular interaction with the
Department. However, case officers and Local Development Companies may have interactions with the
participants periodically throughout the year depending on the participant and the nature of the business.
Participants are exempt from job search while engaged with both schemes.
6. Pay rates and conditions
Participants on BTWEA receive a standard weekly rate of payment equivalent of the rate of the Social
Welfare payment they were in receipt of prior to participation in the scheme in year one, reducing to 75% in
year two. A participant must have an underlying entitlement to JA and BTWEA rate of payment is based on
the JA rate. STEA participants receive a standard JB weekly rate of payment until such time as entitlement
to JB exhausts.
Increases in respect of dependant spouse and/or children continue to be paid while secondary benefits may
continue to be paid subject to satisfying the relevant conditions. Qualified adults are free to take up insurable
employment without affecting payment for both schemes. However, a qualified adult claiming Social
Welfare in his/her own right or taking up Community Employment will result in payment being reduced
accordingly.
Currently, BTWEA scheme guidelines do not adequately deal with the issue of part time employment while
on the scheme. Anecdotal evidence suggests some case officers allow participants to engage in part-time
employment with their approval while on BTWEA, while others do not. An STEA participant is not allowed
enter into paid employment as an employee either in a full-time or part-time capacity while in receipt of
STEA.
Participants on both schemes can avail of employment grants from a County Enterprise Board (CEB) or
from LEADER companies without affecting their entitlement. All participants are automatically sent an
application form for JA on completion of the scheme.
7. Duration of participation
BTWEA is paid for a two year period on a reducing basis; 100% in year one and 75% in year two, while
STEA is payable for a maximum of 12 months or until JB payments exhaust.
8. Performance
There were 10,751 supported under the BTWEA in 2011, of which over 5,600 were new awards in 2011.
Male participants account for 78% of all participants while female account for 22%. Almost 42% supported
are aged under 35 years, while 46% are aged between 35 to 50 years old. Almost 95% of participants
84
originate from jobseeker’s payments, with 3% formerly on one parent family payments and the remaining
7% originating from illness related payments.
On 31st December 2011 there were 1,294 supported under STEA, 74% male and 26% female. Almost 39%
supported are aged under 35 years, while 48% are aged between 35 to 50 years old. As the maximum
duration payable on STEA is 12 months, all participants above were awarded in 2011. There were 1,364
participants on the scheme at 31st December 2010. All participants originate from JB payments.
As of the end of October 2012 there were 10,919 engaged with BTWEA and 1,131 engaged with STEA.
Participants are recorded across a number of systems in the Department. Data on the number of participants,
age and geographic location is available. The main method of analysing outputs and outcomes is by tracking
participant’s status on LR extracts post completion of the scheme. This type of analysis is possible for all
STEA participants and a majority of BTWEA participants as BTWEA is available to non LR schemes.
Examination of a sample of BTWEA participants from December 2009 compared against an LR extract
from February 2012 showed 50% were no longer attached to the LR. A similar exercise for STEA
participants indicated 80% were no longer attached to the LR.
There is no requirement for a person to notify the Department of the status of their business on completion
of either scheme. The Department does not survey those who leave the scheme to try to ascertain data.
Despite gathering data on type of business being pursued there are no records kept as IT systems will not
accommodate recording of such data.
BTWEA/STEA – Conclusions
The BTWEA and STEA have been in existence since May 2009 when they replaced the old four year
enterprise allowance and the Back to Work Employee Scheme. In order to respond effectively to the
growing numbers on the Live Register and the continuing contraction in employment, it was decided in the
Supplementary Budget of the 7th April 2009 to refocus resources on the enterprise strand of the Back to
Work Allowance which supports people into self employment.
Supports for self-employment clearly have a role to play as one option for unemployed people, and it likely
that in current conditions there is a greater pool of people, among the unemployed, with the skills and
experience that would make them candidates for such support.
It should also be noted that DSP support for self employment is not limited to BTWEA and STEA. Persons
engaged in self employment are entitled to apply for JA. All means including that derived from self
employment is assessed and where appropriate JA can be paid.

85
However, information on outcomes from the schemes is limited, and there is limited interaction between
participants and DSP while they are on the schemes.
BTWEA/STEA – recommendations
Once awarded, interaction between the Department and the participants on enterprise support
schemes should be more structured and regular. This would have the dual benefit of affording more
assistance and support to participants and also increasing controls on both the BTWEA and STEA.
Financial statements to prove a bone fide business is being carried out should be supplied.
Appropriate risk analysis systems should be developed in conjunction with SIU to improve control
activity.
Consideration should be given to introducing a mentoring element to both programmes. Advice from
experienced entrepreneurs could prove to be a valuable asset to a person starting out on their self-
employment venture.
DSP should meet with Department of Environment, Community and Local Government and Pobal to
agree parameters to be applied consistently in approving applications. LDCs have the necessary
expertise to examine business proposals and recommend a decision but the approaches adopted are
not always consistent.
IT systems should be developed to allow the central recording and analysis of data on the nature of
businesses supported under BTWEA and STEA and to record business success/failure. IT systems
should also allow separate budgets to be held for each back to work scheme.
The treatment of change of circumstances of a QA of a BTWEA participants should be reviewed to
ensure means are fairly and correctly assessed
Participants should not be allowed to pursue part time or temporary employment while engaged with
the schemes. If DSP is supporting clients to start up and pursue their own business the clients should
be devoting 100% of their time to that business to ensure they give it every chance to succeed.
Consideration should be given to allowing people who may have started a part time business prior to
becoming unemployed to receive support under the BTWEA. The business would not have to be
started after becoming unemployed

86
D.2 Credit union loan guarantee scheme – comparison with activation criteria
1. Scheme description
The Credit Union Loan Guarantee Scheme is available to BTWEA participants who approach DSP for
assistance in obtaining credit. It is a support in assisting those furthest from the work force who cannot
secure capital from regular banking institutions to access credit through credit unions. Table 3.12 outlines
level of participation and expenditure in recent years.
Table 3.12 – Credit Union Loan Guarantee Fund numbers and expenditure
Year 2007 2008 2009 2010 2011
Expenditure
In €m
0 0 .006 .019 0
Number of
Participants
0 0 1 4 0
2. Eligibility conditions
The Credit Union Loan Guarantee Scheme is a narrowly targeted scheme only available to persons who
have been awarded the BTWEA. Under scheme conditions the Department will reimburse the loss to any
credit union where an approved individual defaults on a loan guaranteed by the Department. In general loans
up to the value of €6,350 will be guaranteed.
3. Geographic distribution of opportunities
There were no participants in 2011 so geographic distribution is not applicable.
4. Recruitment process
Each proposal will be vetted, and, if considered viable, the Department will act as guarantor for a loan from
the Credit Union. Applicants must be interviewed by facilitators to ensure scheme conditions are satisfied
and to ensure that the project being undertaken is viable and capable of generating sufficient income in order
to meet repayments.
5. Relationship of DSP to the projects/participants
The case officer will assist the applicant to complete the application and liaise with the credit union
regarding the need for the guarantee. When the regional coordinator is satisfied with the application a notice
will issue to the credit union with all necessary documentation. Defaults on payments will be acted on
immediately by credit unions and the case officer will be alerted of a possible charge against the fund. The

87
case officer will work closely with the credit union to reschedule payments for the applicant. If repayments
are not resumed after 6 months the credit union can invoke the guarantee.
As payments only occur where participants default on loan repayments, no further output or outcome data is
readily available.
6. Pay rates and conditions
Expenditure only occurs where a participant defaults on their credit union loan and the Department is then
liable for this debt. A loan of an amount up to €6,350 from an individual credit union to a BTWEA recipient
may be guaranteed by the Department.
7. Duration of participation
The duration of the guarantee will be for the period of repayment of the loan up to a 5 year maximum. The
guarantee will cover outstanding principal and interest.
8. Performance
There was no take up of the scheme in 2011 or to date in 2012 and 4 people availed of the scheme in 2010.
Credit Union Loan Guarantee Scheme – Conclusions and recommendations
There has been minimal take up of this scheme in recent years. There were a total of 5 participants in 2009
and 2010 combined and there was no take up in 2007, 2008, and 2011. While there may be merit in
schemes of this nature when access to credit for small and medium business is restricted, such a scheme is
appropriate to the Department of Jobs, Enterprise and Innovation (DJEI). DJEI have announced a roll out of
a temporary partial credit guarantee scheme and a micro finance fund as part of their action plan for jobs and
this fund with an annual budget of €20,000 should be transferred with immediate effect.

88
E. Miscellaneous supports
E.1 Part Time Job Initiative (PTJI) – comparison with activation criteria
1. Scheme description
The Part-Time Job Incentive (PTJI) Scheme, run by the Department of Social Protection, is intended as a
stepping stone to full-time work. It allows certain long-term unemployed people to take up part-time work
and get a special weekly allowance instead of their jobseeker’s payment. Recipients of the Part-Time Job
Incentive Scheme must be available for and seeking full-time work while getting the payment. Table 3.13
outlines participants and expenditure in recent years.
Table 3.13 – PTJI numbers and expenditure
Year 2007 2008 2009 2010 2011
Expenditure
In €m
1.32 1.32 1.45 1.16 1.03
Number of
Participants
210 184 173 161 180
2. Eligibility conditions
The Part Time Job Initiative (PTJI) is a narrowly targeted scheme available to people who are long term
unemployed in receipt of JA who take up part time employment for less than 24 hours per week. The JA rate
must be higher than the PTJI supplement payable. Small holders or persons engaged in self employment are
not eligible for the scheme. The employment must be insurable and involve working a maximum of 24hours
per week. A person may have more than one job provided the total hours are less than 24.
The scheme historically attracts equal numbers of males and females. The majority of participants are aged
over 45.
3. Geographic distribution of opportunities
PTJI places are dispersed across the country.
4. Recruitment process
The scheme is self selecting in nature. There is no restriction on the number of employees an employer can
employ under the scheme.
5. Relationship of DSP to the projects/participants
89
There is no exemption from job search for full time employment while receiving PTJI. The scheme is
operated at a SWLO level and there is evidence that monitoring varies by SWLO.
Take-up of PTJI has generally been low. This is primarily due to the introduction and improvements in
alternative, more favourable employment support measures over the years, including Family Income
Supplement (FIS) which provides support where low-income employees with children who work more than
19 hours per week or 38 hours per fortnight receive an in-work income support.
6. Pay rates and conditions
The PTJI allowance is paid to participants in lieu of their jobseeker’s allowance. The current personal rate is
€119 (€193.90 if an increase for qualified adult is paid) which is not affected by the earnings received from
part time work. There are no increases in these rates for qualified children. Income from employment is
taxable in the usual way.
7. Duration of participation
While participants may stay on the scheme for one year initially, this may be extended for further periods.
There is no set upper restriction on how long participants may remain on PTJI.
8. Performance
It is estimated that there were 180 people availing of PTJI in 2011 which is an increase of 12% on the 2010
figure of 161.Most recent verified figures for 2012 show 193 participants engaged with PTJI.
PTJI – Conclusions
There is quite poor take up of this scheme; this may in part be due to limited awareness across the
Department of the scheme’s continued existence. PTJI offers a very similar support to casual employment
supports and FIS and it is questionable if a rationale still exists for this scheme.
PTJI – recommendations
Given the poor take up and the recent amendments to FIS termination of the scheme should be considered.
If retained, the scheme should be limited to 12 months only after which the participant should progress to
employment. A restriction on the hourly rate should be introduced as currently the scheme may be utilized
by high earners working shorter week
Periodic reviews of employers should be carried out to ensure more staff are not subsequently hired when
the PTJI claimant could fill extra hours.
The payment system should be automated to reduce the administrative effort of manual payments in the
SWLO/BO.
The requirement that a person be looking for fulltime employment should be retained.

90
E.2 Employer Job PRSI incentive scheme
1. Scheme description
The Employer Job PRSI Incentive Scheme was introduced in June 2010 to provide incentive to employers in
the form of a PRSI holiday for the employer’s portion of PRSI for any eligible employees hired. The
employee must be unemployed for six months or more and the job must be new and additional. The scheme
aims to support job creation and counter the drift of people into long-term unemployment and welfare
dependency by cutting business input costs.
Table 3.14 – Employer Job PRSI Incentive numbers and expenditure
Year* 2010 2011
Expenditure
In €m
* *
Number of
employees
1,202 923
Number of
employers
736 660
*there is no budget line expenditure for this scheme as the costs materialise in the form of income forgone to the Social Insurance Fund,
2. Eligibility conditions
When launched in 2010, the scheme exempted employers from paying their portion of PRSI for a new
eligible employee for 12 months and was time limited to the end of 2010. The job must be new and
additional, be for at least 30 hours per week and last for at least six months. The employee must have been
unemployed for six months or more to qualify as an eligible employee. An employer was limited to a
maximum of 5% of their existing workforce or five employees, whichever is the greater.
The scheme was extended in 2011 in the context of the Budget and National Recovery Plan. In 2012 the
scheme was simplified and further extended to the end of 2012 .The period of exemption has been increased
from 12 to 18 months for eligible employers who create jobs from 1 January 2012.
91
3. Geographic distribution of opportunities
Of over 1,500 applications received in 2011 almost 25% were received from Dublin with Cork accounting
for over 13%. Counties; Limerick, Galway, Sligo, Donegal, Kildare, Clare and Wexford accounted for
between 4% and 6% each. The remaining counties accounted for below 4% of applications each with
Leitrim, Longford, Laois and Roscommon registering very low representation.
4. Recruitment process
The PRSI scheme differs to other schemes reviewed in this chapter as it supports the employer as opposed to
the DSP client. Employers who are aware of the scheme may adjust their recruitment decision to recruit
persons with an unemployment history where previously they may not have done so. An employee must be
six months or more unemployed to qualify. The qualifying payments are Jobseeker’s payments, one parent
family and disability payments. When the scheme was extended in 2012 time spent on certain activation
schemes may count towards the eligibility period and employers who offer full time employment
opportunities to a JobBridge intern may avail of the scheme directly once the six month qualifying period is
satisfied. DSP does not have a role in referring DSP clients to employers for this scheme as employers
identify suitable candidates to satisfy their needs and if they are eligible under the scheme they may benefit
from the PRSI exemption scheme.
5. Relationship of DSP to the projects/participants
Each application is checked by DSP to ensure the employee satisfies the conditions of the scheme - six or
more unemployed and that the job is new and additional before an exemption is granted. Employers must
also furnish proof to DSP that they are tax compliant.
As the exemption period nears conclusion, DSP communicates with employers to inform them that the
appropriate PRSI rate should be paid from the expiry date of the exemption. Employers must sign and return
a declaration to confirm they will pay the appropriate rate of PRSI from the agreed date. DSP also include a
questionnaire to gather employers’ views on the scheme and this helps to inform policy in this area.
6. Pay rates and conditions
Costs under the Employer Job (PRSI) Incentive scheme arise by way of social insurance income foregone.
The amount of PRSI foregone will vary depending on the PRSI band that would have been paid in respect of
the employee, ranging from 4.25% (reduced from 8.5% in July 2011) for those earning €356 or less to
10.75% for those earning in excess of €356.01of gross pay.

92
Analysis of wage data for the scheme for 2010 and 2011 showed the average cost in terms of PRSI forgone
ranged from €2,400 to €2,600 across all wages and both rates of PRSI. Costs do not all accrue in the year the
exemption is granted and the timing will depend on the date of award and the duration of the exemption.
The costs above are based on averages which are liable to over or under estimation, while also
accommodating outliers. A small number of very highly paid employees could raise the average
disproportionally. Cost estimates are also based on the assumption that all employees remain in
employment for the entire duration of the exemption. As the exemption is valid if employment lasts in
excess of six months and data is not available on employees whose employment terminates prior to the
duration of exemption, accurate costing is difficult.
7. Duration of participation
From June 2010 to January 2012 the exemption was for duration of 12 months. This was increased to 18
months in January 2012.
8. Performance
The Employer PRSI scheme is a relatively new scheme only launched in mid-2010. The scheme is attractive
particularly to employers who create jobs that pay weekly wages of over €356 a week and would therefore
have a PRSI liability of 10.75%. The Government decision to halve the lower rate of employer PRSI from
8.5% to 4.25% from July 2011 may have impacted on the take up of the scheme among employers who are
recruiting lower paid workers earning less than €356 a week as it halved the potential impact of the PRSI
scheme. Numbers awarded on the scheme remain disappointing given the potential savings that could be
realised by employers.
From June to 31st December 2010, applications were received from 961 employers in respect of 1,808
employees. 736 employers were awarded exemptions in respect of 1,202 employees, while 347 employers
had claims in respect of 511 employees rejected.
From January 2011 to the 30th December 2011, applications were received from 940 employers in respect
of 1,522 employees. 660 employers were awarded exemptions in respect of 923 employees, while 381
employers had claims in respect of 559 employees rejected.
Up to the 26th October 2012 applications have been received from 820 employers in respect of 1,224
employees. From these applications 617 employers have been awarded exemptions in respect of 801
employees.

93
Table 3.15 below outlines the employment/occupation breakdown of the 800 positions approved to date in
2012; the scheme is supporting jobs across a diverse range of occupation categories.
Table 3.15 - Employment/Occupation Breakdown – 801 positions approved to date in 2012
Plant and machine operatives 103 13%
Associate professional and technical 97 12%
Professional 98 12%
Clerical and secretarial 89 11%
Sales 80 10%
Craft and related 76 9%
Managers and administrators 56 7%
Other occupations 202 25%
Employer Job PRSI Incentive Scheme – Conclusions
As mentioned the performance of the PRSI scheme in terms of take up has been disappointing. It is
particularly disappointing when one examines the potential savings available to employers who avail of both
the Employer PRSI scheme and the Revenue Job Assist scheme.
The Revenue Job Assist scheme offers both employers and workers an incentive in the form of reduced tax
payment where people who have been continuously unemployed for 12 months or more are recruited. The
scheme applies for a period of three years and can be used in conjunction with the Employers Job (PRSI)
Incentive Scheme where applicable. It applies to employers in the form of a double tax deduction on the
employee's wages and employer's PRSI in respect of such wages.
The take-up on Revenue job assist is similar to that on the PRSI scheme and the numbers availing of both
simultaneously is unknown.
DSP have engaged in a number of employer road shows in October 2012 to raise awareness of the PRSI
scheme and the fact that it can be availed of in conjunction with the Revenue Job Assist scheme. These road
shows have attracted over 1,500 employers and early indications show an increase in interest in the scheme
and increased applications.

94
While there is a perception that employers find schemes of this nature to be burdensome in terms of the
effort involved to gain the benefit, recent IBEC surveys have shown that employers who availed of the
scheme found the opposite to be the case and found their concerns regarding ‘red tape’ to be unfounded.
Employer Job PRSI incentive scheme – Recommendations
If the take up of the scheme remains low there may be little rationale for continuing the scheme in to 2013.
Consideration should be given to aligning both the Employer PRSI scheme and the Revenue Job Assist
Scheme in terms of eligibility and duration and perhaps a single application. This coupled with a joint
intensive promotion and awareness campaign among employers may increase take-up.

95
Chapter 4–Summary conclusions
Background and approach
This report commences by reviewing likely labour market developments in the medium term, and the
government’s policy approach to labour market activation.
The likely prospect is for falling, but still extremely high unemployment over the next few years. The
numbers of long-term unemployed, in particular, are likely to remain in excess of 170,000.
Even in these circumstances, there will be large-scale flows of people into employment each year, and a
large proportion of these opportunities will be in the kinds of jobs for which most of the unemployed are
reasonably qualified – routine service jobs and skilled and unskilled manual jobs. The overarching objective
of government activation policy is to ensure that as many as possible of these jobs are taken up by
unemployed people – particularly those from the Live Register.
Within this context, the range of programmes covered in this review is wide and diverse, this makes
meaningful comparisons across schemes, and summarisation of the recommendations, difficult.
To address this difficulty, the approach used has been to locate the schemes firmly in the context of the
government’s labour market activation policies, as stated most recently in Pathways to Work and
summarised in the concluding part of Chapter 2. This has allowed the development of a number of criteria,
set out at the beginning of Chapter 3, that could be applied to the assessment across all schemes. These
criteria relate to eligibility conditions and targeting; geographic distribution of opportunities; recruitment
process; monitoring of participants’ experience and encouragement of continuing job-search during
participation; pay rates and conditions; and the duration of participation that is allowed/encouraged on the
scheme.
Also, where possible, similar schemes have been grouped together for the purposes of the analysis (e.g.
work/temporary employment programmes; programmes supporting participation in education and training).
The conclusions and recommendations on each of these groups is summarised below, followed by a brief
summary of recommendations on rationalisation of schemes.

96
The temporary work programmes
This group of programmes [Community Employment (CE), Tús, Rural Social Scheme (RSS) and Job
Initiative (JI)] is budgeted to cost €470 million in 2012.
Work programmes like these are common as activation interventions across countries in times of high
unemployment. However, the OECD has pointed out that reliance on temporary employment schemes has
been relatively high in Ireland as compared with other countries; that post-programme outcomes remain
disappointing; and that such schemes “should be used as a last resort activation tool”. In order to be
effective, any such schemes “must be temporary and should not become a disguised form of subsidised
permanent employment”. However, long-term unemployment has risen further since the most recent OECD
review of Ireland in 2011, and seems likely to remain at an elevated level for some time, as noted above; this
could be seen to strengthen the case for selective expansion of temporary employment.
In addition, this review has found that there are aspects of CE and Tús where reform would increase their
contribution as activation measures. In the case of CE, these relate primarily to the recruitment process and
the gradual increase in the average duration of participation, which now greatly exceeds the duration of one
year originally envisaged for this type of programme. In the case of Tús, areas for reform include the
treatment of means in deciding on payment for some participants, the arrangements for promoting training
and progression for participants, and the follow-up of clients who, while willing and qualified, fail to find
placements. Detailed recommendations to address these issues are made in the sections of the report dealing
with the individual schemes. These recommendations for reform to CE and Tús would also serve to address
some of the scheme-design characteristics of which the OECD has been critical.
The recommendations for CE and Tús will also, if implemented, lead to closer alignment of the design of
these two schemes. In these circumstances, early consideration should be given to full amalgamation of the
two schemes.
In relation to RSS and JI, the review finds that neither of these schemes currently contributes to activation
policy in terms of leading on to other sustainable employment outside of the confines of the scheme itself. It
is recommended that the future of these schemes needs to be considered in the context of their contribution
to service delivery rather than activation. This could involve integration with a service-delivery scheme such
as the under the Community Services Programme or transfer to another government Department with
relevant responsibilities.
In relation to the ongoing scale of CE and Tús, while there is no evident “correct” level at which the scale of
temporary employment measures should be set, it is clear that OECD views the current level in Ireland as
being too high. Even with the reforms now proposed for these schemes, it would appear to be desirable, as

97
the economy recovers and unemployment starts to fall, to reduce participation on these programmes relative
to other active labour market interventions.
Internship/Work Placement programmes
This group of programmes is budgeted to cost somewhat under €70 million in 2012, of which €65.8 million
relates to JobBridge. Work Placement Programme (WPP), on which participation has been declining rapidly,
is likely to cost a maximum of €3 million based on current trends.
Programmes of this type are common across developed countries. Their effectiveness and appropriate scale
are generally assessed by reference to the post-programme outcomes for participants, while making
allowance for estimates of deadweight (activity that would have taken place even without the scheme) and
displacement (activity that takes place as an alternative to recruitment of normal employees).
Indecon consultants have just completed an independent evaluation of the JobBridge scheme which is being
considered by the Department. The evaluation assessed the design, delivery and impact of JobBridge on the
unemployed. This evaluation, when considered, will be valuable for informing future policy decisions and
direction of the scheme.
In the interim, the launch of JobBridge with an additional allowance of €50 per week incentive attached has
effectively undermined the rationale for WPP, particularly with the inclusion of those on lone parents’ and
disability payments in the eligible group for JobBridge. There is however, small continuing uptake of WPP
placements by participants who have no previous welfare entitlement and therefore receive no payment
under the scheme. It is recommended that JobBridge should allow the registration of such internships. Once
this is done, WPP can be closed to new entrants and the scheme can be closed down entirely in a matter of
months. (Consideration should then be given to paying the €50 weekly JobBridge allowance to the small
number of participants without basic welfare payments).
Programmes supporting participation in education/ training
Expenditure by DSP on supporting job-seeker clients in undertaking education and training has expanded
rapidly in recent years. The cost to the DSP budget of Back to Education Allowance (BTEA) has now
reached €200 million, and it is likely that the cost of other provisions such as Part-Time Education Option
(PTEO) and Education, Training and Development (ET&D), though not well identified,36
are substantial and
growing. Overall costs of education programme provision for DSP-supported unemployed persons are also
now likely to be significant given the numbers now involved.
36
Both schemes effectively deem participants to meet the core eligibility requirements, so the participants remain on their basic jobseeker’s payment and are included in the Live Register. The costs involved are not separately distinguished in reporting of overall expenditure on JA/JB.

98
As with work programmes, education/training measures are a common element as part of activation
interventions across countries. Evidence reviewed by OECD suggests that labour market training provides
the best long-run return of any active labour market programmes, but that:
Training rather than “work first” can have negative effects on return to employment in the short run
because of “lock in” effects.
Training and return-to-education schemes are relatively high-cost, particularly those of longer
duration
With continuing high unemployment it could be argued that the main problem for the Irish labour market
continues to be on the demand side rather than the supply side. As a result, employment outcomes from
training and education interventions are likely to remain weak for some time to come.
As an activation programme, the largest scheme, BTEA as currently designed can have the effect of ‘lock
in’ for participants, by providing, in some cases after relatively short periods on the LR, for dependency on
SW payments for long periods of time where no job search is required. The courses covered by the scheme
are provided on an academic year basis, rather than providing for intake across the year – which would be
more in line with the activation needs of unemployed people. Access to BTEA is essentially by self-referral,
rather than as part of any process where clients agree with DSP that it is the most suitable intervention for
them with a view to progressing towards employment. Finally, the data suggest that return to the Live
Register after completion of courses under BTEA is high – over 60% for those who completed or dropped
out of a course at the end of the 2010-11 academic year.
The scheme also needs to be considered in terms of its interaction with other student supports. The standard
payments under BTEA are therefore substantially in excess of the maximum rates paid under the main
student support scheme. As BTEA expenditure has risen (from €64 million in 2007 to €199 million in 2011)
it has grown in significance relative to other forms of support. It is estimated, for example, that 6,400 people
entered undergraduate third-level studies with BTEA support in 2011; this represents about 16% of all
entrants to undergraduate studies. Somewhat over 20% of all participants on PLC courses are also being
supported under BTEA (as compared with 30%+ being supported under the student grant scheme).
Particularly for those at the younger end of the age distribution of participants, there is a risk that BTEA may
come to be seen as an alternative funding stream for traditional access to further and higher education
courses. This would involve substantial associated costs for the Exchequer as BTEA is relatively expensive
in comparison to other options such as the student grant system
The recommendations made in relation to BTEA are designed to address these factors. In particular, the
recommendations in relation to eligibility conditions (age and duration of unemployment) and an enhanced

99
role for DSP in the process by which clients gain access to programmes are designed to reduce the
possibility of “lock-in” effects having a negative effect on return to employment. This is of importance
given the relatively long duration of the typical course being supported under the Department’s programmes.
It is also recommended that consideration be given to allowing certain shorter duration courses such as short
term full time and certain accelerated courses be eligible for BTEA (as an alternative to further blurring of
the definition of “part-time” under PTEO), provided they are providing education in areas where labour
shortage exists. This could have the effect of increasing the throughput through education courses supported
by BTEA and making DSP clients job ready over a shorter period of time which should subsequently realise
savings for the Department.
The Technical Employment Support Grant (TESG) and the Technical Assistance and Training scheme
(TATS) each allow DSP to provide support to individual clients to purchase short-term services (mainly
training) that address barriers to re-employment. Given the extent of overlap between the schemes, they
should be amalgamated.
Programmes supporting self-employment/enterprise
This group of programmes [Back to Work Enterprise Allowance (BTWEA) and Short Term Enterprise
Allowance (STEA)] is budgeted to cost almost €140 million in 2012. DSP also provides support for self
employment through the provision that the self employed are entitled to apply for JA if their means are
sufficiently low.
Supports for self-employment clearly have a role to play as one option for unemployed people, and it likely
that in current conditions there is a greater pool of people, among the unemployed, with the skills and
experience that would make them candidates for such support.
However, information on outcomes from the schemes is limited, and there is limited interaction between
participants and DSP, while they are on the schemes. This means that only limited support is offered to
participants; it also limits controls on the schemes.
It is recommended that interaction between the Department and the participants on Enterprise Support
Schemes should be more structured and regular. Financial statements to prove a bone fide business is being
carried out, should be supplied. Appropriate risk analysis systems should be developed in conjunction with
SIU to improve control activity.

100
In addition, IT systems should be developed to allow the central recording and analysis of data on the nature
of businesses supported under BTWEA and STEA and to record business success/failure. IT systems should
also allow separate budgets to be held for each Back to Work scheme.
Unifying programmes with similar objectives
There are two broad thrusts to the terms of reference for this review – the requirement that schemes be
evaluated on their merits in terms of their contribution to activation policies, and separately that an
assessment be made of alternative organisational approaches “particularly the possibility of unifying
programmes that have similar objectives and target client groups”.
In practice these two aspects have been covered together as part of the review of individual schemes and
groups of schemes, as summarised above. However, it is possible to identify the specific recommendations
that address organisational/scheme unification issues:-
As the recommendations for CE and Tús will, if implemented, lead to closer alignment of the design
of these two schemes, early consideration should be given to full amalgamation of the two schemes.
there is a need to decide if RSS best suited to DSP or should be moved to a Department or body that
is engaged with the development of rural and community services.
As numbers continue to fall, JI schemes might be amalgamated, on a local basis, with projects now
funded under the Community Services Programme
If, as recommended, JobBridge is amended to allow the registration of internships where the
participant has no previous welfare entitlement and therefore receives no payment under the scheme,
WPP can be closed to new entrants,
TESG and TATS should be amalgamated
The small Credit Union Loan Guarantee Scheme should be discontinued in the light of the
development of a temporary partial credit guarantee scheme and a micro finance fund by DJEI.
Given the poor take up on PTJI and recent relevant amendments to FIS, termination of the scheme
should be considered.
The development of Intreo active profiling and case management is central to the ability of many of the
review recommendations to succeed. Individual case management and one-to-one interactions between DSP
staff and its customers should improve the customers’ experience and the outcome attainable by DSP from
chosen interventions. However this process will take time and considerable resources to develop and the
scale of the task that confronts the Department should not be underestimated.

101
Conclusion
This review has encompassed a broad and varied range of activation programmes, 16 in total. The
recommendations are equally wide-ranging. They include the possible termination (or transfer out of DSP)
of five of these schemes (RSS, JI, WPP, CU Guarantee & PTJI) and the possible amalgamation of a further
six schemes (CE & Tús, PTEO & ET&D, TESG & TATs). Significant proposals are also made in terms of
eligibility conditions and administration for a number of the schemes. In all cases the recommendations aim
to ensure that DSP has available to it a more streamlined and practical set of programmes to assist
Government in implementing activation policy.

102
Annexe 1
Terms of reference for policy review of employment support programmes
1. Identify, outline and analyse the over arching objective of activation support for people of working
age outlining the short, medium and long term policies in this area; examine the continuing
rationale and relevance of all relevant scheme objectives highlighting any overlaps.
2. Broadly examine recent, current and prospective future trends in the Irish labour market with a view
to informing necessary activation measures in the short to medium term.
3. Examine the continuing rationale and relevance of all scheme objectives and examine their
compatibility with the overall strategy of the Department, in particular the policy objective of
supporting people of working age into employment (including through increased employability);
4. Broadly define the inputs (funding and staffing), processes and tangible outputs and outcomes
associated with each scheme and identify the level and trend of these outputs and outcomes where
possible, with particular regard to the number of recipients of the scheme, and identify any
information gaps that emerge;
5. Evaluate the degree to which the objectives of all schemes warrant the allocation of public funding
on a current and ongoing basis in the light of their contribution to Department’s policy objective of
supporting people of working age into employment. Examine the scope for alternative policy or
organisational approaches to achieving the overarching objective in a more efficient and/or effective
manner; particularly the possibility of unifying programmes that have similar objectives and target
client groups.
6. Recommend any changes to the current range of schemes/programmes seen as required on the basis
of the analysis carried out, and specify potential future performance indicators that might be used to
better monitor the performance of schemes.