Bus Rapid Transit and Transit Oriented Development: Case Studies ...
Page 1 of 23
CIVIL & ENVIRONMENTAL ENGINEERING | REVIEW ARTICLE
A review of bus rapid transit implementation in IndiaAnkit Kathuria, Manoranjan Parida, Ch. Ravi Sekhar and Anshuman Sharma
Cogent Engineering (2016), 3: 1241168
Kathuria et al., Cogent Engineering (2016), 3: 1241168http://dx.doi.org/10.1080/23311916.2016.1241168
CIVIL & ENVIRONMENTAL ENGINEERING | REVIEW ARTICLE
A review of bus rapid transit implementation in IndiaAnkit Kathuria1*, Manoranjan Parida1, Ch. Ravi Sekhar2 and Anshuman Sharma1
Abstract: Between 2008 and 2015, bus rapid transit system (BRTS) in India in-creased its implementation from two cities to eight cities with a significant increase in total ridership. This paper attempts to give a detailed review of BRTS implementa-tion in cities of India. This is a systematic effort that could inform readers about the current system and network characteristics of Indian BRTS. Different system and corridor characteristics including off board and on board ticketing systems are ad-opted in India. Gross cost revenue collection model is adopted by almost all special purpose vehicle (SPV) companies developed to manage BRT systems. A variety of carriageway concept designs for BRTS are implemented in these cities considering a right of way of 22, 24, 30, 32, 40, 45, 60 meters respectively. Out of the eight cities, Ahmedabad has almost 30% of the total fleet size. In terms of regulatory context, SPV companies are formed in almost all eight cities after observing Ahmedabad BRT success. Documentation of these operating systems shall provide a sound database to planners and decision makers actively involved with BRT system implementation in developing countries.
Subjects: Sustainable Transport Engineering; Transport Planning; Transportation Engineering
Keywords: bus rapid transit system; public transport
1. Introduction
Bus rapid transit is a flexible rubber tired form of a rapid transit that combines stations, vehicles, services, running ways and ITS elements into an integrated system with a strong image and identity. (Levinson, Zimmerman, Rutherford, & Eric, 2003, p. 12)
*Corresponding author: Ankit Kathuria, Civil Engineering Department, Indian Institute of Technology Roorkee, Roorkee, India E-mail: [email protected]
Reviewing editor:Filippo G. Pratico, University Mediterranea of Reggio Calabria, Italy
Additional information is available at the end of the article
ABOUT THE AUTHORAnkit Kathuria is presently a Research Scholar in Transportation Engineering Group, Department of Civil Engineering at Indian Institute of Technology, Roorkee. He has completed his Post Graduation degree in Transport Planning with distinction from School of Planning and Architecture, New Delhi in 2013. He has two years of work experience in the field of transportation. There he was involved in a World Bank project on Road Safety for state of Punjab, India. In total he has worked on six different construction and transportation consultancy projects. He has contributed over 11 research papers/articles in Journals and Conference proceedings.
PUBLIC INTEREST STATEMENTBus rapid transit systems (BRTS) have now become the most popular and cost-effective urban transit system options for both developed and developing countries. In India, this system came into existence since the year 2008. This paper attempts to give a detailed review of BRTS implementation in India. BRTS characteristics are illustrated and compared for eight cities of India where this system is in operation. A comprehensive documentation of these operating systems will provide a sound database to planners and decision makers who are actively involved with BRTS implementation in developed and developing countries.
Received: 19 October 2015Accepted: 22 September 2016First Published: 28 September 2016
© 2016 The Author(s). This open access article is distributed under a Creative Commons Attribution (CC-BY) 4.0 license.
Page 2 of 23
Ankit Kathuria
Page 3 of 23
Kathuria et al., Cogent Engineering (2016), 3: 1241168http://dx.doi.org/10.1080/23311916.2016.1241168
The popularity of bus rapid transit system has increased in the past few years. It is now considered as a good solution for transportation problems in large and medium size cities. BRT is regarded as the revolution of most widespread public transit option (Jiang, Christopher Zegras, & Mehndiratta, 2012). BRT aims at providing a good level of service (LOS) in terms of operating speed. The BRT can run in three kinds of operating environments being semi exclusive, exclusive and grade separated (Transit Capacity and Quality of Service Manual (TCQSM), 2013). The implementation of the BRT is based on the physical characteristics of the corridor. The availability of sufficient right of way (ROW) is very important to establish a BRT corridor.
Past literature reports review and performance of various BRTS systems of the world. Reviews of systems running in China, Columbia, Turkey and Sweden etc. have been shown in the past work whereas a complete and comprehensive review to understand the implementation of BRT system in India is not yet reported in the literature. Therefore, this paper attempts to present a detailed review of BRTS implementation in eight cities of India. Both design and operational characteristic of the BRT systems running in India are reviewed. Finally paper ends with a conclusion reporting the important findings of the study.
2. Literature reviewBRTS in literature has been studied, keeping in mind the institutional, social, economic, environmen-tal, urban planning and technical perspective (Cervero & Kang, 2011; Delmelle & Casas, 2012; Hensher & Golob, 2008; Lin & Wu, 2007; Wöhrnschimmel et al., 2008).
Bitterman and Hess (2008) describe how the new system meets universal design requirements. Deng and Nelson (2011) reported how the popularity of BRTS increased in the world. Levinson et al. (2003) reported various technologies and features of the BRT system. A variety of BRT systems can be seen ranging from grade separated to at grade busways as reported by Hinebaugh and Diaz (2009). BRT has a strong potential of bringing about a modal shift from private vehicle. Satiennam and Jaensirisak (2013) demonstrated a model for predicting choice of private vehicle user on differ-ent BRT system of Khon Kaen city, in Thailand. This study reported that BRT can attract some two wheelers traveller to change the choice of mode. However, majority of the four wheeler user still prefer their own private mode of transportation for their trips. Darido (2006) summarises develop-ment of BRTS in China, he also synthesized the demographics and economic growth of cities in China where BRT is in operation. Hidalgo, Lleras, and Hernández (2013) reported the main characteristics of Transmilenio bus rapid transit system.
Further studies were reported to evaluate the performance of BRTS like Li and Hino (2013) did an evaluation of BRT system of major cities in China. Gandhi, Tiwari, and Fazio (2013) examined differ-ent BRTS design alternatives, sixteen different theoretical design configurations were evaluated. Zou, Li, and Li (2012) evaluated the performance of BRT system using probe data and signal timing data. Hidalgo et al. (2013) reported that how changes in facility design infrastructure improved the facility capacity and performance of transit system. Li, Duan, and Yang (2012) developed dwell time estimation models for bus rapid transit system. Godavarthi, Chalumuri, and Velmurugun (2014) measured the performance of BRT system based on V/C ratio. Abdelghany, Mahmassani, and Abdelghany (2007) developed a framework for BRT service planning and operations. Tsao, Wei, and Pratama (2009) reported operational feasibility analysis of single segregated bus lane for BRT system.
Studies of BRT running in large metropolitan cities can be seen in the past literature, but limited studies can be seen to observe the implementation and success of this system in small cities. Ratchathani and Mai (2013) reported a practical experience of BRT in Khon Khen, Thailand. Further Buluran, Fillone, Fukuda, and Jaensirisak (2013) discussed the issues regarding BRT introduction to small and medium size cities of developing countries in East Asian Region. Hidalgo and Muñoz (2014) reviewed the major technological improvement in BRT till date. The latest study by Nikitas and
Page 4 of 23
Kathuria et al., Cogent Engineering (2016), 3: 1241168http://dx.doi.org/10.1080/23311916.2016.1241168
Karlsson (2015) gave an elaborated worldwide state of the art analysis for BRTS, this study illus-trated a synopsis of various strengths and weakness of BRT today.
Indian BRT systems present some of the best performing BRT systems in the world i.e. the Janmarg, 2015 (Ahmedabad BRTS). Zimmerman and Agarwal (2012) have reported the success of Ahmedabad BRTS in comparison to Jakarta, Johannesburg, and Lagos.
It can be observed from this section that limited studies have been reported on studying the de-sign and operation characteristics of Indian BRT systems. Therefore this paper will attempt the same for contributing to the existing knowledge of literature.
3. System review methodologyThis paper reviews the Indian BRT systems based on various design and operation characteristics. In terms of design firstly the systems will be categorized as open and closed BRT systems. Then for each system the basic operational summary and the system characteristics would be discussed. Further, in terms of regulatory context, cost models adopted for different systems would be shown. Then, the carriageway concepts used in various systems would be discussed. The selection of the carriageway was based upon the availability of ROW. The basic operation parameters would then be compared. The system reliability review in the present study was based on the travel time reliability (TTR). The reliability evaluation was not possible for every system because of the limitation in collect-ing the GPS data for every city. Therefore, this system review attribute was checked for Ahmedabad BRTS only. This was done by using fifteen days of GPS data collected for seven routes in 2014 from BRTS cell, Ahmedabad, India. As a next step, institutional setup for BRTS operation will be compared. Finally, the planned networks of each city would be compared by reporting the associated advan-tages and disadvantages.
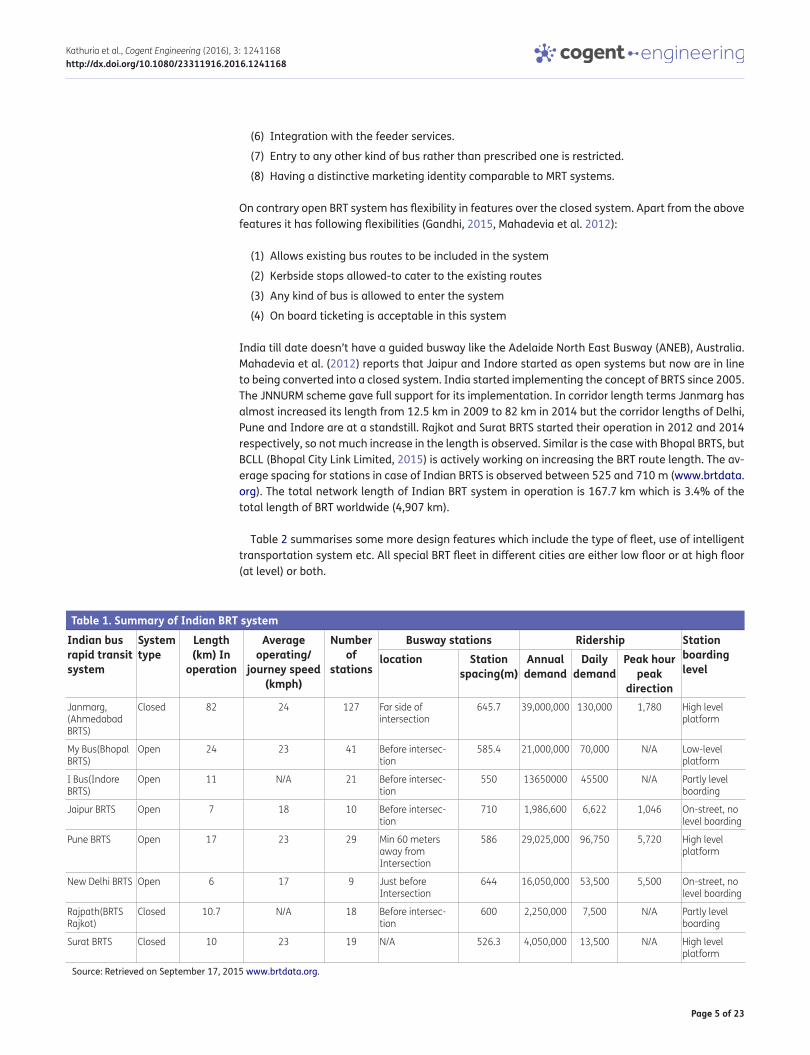
4. Reviewing the Indian BRT systemThis section assesses the various system design features of Indian BRT system. Table 1 summarises the key design characteristics. It also details a range of ridership data for Indian BRT system. The predicted annual ridership data calculated by using the daily demand and 300 working days is about 127 Million. The estimated annual and daily demands are maximum in case of Ahmedabad because it has 82 km of network length in operation which is comparatively the highest. Ahmedabad accounts for almost 31% of the total daily ridership. Indian BRT system ridership data is available on Global BRT data website (www.brtdata.org) which is the maintained and updated by World Resource Institute, International Energy Agency (IEA), Latin American Association of Integrated Transport System and BRT (SIBRT) and Across Latitudes and Cultures-Bus Rapid Transit (ALC-BRT).
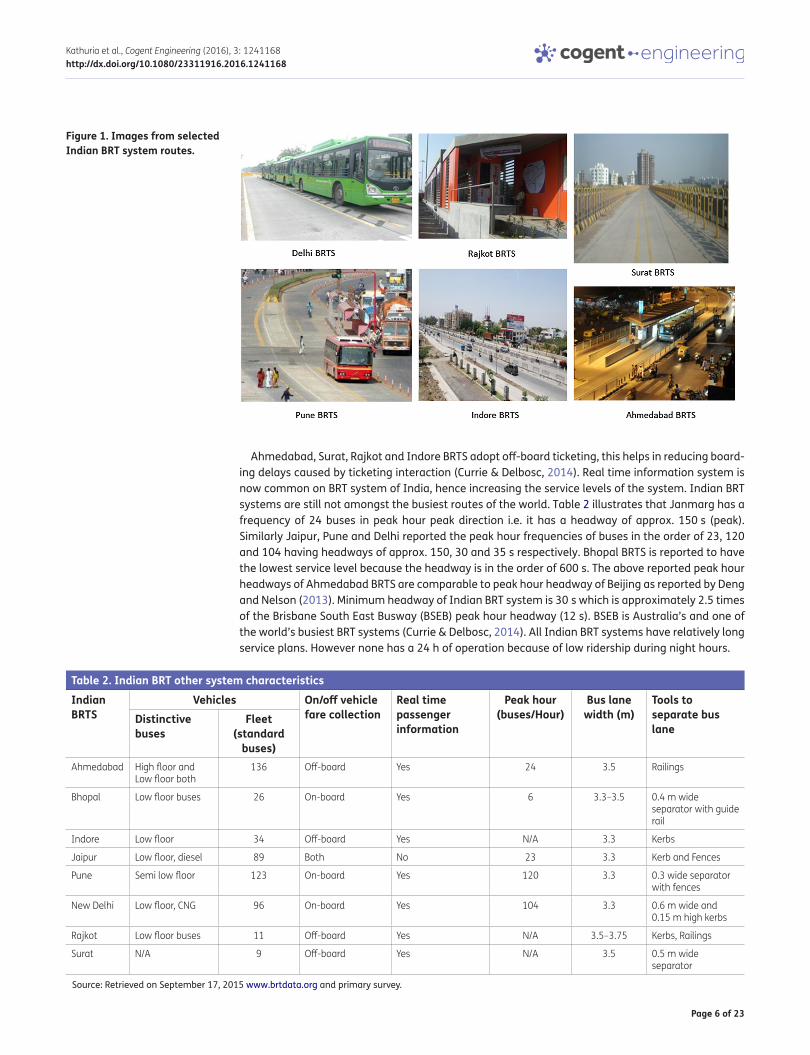
Figure 1 presents pictures of few Indian BRT corridors being studied. Almost all BRTS in operation are at grade on street busway. The oldest corridors are of Ahmedabad and Delhi. The Ahmedabad, Rajkot, and Surat BRTS are on the lines of closed BRT system while the rest of the systems are open BRT systems. Literature gives various features for a system to be called as an open or a closed sys-tem, these systems are also called as high capacity bus system (HCBS) and full bus rapid transit system respectively (Mahadevia, Joshi, & Datey, 2012). Closed system has following features (Mahadevia et al., 2012):
(1) Segregated busways on the majority of the network length.
(2) Location of the bus station and busway on the median.
(3) Provides a good integration of network of routes and corridors.
(4) BRT stations which are secure and comfortable and are also protected by different kinds of weathers.
(5) Implementing pre-board fare collection system.
Page 5 of 23
Kathuria et al., Cogent Engineering (2016), 3: 1241168http://dx.doi.org/10.1080/23311916.2016.1241168
(6) Integration with the feeder services.
(7) Entry to any other kind of bus rather than prescribed one is restricted.
(8) Having a distinctive marketing identity comparable to MRT systems.
On contrary open BRT system has flexibility in features over the closed system. Apart from the above features it has following flexibilities (Gandhi, 2015, Mahadevia et al. 2012):
(1) Allows existing bus routes to be included in the system
(2) Kerbside stops allowed-to cater to the existing routes
(3) Any kind of bus is allowed to enter the system
(4) On board ticketing is acceptable in this system
India till date doesn’t have a guided busway like the Adelaide North East Busway (ANEB), Australia. Mahadevia et al. (2012) reports that Jaipur and Indore started as open systems but now are in line to being converted into a closed system. India started implementing the concept of BRTS since 2005. The JNNURM scheme gave full support for its implementation. In corridor length terms Janmarg has almost increased its length from 12.5 km in 2009 to 82 km in 2014 but the corridor lengths of Delhi, Pune and Indore are at a standstill. Rajkot and Surat BRTS started their operation in 2012 and 2014 respectively, so not much increase in the length is observed. Similar is the case with Bhopal BRTS, but BCLL (Bhopal City Link Limited, 2015) is actively working on increasing the BRT route length. The av-erage spacing for stations in case of Indian BRTS is observed between 525 and 710 m (www.brtdata.org). The total network length of Indian BRT system in operation is 167.7 km which is 3.4% of the total length of BRT worldwide (4,907 km).
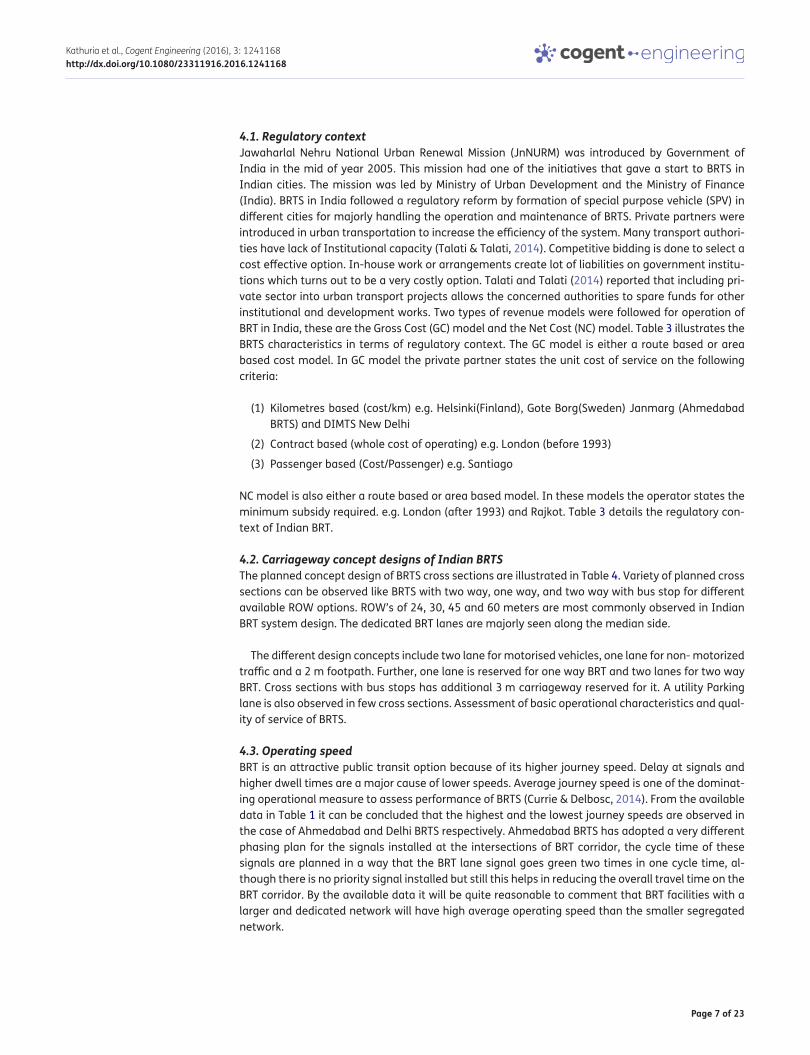
Table 2 summarises some more design features which include the type of fleet, use of intelligent transportation system etc. All special BRT fleet in different cities are either low floor or at high floor (at level) or both.
Table 1. Summary of Indian BRT system
Source: Retrieved on September 17, 2015 www.brtdata.org.
Indian bus rapid transit system
System type
Length (km) In
operation
Average operating/
journey speed (kmph)
Number of
stations
Busway stations Ridership Station boarding level
location Station spacing(m)
Annual demand
Daily demand
Peak hour peak
directionJanmarg, (Ahmedabad BRTS)
Closed 82 24 127 Far side of intersection
645.7 39,000,000 130,000 1,780 High level platform
My Bus(Bhopal BRTS)
Open 24 23 41 Before intersec-tion
585.4 21,000,000 70,000 N/A Low-level platform
I Bus(Indore BRTS)
Open 11 N/A 21 Before intersec-tion
550 13650000 45500 N/A Partly level boarding
Jaipur BRTS Open 7 18 10 Before intersec-tion
710 1,986,600 6,622 1,046 On-street, no level boarding
Pune BRTS Open 17 23 29 Min 60 meters away from Intersection
586 29,025,000 96,750 5,720 High level platform
New Delhi BRTS Open 6 17 9 Just before Intersection
644 16,050,000 53,500 5,500 On-street, no level boarding
Rajpath(BRTS Rajkot)
Closed 10.7 N/A 18 Before intersec-tion
600 2,250,000 7,500 N/A Partly level boarding
Surat BRTS Closed 10 23 19 N/A 526.3 4,050,000 13,500 N/A High level platform
Page 6 of 23
Kathuria et al., Cogent Engineering (2016), 3: 1241168http://dx.doi.org/10.1080/23311916.2016.1241168
Ahmedabad, Surat, Rajkot and Indore BRTS adopt off-board ticketing, this helps in reducing board-ing delays caused by ticketing interaction (Currie & Delbosc, 2014). Real time information system is now common on BRT system of India, hence increasing the service levels of the system. Indian BRT systems are still not amongst the busiest routes of the world. Table 2 illustrates that Janmarg has a frequency of 24 buses in peak hour peak direction i.e. it has a headway of approx. 150 s (peak). Similarly Jaipur, Pune and Delhi reported the peak hour frequencies of buses in the order of 23, 120 and 104 having headways of approx. 150, 30 and 35 s respectively. Bhopal BRTS is reported to have the lowest service level because the headway is in the order of 600 s. The above reported peak hour headways of Ahmedabad BRTS are comparable to peak hour headway of Beijing as reported by Deng and Nelson (2013). Minimum headway of Indian BRT system is 30 s which is approximately 2.5 times of the Brisbane South East Busway (BSEB) peak hour headway (12 s). BSEB is Australia’s and one of the world’s busiest BRT systems (Currie & Delbosc, 2014). All Indian BRT systems have relatively long service plans. However none has a 24 h of operation because of low ridership during night hours.
Figure 1. Images from selected Indian BRT system routes.
Table 2. Indian BRT other system characteristics
Source: Retrieved on September 17, 2015 www.brtdata.org and primary survey.
Indian BRTS
Vehicles On/off vehicle fare collection
Real time passenger information
Peak hour (buses/Hour)
Bus lane width (m)
Tools to separate bus lane
Distinctive buses
Fleet (standard
buses)Ahmedabad High floor and
Low floor both 136 Off-board Yes 24 3.5 Railings
Bhopal Low floor buses 26 On-board Yes 6 3.3–3.5 0.4 m wide separator with guide rail
Indore Low floor 34 Off-board Yes N/A 3.3 Kerbs
Jaipur Low floor, diesel 89 Both No 23 3.3 Kerb and Fences
Pune Semi low floor 123 On-board Yes 120 3.3 0.3 wide separator with fences
New Delhi Low floor, CNG 96 On-board Yes 104 3.3 0.6 m wide and 0.15 m high kerbs
Rajkot Low floor buses 11 Off-board Yes N/A 3.5–3.75 Kerbs, Railings
Surat N/A 9 Off-board Yes N/A 3.5 0.5 m wide separator
Page 7 of 23
Kathuria et al., Cogent Engineering (2016), 3: 1241168http://dx.doi.org/10.1080/23311916.2016.1241168
4.1. Regulatory contextJawaharlal Nehru National Urban Renewal Mission (JnNURM) was introduced by Government of India in the mid of year 2005. This mission had one of the initiatives that gave a start to BRTS in Indian cities. The mission was led by Ministry of Urban Development and the Ministry of Finance (India). BRTS in India followed a regulatory reform by formation of special purpose vehicle (SPV) in different cities for majorly handling the operation and maintenance of BRTS. Private partners were introduced in urban transportation to increase the efficiency of the system. Many transport authori-ties have lack of Institutional capacity (Talati & Talati, 2014). Competitive bidding is done to select a cost effective option. In-house work or arrangements create lot of liabilities on government institu-tions which turns out to be a very costly option. Talati and Talati (2014) reported that including pri-vate sector into urban transport projects allows the concerned authorities to spare funds for other institutional and development works. Two types of revenue models were followed for operation of BRT in India, these are the Gross Cost (GC) model and the Net Cost (NC) model. Table 3 illustrates the BRTS characteristics in terms of regulatory context. The GC model is either a route based or area based cost model. In GC model the private partner states the unit cost of service on the following criteria:
(1) Kilometres based (cost/km) e.g. Helsinki(Finland), Gote Borg(Sweden) Janmarg (Ahmedabad BRTS) and DIMTS New Delhi
(2) Contract based (whole cost of operating) e.g. London (before 1993)
(3) Passenger based (Cost/Passenger) e.g. Santiago
NC model is also either a route based or area based model. In these models the operator states the minimum subsidy required. e.g. London (after 1993) and Rajkot. Table 3 details the regulatory con-text of Indian BRT.
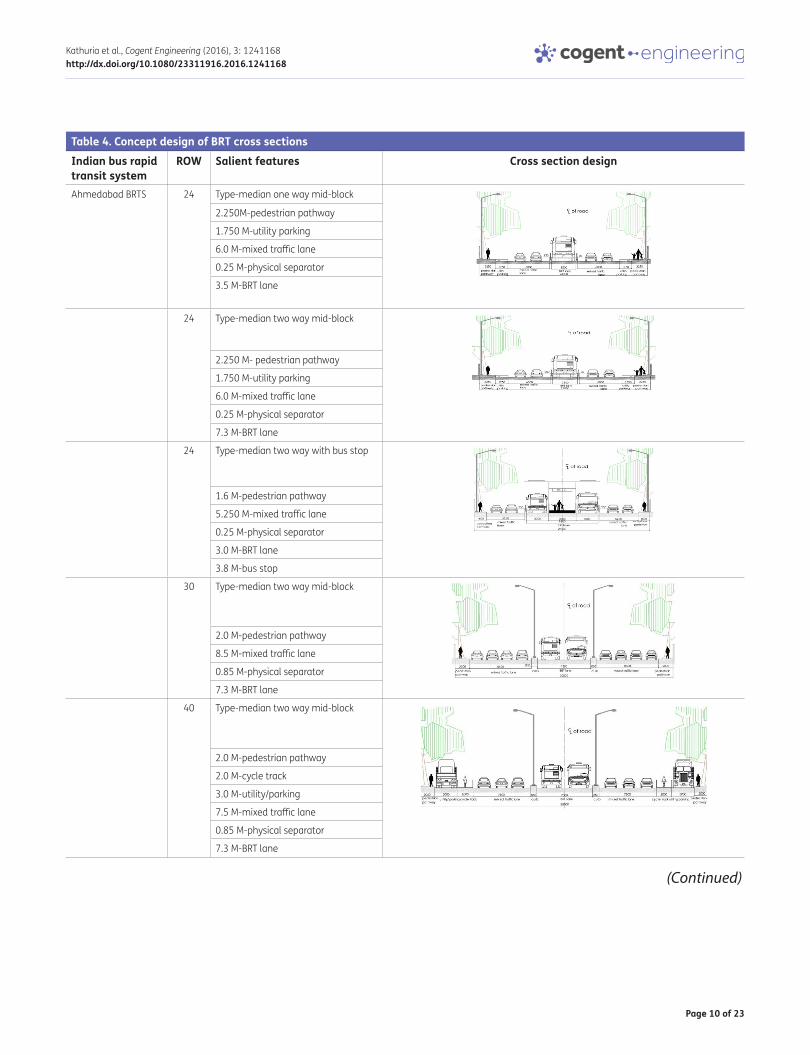
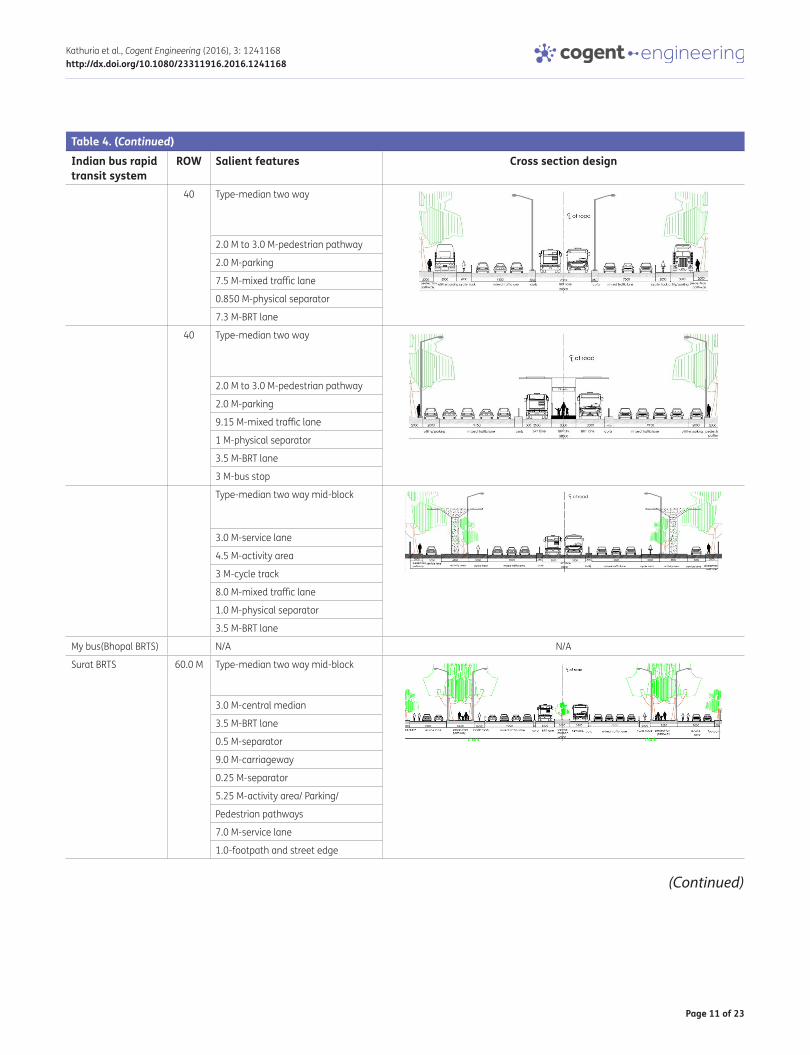
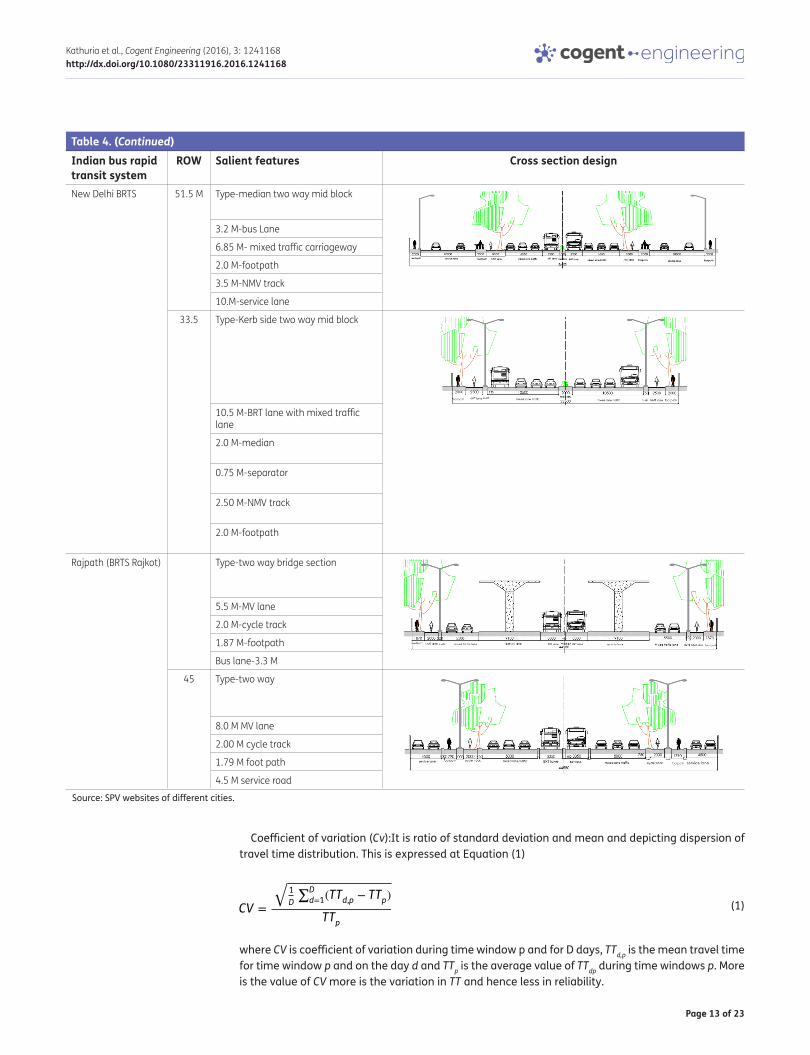
4.2. Carriageway concept designs of Indian BRTSThe planned concept design of BRTS cross sections are illustrated in Table 4. Variety of planned cross sections can be observed like BRTS with two way, one way, and two way with bus stop for different available ROW options. ROW’s of 24, 30, 45 and 60 meters are most commonly observed in Indian BRT system design. The dedicated BRT lanes are majorly seen along the median side.
The different design concepts include two lane for motorised vehicles, one lane for non- motorized traffic and a 2 m footpath. Further, one lane is reserved for one way BRT and two lanes for two way BRT. Cross sections with bus stops has additional 3 m carriageway reserved for it. A utility Parking lane is also observed in few cross sections. Assessment of basic operational characteristics and qual-ity of service of BRTS.
4.3. Operating speedBRT is an attractive public transit option because of its higher journey speed. Delay at signals and higher dwell times are a major cause of lower speeds. Average journey speed is one of the dominat-ing operational measure to assess performance of BRTS (Currie & Delbosc, 2014). From the available data in Table 1 it can be concluded that the highest and the lowest journey speeds are observed in the case of Ahmedabad and Delhi BRTS respectively. Ahmedabad BRTS has adopted a very different phasing plan for the signals installed at the intersections of BRT corridor, the cycle time of these signals are planned in a way that the BRT lane signal goes green two times in one cycle time, al-though there is no priority signal installed but still this helps in reducing the overall travel time on the BRT corridor. By the available data it will be quite reasonable to comment that BRT facilities with a larger and dedicated network will have high average operating speed than the smaller segregated network.
Page 8 of 23
Kathuria et al., Cogent Engineering (2016), 3: 1241168http://dx.doi.org/10.1080/23311916.2016.1241168
Table 3. Indian BRT regulatory contextSystem Source of funding Funding
sanctioned (INR
Millions)
Special purpose vehicle (SPV) or responsible agency
Responsibilities as given by SPV’s Revenue model
Janmarg, Ahmedabad bus rapid transit system(ART)
35% by JnNURM, Jawahar Lal Nehru Urban Renewal Mission, 15% by Government of Gujrat (GOG) and 50% by AMC
15,000 (Estimated)
Ahmadabad Janmarg Limited (AJL)
• Run and operate
• Provide fast service• Increase reliability• To provide eco-friendly service• To maintain bus lanes• To maintain bus shelters• Decide fares• Provision of smart card facility and tokens• To provide pay and park facilities to the citizens• AJL also gets advertisement rights across the BRTS
routes
Gross cost
My bus(Bhopal BRTS)
JnNURM, Jawahar Lal Nehru Urban Renewal Mission and Government of Madhya Pradesh(G0 MP)
3,686 Bhopal City Link Limited
• All civil infrastructure like depots, bus stops are taken care by them
• All maintenance infrastructure like washing pits, in-spection pits given by them
• Office, administrative and store building management
• Covered and safe parking space to be provided• Live tracking facilities for & control room
Net cost
i bus(Indore BRTS)
JnNURM, Jawahar Lal Nehru Urban Renewal Mission(50%)+ Grant under JnNURM by MP Govt(20%)+ contribution from ICTLS(30%)
8,681 ICTSL Indore City Transport Services
• Infrastructure provision• Passenger Information• Data Management• Dispute resolution• Public relation• Security services• Management of ticketing facility
Gross cost
Jaipur BRTS JnNURM, Jawahar Lal Nehru Urban Renewal Mission
4,690 Jaipur City Transport Services Limited (JCTSL)
• Bus operations and Maintenance
Pune BRTS and Pimpri Chichwad BRTS
JnNURM, Jawahar Lal Nehru Urban Renewal Mission and World Bank (SUTP)
N/A Common SPV, Pune Mahanagar Parivahan Mahamandal Limited(PMPML)
• Defining physical specification of the buses
• To estimate fleet requirement• Operation and Maintenance• Supply of ticket and passes• Reviewing the existing routes and altering them if
necessary• Surveying and planning of new routes and attend-
ing to the demands and suggestions of the passengers
• Management of bus station and depot• Assigning task to the working staff• To take measures to prevent accidents• Controlling workshop• Implementing regulations for adhering to pollution
laws and motor transport act
Gross cost
(Continued)
Page 9 of 23
Kathuria et al., Cogent Engineering (2016), 3: 1241168http://dx.doi.org/10.1080/23311916.2016.1241168
4.4. Service frequencyThe Pune BRTS is reported to have reasonably good operating frequency i.e. to the range of 30 s in peak hour, on the other hand Bhopal is having the lowest frequency i.e. 10 min approximately during peak hour. One important thing to note here is that aforesaid frequencies might be different if route wise estimation is done.
4.5. System reliabilityReliability of transit service has been recognized as a significant determinant of quality of service. Liu and Sinha (2007) discussed three types of bus reliability measures. These are: TTR, waiting time reli-ability and headway regularity based reliability.
Indian BRT systems majorly have median busways which separates the buses from the other mix traffic. Dedicated BRT is considered to be 90% on schedule (Deng & Nelson, 2013), this is reasonably higher than the conventional transit system. India majorly has composite or hybrid BRT which is partially dedicated up to a certain stretch and then changes into mix traffic transit service due to limitation of ROW or due to elevated stretch. This sudden change from segregated to mix traffic fa-cility results in reduced reliability of the system. Of the aforementioned three types of reliabilities, TTR and headway regularity can be estimated using the ITS data collected by the GPS fitted in the BRTS buses. There are various TTR measures as shown below:
4.5.1. Reliability measures based on travel timeTTR is a function of travel time variability (TTV) (Tu, 2008). Measuring TTV also gives an idea about TTR. Sekhar and Askura (2007) reviewed various reliability measures based on travel time, this study expressed that the reliability measures which exists in the literature are mainly based on central tendency and distribution of travel time. The statistical range measures and reliability measures are discussed in the following paragraphs
System Source of funding Funding sanctioned
(INR Millions)
Special purpose vehicle (SPV) or responsible agency
Responsibilities as given by SPV’s Revenue model
New Delhi BRTS
Government of National Capital Territory of Delhi
140/km Delhi Integrated Multi Modal Transit System (DIMTS)
• Operation and Management• Generate revenue through advertising• Meet operational revenues
Gross cost
Rajpath(BRTS Rajkot)
JnNURM, Jawahar Lal Nehru Urban Renewal Mission
1,100 Rajkot Rajpath Ltd (RRL)
• Run and to operate BRTS buses• To provide faster, secure, reliable, eco-friendly and
advanced Public Transportation• Decide fare, maintain bus lanes and maintain bus
shelters• Advertisement across BRTS route• To provides Pay & Park facilities to the citizen of
Rajkot
Net cost
Surat BRTS JnNURM N/A BRTS cell • Development of BRTS• Operation of BRTS
Gross cost
Table 3. (Continued)
Source: SPV website of different cities.
Page 10 of 23
Kathuria et al., Cogent Engineering (2016), 3: 1241168http://dx.doi.org/10.1080/23311916.2016.1241168
Table 4. Concept design of BRT cross sectionsIndian bus rapid transit system
ROW Salient features Cross section design
Ahmedabad BRTS 24 Type-median one way mid-block
2.250M-pedestrian pathway
1.750 M-utility parking
6.0 M-mixed traffic lane
0.25 M-physical separator
3.5 M-BRT lane
24 Type-median two way mid-block
2.250 M- pedestrian pathway
1.750 M-utility parking
6.0 M-mixed traffic lane
0.25 M-physical separator
7.3 M-BRT lane
24 Type-median two way with bus stop
1.6 M-pedestrian pathway
5.250 M-mixed traffic lane
0.25 M-physical separator
3.0 M-BRT lane
3.8 M-bus stop
30 Type-median two way mid-block
2.0 M-pedestrian pathway
8.5 M-mixed traffic lane
0.85 M-physical separator
7.3 M-BRT lane
40 Type-median two way mid-block
2.0 M-pedestrian pathway
2.0 M-cycle track
3.0 M-utility/parking
7.5 M-mixed traffic lane
0.85 M-physical separator
7.3 M-BRT lane
(Continued)
Page 11 of 23
Kathuria et al., Cogent Engineering (2016), 3: 1241168http://dx.doi.org/10.1080/23311916.2016.1241168
Indian bus rapid transit system
ROW Salient features Cross section design
40 Type-median two way
2.0 M to 3.0 M-pedestrian pathway
2.0 M-parking
7.5 M-mixed traffic lane
0.850 M-physical separator
7.3 M-BRT lane
40 Type-median two way
2.0 M to 3.0 M-pedestrian pathway
2.0 M-parking
9.15 M-mixed traffic lane
1 M-physical separator
3.5 M-BRT lane
3 M-bus stop
Type-median two way mid-block
3.0 M-service lane
4.5 M-activity area
3 M-cycle track
8.0 M-mixed traffic lane
1.0 M-physical separator
3.5 M-BRT lane
My bus(Bhopal BRTS) N/A N/A
Surat BRTS 60.0 M Type-median two way mid-block
3.0 M-central median
3.5 M-BRT lane
0.5 M-separator
9.0 M-carriageway
0.25 M-separator
5.25 M-activity area/ Parking/
Pedestrian pathways
7.0 M-service lane
1.0-footpath and street edge
Table 4. (Continued)
(Continued)

Page 12 of 23
Kathuria et al., Cogent Engineering (2016), 3: 1241168http://dx.doi.org/10.1080/23311916.2016.1241168
Indian bus rapid transit system
ROW Salient features Cross section design
45.0 M Type-median two way mid-block
3.0 M-central median
3.5 M-BRT lane
0.5 M-separator
7.25 M-carriageway
3.75 M-activity area/parking/pedestrian pathway
i Bus(Indore BRTS) 60.0 M Type-median two way
8.75 M-mixed traffic lane
0.350 M-physical separator
3.0 M-BRT lane
2.5 M-Bus Stop
3.0 M-service road
2.0 M-cycle track
40.0 M Type-median two way mid-block
6.7 M-mixed traffic lane
0.350 M-physical separator
3.0 M-BRT lane
3.5 M-service lane
Jaipur BRTS 32.0 M Type-median two way mid-block
2.5 M-pedestrian pathway
2.5 M-cycle track
7.0 M-carriageway
0.5 M-separator
7.0 M-two way bus lane
22.0 M Type-median two way mid block
1.5 M-pedestrian pathway
2.0 M-cycle track
7.0 M-carriageway (BRT with mixed traffic)
1.0 M-median
Pune BRTS 45.5 M Type-median two way mid block
1.07 M-pedestrian pathway I
1.80 M-pedestrian pathway II
2.50 M-cycle track
4.50 M-service lane
3.3 M-BRT lane
0.75 M-separator I
0.30 M-separator II
0.75 M-separator III
6.75 M-mix traffic carriageway
Table 4. (Continued)
(Continued)
Page 13 of 23
Kathuria et al., Cogent Engineering (2016), 3: 1241168http://dx.doi.org/10.1080/23311916.2016.1241168
Indian bus rapid transit system
ROW Salient features Cross section design
New Delhi BRTS 51.5 M Type-median two way mid block
3.2 M-bus Lane
6.85 M- mixed traffic carriageway
2.0 M-footpath
3.5 M-NMV track
10.M-service lane
33.5 Type-Kerb side two way mid block
10.5 M-BRT lane with mixed traffic lane
2.0 M-median
0.75 M-separator
2.50 M-NMV track
2.0 M-footpath
Rajpath (BRTS Rajkot) Type-two way bridge section
5.5 M-MV lane
2.0 M-cycle track
1.87 M-footpath
Bus lane-3.3 M
45 Type-two way
8.0 M MV lane
2.00 M cycle track
1.79 M foot path
4.5 M service road
Table 4. (Continued)
Source: SPV websites of different cities.
Coefficient of variation (Cv):It is ratio of standard deviation and mean and depicting dispersion of travel time distribution. This is expressed at Equation (1)
where CV is coefficient of variation during time window p and for D days, TTd,p is the mean travel time for time window p and on the day d and TTp is the average value of TTdp during time windows p. More is the value of CV more is the variation in TT and hence less in reliability.
(1)CV =
�
1
D
∑D
d=1(TTd,p − TTp)
TTp
Page 14 of 23
Kathuria et al., Cogent Engineering (2016), 3: 1241168http://dx.doi.org/10.1080/23311916.2016.1241168
95th percentile or planning time: The most commonly used measure of reliability is planning time which shows how bad the transit delay could be in terms of travel time. This measure is ideally suited for traveller information (Federal Highway Administration, 2006; Sekhar & Askura, 2007).
T90–T10: It is the difference of 90th percentile minus the 10th percentile value of travel time which indicates about the spread of the distribution. If this value comes out to be high then TTV is high and hence system reliability is low (Mazloumi, Currie, & Rose, 2010).
λvar: It represents as the ratio of 90th percentile minus 10th percentile divided by 50th percentile of travel time (Equation (2)). This measure gives an idea about the clear width of the distribution with respect to the median (Mazloumi et al., 2010; Van Lint & Zuylen, 2005).
λskew: It is the ratio of 90th percentile minus 50th percentile divided by 50th percentile minus 10th percentile (Equation (3)). This indicator is a measure of skew width of travel time variation (TTV) (Lint, Tu, & Van Zuylen, 2004; Van Lint & Zuylen, 2005). Larger value of this indicator means that the prob-ability of extreme travel time to occur is high.
Buffer time index: This is an indicator of travel time which represents extra time to ensure on time arrivals of the commuter trips (Federal Highway Administration, 2006). This extra time is considered to cater any unexpected delay in the trip. The index is expressed as percentage of buffer time to average travel time. Where buffer time is the difference of planning time and average travel time, this was expressed mathematically at Equation (4):
where TT is travel time and ATT is average travel time.
(2)�var =90th percentile TT − 50th percentile TT
50th percentile TT
(3)�skew =90th percentile TT − 50th percentile TT
50th percentile TT − 10th percentile TT
(4)Buffer Index (BI) = [95th percentile TT] − [ATT]∕ATT
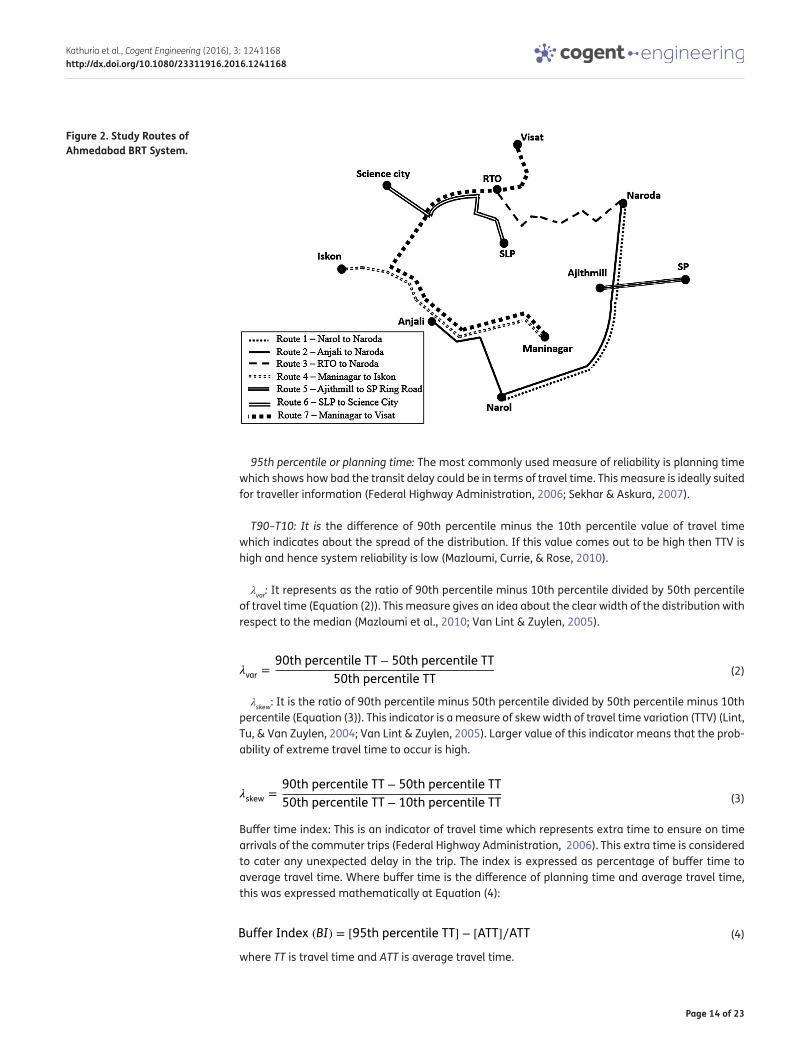
Figure 2. Study Routes of Ahmedabad BRT System.
Page 15 of 23
Kathuria et al., Cogent Engineering (2016), 3: 1241168http://dx.doi.org/10.1080/23311916.2016.1241168
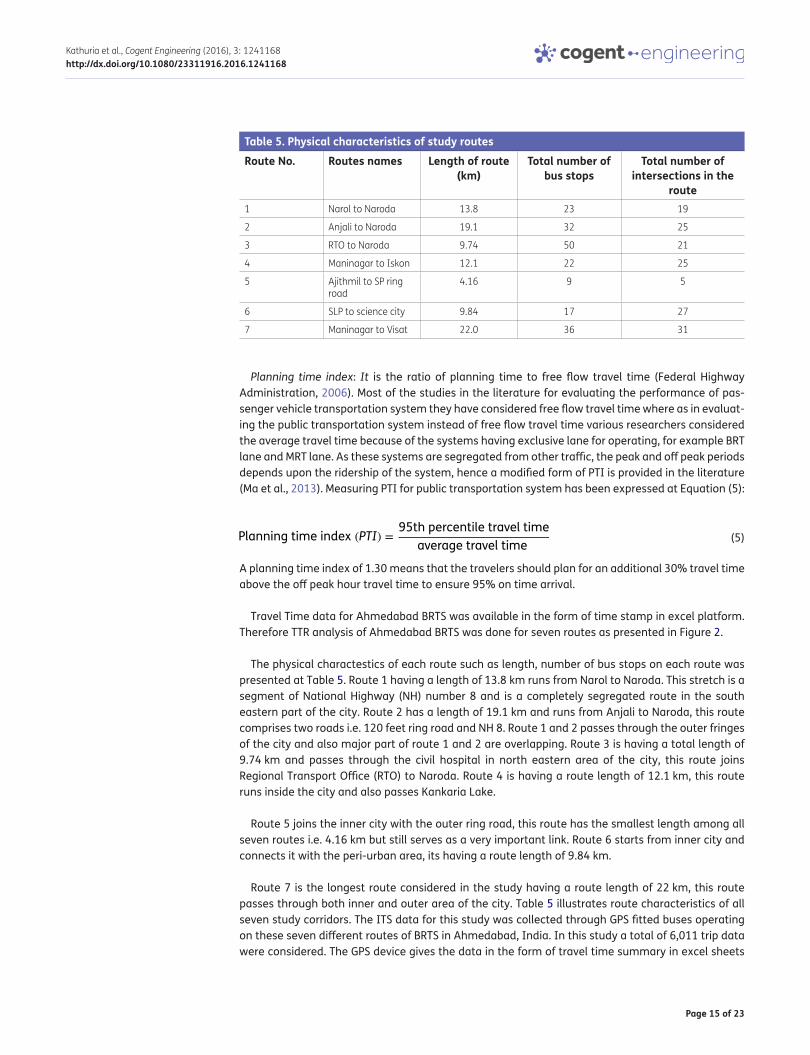
Table 5. Physical characteristics of study routesRoute No. Routes names Length of route
(km)Total number of
bus stopsTotal number of
intersections in the route
1 Narol to Naroda 13.8 23 19
2 Anjali to Naroda 19.1 32 25
3 RTO to Naroda 9.74 50 21
4 Maninagar to Iskon 12.1 22 25
5 Ajithmil to SP ring road
4.16 9 5
6 SLP to science city 9.84 17 27
7 Maninagar to Visat 22.0 36 31
Planning time index: It is the ratio of planning time to free flow travel time (Federal Highway Administration, 2006). Most of the studies in the literature for evaluating the performance of pas-senger vehicle transportation system they have considered free flow travel time where as in evaluat-ing the public transportation system instead of free flow travel time various researchers considered the average travel time because of the systems having exclusive lane for operating, for example BRT lane and MRT lane. As these systems are segregated from other traffic, the peak and off peak periods depends upon the ridership of the system, hence a modified form of PTI is provided in the literature (Ma et al., 2013). Measuring PTI for public transportation system has been expressed at Equation (5):
A planning time index of 1.30 means that the travelers should plan for an additional 30% travel time above the off peak hour travel time to ensure 95% on time arrival.
Travel Time data for Ahmedabad BRTS was available in the form of time stamp in excel platform. Therefore TTR analysis of Ahmedabad BRTS was done for seven routes as presented in Figure 2.
The physical charactestics of each route such as length, number of bus stops on each route was presented at Table 5. Route 1 having a length of 13.8 km runs from Narol to Naroda. This stretch is a segment of National Highway (NH) number 8 and is a completely segregated route in the south eastern part of the city. Route 2 has a length of 19.1 km and runs from Anjali to Naroda, this route comprises two roads i.e. 120 feet ring road and NH 8. Route 1 and 2 passes through the outer fringes of the city and also major part of route 1 and 2 are overlapping. Route 3 is having a total length of 9.74 km and passes through the civil hospital in north eastern area of the city, this route joins Regional Transport Office (RTO) to Naroda. Route 4 is having a route length of 12.1 km, this route runs inside the city and also passes Kankaria Lake.
Route 5 joins the inner city with the outer ring road, this route has the smallest length among all seven routes i.e. 4.16 km but still serves as a very important link. Route 6 starts from inner city and connects it with the peri-urban area, its having a route length of 9.84 km.
Route 7 is the longest route considered in the study having a route length of 22 km, this route passes through both inner and outer area of the city. Table 5 illustrates route characteristics of all seven study corridors. The ITS data for this study was collected through GPS fitted buses operating on these seven different routes of BRTS in Ahmedabad, India. In this study a total of 6,011 trip data were considered. The GPS device gives the data in the form of travel time summary in excel sheets
(5)Planning time index (PTI) =95th percentile travel time
average travel time
Page 16 of 23
Kathuria et al., Cogent Engineering (2016), 3: 1241168http://dx.doi.org/10.1080/23311916.2016.1241168
for the entire service period. Real departure and real arrival time for every route is collected by the device. Also stop wise departure and arrival details are collected for each route and the timing points of the devices were the bus stops on different routes.
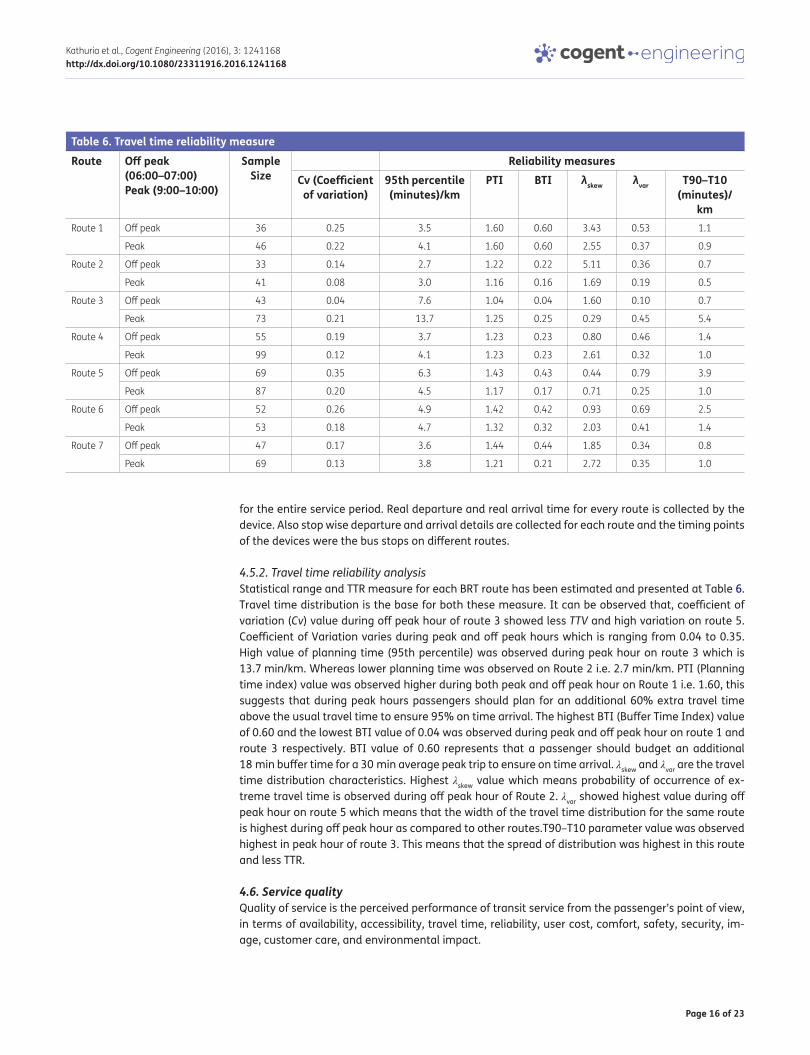
4.5.2. Travel time reliability analysisStatistical range and TTR measure for each BRT route has been estimated and presented at Table 6. Travel time distribution is the base for both these measure. It can be observed that, coefficient of variation (Cv) value during off peak hour of route 3 showed less TTV and high variation on route 5. Coefficient of Variation varies during peak and off peak hours which is ranging from 0.04 to 0.35. High value of planning time (95th percentile) was observed during peak hour on route 3 which is 13.7 min/km. Whereas lower planning time was observed on Route 2 i.e. 2.7 min/km. PTI (Planning time index) value was observed higher during both peak and off peak hour on Route 1 i.e. 1.60, this suggests that during peak hours passengers should plan for an additional 60% extra travel time above the usual travel time to ensure 95% on time arrival. The highest BTI (Buffer Time Index) value of 0.60 and the lowest BTI value of 0.04 was observed during peak and off peak hour on route 1 and route 3 respectively. BTI value of 0.60 represents that a passenger should budget an additional 18 min buffer time for a 30 min average peak trip to ensure on time arrival. λskew and λvar are the travel time distribution characteristics. Highest λskew value which means probability of occurrence of ex-treme travel time is observed during off peak hour of Route 2. λvar showed highest value during off peak hour on route 5 which means that the width of the travel time distribution for the same route is highest during off peak hour as compared to other routes.T90–T10 parameter value was observed highest in peak hour of route 3. This means that the spread of distribution was highest in this route and less TTR.
4.6. Service qualityQuality of service is the perceived performance of transit service from the passenger’s point of view, in terms of availability, accessibility, travel time, reliability, user cost, comfort, safety, security, im-age, customer care, and environmental impact.
Table 6. Travel time reliability measureRoute Off peak
(06:00–07:00) Peak (9:00–10:00)
Sample Size
Reliability measuresCv (Coefficient of variation)
95th percentile (minutes)/km
PTI BTI λskew λvar T90–T10 (minutes)/
kmRoute 1 Off peak 36 0.25 3.5 1.60 0.60 3.43 0.53 1.1
Peak 46 0.22 4.1 1.60 0.60 2.55 0.37 0.9
Route 2 Off peak 33 0.14 2.7 1.22 0.22 5.11 0.36 0.7
Peak 41 0.08 3.0 1.16 0.16 1.69 0.19 0.5
Route 3 Off peak 43 0.04 7.6 1.04 0.04 1.60 0.10 0.7
Peak 73 0.21 13.7 1.25 0.25 0.29 0.45 5.4
Route 4 Off peak 55 0.19 3.7 1.23 0.23 0.80 0.46 1.4
Peak 99 0.12 4.1 1.23 0.23 2.61 0.32 1.0
Route 5 Off peak 69 0.35 6.3 1.43 0.43 0.44 0.79 3.9
Peak 87 0.20 4.5 1.17 0.17 0.71 0.25 1.0
Route 6 Off peak 52 0.26 4.9 1.42 0.42 0.93 0.69 2.5
Peak 53 0.18 4.7 1.32 0.32 2.03 0.41 1.4
Route 7 Off peak 47 0.17 3.6 1.44 0.44 1.85 0.34 0.8
Peak 69 0.13 3.8 1.21 0.21 2.72 0.35 1.0
Page 17 of 23
Kathuria et al., Cogent Engineering (2016), 3: 1241168http://dx.doi.org/10.1080/23311916.2016.1241168
4.6.1. Quality criteria by different authorsLiterature proposed different indicators that are of user interest to set their perception about quality of service, few of them are security, speed, low cost and punctuality. Levinson et al. (2003) reported that user always want the system to be easily accessible, highly reliable, fast, comfortable and se-cure. Vuchic (2005) further reported a detailed discussion of attribute influencing passenger’s per-ception about a transit. He identifies few indicators influencing basic requirement of the passengers. Wright and Hook (2007) reported key attributes of excellence in public transit system like easily ac-cessible system, comfortable transit stations/stops, passenger safety, easily understandable route maps and trained and friendly driver and other staff. Sorg (2011) further contributed by developing an understanding about the attributes influencing the quality of service levels for an urban transit service. Comments on the service quality of Indian BRTS can be made on the basis of the various characteristics of different services. Many Indian BRTS have good monitoring system using closed circuit cameras that are installed at the stops considering the passenger safety in mind. Distinctive low floor buses running on BRT corridor in India creates a good image in the mind of passengers. Off board ticketing system in few BRTS helps in reducing the dwell time and also gives a greater LOS to the passengers because they don’t have to stand in crowd near the entry gate for buying the ticket just like how it is happening in conventional transit service. India has good IPT system in almost every city in which BRT is in operation. IPT acts as a good feeder mode for achieving a higher acces-sibility for BRTS. Further in Table 5 it can be easily seen in the salient features of different cross sec-tions that all BRT corridors have space for cycle track and pedestrian pathways which increases the accessibility to the BRT corridors.
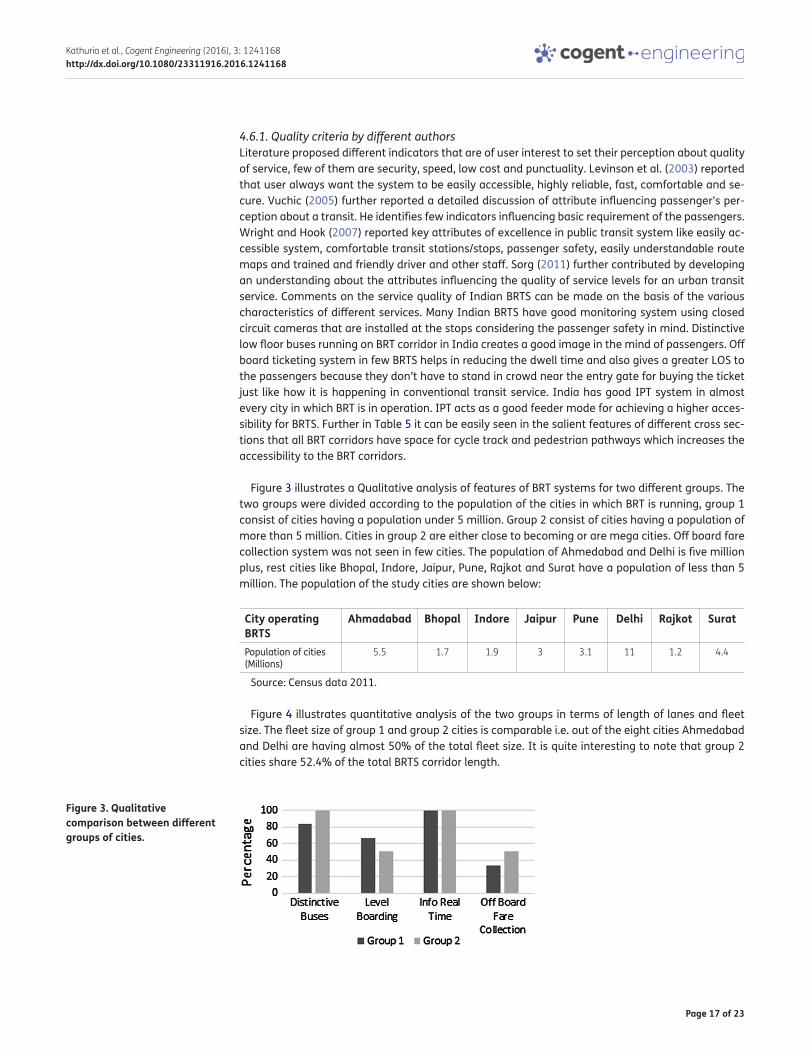
Figure 3 illustrates a Qualitative analysis of features of BRT systems for two different groups. The two groups were divided according to the population of the cities in which BRT is running, group 1 consist of cities having a population under 5 million. Group 2 consist of cities having a population of more than 5 million. Cities in group 2 are either close to becoming or are mega cities. Off board fare collection system was not seen in few cities. The population of Ahmedabad and Delhi is five million plus, rest cities like Bhopal, Indore, Jaipur, Pune, Rajkot and Surat have a population of less than 5 million. The population of the study cities are shown below:
City operating BRTS
Ahmadabad Bhopal Indore Jaipur Pune Delhi Rajkot Surat
Population of cities (Millions)
5.5 1.7 1.9 3 3.1 11 1.2 4.4
Source: Census data 2011.
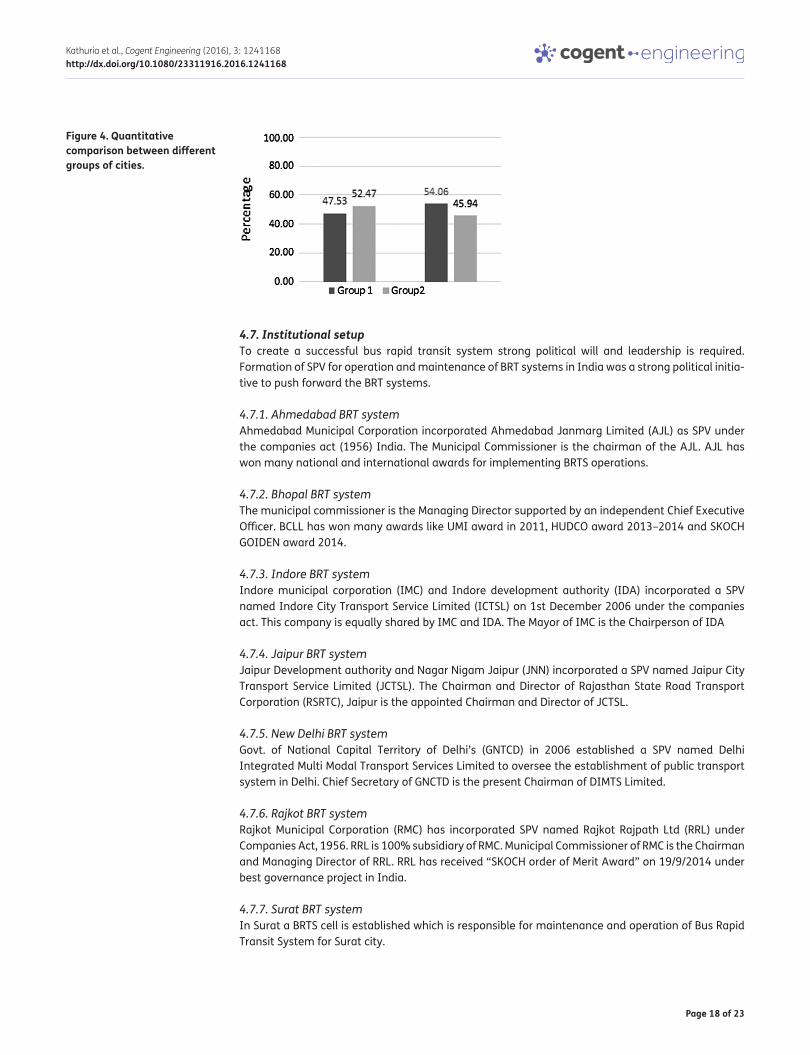
Figure 4 illustrates quantitative analysis of the two groups in terms of length of lanes and fleet size. The fleet size of group 1 and group 2 cities is comparable i.e. out of the eight cities Ahmedabad and Delhi are having almost 50% of the total fleet size. It is quite interesting to note that group 2 cities share 52.4% of the total BRTS corridor length.
Figure 3. Qualitative comparison between different groups of cities.
Page 18 of 23
Kathuria et al., Cogent Engineering (2016), 3: 1241168http://dx.doi.org/10.1080/23311916.2016.1241168
4.7. Institutional setupTo create a successful bus rapid transit system strong political will and leadership is required. Formation of SPV for operation and maintenance of BRT systems in India was a strong political initia-tive to push forward the BRT systems.
4.7.1. Ahmedabad BRT systemAhmedabad Municipal Corporation incorporated Ahmedabad Janmarg Limited (AJL) as SPV under the companies act (1956) India. The Municipal Commissioner is the chairman of the AJL. AJL has won many national and international awards for implementing BRTS operations.
4.7.2. Bhopal BRT systemThe municipal commissioner is the Managing Director supported by an independent Chief Executive Officer. BCLL has won many awards like UMI award in 2011, HUDCO award 2013–2014 and SKOCH GOIDEN award 2014.
4.7.3. Indore BRT systemIndore municipal corporation (IMC) and Indore development authority (IDA) incorporated a SPV named Indore City Transport Service Limited (ICTSL) on 1st December 2006 under the companies act. This company is equally shared by IMC and IDA. The Mayor of IMC is the Chairperson of IDA
4.7.4. Jaipur BRT systemJaipur Development authority and Nagar Nigam Jaipur (JNN) incorporated a SPV named Jaipur City Transport Service Limited (JCTSL). The Chairman and Director of Rajasthan State Road Transport Corporation (RSRTC), Jaipur is the appointed Chairman and Director of JCTSL.
4.7.5. New Delhi BRT systemGovt. of National Capital Territory of Delhi’s (GNTCD) in 2006 established a SPV named Delhi Integrated Multi Modal Transport Services Limited to oversee the establishment of public transport system in Delhi. Chief Secretary of GNCTD is the present Chairman of DIMTS Limited.
4.7.6. Rajkot BRT systemRajkot Municipal Corporation (RMC) has incorporated SPV named Rajkot Rajpath Ltd (RRL) under Companies Act, 1956. RRL is 100% subsidiary of RMC. Municipal Commissioner of RMC is the Chairman and Managing Director of RRL. RRL has received “SKOCH order of Merit Award” on 19/9/2014 under best governance project in India.
4.7.7. Surat BRT systemIn Surat a BRTS cell is established which is responsible for maintenance and operation of Bus Rapid Transit System for Surat city.
Figure 4. Quantitative comparison between different groups of cities.
Page 19 of 23
Kathuria et al., Cogent Engineering (2016), 3: 1241168http://dx.doi.org/10.1080/23311916.2016.1241168
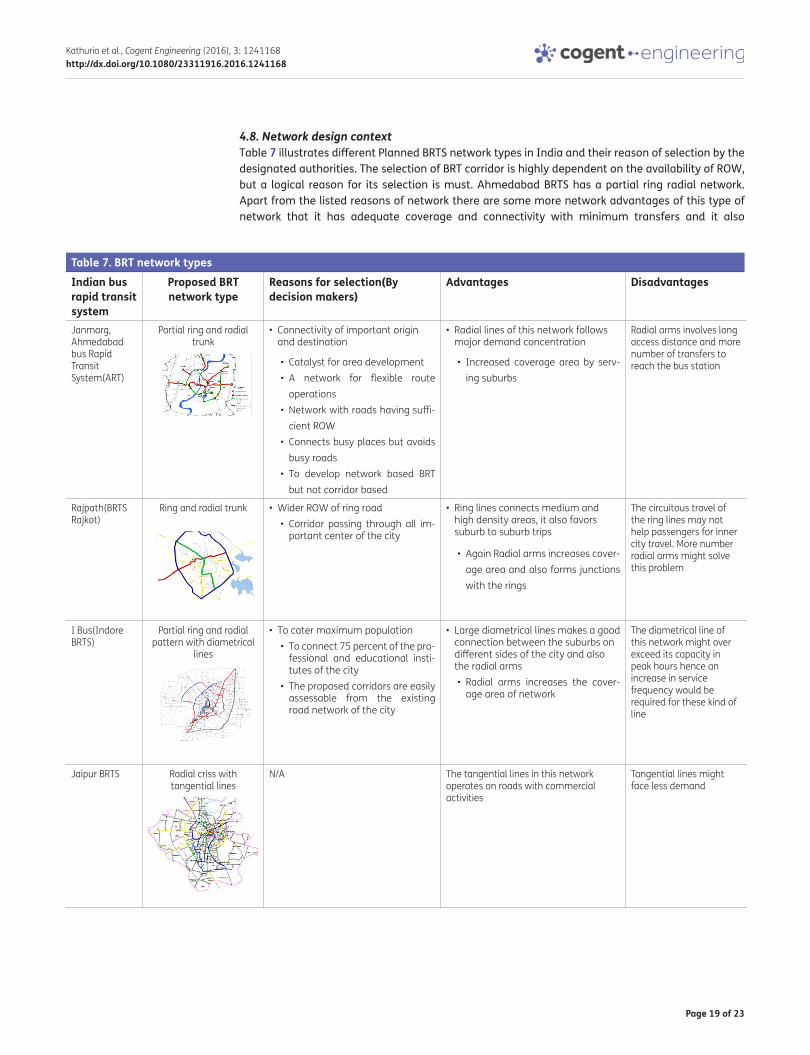
Table 7. BRT network typesIndian bus rapid transit system
Proposed BRT network type
Reasons for selection(By decision makers)
Advantages Disadvantages
Janmarg, Ahmedabad bus Rapid Transit System(ART)
Partial ring and radial trunk
• Connectivity of important origin and destination
• Catalyst for area development• A network for flexible route
operations• Network with roads having suffi-
cient ROW• Connects busy places but avoids
busy roads• To develop network based BRT
but not corridor based
• Radial lines of this network follows major demand concentration
• Increased coverage area by serv-ing suburbs
Radial arms involves long access distance and more number of transfers to reach the bus station
Rajpath(BRTS Rajkot)
Ring and radial trunk • Wider ROW of ring road• Corridor passing through all im-
portant center of the city
• Ring lines connects medium and high density areas, it also favors suburb to suburb trips
• Again Radial arms increases cover-age area and also forms junctions with the rings
The circuitous travel of the ring lines may not help passengers for inner city travel. More number radial arms might solve this problem
I Bus(Indore BRTS)
Partial ring and radial pattern with diametrical
lines
• To cater maximum population• To connect 75 percent of the pro-
fessional and educational insti-tutes of the city
• The proposed corridors are easily assessable from the existing road network of the city
• Large diametrical lines makes a good connection between the suburbs on different sides of the city and also the radial arms• Radial arms increases the cover-
age area of network
The diametrical line of this network might over exceed its capacity in peak hours hence an increase in service frequency would be required for these kind of line
Jaipur BRTS Radial criss with tangential lines
N/A The tangential lines in this network operates on roads with commercial activities
Tangential lines might face less demand
4.8. Network design contextTable 7 illustrates different Planned BRTS network types in India and their reason of selection by the designated authorities. The selection of BRT corridor is highly dependent on the availability of ROW, but a logical reason for its selection is must. Ahmedabad BRTS has a partial ring radial network. Apart from the listed reasons of network there are some more network advantages of this type of network that it has adequate coverage and connectivity with minimum transfers and it also
Page 20 of 23
Kathuria et al., Cogent Engineering (2016), 3: 1241168http://dx.doi.org/10.1080/23311916.2016.1241168
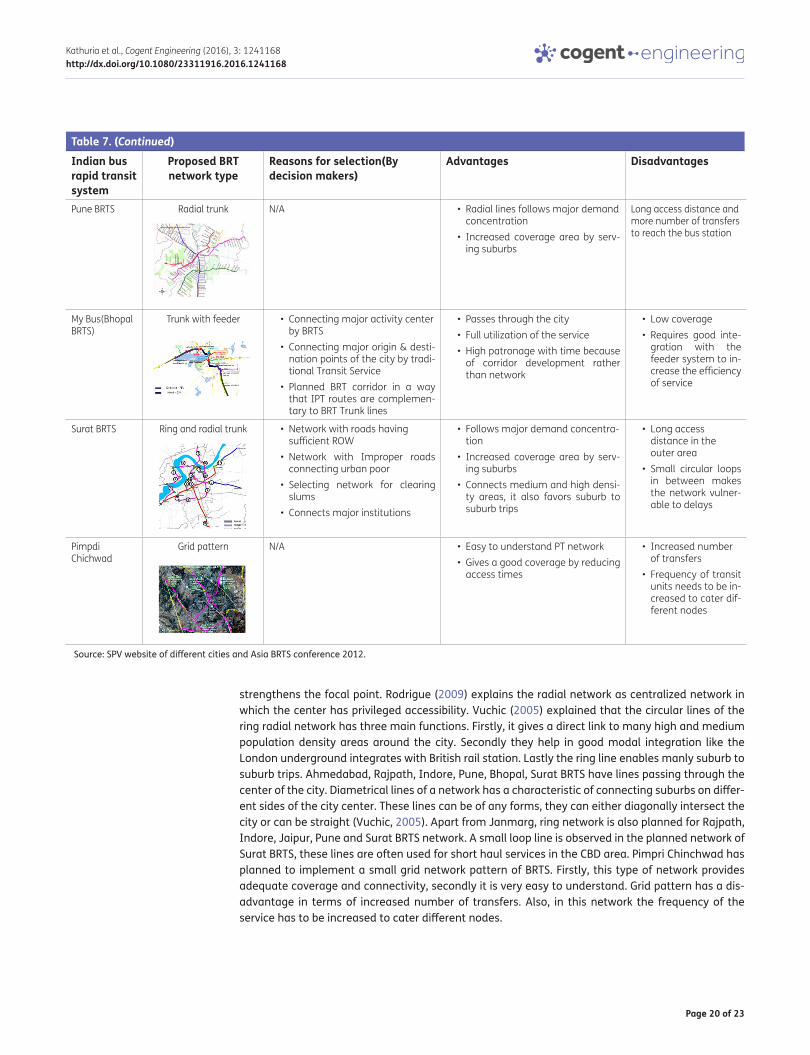
strengthens the focal point. Rodrigue (2009) explains the radial network as centralized network in which the center has privileged accessibility. Vuchic (2005) explained that the circular lines of the ring radial network has three main functions. Firstly, it gives a direct link to many high and medium population density areas around the city. Secondly they help in good modal integration like the London underground integrates with British rail station. Lastly the ring line enables manly suburb to suburb trips. Ahmedabad, Rajpath, Indore, Pune, Bhopal, Surat BRTS have lines passing through the center of the city. Diametrical lines of a network has a characteristic of connecting suburbs on differ-ent sides of the city center. These lines can be of any forms, they can either diagonally intersect the city or can be straight (Vuchic, 2005). Apart from Janmarg, ring network is also planned for Rajpath, Indore, Jaipur, Pune and Surat BRTS network. A small loop line is observed in the planned network of Surat BRTS, these lines are often used for short haul services in the CBD area. Pimpri Chinchwad has planned to implement a small grid network pattern of BRTS. Firstly, this type of network provides adequate coverage and connectivity, secondly it is very easy to understand. Grid pattern has a dis-advantage in terms of increased number of transfers. Also, in this network the frequency of the service has to be increased to cater different nodes.
Indian bus rapid transit system
Proposed BRT network type
Reasons for selection(By decision makers)
Advantages Disadvantages
Pune BRTS Radial trunk N/A • Radial lines follows major demand concentration
• Increased coverage area by serv-ing suburbs
Long access distance and more number of transfers to reach the bus station
My Bus(Bhopal BRTS)
Trunk with feeder • Connecting major activity center by BRTS
• Connecting major origin & desti-nation points of the city by tradi-tional Transit Service
• Planned BRT corridor in a way that IPT routes are complemen-tary to BRT Trunk lines
• Passes through the city• Full utilization of the service• High patronage with time because
of corridor development rather than network
• Low coverage• Requires good inte-
gration with the feeder system to in-crease the efficiency of service
Surat BRTS Ring and radial trunk • Network with roads having sufficient ROW
• Network with Improper roads connecting urban poor
• Selecting network for clearing slums
• Connects major institutions
• Follows major demand concentra-tion
• Increased coverage area by serv-ing suburbs
• Connects medium and high densi-ty areas, it also favors suburb to suburb trips
• Long access distance in the outer area
• Small circular loops in between makes the network vulner-able to delays
Pimpdi Chichwad
Grid pattern N/A • Easy to understand PT network• Gives a good coverage by reducing
access times
• Increased number of transfers
• Frequency of transit units needs to be in-creased to cater dif-ferent nodes
Table 7. (Continued)
Source: SPV website of different cities and Asia BRTS conference 2012.
Page 21 of 23
Kathuria et al., Cogent Engineering (2016), 3: 1241168http://dx.doi.org/10.1080/23311916.2016.1241168
Bhopal BRT is a single corridor. This type of corridor can achieve adequate coverage by a comple-menting feeder system. A well connected feeder system can reduce the access time to the corridor. It also has a design to serve more number of people i.e. it is designed to cater high peak hour peak direction traffic (PHPDT).
5. ConclusionThis paper attempts to review implementation of BRTS in India. Between 2008 and 2015 BRT system has grown in its implementation from two cities to eleven cities. The main findings of the study are summarized as following:
• Ridership of Indian BRTS totals 127 million p.a. This ridership is dominated by the Ahmedabad BRTS which carries almost 31 percent of the total daily passengers. Principle factors affecting ridership are network coverage, low speed, stop spacing, land use, accessibility, feeder service etc.
• Indian BRTS is majorly categorized in two types of system i.e. open and closed system. Both the systems have certain characteristics as mentioned in paper. The best working example of a closed system in India is Ahmedabad BRTS having the largest network length of 82 km.
• On observing the system summary it was seen that average achieved operating speed of Indian BRTS is ranging from 18 to 24 km/hr. Almost all BRT stops of different systems are located before intersection. Ahmedabad BRTS has in total 127 stations which are the maximum number of sta-tions in a city BRT system of India. The stop spacing of BRTS is ranging between 525 and 710 meters for all the systems.
• To improve the performance of the system off board ticketing system is being adopted. This fare collection method reduces the passenger to passenger interaction at the gates hence helps in reducing the dwell time and the total travel time.
• In terms of regulatory context, India adopted a major reform by formation of SPV companies in different cities. These SPV’s have major responsibility of operations, increasing reliability and social marketing.
• In India majorly Gross Cost revenue model is adopted. These models are of three types i.e. the kilometre based model, contract based and passenger based. Out of the three the kilometre based model is easy to understand and also is highly acceptable because it is a cost/km model. Apart from its implementation in Janmarg BRTS it is also implemented in Helsinki (Finland) and Gote Borg (Sweden).
• Different types of carriageway concept designs are implemented in BRTS of India. This study presented various carriageway design concepts for one way and two way BRT system. The most commonly adopted carriageway design is for a ROW of 24 and 40 m.
• On assessing the operational characteristics of the system it was observed that Ahmedabad and Delhi have the highest and the lowest average operating speeds respectively. Pune and Bhopal BRTS have the highest and the lowest frequencies respectively.
• BRTS Reliability measures are majorly divided into three categories i.e. waiting time, headway regularity and TTR measure. Out of these measure TTR measures were used in this study.
• Seven ring and radial routes of the selected system (Ahmedabad BRTS) were used for estimating the reliability based performance of the routes. Reliability Analysis was done only for one system as ITS data of the other systems were not easily available.
• Planned network design for BRTS of different cities is illustrated in the paper. Ring and radial pat-tern is majorly planned for BRTS network of different cities. This type of network works efficiently because it gives a direct link to high and medium population density area around the city, helps in good modal integration and encourage suburb to suburb trips. The radial network also gives center of the city a privileged accessibility.
Page 22 of 23
Kathuria et al., Cogent Engineering (2016), 3: 1241168http://dx.doi.org/10.1080/23311916.2016.1241168
AcknowledgementThis research is part of a Doctoral Thesis which is supported by the scholarship from Ministry of Human Resource and Development (MoHRD), India. We would like to make a special thanks to Ahmedabad Janmarg Limited for their continuous support by sharing the BRTS Cell data and giving us permission for carrying out various surveys on the BRTS corridor of Ahemedabad, India.
FundingThe authors received no direct funding for this research.
Author detailsAnkit Kathuria1
E-mail: [email protected] Parida1
E-mail: [email protected]. Ravi Sekhar2
E-mail: [email protected] Sharma1
E-mail: [email protected] ID: http://orcid.org/0000-0002-6838-09141 Civil Engineering Department, Indian Institute of Technology
Roorkee, Roorkee, India.2 Transport Planning Division, Central Road Research Institute,
CRRI-CSIR Mathura Road, Delhi, India.
Citation informationCite this article as: A review of bus rapid transit implementation in India, Ankit Kathuria, Manoranjan Parida, Ch. Ravi Sekhar & Anshuman Sharma, Cogent Engineering (2016), 3: 1241168.
Cover imageSource: Author.
ReferencesAbdelghany, K. F., Mahmassani, H. S., & Abdelghany, A. F.
(2007). A modeling framework for bus rapid transit operations evaluation and service planning. Transportation Planning and Technology, 30, 571–591. http://dx.doi.org/10.1080/03081060701698219
Bhopal City Link Limited. (2015). The BRTS Bhopal. Retrieved January 2015, from http://www.mybusbhopal.in
Bitterman, A., & Hess, D. B. (2008). Bus rapid transit identity meets universal design. Disability and Society, 23, 445–459. http://dx.doi.org/10.1080/09687590802177015
Buluran, J., Fillone, A., Fukuda, A., & Jaensirisak, S. (2013). Issues regarding bus rapid transit introduction to small and medium size cities of developing countries in East Asian Region. Proceedings of the Eastern Asia Society for Transportation Studies, 9, 256.
Cervero, R., & Kang, C. D. (2011). Bus rapid transit impacts on land uses and land values in Seoul, Korea. Transport Policy, 18, 102–116. http://dx.doi.org/10.1016/j.tranpol.2010.06.005
Currie, G., & Delbosc, A. (2014). Assessing bus rapid transit system performance in Australasia. Research in Transportation Economics, 48, 142–151. http://dx.doi.org/10.1016/j.retrec.2014.09.012
Darido, G. (2006). Perspectives on bus rapid transit (BRT) developments in China. For USA Department of Transportation and the US Federal Transit Administration. Washington, DC: National Bus Rapid Transit Institute.
Delmelle, E. C., & Casas, I. (2012). Evaluating the spatial equity of bus rapid transit-based accessibility patterns in a developing country: The case of Cali, Colombia. Transport Policy, 20, 36–46. http://dx.doi.org/10.1016/j.tranpol.2011.12.001
Deng, T., & Nelson, J. D. (2011). Recent developments in bus rapid transit: A review of the literature. Transport Reviews, 31, 69–96. http://dx.doi.org/10.1080/01441647.2010.492455
Deng, T., & Nelson, J. D. (2013). Bus rapid transit implementation in Beijing: An evaluation of performance and impacts. Research in Transportation Economics, 39, 108–113. http://dx.doi.org/10.1016/j.retrec.2012.06.002
Federal Highway Administration. (2006). Travel time reliability: Making it there on time, all the time. US Department of Transportation. Retrieved January 2006, from http://www.ops.fhwa.dot.gov/publications/tt_reliability/index.htm
Gandhi, S. (2015, January 26). Which BRT do we need? Governance Now. Retrieved from http://www.governancenow.com
Gandhi, S., Tiwari, G., & Fazio, J. (2013). Comparative evaluation of alternate Bus Rapid Transit System planning, operation and design options. Proceedings of Eastern Asia Society for Transportation Studies, 10, 1292–1310.
Godavarthi, G. R., Chalumuri, R. S., & Velmurugun, S. (2014). Measuring the performance of bus rapid-transit transitways based on volume by capacity ratio. Journal of Transportation Engineering, ASCE, 140(10), Article ID 04014049. doi:10.1061/(ASCE)TE.1943-5436.0000698
Hensher, D. A., & Golob, T. F. (2008). Bus rapid transit systems: A comparative assessment. Transportation, 35, 501–518. http://dx.doi.org/10.1007/s11116-008-9163-y
Hidalgo, D., Lleras, G., & Hernández, E. (2013). Methodology for calculating passenger capacity in bus rapid transit systems: Application to the TransMilenio system in Bogotá, Colombia. Research in Transportation Economics, 39, 139–142. http://dx.doi.org/10.1016/j.retrec.2012.06.006
Hidalgo, D., & Muñoz, J. C. (2014). A review of technological improvements in bus rapid transit and buses with high level of service(BHLS). Public Transport, 6, 185–213.
Hinebaugh, D. & Diaz, R. B. (2009). Characteristics of Bus Rapid Transit for Decision-Making (CBRT). Tampa, FL: National Bus Rapid Transit Institute.
Janmarg. (2015). Retrieved January 2015, from Ahmedabad Janmarg Limited: http://www.ahmedabadbrts.org
Jiang, Y., Christopher Zegras, P., & Mehndiratta, S. (2012). Walk the line: Station context, corridor type and bus rapid transit walk access in Jinan China. Journal of Transport Geography, 20, 1–14. http://dx.doi.org/10.1016/j.jtrangeo.2011.09.007
Levinson, H. S., Zimmerman, S., Rutherford, S. C., & Eric, B. (2003). Bus rapid transit implementation guidelines (TCRP Report 90, Vol. II). Washington, DC: Transportation Research Board.
Li, B., & Hino, Y. (2013). The comprehensive evaluation of BRT system based on introduced examples in major cities of China. Proceedings of the Eastern Asia Society for Transportation Studies, 19, 12.
Li, F., Duan, Z., & Yang, D. (2012). Dwell time estimation models for bus rapid transit stations. Journal of Modern Transportation, 20, 168–177. http://dx.doi.org/10.1007/BF03325795
Lin, Z., & Wu, J. Q. (2007). Summary of the application effect of bus rapid transit at Beijing South-Centre Corridor of China. Journal of Transportation Systems Engineering and Information Technology, 7, 137–142. http://dx.doi.org/10.1016/S1570-6672(07)60034-8
Lint, V. J. W. C., Tu, H. & Van Zuylen, H. J. (2004). Travel time reliability on freeways. Proceeding of 10th World Conference on Transport Research, (WCTR). CDROM Istanbul
Liu, R., & Sinha, S. (2007). Modelling urban bus service and passenger reliability. Third International Symposium on Transportation Network Reliability, Hague.
Ma, Z., Ferreira, L., & Mesbah, M. (2013). A framework for the development of bus service reliability measures. Proceedings of Australian Transport Research Forum, Brisbane.
Page 23 of 23
Kathuria et al., Cogent Engineering (2016), 3: 1241168http://dx.doi.org/10.1080/23311916.2016.1241168
© 2016 The Author(s). This open access article is distributed under a Creative Commons Attribution (CC-BY) 4.0 license.You are free to: Share — copy and redistribute the material in any medium or format Adapt — remix, transform, and build upon the material for any purpose, even commercially.The licensor cannot revoke these freedoms as long as you follow the license terms.
Under the following terms:Attribution — You must give appropriate credit, provide a link to the license, and indicate if changes were made. You may do so in any reasonable manner, but not in any way that suggests the licensor endorses you or your use. No additional restrictions You may not apply legal terms or technological measures that legally restrict others from doing anything the license permits.
Cogent Engineering (ISSN: 2331-1916) is published by Cogent OA, part of Taylor & Francis Group. Publishing with Cogent OA ensures:• Immediate, universal access to your article on publication• High visibility and discoverability via the Cogent OA website as well as Taylor & Francis Online• Download and citation statistics for your article• Rapid online publication• Input from, and dialog with, expert editors and editorial boards• Retention of full copyright of your article• Guaranteed legacy preservation of your article• Discounts and waivers for authors in developing regionsSubmit your manuscript to a Cogent OA journal at www.CogentOA.com
Mahadevia, Joshi, R., & Datey, A. (2012). UNEP RISO centre report on low-carbon mobility in India and the challenges of social inclusion: Bus rapid transit (BRT) case studies in India.
Mazloumi, E., Currie, G., & Rose, G. (2010). Using GPS data to gain insight into public transport travel time variability. Journal of Transportation Engineering, 136, 623–631. http://dx.doi.org/10.1061/(ASCE)TE.1943-5436.0000126
Nikitas, A., & Karlsson, M. (2015). A worldwide state-of-the-art analysis for bus rapid transit: Looking for the success formula. Journal of Public Transportation, 18(1), 1–33. http://dx.doi.org/10.5038/2375-0901
Ratchathani, U., & Mai, C. (2013). Development of bus rapid transit (BRT) in Khon Kaen Thailand. Proceedings of the Eastern Asia Society for Transportation Studies.
Rodrigue, C. (2009). The geography of transport systems (2nd ed., p. 416). New York, NY: Routledge.
Satiennam, T., & Jaensirisak, S. (2013). Potentials for modal shift towards bus rapid transit (BRT) in an Asian developing city. Proceedings of the Eastern Asia Society for Transportation Studies.
Sekhar, R., & Askura, Y. (2007). Measuring travel time reliability of transportation system. Indian Highways, 35, 61–72.
Sorg, D. (2011). Bus rapid transit systems and beyond (Masters Thesis). pp. 1–32). Swiss Federal Institute of Technology, Zurich.
Talati, V., & Talati, A. (2014). Issues & challenges in private sector participation in Indian. Journal of Applied Research, 4, 219–221.
Transit Capacity and Quality of Service Manual. (2013). Transit Capacity and Quality of 2 Service Manual (TCRP Report 165). Prepared for Transit Cooperative Research Program, Transportation Kittelson Associates, Portland, OR.
Tsao, H.-S. J., Wei, W., & Pratama, A. (2009). Operational feasibility of one-dedicated-lane bus rapid transit/light rail systems. Transportation Planning and Technology, 32, 239–260. http://dx.doi.org/10.1080/03081060903017085
Tu, H. (2008). Measuring travel time reliability on freeways (Phd TRAIL Thesis). Delft University of Technology, Delft.
Van Lint, J. W. C., & Zuylen, H. J. (2005). Monitoring and predicting freeway travel time reliability: Using width and skew of day-to-day travel time distribution (Transportation Research Record 1917, pp. 54–62). Washington, DC: Transportation Research Board.
Vuchic, V. (2005). Urban transit: Operations, Planning and Economics. Hoboken, NJ: John Wiley & Sons.
Wöhrnschimmel, H., Zuk, M., Martínez-Villa, G., Cerón, J., Cárdenas, B., Rojas-Bracho, L., & Fernández-Bremauntz, A. (2008). The impact of a Bus Rapid Transit system on commuters' exposure to Benzene, CO, PM2.5 and PM10 in Mexico City. Atmospheric Environment, 42, 8194–8203. http://dx.doi.org/10.1016/j.atmosenv.2008.07.062
Wright, L., & Hook, W. (2007). Bus rapid transit planning guide (pp. 1-33). New York, NY: Institute of Transport and Development Policy - ITDP and GTZ.
Zimmerman, S., & Agarwal, O. P. (2012). International experience in bus rapid transit (BRT) implementation: Synthesis of lessons learned from Lagos, Johannesburg, Jakarta, Delhi, and Ahmedabad (World Bank Report). 1–67.
Zou, P., Li, Z., & Li, M. (2012). Real-time arterial performance measurement using BRT probe data and signal timing data. Journal of Transportation Systems Engineering and Information Technology, 12, 24–30.