A review of advanced air distribution methods - theory ...
47
General rights Copyright and moral rights for the publications made accessible in the public portal are retained by the authors and/or other copyright owners and it is a condition of accessing publications that users recognise and abide by the legal requirements associated with these rights. Users may download and print one copy of any publication from the public portal for the purpose of private study or research. You may not further distribute the material or use it for any profit-making activity or commercial gain You may freely distribute the URL identifying the publication in the public portal If you believe that this document breaches copyright please contact us providing details, and we will remove access to the work immediately and investigate your claim. Downloaded from orbit.dtu.dk on: Oct 03, 2021 A review of advanced air distribution methods - theory, practice, limitations and solutions Yang, B.; Melikov, A.K.; Kabanshi, A.; Zhang, C.; Bauman, F.S.; Cao, G.; Awbi, H.; Wigö, H.; Niu, J.; Cheong, K.W.D. Total number of authors: 21 Published in: Energy and Buildings Link to article, DOI: 10.1016/j.enbuild.2019.109359 Publication date: 2019 Document Version Peer reviewed version Link back to DTU Orbit Citation (APA): Yang, B., Melikov, A. K., Kabanshi, A., Zhang, C., Bauman, F. S., Cao, G., Awbi, H., Wigö, H., Niu, J., Cheong, K. W. D., Tham, K. W., Sandberg, M., Nielsen, P. V., Kosonen, R., Yao, R., Kato, S., Sekhar, S. C., Schiavon, S., Karimipanah, T., ... Lin, Z. (2019). A review of advanced air distribution methods - theory, practice, limitations and solutions. Energy and Buildings, 202, [109359]. https://doi.org/10.1016/j.enbuild.2019.109359
Transcript of A review of advanced air distribution methods - theory ...

General rights Copyright and moral rights for the publications made accessible in the public portal are retained by the authors and/or other copyright owners and it is a condition of accessing publications that users recognise and abide by the legal requirements associated with these rights.
Users may download and print one copy of any publication from the public portal for the purpose of private study or research.
You may not further distribute the material or use it for any profit-making activity or commercial gain
You may freely distribute the URL identifying the publication in the public portal If you believe that this document breaches copyright please contact us providing details, and we will remove access to the work immediately and investigate your claim.
Downloaded from orbit.dtu.dk on: Oct 03, 2021
A review of advanced air distribution methods - theory, practice, limitations andsolutions
Yang, B.; Melikov, A.K.; Kabanshi, A.; Zhang, C.; Bauman, F.S.; Cao, G.; Awbi, H.; Wigö, H.; Niu, J.;Cheong, K.W.D.Total number of authors:21
Published in:Energy and Buildings
Link to article, DOI:10.1016/j.enbuild.2019.109359
Publication date:2019
Document VersionPeer reviewed version
Link back to DTU Orbit
Citation (APA):Yang, B., Melikov, A. K., Kabanshi, A., Zhang, C., Bauman, F. S., Cao, G., Awbi, H., Wigö, H., Niu, J., Cheong,K. W. D., Tham, K. W., Sandberg, M., Nielsen, P. V., Kosonen, R., Yao, R., Kato, S., Sekhar, S. C., Schiavon,S., Karimipanah, T., ... Lin, Z. (2019). A review of advanced air distribution methods - theory, practice, limitationsand solutions. Energy and Buildings, 202, [109359]. https://doi.org/10.1016/j.enbuild.2019.109359
A review of advanced air distribution methods - theory, practice, limitations and solutions
B. Yang1,2,*, A. K. Melikov3, A. Kabanshi4, C. Zhang5, F. S. Bauman6, G. Cao7, H. Awbi8, H.Wigö4, J. Niu9, K.W. D. Cheong10, K. W. Tham10, M. Sandberg4, P. V. Nielsen5, R. Kosonen11,12, R. Yao8, S. Kato13, S. C. Sekhar10, S. Schiavon6, T. Karimipanah4, X. Li14, Z. Lin15
1School of Building Services Science and Engineering, Xi’an University of Architecture and Technology, Xi’an, 710055, China
2Department of Applied Physics and Electronics, Umeå University, SE-901 87 Umeå, Sweden 3International Centre for Indoor Environment and Energy, Department of Civil Engineering, Technical
University of Denmark, 2800 Kgs, Denmark 4Ventilation and Air Quality Centre for Built Environment, University of Gävle, SE-801 76 Gävle, Sweden 5Department of Civil Engineering, Aalborg University, Aalborg DK-9220, Denmark 6Center for the Built Environment, University of California, Berkeley, CA 94720, USA 7Department of Energy and Process, Norwegian University of Science and Technology, KolbjørnHejesVei 1B,
NO-7491 Trondheim, Norway 8School of Construction Management and Engineering, University of Reading, UK 9School of Architecture, Design and Planning, The University of Sydney, Australia 10Department of Building, School of Design and Environment, National University of Singapore, 117566,
Singapore 11Department of Mechanical Engineering, School of Engineering, Aalto University, Sähkömiehentie 4, 02150
Espoo, Finland 12College of Urban Construction, Nanjing Tech University, Nanjing 210009, China 13Institute of Industrial Science, The University of Tokyo, Tokyo, 153-8505, Japan 14Department of Building Science, School of Architecture, Tsinghua University, Beijing, 100084, China 15Division of Building Science and Technology, City University of Hong Kong, Hong Kong, China
Corresponding email: [email protected] (B. Yang).
Abstract Ventilation and air distribution methods are important for indoor thermal environments and air quality. Effective distribution of airflow for indoor built environments with the aim of simultaneously offsetting thermal and ventilation loads in an energy efficient manner has been the research focus in the past several decades. Based on airflow characteristics, ventilation methods can be categorized as fully mixed or non-uniform. Non-uniform methods can be further divided into piston, stratified and task zone ventilation. In this paper, the theory, performance, practical applications, limitations and solutions pertaining to ventilation and air distribution methods are critically reviewed. Since many ventilation methods are buoyancy driving that confines their use for heating mode, some methods suitable for heating are discussed. Furthermore, measuring and evaluating methods for ventilation and air distribution are also discussed to give a comprehensive framework of the review.
Keyword: Fully mixing ventilation, Non-uniform ventilation, Air distribution, Thermal comfort, Air quality, Energy efficiency
Nomenclature
Abbreviations
ACH air change per hour
ACV air curtain (jet) ventilation
ADPI air diffusion performance index
ASHRAE American society of heating, refrigeration and air-conditioning engineers
CAV column attached ventilation
DCV diffuse ceiling ventilation
DV displacement ventilation
FA fresh air
HVAC heating, ventilation and air-conditioning
Energy and Buildings, November 2019, Vol. 202 ! https://doi.org/10.1016/j.enbuild.2019.109359 1https://escholarship.org/uc/item/85x6r3wv

IAJS intermittent air jet system
LEV local exhaust ventilation
MV mixing ventilation
PD percentage of dissatisfied
PiV piston ventilation
PMV predicted mean vote
POV protected occupied zone ventilation
POZ protected occupied zone
PPD predicted percentage of dissatisfied
PV personalized ventilation
RA recirculated air
SV Stratum ventilation
TABS thermally activated building system
UFAD Under floor air distribution
WAV wall attached ventilation
Introduction
The task of heating, ventilation and air-conditioning (HVAC) systems is to offset indoor thermal load and/or ventilation load. The indoor thermal load can be offset by either convective-dominant or radiant-dominant strategies. In convective-dominant strategy, system recirculated air (RA) is thermally conditioned in terms of temperature and humidity. Indoor ventilation load has to be offset by convective-dominant strategy, in which outdoor air is filtered, thermally conditioned and thus it becomes conditioned outdoor air or fresh air (FA) to dilute indoor pollutants such as CO2. FA can be supplied in different ways separately or compositely with RA, which is the main focus of this paper. Based on airflow characteristics, ventilation methods can be categorized as fully mixed or non-uniform. The non-uniform method can be further divided into piston, stratified and task zone ventilation. Performance comparisons among different advanced ventilation methods are summarized in Table 1. Systematic evaluations and comparisons of different ventilation and air distribution methods, in terms of airflow characteristics, spatial forms, ventilation effects, were elaborated as the main purpose of this review. Stratified air distribution methods are buoyancy driven, which confine their use for heating mode. The possibility of using stratified methods for heating mode is one of the new insights. Different evaluating indices, including some new insights, were also discussed. Some new methods for experimental measuring airflow field were also discussed, which is one more insight.
Natural ventilation, used for passive cooling, is out of the scope of this review paper. In addition, FA and RA are jargons in the HVAC field. Compared with RA which keeps recirculated indoors, the jargon of FA emphasizes its outdoor source. However, air from outdoor may not always be fresh. Therefore, FA can also be called “conditioned outdoor air”. The word “fresh” is related to perception. Cool, dry and polluted air can be felt fresh. Warm, humid and non-polluted air can be felt “not fresh”. Therefore, “Clean air” can be used instead of FA. From another point of view, ventilation air may be outdoor air or it may be only conditioned supply air. For an instance, CO2 scrubber can be used to condition recirculated air, which is not outdoor air. After these clarifications, the jargon FA will be used in the rest of the paper.
Mixing ventilation (MV)
Performance
MV design was originally developed more from the perspective of thermal comfort considerations, as can be witnessed in ASHRAE publications about space air diffusion (ASHRAE, 2014). With any typical all-air
Energy and Buildings, November 2019, Vol. 202 ! https://doi.org/10.1016/j.enbuild.2019.109359 2https://escholarship.org/uc/item/85x6r3wv

conditioning system, the air is supplied at the temperature about 10 ºC below the room air temperature. The direct contact of a human body with such a cold air stream would cause discomfort. Therefore, MV design has been to supply this air with high velocity to enhance the entrainment and mixing with the room air, and to locate the supply diffusers well above the occupied zone and close to the ceiling to utilize the Coanda effects so that cold air jet does not directly impinge on the occupants. Two typical MV systems are all-air system and air-water systems e.g., fan-coil and chilled beam. MV is supposed to create uniform indoor environments in both thermal and air quality aspects. MV was the most widely used system as thermal comfort has been the primary considerations in design practice. However, from the perspectives of energy efficiency and indoor air quality, there are two undesirable consequences with such a design. The convective heat load in the whole space would have to be handled by the air handling unit, which is not necessarily so (Cheng et al., 2012; Cheng et al., 2013); and the well-mixing concept, which may be favored for better thermal comfort, is not favorable for better inhaled air quality (Fanger, 2001; Gao et al., 2006) especially when there is a point source of air pollutants such as in the case of airborne infectious disease spread (Melikov, 2011). Another disadvantage of MV is that the momentum of the supply air jet is used to generate entrainment of the room air to enhance mixing, and in summer conditions this is not desirable for both thermal comfort and energy efficiency. It can be seen in this review that many of the proposed developments are conceived to address one or all of these undesirable effects of MV.
Diffuse ceiling ventilation (DCV)
Performance
Principle and characteristics: DCV is an air distribution concept, where the outdoor air is supplied into the occupied zone from perforations in the suspended ceiling panels. Due to the large opening area of the supply inlet, the air enters the occupied zone with very low velocity and no fixed direction. Due to the low momentum supply, the airflow pattern in the room is driven by the buoyancy force generated by heat sources. Therefore, it can supply low-temperature outdoor air into the room directly with a lower risk of draught. At the same time, the space above the suspended ceiling is used as a plenum to distribute air and therefore reduce or eliminate the need for ductwork. This concept becomes promising in spaces with high heat load and high ventilation demand, such as classrooms.
The system normally operates in the cooling mode and the airflow pattern is comparable to MV, where the temperature distribution and contaminant distribution are uniform within the space (Fan et al., 2013; Hviid and Svendsen, 2013; Zhang et al., 2015; Lestinen et al., 2018a). There is a tendency toward displacement effect when the heat load is weak and stratification occurs (Nielsen et al., 2010a; Petersen et al., 2014). The high temperature gradient may exist when the system runs in heating mode, where the warm air will stay in the upper zone without entering the occupied zone. The ventilation effectiveness is only 0.24 in the breathing zone (Bertheussen et al., 2013).
Fig. 1. Three types of diffuse ceiling inlet based on air path and their examples (Zhang et al., 2014).
The supply inlet of DCV can be generally divided into three types based on their air path (Zhang et al., 2014). As shown in Fig.1, the first type of inlet is made of ceiling panels which are impenetrable to air. The air enters the room through the connection slots between the panels with relatively high velocity. The micro-jets below the slots generate high local entrainment and might raise draught problem at the occupant head level. The second type of inlet is made of perforated ceiling panels. Therefore, the air is supplied through both ceiling panels and the slots in between. The third type is made of porous materials instead of composing by ceiling panels. Compared to the first two types, this type of inlet has a relatively large pressure drop. The large pressure resistance can provide uniform air distribution through the ceiling area, but at the same time, it requires slightly higher fan power.
Energy and Buildings, November 2019, Vol. 202 ! https://doi.org/10.1016/j.enbuild.2019.109359 3https://escholarship.org/uc/item/85x6r3wv

The evenly distributed heat load gives much lower velocity and turbulence level than the one with concentrated heat load in one end of the room (Nielsen et al., 2015; Zhang et al., 2016; Lestinen et al., 2018b). At the same time, the system is more efficient to remove heat source with the high location, for example, light bulbs. The different heat load locations generate different flow patterns with serious variations in the maximum allowed heat load.
Besides heat sources, room geometry is another parameter influencing the performance of DCV. The increase in the velocity level and the reduction of cooling capacity in high ceiling rooms are serious drawbacks for the DCV. The previous study indicated draught risk at the feet level is observed when space is above 3 m (Nielsen et al., 2015; Zhang et al., 2016). The space above the suspended ceiling serves as a plenum to distribute air. If the maximum distance to the plenum inlet is larger than 10 m or if the plenum height is below 20 cm (Zhang et al., 2016), the air distribution would be suboptimal.
The results from the previous study indicated that the ceiling supply just above heat sources give the highest cooling capacity because the cold downward supply air meets the upward thermal plume and reaches a good mixing. The performance of DCV has been compared with the other conventional air distribution systems, such as MV, DV, and vertical ventilation, by design chart method (Nielsen and Jakubowska, 2009). DCV shows higher cooling capacity without compromising thermal comfort. The limit of cooling capacity is from the conventional flow generated by heat sources. Therefore, this system could supply cold outdoor air (as low as 5 ºC) directly, without preheating. This system is especially preferable for the cold climate, which has a longer free cooling period over the year.
Energy performance: Different from the other air distribution devices, diffuse ceiling inlet has the radiant cooling potential due to its large supply area and low surface temperature. Consequently, instead of removing the entire heat load by convection, a part of sensible heat load can be removed by radiation heat exchange. The ratio of radiation to convection depends on the suspended ceiling surface temperature (Chodor and Taradajko, 2013).However, the surface temperature needs to be controlled carefully, in order to avoid condensation on the ceiling panels. On the other hand, the condensation risk also occurs in the plenum, if the high-humidity and high-temperature airflow from conditioned space is forced back to the plenum.
Actually, the heat exchange not only occurs in the room but also exists in the plenum, between the suspended ceiling, ceiling slab and supply air. An integrated system with DCV with thermally activated building system (TABS) has been proposed recently (Fig. 2), which aims to provide heating/cooling and ventilation all year around (Yu et al., 2015). The system exploits the high thermal inertia of ceiling slabs to reduce peak load, at the same time, it is able to heat or cool the space effectively even with low-temperature differences between ceiling slab and the rest of the room. Diffuse ceiling acts as a layer between TABS and the conditioned space, which promotes the TABS’ heating capacity but reduces its cooling capacity (Yu et al., 2015; Zhang et al., 2015). With a smart control strategy, the integrated system has the potential to save up to 50% of primary energy yearly than the conventional air conditioning systems (Yu et al., 2015).
!
Fig. 2. Integrated system with DCV and TABS.
Displacementventilation (DV)
Performance
Principle and characteristics: In DV, a stratified flow is created using the buoyancy forces in the room. Design guidelines are relatively mature and plenty of successful engineering projects can be found (REHVA
Energy and Buildings, November 2019, Vol. 202 ! https://doi.org/10.1016/j.enbuild.2019.109359 4https://escholarship.org/uc/item/85x6r3wv

Displacement Guidebook, 2017). The air quality in the occupied zone is then generally better than with MV. DV has for many years been used in industrial premises. Since the mid-80s, it has also been used more extensively in non-industrial premises. DV presents the opportunity to improve both the temperature effectiveness and ventilation effectiveness. The principle is based on air density differences where the room air separates into two layers, an upper polluted zone and a lower clean zone (Fig. 3).
!
Fig. 3. Typical airflow in a room ventilated by DV.
The contamination distribution in a displacement-ventilated room depends on the position of the contamination sources and their association with the heat sources. In the ideal case with warm concentrated contamination sources, all contaminants are transported directly into the upper zone by the convection flows. Vertical temperature gradient differs from contaminant distribution: while contaminants form typically two clear layers, the vertical temperature gradient is linear between the floor and the height of the mixing layer (stratification height) (Fig.4). Over the mixing layer, the room air temperature is constant if there is no high heat load at the ceiling level.
There are several types of diffusers used for DV. The most commonly used types are integrated into the walls. Other types are placed at the walls or in a corner, free-standing on the floor, or integrated into the floor. Most draught problems reported in rooms with DV are due to high velocity and low temperature in the zone adjacent to the diffuser.
Parameters influencing performance: Two principal methods can be used when the supply air flow rate of DV method is calculated: 1) temperature-based design, where the design criterion is the air temperature in the occupied zone and 2) air quality based design where the design criterion is the air quality in the occupied zone. The temperature-based design is the most commonly applied method.
In the design process, the challenging task is to estimate vertical contaminant or temperature gradients in the room space. While the contaminant stratification level is mainly affected by the relation of supply airflow rate and convective airflow rate, thermal stratification is also affected by thermal radiation exchange between different room surfaces. The thermal radiation from upper-level surfaces warms lower level surfaces and thus affects the air temperature at floor level and in the occupied zone.
Energy and Buildings, November 2019, Vol. 202 ! https://doi.org/10.1016/j.enbuild.2019.109359 5https://escholarship.org/uc/item/85x6r3wv

Fig. 4. Vertical temperature profiles in room with DV with different heat loads.
If an occupied room is to be warmed by the ventilating air, DV is not an optimal solution.
Energy performance: To reach the same air quality in the occupied zone, DV typically requires a lower air flow rate than MV. For the purpose of removing excess heat, both mixing and displacement methods are likely to require similar airflow rates.
With displacement, the supply air temperature is typically about 3 K to 5 K cooler than the air temperature in the occupied zone at the height of 1.1 m. In the applications with moving occupants, e.g., the shopping centres, the supply air could be 6 K to 8 K lower than the air temperature in the occupied zone. Depending on the designs, the temperature difference between the supply and exhaust air is typically between 6 K and 15 K.
Compared with MV, DV supplies air at a higher temperature and this implies longer free cooling periods in a year, and so less energy consumption. The energy saving potential compared with MV is case specific varied from 0 % to 20 %.
Applications and benefits
DV is usually preferable in the following cases: • Where the contaminants are warmer and/or lighter than the surrounding air; • Where the supply air is cooler than the ambient air; • In tall rooms, for example, where the room heights are more than 3 metres; • When there are heat loads in the upper part of the room;
DV may be less preferable than MV in the following cases: • Where surplus heat is the main problem, and relatively low specific outdoor airflow rate is needed; • Where there are space constraints for supply diffusers and duct work; • When the requirement is to cool space with low head rooms (in offices, consider mixing and cooling panels
or chilled beams); • Where there are significant obstructions to airflow near the floor, e.g., furniture; • Where the contaminants are cooler/denser than the ambient air.
Occupants
H(m
)
0
1.4
2.8
4.1
5.5
Temperature ratio
0 0.4 0.8 1.2
Warm window
H(m
)
0
1.1
2.2
3.3
4.4
5.5
Temperature ratio
0 0.3 0.6 0.9 1.2
Warm floor
H(m
)
0
1.1
2.2
3.3
4.4
5.5
Temperature ratio
0 0.4 0.8 1.2
Warm ceiling
H(m
)
0
1.1
2.2
3.3
4.4
5.5
Temperature ratio
0 0.4 0.8 1.2
Energy and Buildings, November 2019, Vol. 202 ! https://doi.org/10.1016/j.enbuild.2019.109359 6https://escholarship.org/uc/item/85x6r3wv

Typical application of DV are: • Gyms; • Meeting rooms; • Classrooms; • Tall rooms: Convention centres, Lobbies, Sports arenas, Auditoriums, Theatres, Museums, Airports,
Shopping centres, etc.
Under floor air distribution (UFAD)
Performance
Principle and characteristics: UFAD is an air distribution strategy that uses an underfloor supply plenum located between the structural slab and the underside of a raised floor system to deliver conditioned air to floor supply outlets (ASHRAE, 2013). Supply air enters the occupied space through the floor diffusers, which, although in some cases have fixed openings, are most commonly adjustable by nearby occupants. Fig. 5 shows a typical configuration for a UFAD system in an open plan office. The plenum is most commonly pressurized in the range of 10-25 Pa compared with the conditioned space. As shown, supply air flows freely through the underfloor plenum (partial ductwork may also be used to aid distribution) and is delivered through diffusers at or near floor level into the room above. There are many possible types of floor diffusers. Under cooling operation, floor diffuser supply temperatures are maintained no lower than 16-18°C (and often warmer due to temperature gain in the plenum) to avoid uncomfortably cool conditions for nearby occupants. The main differences in comparison with a conventional overhead mixing system are vertical temperature stratification under cooling operation, the use of the underfloor plenum, warmer supply air temperatures, and, the possibility of personal control of the floor diffusers (Bauman and Webster, 2001).
Fig. 5. Underfloor air distribution system in an open plan office.
The main potential benefits of a well-designed and operated UFAD system compared to conventional MV are increased flexibility and reduced life-cycle costs through the use of a raised access floor system, improved thermal comfort thanks to personal or group control of the diffusers, and increased ventilation efficiency (Faulkner et al., 1995; Lee et al., 2012; Xue et al., 2012), reduced energy use in suitable climates (ASHRAE, 2013), and improved employee satisfaction by giving occupants greater control over their local environment and by improving air quality. Like DV, UFAD may create issues with ankle draft (Liu et al., 2017). UFAD is mainly used in commercial buildings that require high layout flexibility and that have raised floors to form an integrated services plenum for distribution of power, voice, and data cabling, as well as HVAC. UFAD is also common in data centers. UFAD systems are not suitable for areas where liquids or other contamination could fall into diffusers, for example kitchens, restrooms, restaurants and laboratories.
Energy and Buildings, November 2019, Vol. 202 ! https://doi.org/10.1016/j.enbuild.2019.109359 7https://escholarship.org/uc/item/85x6r3wv

Stratification: Similar to DV, in a UFAD system under cooling operation, cooler and cleaner air is supplied at the floor level and warmer and more contaminated air is exhausted at the ceiling level. There are two important differences with DV: in a UFAD system, the air enters in the space with higher air velocity and through many diffusers in the space, often close to people, allowing personal control. The increased mixing caused by the floor diffusers will tend to reduce somewhat the ventilation effectiveness compared with a DV system, though it is still higher than that of a conventional overhead mixing system.
Fig. 6 identifies the typical features of a temperature profile for a UFAD system. Most of a person’s body, particularly for seated occupants will be located below the usual thermostat (Tstat) height. To maintain the average occupied zone temperature (Toz,avg) at an acceptable temperature for thermal comfort, thermostat setpoint temperatures will often need to be set higher than that for a MV system (ASHRAE, 2013). The main factors that affect stratification are fluid dynamic characteristics of the floor diffusers, their number, diffuser supply air temperature, air flow rate, vertical throw height, floor to ceiling height, and total cooling load (Schiavon et al., 2011; Lee et al., 2012; Xue et al., 2012). Swirl diffusers with lower throw heights (1.5-1.8 m) tend to create more stratification while linear bar grill in perimeter zones with their higher air flow rates and throw heights tend to create less stratification.
!
Fig. 6. UFAD room air temperature profile.
Energy performance: Except EnergyPlus, other building energy performance simulation tools are not able to model two key characteristics of UFAD systems, the room air stratification and the underfloor air supply plenum (Webster et al., 2008). UFAD may save energy due to: 1) reduced fan pressures required to move air in the open underfloor plenum compared to ducts; 2) higher supply air temperature that enables higher cooling system efficiency and greater outside air economizer benefits in suitable climates; and 3) thermal stratification. A field study that directly compared two similar buildings, with similar design and occupancy and located in the same central California climate showed that the building with overhead VAV mixing system had one third higher annual cooling energy and 50% higher fan energy use compared to the building with UFAD (Bauman et al., 2016).
Cooling load and design tools: UFAD cooling load profile is different from a traditional all-air VAV system because, in general, the raised floor reduces the thermal mass in the space and this leads to a higher peak cooling load (Schiavon et al., 2011).
Underfloor air supply plenum: The plenum height is variable but often between 0.25 and 0.5 m. Air leakage from pressurized underfloor air supply plenums is one of the most important issues facing the UFAD industry. Evidence from completed projects indicates that uncontrolled air leakage from a plenum can impair system performance. Two types of air leakage have been identified. Category 1, construction quality leakage, is leakage to the return plenum on the floor above or below or to the outside and is the most detrimental to energy
Energy and Buildings, November 2019, Vol. 202 ! https://doi.org/10.1016/j.enbuild.2019.109359 8https://escholarship.org/uc/item/85x6r3wv

performance. Category 2, floor leakage, is leakage through gaps or openings in the raised floor into the conditioned space above and will have varying consequences on system performance depending on if it is properly accounted for in the control of the system (Jin et al., 2006).In another study in the tropics, it was observed that the leakage in a ducted UFAD system in comparison to a plenum supply UFAD system was about 62% less at both peak and part load operation (Iyengar et al., 2015).
The air traveling in the underfloor plenum increases its temperature because the cool supply air is warmed up by the concrete slab and raised floor. This phenomenon is called thermal decay or plenum supply air temperature gain. This temperature increase can be substantial, between 2-5 °C (Lee et al., 2012). Plenum temperature gain has a negative impact on energy consumption, control and thermal comfort (overcooled interior zones). Plenum temperature gain can be reduced by delivering the coolest supply air directly to the perimeter zone, allowing temperature gain to warm up the plenum air as it flows into the interior zone (ASHRAE, 2013).
Stratum ventilation (SV)
Several governments in East Asia have proactively issued guidelines on elevated temperatures in air-conditioned premises in summer. Conventional air distributions are not effective in providing thermal neutrality for occupants under such warm conditions. Therefore, SV was proposed (Lin et al., 2005) (Fig. 7), which supplies air to head (breathing) level and generated sandwich airflow field in indoor environments (Fig. 8).
Fig. 7. Schematics of SV air distribution.
Fig. 8. Airflow pattern of SV (a) air stratum (b) vertical temperature profile.
Performance
Thermalcomfort: Fong et al. (2011) and Cheng et al. (2014) conducted extensive human tests to evaluate the thermal sensations. The thermal neutral temperature was found over 27°C. An air diffuser performance index (ADPI) of over 80% was mostly achieved. Thermal comfort indices (PMV, PPD and PD) fulfill the requirements of ISO 7730 and CR 175-1998 (Tian et al., 2011a). Tian et al. (2011b) experimentally determined the Sandwiched velocity, temperature and CO2 concentration profiles and small head-to-ankle temperature difference (Figure 8). Cheng et al. (2015) found that the room temperature had a greater impact on the overall thermal sensation, local thermal sensation and draft than the airflow rate at the neutral temperature of 27°C. However, to minimize draft complaints, the supply air temperature should be above 20°C. In the occupied zone, the airflow characteristics among MV, DV and SV are different (Cheng and Lin, 2015a). Cheng and Lin (2015b)
! ! !
!
(a)
(b)
0.0 0.2 0.4 0.6 0.8 1.0 1.2 1.40.0
0.2
0.4
0.6
0.8
1.0Case1 Case2 Case3 Case4
Line 5
z
θt
Energy and Buildings, November 2019, Vol. 202 ! https://doi.org/10.1016/j.enbuild.2019.109359 9https://escholarship.org/uc/item/85x6r3wv

found that the occupant formed a local blockage but the supply airflow could flow over it because of the body heat, therefore, the air jet penetrated farther. Huan et al. (2015) established a mathematical model based on the airflow patterns of SV for predicting the vertical temperature profile in a stratum ventilated room.
It is desirable to establish collective air distributions to simultaneously satisfy individual preferences of different occupants in a shared room. Because of its low nonlinearity and fast response (Wang and Lin, 2015), SV was used to provide differentiated air velocity, temperature, and PMV distributions (Shao et al., 2018). Both the general and local thermal comfort levels were satisfied. Zhang et al. (2019a) controlled the microclimates of several subzones to satisfy the thermal preferences of the respective subzones. The method reduced the deviation of the achieved PMVs of the subzones from the preferred ones by 17.6% to 41.5%. Current practice of modeling the non-uniform thermal environment requires inputs of the wall temperatures/heat fluxes, which increases the cost and complexity of the sensor system. Zhang et al. (2018) proposed to model the non-uniform thermal environment with the supply and exit air conditions as inputs, which can be obtained readily from the building management system. The performance of SV in an office with highly asymmetric heat gains was experimentally investigated (Huan et al., 2016). When the inner surface temperature of one of the walls closed 40°C, the thermal condition was still within the comfort zone.
Indoor air quality: Tian et al. (2009, 2010) found that the particle concentrations for the entire room and the breathing zone under SV were less than that under DV. Compared with DV, the formaldehyde concentration in the breathing zone is lower when a contaminant source locates close to the occupant(Tian et al., 2010). Tian et al. (2011a) found thatthe air age was improved from 475 s to 443 s in a typical individual office when supply air temperature rose from 19°C to 21°C. Tian et al. (2011b) experimentally investigated the CO2 concentration and determined theventilation effectiveness. For the four cases, the ventilation effectiveness was close to 1.5. The particle concentrations in the breathing zone for three representative scenarios in a typical classroom were investigated (Lin et al., 2012). The flow patterns created by different air distributions have a great impact on the particle fates (Lin et al., 2011a). The concentration under SV is significantly lower than that under MV or DV.
Energy efficiency and life cycle assessment: Qualitatively, energy is saved by SV due to the dynamic synergy of the following nine factors:
1. Smaller dehumidification load - The thermal neutral temperature of SV is above 27ºC; 2. Smaller transmission load - Smaller dry bulb temperature difference between the indoors and the outdoors; 3. Smaller ventilation load - Smaller enthalpy difference between the room air and the outdoor air; 4. Higher ventilation efficiency and therefore smaller ventilation load; 5. Reverse temperature gradient in the occupied zone, which avoids over-cooling the lower zone; 6. Longer free cooling period because of higher thermal neutral temperature; 7. Elevated supply air temperature allows a higher evaporative temperature of the associated chiller(s); 8. Shorter pull-down period; 9. Smaller pumps and fans because of lower cooling capacity.
Typical configurations of an office, a classroom and a retail shop in Hong Kong were investigated (Lin et al., 2011b). The year-round energy saving was found to be substantial at 25% and 44% at least when compared with DV and MV respectively. A traditional class, a group study room and an E-learning class in a school were studied (Lee et al., 2013).Benchmarked with the conventional air-conditioning system, Fong et al. (2018) found that SV could have primary energy saving up to 30%. The loads and lengths of the pull-down periods (the time used to achieve a comfortable thermal environment before a room is ready for occupation) with MV, DV and SV were investigated (Wang and Lin, 2015). For the rapidity of the pull-down process, MV spends a shorter time than DV, while SV spends less than half of the time the other two spend. The average pull-down load of SV is only around a quarter of that of MV or DV. The exergy consumption of the chilled water used for the pull-down process under SV is even lower because of its higher supply air temperature.
Advanced air distribution should contribute to mitigating climate change and reducing carbon footprint. Fong et al. (2017) demonstrated that by adopting DV and SV, it is possible to reduce the CO2 emission up to 23.3% and 31.7% respectively; and to reduce the life cycle cost up to 15.5% and 23.9% respectively, in comparison with MV for 20 service years.
Applications and benefits
Because the thermal length of the supply air jet(s) should cover the occupied zone (Elvsen and Sandberg, 2009), SV is most suitable for small to medium-sized or zonal rooms. The design guidelines have been suggested (Lin et al., 2011c). Horizontal confluent jets could be use as the air supply terminals. The intermittent air jet strategy (IAJS) may be incorporated if the supply airflow rate is too low to satisfy the thermal length requirement (Kabanshi et al., 2016b). SV is applied to offices, classrooms, meeting rooms, etc.. Besides the benefits mention
Energy and Buildings, November 2019, Vol. 202 ! https://doi.org/10.1016/j.enbuild.2019.109359 10https://escholarship.org/uc/item/85x6r3wv

in the previous paragraphs, SV can save substantial indoor space as the air ducts are housed in the cavity walls instead of the mostly empty ceiling voids.
Impinge jet ventilation (IJV)/confluent jets ventilation (CJV)
Impinging jet ventilation
Performance
IJV delivers fresh air to a room based on the impinging jet principle. The supply device is the duct itself which delivers the supplied air at a certain height above the floor, and the air extraction is usually located at a high level near the ceiling (Fig. 9(a)).
(a) (b)
Fig. 9. IJV (a) Conceptual diagram of impinging jet (b) Flow regions of an impinging jet.
In addition to ventilation provision, impinging jets offer high rates of heat/mass transfer and have been used in a wide variety of industrial applications (Hollworth and Durbin, 1992; Rundström and Moshfegh, 2008; Masip et al., 2012; Larraona et al., 2013). Impinging jets are also of scientific interest due to the presence of different flow regimes in the jet flow. The flow field of an impinging jet is generally divided into three distinct regions: free jet, impingement and wall jet. The free jet region can be further divided into three zones depending on the nozzle-to-plate (or floor)distance: the potential core zone, developing zone and fully developed zone. Schematic of an impinging jet flow field is shown (Fig. 9(b)).
In an IJV system, a high momentum air jet is discharged downwards, which strikes the floor and spreads over it, thus distributing the fresh air along the floor in the form of a very thin shear layer. This air distribution system enables the air jet to overcome the buoyancy force generated from heat sources and reaches the floor regions further.
This system has been shown to have good performance for ventilation of offices, classrooms and industrial premises (Karimipanahet al., 2000; Karimipanah and Awbi, 2002; Rohdin and Moshfegh, 2009). It is also important to bear in mind that adopting such low-level supply systems will deliver fresh air directly to the occupied zone, which could consequently raise the potential risks of local thermal discomfort, i.e., draught of cold air close to the floor in the case of cooling, as well as excessive temperature stratification (Melikov et al., 1990). However, unlike DV, heated air can be supplied by IJV for winter heating. Therefore, careful design consideration is required for this type of air distribution system to enable proper air velocity and temperature distributions in the occupied zone for ensuring good thermal comfort in the occupied zone.
Energy saving potential of Impinging Jet Supply Device (IJSD) was investigated on the basis of airflow rates required for each system to obtain equivalent occupied zone temperatures. The IJSD required slightly higher airflow rate of 0.023 m3/s (1.1 times) and fan power (1.3 times) than the Displacement Supply Device (DSD), but it was more energy efficient than the Mixing Supply Device (MSD) and the Wall Confluent Jet Supply Device (WCJSD) which required 1.2 times higher airflow rate and 1.7 times higher fan power, based on the relations between the flow rate, Q, pressure difference, Δp, and the fan power, ΔP ∝ Q2 and the fan energy E ∝ Q3 (Karimipanah et al., 2008). Although the DSD showed superior performance to all other supply devices in terms of ventilation efficiency and energy saving, it seemed to have difficulties in providing acceptable vertical temperature gradient between the ankle and head levels for a standing person. The study showed that the IJSD could provide better overall performance than the other three supply devices examined.
Confluent jets ventilation
Energy and Buildings, November 2019, Vol. 202 ! https://doi.org/10.1016/j.enbuild.2019.109359 11https://escholarship.org/uc/item/85x6r3wv

Performance
Confluent jets can be defined as multiple round jets issue from different nozzles (Awbi, 2003). Typically, the flow field of confluent jets consists of the initial, converging, merging and combined regions (Ghahremanian et al., 2014a). After a certain distance from the supply device, the combined jets behave as a single jet, with the individual jets could no longer be identified.
The flow field for the confluent jets is complicated and dependent on the jets’ interaction. The flow from an in-line array of multiple interacting jets creates three different confluent jets, i.e., central jets, side jets and corner jets. All these types of jets behave differently in the converging, merging and combined regions in terms of, e.g., velocity decay and length of potential core. There is no significant difference among the central, side and corner jets within the initial jet region, i.e., a clear potential core zone can be found within the initial region. The confluent jets start to merge after the converging region. Shortly after the nozzle outlets in the converging region, the side jets tend to curve towards the centre of the jet array. This phenomenon is less prevalent for the corner jets. The maximum velocity decays linearly in the main part of the merging region. The side jets are more affected by the neighboring local flow than the other jets. Due to their deflection, the side jets merge faster than the central jets. As a result, side jets have a shorter potential core and faster velocity decay, which preserves their maximum velocity less than corner jets. The combined region is dominated by the potential core, where a small maximum velocity decay can be observed in that region. Contour plots and cross-sectional profiles of the dimensionless mean velocity for an in-line array of round jets can be seen (Fig. 10) (Ghahremanian et al., 2014a; Ghahremanian et al., 2014b).
Fig. 10. (a) Contour plot (b) cross sectional profiles of the dimensionless measured velocity from an array of round jets (Ghahremanian et al., 2014a; Ghahremanian et al., 2014b).
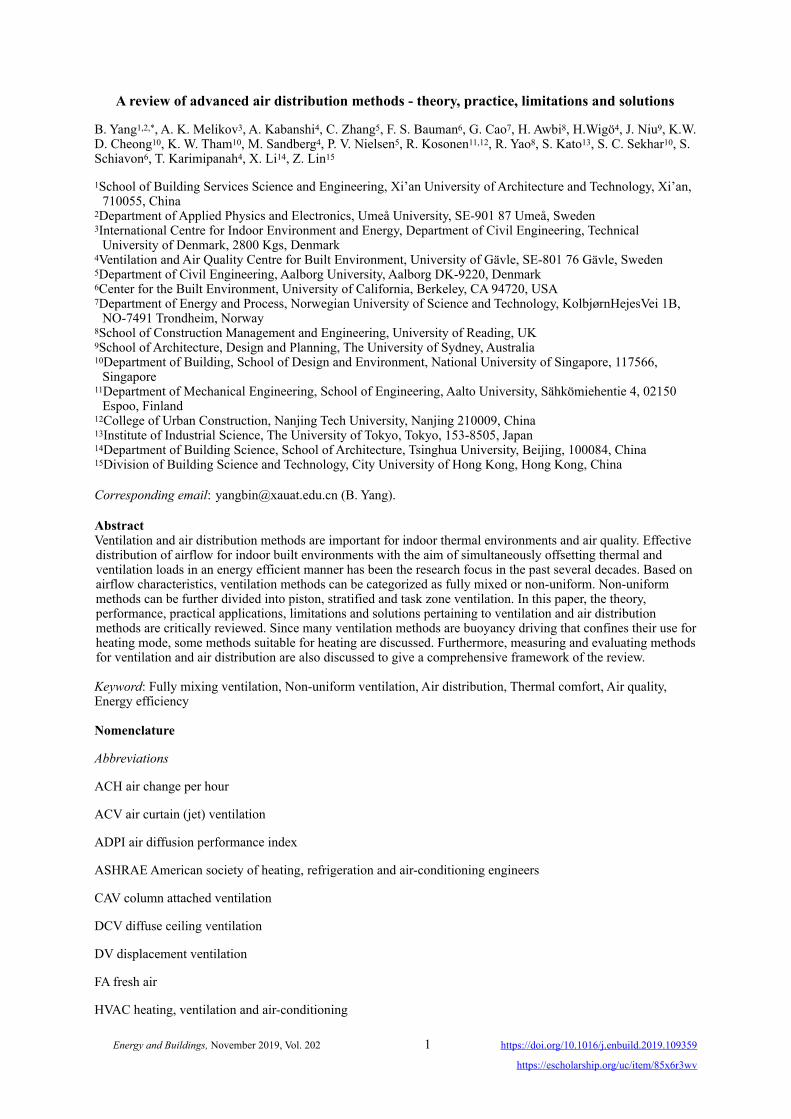
The confluent jets described earlier are for free jets moving side-by-side. In ventilation application wall confluent jets are often used so that the jet can be delivered over a wall in the room towards the floor. Such confluent jet alignment can be described as wall confluent jets (WCJ) due to their development onto or in the vicinity of a wall. The jets attached to a wall due to the Coanda effect become a wall jet and usually move downward towards the floor (Fig. 11). An attached wall jet is characterized by the flow being bound on one side by a flat surface and moving parallel to the surface. Upon leaving the nozzle, the jet forms a boundary layer on the wall surface and a shear layer develops on the fluid side (Awbi, 2003). The wall jet remains attached to the wall until the floor surface is reached. A free jet region, a Coanda effect region, and a wall jet region are the three regions of WCJ which are described in the experimental study (Cho et al., 2008).
(a) (b)
Energy and Buildings, November 2019, Vol. 202 ! https://doi.org/10.1016/j.enbuild.2019.109359 12https://escholarship.org/uc/item/85x6r3wv
The flow pattern and temperature distribution below the WCJSD were visualized by smoke and IR camera, as shown in Fig. 11. The visualizations show that the confluent jets initially produced by the supply device remain attached to the side wall due to the Coanda effect and move downward towards the floor as WCJ.
! (a) (b)
Fig. 11. (a) Schematic of wall confluent jets (Cho et al., 2008) (b) Flow visualization by smoke [left] and IR camera [right] (side view) (Janbakhsh, 2015).
The WCJ has been applied for ventilation in the studies (Cho et al.,2008; Karimipanah et al., 2008). These studies found that the momentum of the WCJ can be more conserved than that of other jets (e.g., free confluent jets, free plane jet and free plane wall jet). The behavior of this type of ventilation system is such that it leads to slow jet diffusion due to the lower rate of velocity decay compared with free confluent jets, free plane jet or free plane wall jet. In addition, the flow behavior of the WCJ was compared with a DV system. It was concluded that the WCJ has a greater horizontal spread over the floor area than that for a displacement jet. The results of the energy performance of the WCJSD revealed that this system requires the lowest fan power compared to the DV, MV or IJV to achieve nearly the same value of air distribution index (ADI) which is a measure of the ventilation performance of air supply devices.
Wall attached ventilation (WAV)
Performance
DV can only meet moderate cooling loads (up to 40 to 50 W/m2) (Hamilton et al., 2004). As a solution, the concept of vertical wall attached ventilation (WAV) was presented (Zhang, 2005; Li et al., 2008; Nielsen et al., 2010c), which is based on the combination of MV, DV and impinging jet flow. The concept was named air curtain (jet) ventilation (ACV) later (Li et al., 2012a; Li et al., 2012b; Yin and Li, 2012). A mixture of FA and RA is first delivered and attaches to the vertical wall then directs the jet downwards. As the air jet with high momentum reaches the floor level, it impinges to corner, and then separates from the vertical wall surface and reattaches to the floor to generate clean air layer (“air reservoir”). Background mechanism is extended Coanda effect(Coanda-Li effect), which is the tendency of a fluid jet to keep attaching to a complex of convex and concave surfaces after impinging (Li, 2019).The distance between the vertical surface and the center of supply air diffuser has a significant influence on the performance of WAV and the performance of DV mode ventilation changes to MV mode ventilation when the distance increases. Compared with DV, similar temperature and velocity fields can be achieved; with WAV, it is possible to supply draught free larger airflow rates than with DV.
Energy and Buildings, November 2019, Vol. 202 ! https://doi.org/10.1016/j.enbuild.2019.109359 13https://escholarship.org/uc/item/85x6r3wv
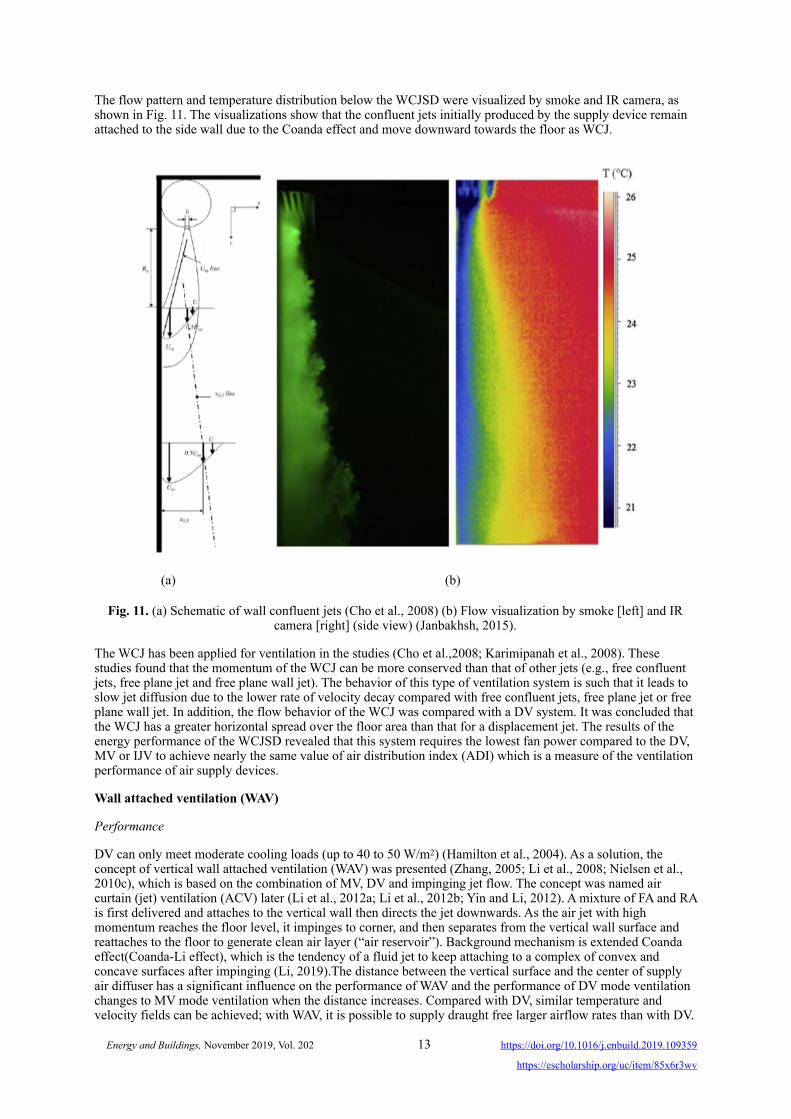
In large spaces, such as shopping malls and subway stations, square columns or circular columns are commonly used (Fig. 12(a)) whose surfaces can be utilized for airflow attaching (Li et al., 2010a; Li et al., 2010b). In this kind of facilities, the concept of “wall” in WAV can be generalized to all solid surfaces such as column surfaces. Taking square column attached ventilation as an example, three regions can be divided including column attached region, primary floor attached region and confluent floor attached region (Fig. 12(b)) (Yin et al., 2016). With the increase of supply air velocity, the main body thickness of the attached supply air becomes thinner, which corresponds to a lower degree of entrainment between supply air and ambient air. This is a great benefit to promote ventilation efficiency (Fig. 12(c)). Compared with another type of jets, the maximum velocity decay and jet diffusion of column attached air distribution are much faster, which is helpful for avoiding draught in the occupied zone. The performance of circular column attached air distribution and its floor-based variation (a floor-based air distribution with a novel mushroom diffuser) (Fig. 12(d)) were also well explored, which demonstrate high performance (Li et al., 2016; Yin et al., 2017).
! !
(a) (b)
(c) (d)
Fig. 12. (a) Multiple columns attachment ventilation (b) airflow schematic of square column attached air distribution (c) visualization of experiments with different initial air velocities (d) mushroom diffuser model.
Applications and benefits
WAV can also be used for built environments with irregular shapes of the envelope. Taking a two-story island metro station as an example, initial construction costs and operational costs were saved by changing MV to WAV (Liu, 2018) when the size of the ventilation system is reduced. Supply air flow rate of the air handling unit was reduced by 20%; chiller capacity was reduced by 22%; comprehensive cooling coefficient of air conditioning system was increased by 17% and air duct material of HVAC system was saved by 14.3%.
Intermittent air jet strategy (IAJS) - Ventilation strategies with rapid variation of ventilation flow rate
Performance
A constant flow rate in MV systems creates the secondary motion of air, which enhanced by entrainment of room air into the supply stream, dominates ventilation of zones in the room by forced convection. Optimal control of the supply flow rate increases mixing and usually, a high mixing effect is produced in setups with high supply flow rates, which consequently increases the ventilation energy use. Additionally, there is an increased risk of the
Energy and Buildings, November 2019, Vol. 202 ! https://doi.org/10.1016/j.enbuild.2019.109359 14https://escholarship.org/uc/item/85x6r3wv

draft in cases of supply of isothermal or cooled air. Another acute problem with a constant flow rate is the setting up of stagnation zones in the room, which give rise to unacceptable low air exchange efficiencies locally. This is because with a constant flow, the generated small-scale structures within the room flow are insufficient. Consequently the desired perfect mixing is not obtained. Fig. 13 illustrates the stagnation zone of momentum driven two-dimensional flow demonstrated by Sandberg and Elvsén (2004) by means of visualization (represented by a schematic diagram in Fig. 13a) and later quantified (Fig. 13b) with Particle Image Velocimetry (PIV) (Fallenius et al., 2013).
!
(a) (b) Fig. 13. Stagnation zone setup by the constant flow rate in a two-dimensional model.
The problems of stagnation zones and the draft risk can be alleviated by employing strategies that optimize rapid variations of the ventilation flow rate or velocity field within the room. Rapid variation is that the variation occurs within time-periods of minutes in contrast to variable air volume systems where the flow rate is gradually changed as a response to a change in the load. The time-periodic supply flow rate can be varied by either using a sine or a step function shown in Fig. 14. Early studies date back to several decades ago (Ye and Dai, 1959; Takao, 1982; Thorshauge, 1982; Li and Dai, 1987).With a sinusoidal function, the flow rate is controlled within a specified range by repeatedly switching on and off the HVAC supply fan for stipulated periods. An example is IAJS. The purpose of creating variations is to change the conditions within the room with respect to the airflow pattern and the velocity field. A change in airflow pattern may improve the performance of removing contaminants from the room and a change in the velocity field may increase the occupant perceived cooling effect without generating draft.
!
Fig. 14. An example of time history of flow rate variation.
1.Periodic variation of the ventilation flowrate with a sine function
Principle and characteristics: A non-exhaustive overview of visualization work was presented by Sandberg and Elvsén (2004) who theorized and showed in a model study that varying flow rate using a sine function generated secondary vortices, which were shed into the stagnant areas within the room. The additional secondary vortices generate small-scale flow structures by vortex shedding, which induces air movements and disintegrates the stagnation zones, see schematic diagram in Fig. 15. The resulting air distribution in the entire room is far better and gives rise to higher air exchange efficiency than the constant supply flow.
Energy and Buildings, November 2019, Vol. 202 ! https://doi.org/10.1016/j.enbuild.2019.109359 15https://escholarship.org/uc/item/85x6r3wv

!
Fig. 15. Generation of vortices by a time varying supply flowrate.
The observations were confirmed and quantified in PIV model studies (Fallenius et al., 2013; Sattariand Sandberg, 2013) that investigated mixing effect of ventilated air in an enclosure as a function of the frequency of the pulsating supply flow. The distribution of vortices becomes more homogeneous over the considered domain with an increase in pulsation frequency (F), while maintaining the same flow rate. Fig. 16 shows that vortex shedding increases with pulsation frequency [F = 0 (a), 0.3 (b), 0.4 (c) and 0.5 (d), Hz] resulting in higher number of small-scale flow structures vortex circulation and the stagnation regions were completely disintegrated.
!
Fig. 16. Spanwise vorticity normalized with the maximum value of the velocity vector magnitude and the diagonal length Lof themodel (Fallenius et al., 2013).
Alternatively, vortex shedding in the stagnation region can be realized by increasing the flow rate. However, the rapid variation of the flow rate improves re-circulation considerably than increasing the supply flow rate, which practically is undesirable as it increases the fan energy use. Likewise, the overall ventilation of the room improves, and the contaminant distribution is homogeneous. The mixing is strongly enhanced when time-periodic supply conditions are applied, with a model test case showing local reductions of the contaminant concentration of up to 50% compared to a case with a constant supply flow rate (van Hoof and Blocken, 2017).
Applications and benefits: The main potential benefits of a system operated with a periodic rapid variation of the ventilation flow rate are increased ventilation efficiency due high mixing effect of vortex shedding, use of low supply flow rate for an equivalent level of global mixing otherwise obtained by increasing the flow rate in MV systems and reduced risk of draft in the occupied zone
Energy and Buildings, November 2019, Vol. 202 ! https://doi.org/10.1016/j.enbuild.2019.109359 16https://escholarship.org/uc/item/85x6r3wv

2.Periodic variation of the ventilation flow rate with a step function
Principle and characteristics: Variations of ventilation flow rate with a step function is simply achieved by periodic switching “On-and-Off” of the supply fan. The idea was first conceived by Wigö (2005), who investigated the impact of a controlled intermittent velocity field on human’s psychology and physiology by optimizing unconstrained confluent jets. Kabanshi et al. (2016a) explored the idea as a primary ventilation strategy, IAJS, which aimed to optimize a two-dimensional intermittent jet issued overhead from a row of confluent jets. The strategyincreases mixing and penetration of the supply flow into the breathing zone and creates unsteady airflow characteristics in the occupied zone. In operation, the system is proposed to run with a minimal velocity of 0.4 m/s for downward airflow to effectively blow away the thermal plume and reduce personal exposure to room contaminants transported within the human convective boundary layer (CBL) (Licina et al., 2015a). Velocity of 0.8 m/s was recommended as the maximum with no requirements for personal control (ASHRAE standard 55, 2017); otherwise higher velocities can be used when needed.
The intermittent supply creates very different velocity conditions between periods of intermittency (low and high pulses), which consequently creates non-uniform airflow and non-isothermal conditions around occupants exposed to IAJS, see Fig. 17. The transient conditions around the occupants are demonstrated in the periodic distortion and reformation of the CBL. This interaction increases occupants perceived cooling of intermittent airspeeds and reduces the risk of the draft, giving a feeling of thermal pleasure or thermal alliesthesia in warm environments (Cabanac, 1971; Hellwig, 2015).Air movement acceptability and air quality acceptability are improved, especially under elevated room temperatures, which pave the way for energy-efficient cooling (Kabanshi et al., 2016b; Kabanshi et al., 2019).
!
Fig. 17. Non-uniform airflow and non-isothermal conditions around occupants; Distortion and reformation of human convective boundary layer (CBL) under IAJS.
Applications and benefits: IAJS has been tested in a classroom mockup, which can be used as either an independent system that works as a primary ventilation system or as a room induction system (refer to schematic diagrams in Fig. 18) working together with a MV system (Kabanshi et al., 2016a; Kabanshi et al., 2016b; Kabanshi et al., 2017; Kabanshi et al., 2019). Generally, IAJS has potential to offer an ambient temperature offset up to 2.5 ºC with an operational velocity of 0.4 m/s (using higher velocities increases the temperature offset), which is equivalent to 13% cooling demand reduction compared with MV. Cooling energy simulation and analysis under different climates demonstrate its feasibility and potential energy benefits (Kabanshi et al., 2018).
Energy and Buildings, November 2019, Vol. 202 ! https://doi.org/10.1016/j.enbuild.2019.109359 17https://escholarship.org/uc/item/85x6r3wv

IAJS as a primarysystem has potential application in climates where cooling is needed for most parts of the year as intermittent airflow, even at minimal operational velocity 0.4 m/s, was found undesirable below 23.7 ºC (Kabanshi et al., 2019). Currently, IAJS as a primary system is mainly under chamber test stage, but it has been tested in a field study in a classroom with promising results(Wigö, 2013). IAJS as a room induction system can work in almost all climates and is easy to implement in existing buildings. The system increases mixing through recirculation of room air and offers comfort benefits in warm environments due to increasedintermittent airspeeds.
Some practical limitations of the system include application in fixed sitting arrangements as the system is not flexible to variable room arrangements or alternating layouts. The jets generate a slightly higher noise level than the MV system due to increased fan pressures, especially when used as a primary ventilation system. There is an increased duct work which depending on installation can be aesthetically challenging and can increase installation and maintenance costs.
!
Fig. 18. Schematic of IAJS as a primary system and induction system.
Protected occupied zone ventilation (POV)
Performance
The POV is intended to separate an indoor environment into several subzones by using low turbulent plane jets (Fig. 19). Hence, POV can be applied indoors with a protected occupied zone (POZ), for example an open plan office and an isolation room. A POZ is defined as a zone of the occupied zone in a room consisting of human being and personal working zone, where occupants spend most of their time indoors. One earlier study (Valkeapää and Sirén, 2010) showed that an air curtain might be used to prevent the cold air from a doorway with a relatively high tightness efficiency. In addition, an experimental study on push-pull ventilation system was carried out (Heiselberg and Topp, 1997). When a push air jet and an exhaust are combined in a correctly balanced ratio, a very high capture efficiency as high as 90% could be achieved by the controlled air movement (Kulmala et al., 2007).
Moreover, a downward plane jet may be used to control the transmission of airborne contaminants generated by human respiratory activities (Cao et al., 2013; Cao et al., 2014; Aganovic et al. 2019). With a POV, the plane jets may destroy the high concentration exhalation flow directed into the breathing zone of a target people. The protection efficiency of POV varies from 8% to 50% depending on the exhaust location, supply air velocity and the usage of partitions (Cao et al., 2013). If the use of POV combines with other types of airflow distribution methods in subzones, like a mixing type airflow distribution, then the system may be defined as a hybrid protected zone ventilation (HPOV). The principle of using HPOV, which is based on the push-pull principle, will remove contaminant locally (at the exhaust) and therefore remove the contaminant crossing the plane jet. It is possible to create a fully protected zone (Cao et al., 2015a).
Energy and Buildings, November 2019, Vol. 202 ! https://doi.org/10.1016/j.enbuild.2019.109359 18https://escholarship.org/uc/item/85x6r3wv

Fig. 19. Schematics of POV and HPOV air distribution.
Personalized ventilation (PV)
Performance
The main idea of PV is to provide clean and cool air to the breathing zone or at least close to each occupant. The PV in comparison with total volume air distribution has two important advantages: first, its potential to improve the inhaled air quality and second, each occupant is delegated the authority to optimize and control temperature, flow rate (local air velocity) and direction of the locally supplied personalized air according to his/her own preference, and thus to improve his/her thermal comfort conditions.
The supply air terminal devices (ATD) used for PV are located close to the breathing zone of occupants. ATDs of different design, allowing control of airflow rate and some of them for control of flow direction, have been tested (Fig. 20a): two small nozzles (PEM) placed at the back corners of a desk and generating two symmetrical jets or two linear diffusers placed at the front desk edge generating two jets, one toward the occupant’s body (HDG) and the second vertically (VDG), directed slightly away from the occupant (Sodec and Craig, 1990; Arens et al., 1991; Bauman et al., 1993; Faulkner et al., 1993; Faulkner et al., 1995; Faulkner et al., 1999; Tzuzuki et al., 1999; Cho et al., 2001; Melikov et al., 2002; Cermak and Melikov, 2003; Cermak and Melikov, 2004; Faulkner et al., 2004; Melikov, 2004), ATD (MP) with a rectangular or circular opening mounted on a movable arm-duct which allows for changes of the distance between the ATD and the person as well as the direction of the personalized flow (Melikov et al., 2002; Bolashikov et al., 2003), a flat ATD mounted on the top of a PC monitor (CMP) allowing for change of personalized flow direction in a vertical plane (Melikov et al., 2002), a small nozzle integrated with the flexible support of a commercially available headphone supplying air very close to the mouth and the nose (Bolashikov et al., 2003), or combinations of some of these ATDs (Kaczmarczyk et al., 2004). Several other designs, such as a circular nozzle attached to the chest blowing air against the face (Zuo et al., 2002), a displacement ATD placed below the desk (Loomans, 1999; Izuhara et al., 2002), a ventilation tower system (Hiwatashi et al., 2000), a partition integrated fan-coil unit (McCarthy et al., 1993; Jeong and Kim, 1999; Chiang et al., 2002; Levi, 2002) and other designs have all been tested. A system using textile surfaces as supply air terminal devices (ATD) for the PV is a design which has been tested for both chairs and beds (Fig. 20b). For a seat the air can be supplied through a neck rest, a pillow behind the head or through part of the chair (Nielsen et al., 2007; Nielsen et al., 2008a; Nielsen et al., 2008b).Air can be supplied efficiently to the breathing zone of a seated person by nozzles installed on the two sides of the headrest (Melikov et al., 2012). An efficient way to reduce the supplied ventilation air is to remove the exhaled air and body effluents before they are mixed with the room air by headset and chair incorporated personal exhaust (PE), Bolashikov et al., 2015; Bivolarova et al., 2016).
Energy and Buildings, November 2019, Vol. 202 ! https://doi.org/10.1016/j.enbuild.2019.109359 19https://escholarship.org/uc/item/85x6r3wv

Fig. 20. (a) Personalized ventilation - Examples of tested air supply terminal devices (ATD): Movable Panel (MP), Computer Monitor Panel (CMP), Vertical Desk Grill (VDG), Horizontal Desk Grill (HDG), and Personal
Environments® Module (PEM) (b) Personalized ventilation through chair textile.
Physical measurements identify a significant decrease of pollution concentration in inhaled air with PV in comparison with TV (Faulkner et al., 1993; Faulkner et al.,1999; Melikov et al., 2002; Zuo et al., 2002; Bolashikov et al., 2003; Cermak and Melikov, 2003; Melikov et al., 2003; Cermak and Melikov,2004; Cermak et al., 2004; Faulkner et al.,2004). The optimal performance for most of the ATD has not exceeded 50-60% of clean air in the inhaled air. Highly efficient ATD providing almost 100% clean and cool personalized air to be inhaled by the user have been developed, making it possible to increase the ventilation effectiveness 20 times or more compared to mixing ventilation (Bolashikov et al., 2003; Melikov et al., 2003). The temperature of the inhaled air may be decreased by up to 6ºC (at warm indoor conditions) in comparison with mixing ventilation and this will further improve perceived air quality.
Human response to PV has been documented with both temperate and tropically acclimatized subjects (Kaczmarczyk et al., 2002; Zeng et al., 2002; Kaczmarczyk, 2003; Yang et al., 2003; Kaczmarczyk et al.,2004; Sekhar et al., 2005). PV combined with MV or DV improves perceived air quality and decreases Sick Building Syndrome (SBS) symptoms. The acceptability of inhaled air provided by a PV increases at higher background room air temperature (Yang et al., 2003; Kaczmarczyk et al., 2004). SBS symptoms, such as headache, decreased the ability to think clearly, etc. remained significantly less intense with PV than with MV. At room air temperature below 23ºC and low odor intensity, the performance of PV with regard to health and comfort may be different. PV may not improve perceived air quality significantly in comparison with TV and may cause draught discomfort, but it still may remain important for occupants’ SBS symptoms (Melikov and Kaczmarczyk, 2012).
PV improves peoples’ thermal comfort (Kaczmarczyk et al., 2002; Zeng et al., 2002; Kaczmarczyk, 2003; Yang et al., 2003; Kaczmarczyk et al., 2004). The acceptability of the thermal environment with PV compared to without PV significantly improves at room temperature above 23 ºC. Control over supply airflow rate, i.e., local air velocity, obviously makes it possible to avoid draught discomfort. However, at room air temperature above 26ºC the cooling capacity of the personalized flow targeting a relatively small body surface area may not be enough to provide some people with thermal comfort without causing draught discomfort, though it significantly improves whole-body thermal comfort (Sekhar et al., 2003; Yang et al., 2003). In such cases, ATD that allowed control of the supplied PC flow might be applied (Bolashikov et al., 2013a).
Personalized air supplied close to the face may cause increased eye blinking (Wyon, 1987) and skin irritation and may be felt uncomfortable. The increase of the room air temperature and relative humidity from 23 °C and 40% to 26 °C and 70% or to 28 °C and 70% decreased the eye blinking frequency (Melikov et al., 2011). The effect of PV on people's tear film stability and eye blinking at a warm and humid environment (26 and 28°C at 70% relative humidity) was studied and compared with their responses in a comfortable environment (23°C and 40% relative humidity)(Melikov et al., 2013). The use of PV improved tear film stability as compared to that in a warm environment without PV.
The freedom of control over direction and flow rate of personalized air is important for lowering the risk of draught sensation and to improve occupants’ satisfaction. Personalized airflow toward the face is preferred over
!
(a)
!
(b)
Energy and Buildings, November 2019, Vol. 202 ! https://doi.org/10.1016/j.enbuild.2019.109359 20https://escholarship.org/uc/item/85x6r3wv

airflow towards the abdomen, although airflow from the side has been used as well. The preferred flow rate ranges from 3 to 20 L/s (0.2-1.2 m/s). (Kaczmarczyk, 2003; Kaczmarczyk et al., 2004).
Parameters influence the performance: The amount of inhaled clean personalized air has been shown to depend on the design of the ATD and its positioning in regard to the occupant, the flow rate (typically from less than 5 L/s up to 20 L/s) and the direction of the personalized airflow, as well as the difference between the room air and the PV airflow temperature, size of target area, etc. (Faulkner et al., 1999; Melikov et al., 2002).In this regard, the interaction of flows in the vicinity of the user’s body, especially at the breathing zone is important. Some of these flows are indicated in Fig. 21.
!
Fig. 21. Personalized ventilation−Airflow interaction around human body: ①free convection flow, ② personalized flow, ③respiration flow, ④ventilation flow, ⑤thermal flow.
The interaction of flow near the breathing zone and its importance for the thermal comfort, perceived air quality and cleanness of the air inhaled by the user has been studied in detail (Bolashikv et al., 2013a; Bolashikv et al., 2013b; Licina et al., 2015a; Licina et al., 2015b; Bivolarova et al, 2018; Kierat et al., 2018). Recommendations for design and positioning of the ATD, PV supply flow rate and temperature, control of characteristics of the supplied airflow and its interaction with the free convection flow existing around the human body has been suggested (Bolashikov et al., 2009; Bolashikov et al.,2010; Melikov and Dzhartov, 2013; Melikov, 2015).
The performance of PV in conjunction with MV, DV and UFAD has been studied by physical measurements and human response (Yang and Sekhar, 2007;Yang et al., 2009;Halvoňová, 2010a;Halvoňová,2010b;Halvoňová,2010c;Li et al., 2010;Yang et al., 2010a;Yang et al.,2010b;Li et al.,2011;Sun et al.,2012;Dalewski et al., 2014;Cermak and Melikov, 2003; Cermak and Melikov, 2004; Cermak and Melikov, 2006; Cermak and Melikov, 2007; Cermak et al., 2004; Cermak et al., 2006; Melikov et al., 2003).Besides the type of PV and background air distribution and their characteristics (supply flow rate, temperature, etc.), furniture design and arrangement and other physical aspects, the effect of occupants’ movement (Halvoňová, 2010a) on the performance of PV is important.
The PV, when properly designed and applied, has greater potential to prevent transmission of contagion between occupants compared to total volume ventilation. In rooms with MV, the use of PV always protects the occupants from the airborne transmission of infectious agents and is superior to mixing ventilation alone (Melikov et al., 2003). In rooms with displacement ventilation, however, PV promotes mixing of the exhaled air with room air (Melikov et al., 2003; Cermak et al., 2004; Cermak et al., 2006). A similar effect may occur in rooms with underfloor ventilation (Cermak and Melikov, 2003; Cermak and Melikov, 2004; Cermak and Melikov, 2007). In real life, this may lead to an increase of the risk of transmission of airborne infectious agents to occupants who are not protected by high-efficiency PV.
Another study focused on enhancing the health-based PV performance in a mock-up health-care clinic setting by integrating it with a localized/personalized exhaust device (Yang et al., 2014; Yang et al., 2015a; Yang et al., 2015b). Seat integrated PV and personal exhaust (PE) has been suggested for vehicle cabin applications and has been studied by physical measurements and human subjects (Melikov et al., 2012; Melikov and Dzhartov, 2013). The findings provided conclusive evidence of the effectiveness of PV-PE system in airborne infection control.
Energy and Buildings, November 2019, Vol. 202 ! https://doi.org/10.1016/j.enbuild.2019.109359 21https://escholarship.org/uc/item/85x6r3wv

Energy performance: Substantial energy savings have been reported when PV is used. Due to convective cooling of the body, PV can provide occupants with thermal comfort at elevated room temperature, 25 °C to 27 °C (Bauman et al., 1993; Kaczmarczyk et al., 2004; Melikov and Knudsen, 2007). Compared to total volume ventilation alone, substantial energy saving (up to 60%) is reported with PV combined with MV and used at elevated room temperature (Seem and Braun, 1992; Bauman et al., 1998; Sekhar et al., 2005; Schiavon et al., 2010; Sekhar et al., 2010). Combining PV supplying clean outdoor air with background MV based on cleaning and recirculating of room air is especially energy efficient in warm and humid outdoor conditions, mainly due to the reduction on energy used for dehumidification of the outdoor air.
The integrated PV-ACB system could achieve 16% energy savings at 100% peak cooling load and as high as 42% energy savings at 25% part cooling load, indicating the superior energy saving potential under part load conditions(Sekhar and Zheng, 2018).Lybenova et al. (2011) reported that PV coupled with background mixing ventilation, the possible reduction of the air supplied to the room was approximately 20% (and up to 40% when extending the temperature in the room by 2 °C above the upper limit recommended in the standards) compared to mixing ventilation only. When PV was combined with passive chilled beams, the reduction of the supplied air was up to 80%.
Application: PV can be applied in buildings with different purposes (office buildings, hospitals, auditorium, etc.) and vehicle compartments (cars, airplanes, etc.). The results reveal a superior performance of PV combined with a method for generating background compared to the methods for generating total volume environment alone. Several applications for PV in hospitals such as hospital-bed-integrated PV (Melikov, 2015), seat-integrated PV (Bolashikov et al., 2010; Melikov et al.,2012; Sun et al., 2012; Melikov and Dzhartov, 2013).
Local exhaust ventilation (LEV)
Performance
LEV is primarily an extract ventilation system which is very effective in rooms where localized typically warm contaminant sources can be identified, such as in industrial premises or kitchens. Normally, a local exhaust hood is placed above the source to remove the pollution before it can spread into the room. A range hood over a cook-top without buoyant forces (velocity-capture principle) is considered in Fig. 22a. The air approaches the range hood from all directions, i.e. the upstream flow volume (area) is large. Thus, the air velocity decreases rapidly with the distance from the hood. The air velocity near the cook-top (e.g., point P in Fig. 22a) is very low. Normally, cook-top producing heat sources generate thermal plumes. The plumes bring the contaminants upwards into the high-velocity territory of the range-hoods and thus the contaminants are captured and exhausted (i.e., the buoyancy-capture principle) (Fig. 22b)
�
Fig. 22. Two ventilation principles of range hoods (a) velocity-capture principle; (b) buoyancy-capture principle.
The sensible heat of kitchen appliance is released in the room space by radiation and convection. It should be noted that a hood is only possible to capture the convection part of the heat load. Radiation will always be present in the room space and to remove the loads caused by radiation, mechanical cooling should be introduced. Therefore, the actual capture efficiency is only related to the convective part of the heat load.
During the design phase, the airflow rate should be determined based on the convection flow. By increasing the airflow rate at the optimal point, the efficiency of the system could not be improved. On the other hand, unnecessary high airflow rates increase investment and operation costs. The exhaust airflow rate could be calculated with the known heat load of the kitchen appliance. By using convection heat load, the exact airflow rate is possible to compute (Li and Kosonen, 2019).
Energy and Buildings, November 2019, Vol. 202 ! https://doi.org/10.1016/j.enbuild.2019.109359 22https://escholarship.org/uc/item/85x6r3wv

Using the push-pull ventilation principle with capture jet, it is possible to improve the efficiency of hood. In Fig. 23, a thermal illustration is presented on the hood performance of a capture jet and a standard hood using the the same airflow rate. The standard exhaust hood required 30% greater exhaust airflow rate compared to the high efficient hood (Schrock et al., 2000).
!
Fig. 23. High efficiency hood with the capture jet (left panel) improves the contaminant removal efficiency compared to standard exhaust hood (right panel).
The similar improvements using capture jet were also demonstrated in a ventilated ceiling application (Kosonen and Mustakallio, 2003). The ventilated ceiling concept is a wall-to-wall system that covers the ‘active’ cooking area above the cooking appliances as well as the ‘passive’ area where there is no cooking processed. The system consists of stainless-steel exhaust air modules with grease filters, displacement ventilation through low-velocity supply air units. The efficiency of the exhaust system is improved with a jet installed flush alongside the active area. The small air jet helps to direct heat and impurities towards the exhaust, improving the capture and containment efficiency. Low-velocity air diffusers bring draught-free fresh air to the working zone (Fig. 24).
!
Fig. 24.Ventilated ceiling with air curtain ventilation.
A similar concept is also possible to utilize with kitchen hood. The supply units are installed in the false ceiling or hang on the wall. The air supply downward along the wall reaches the floor and then turns its direction to spread along the floor. The push-pull ventilation could also be executed with air-curtain slots located around the stove. The air curtain can deliver outdoor air into the kitchen. In Fig. 25,there is presented one concept studied (Zhou et al., 2019). With the air-curtain depending on the make-up arrangement, it was possible to improve the capture efficiency of up to 21% (from 75 % to 96 %).
η100% η100%
Energy and Buildings, November 2019, Vol. 202 ! https://doi.org/10.1016/j.enbuild.2019.109359 23https://escholarship.org/uc/item/85x6r3wv

Fig. 25. Schematic of the air curtain ventilation with a hood (a) the push-pull ventilation system (b) dimension of the kitchen setup.
Laminar airflow (LAF)/Piston ventilation (PiV)
Performance
In this method of air distribution, the air is supplied vertically or horizontally across the whole room at low velocity (typically 0.2 to 0.3 m/s) and turbulence to create a “piston” type flow. This is a very effective way of removing contaminants from the room, but it is also costly and requires a very high airflow rate (200 to 600 air changes per hour). Hence, it is only used in special applications, such as clean rooms and hospital operating theatres.
Unlike traditional MV systems, LAF aims to minimize contamination by supplying an unidirectional clean air from the ceiling to the operating zone at relatively lower supply velocities (0.2-0.3 m/s), which enables the LAF to swipe (a “washing” effect) airborne pathogens away from the surgical site (Fig. 26).
! !
Energy and Buildings, November 2019, Vol. 202 ! https://doi.org/10.1016/j.enbuild.2019.109359 24https://escholarship.org/uc/item/85x6r3wv

Fig. 26. Laminar airflow system in operating rooms (a) Schematic outline of airflow from a LAF unit in an operating room (b)A photo of the operating room with LAF and other medical equipment (Cao et al., 2018).
Based on a review of 16 national and international standards in 2006, there is, to a certain extent, a global consensus for appropriate supply air velocity (0.20-0.30 m/s) and HEPA filtration efficiency (99.5-99.7%) (Melhado, 2006). The trend of enlarging the area of LAF has been followed by several other national guidelines in the past 10 years. In support of these revisions, several studies have shown that the use of large-size LAF ceilings reduces the microbiological contamination in operating rooms compared to small-sized LAF systems (Diab-Elschahawi et al., 2001; Benen et al.,2013; Wagner et al., 2014).
However, recent analyses suggest increased post-operative surgical site infections (SSI) rates in operating rooms with LAF (McHugh et al., 2015). Other studies showed significantly higher severe SSI rates following knee prosthesis and significantly higher SSI rates following hip prosthesis under laminar airflow conditions (Brandt et al., 2008). Recent studies show that there are several factors that affect the performance of LAF in operating rooms, including the presence of surgical facilities and a few transient phenomena, e.g., turbulent airflows, movement of surgeons, and cauterization of surgical wounds, which may cause significant changes air distribution pattern (Aganovic et al., 2017; Cao et al., 2018; Cao et al., 2019). The recently published WHO guideline suggested that LAF systems should not be used to reduce the risk of SSI for patients undergoing total arthroplasty surgery (based on conditional recommendation, low to very low quality of evidence)) (WHO 2016).
Discussion
Application potentials for heating mode
Most aforementioned ventilation strategies are mainly developed for cooling mode, especially stratified ventilation strategies driven by buoyancy, which results in a major challenge: short-circuiting, i.e., the warm air supplied finds its path of least resistance, largely bypassing the occupied zone before leaving the room (Fig. 27 a and b), which can result in energy wastage and thermal discomfort. Because both the air source(s) and sink(s) are within the occupied zone, the warm air supplied by SV is “forced” to flow through the occupied zone (Fig. 27c). Therefore, SV can be applied for both cooling and heating.
Fig. 27. Heating application (a) ceiling supplied (b) floor supplied (c) stratum ventilated.
Cheng et al. (2017) investigated the effect of air supply angles on the performance of SV. The results show that air supply angles can significantly affect indoor air velocity and temperature distributions, energy utilization and thermal comfort level. The optimal air supply angle was found to be 30° below the plan. The energy utilization efficiency was up to 1. 28, and the thermal comfort indices including the PMV, PPD, PD and vertical air temperature difference between head and ankle, satisfy the requirements of ASHRAE 55-2013.
Apart from SV, IJV and CJV are also suitable for heating mode. Studies for both of IJV and CJV have shown that jets for these types of air distribution systems have a higher momentum than DV but lower that MV systems (Karimipanah and Awbi, 2002; Karimipanahetal., 2007; Karimipanahetal et al., 2008). The moderate jet momentum of these systems enables the air jet to overcome the buoyancy force generated from heat sources in the ventilated zone and they were found to be suitable for application in both cooling and heating modes. In addition, the floor jets generated were found to be capable of reaching further regions of the floor compared to DV air supplies.
Evaluation of different kinds of airflow patterns
The definition of ventilation effectiveness appeared in the mid-1900s (Cao et al., 2014), which is defined to describe the ability of the ventilation system to remove the contaminant. Besides, the ventilation system is used to protect people and prevent contaminant exposure in some cases (Cao et al., 2015a; Cao et al., 2015b). However, people found that the ability of the ventilation system to supply fresh air and provide acceptable
(a)
(b)
(c)
Energy and Buildings, November 2019, Vol. 202 ! https://doi.org/10.1016/j.enbuild.2019.109359 25https://escholarship.org/uc/item/85x6r3wv

indoor thermal comfort is also important. In this way, air change efficiency, contaminant removal effectiveness, protection efficiency, as well as thermal comfort become the four main aspects to reflect the performance of the ventilation system. Therefore, the indices to evaluate air change efficiency, contaminant removal effectiveness, protection efficiency, thermal comfort and the overall performance of the ventilation system are introduced.
1. Air exchange efficiency
Conventionally, air change per hour (ACH) is used to describe the air exchangeability in fully MV system. However, indoor air is usually non-uniformly distributed, so different kinds of indices on the air exchange effectiveness are developed to evaluate the effectiveness of delivering supply air to a particular point, zone or the whole room.
To evaluate the effectiveness of supply air to a point in ventilated space, several indices have been proposed. The age of air was proposed (Sandberg et al., 1986) to evaluate the ability of the ventilation system to exchange air. This index represents the time required for the supply air to reach a certain point in the space. Normally the concept of the age of air is only limited to indoor part and the air age at the inlets of air diffusers are taken as zero, which may not be used in the ventilation system with recirculation. In this way, Li et al. (2003) proposed the concept of total air age which considers the impact of air delivery process and air recirculation on the air age. Besides, the purging flow rate (PFR) is used to describe the purging air supply rate for the entire room. To reflect the equivalent purging flow rate at a specific location, Davidson (1987) proposed the local purging flow rate (LPFR) based on PFR. The smaller age of the air and the higher LPFR are, the fresher the air at the point is.
To evaluate the overall efficiency of the ventilation system within the room, the air change effectiveness (Sandberg, 1981) is defined as the ratio of volume-averaged air age of piston flow, which is considered as the most efficient ideal airflow patterns (Etheridge and Sandberg, 1996), to the exact volume-averaged air age of the room. However, this index does not take occupant distribution in the room into account thus it is not suitable for the evaluation of demand-oriented ventilation. Therefore, occupied density (OD) was proposed and the air change effectiveness was revised (Zhao et al., 2003), which can better evaluate the ventilation efficiency under different occupant distribution or demand.
In order to reflect the influence of each supply air inlet on a specific location, the index of SVE4 was proposed (Kato and Murakami, 1988). However, this index is only used in steady-state cases. To reflect the influence of each supply air inlet on a point/zone within a finite time period, the accessibility of supply air (ASA) was brought out (Li and Zhao, 2004) and it is widely used in antiterrorist emergency ventilation (Li et al., 2009), fast prediction and control of non-uniform indoor environment (Shao and Li, 2015; Liang et al., 2017; Shao et al., 2017). In addition, to reveal the influence of variable concentration in supply air on each point, the response coefficient of supply air (RCSA) was proposed (Li and Zhu, 2009) by releasing “pulse” tracer gas in the supply air inlet.
2. Contaminant removal effectiveness
The concentration of contaminant can be easily calculated by the intensity of contaminant source and air change rate in fully MV. In fact, the concentration of contaminants is non-uniformly distributed and it is determined by both the position and intensity of contaminant sources, and airflow patterns. Therefore, different kinds of indices were proposed to evaluate contaminant removal effectiveness.
The most important index to evaluate the effectiveness of contaminant removal is ventilation efficiency, which is defined as the relative effectiveness for contaminant removal compared with MV, and this index can be used for the evaluation of either the whole ventilated space or single point/zone (Sandberg, 1981; Awbi and Gan, 1993). To provide the instinct understanding of the effectiveness of the ventilation system, SVE1, SVE2 and SVE5 were proposed (Kato and Murakami, 1988). To be specific, SVE1 index represents the spatial average of contaminant concentration in a room where contaminants are released from a single-point source. In the meantime, SVE2 represents the mean radius of contaminant diffusion, which could be served as the expansion range of the contaminant source. Since there might be several exhaust openings in the room, it is essential to assess the contribution ratio of an exhaust opening for exhausting contaminants. Thus SVE 5, which represents time-reversed tracing of the flow field, was proposed (Kato et al., 1992).
In order to evaluate the transient spreading performance of contaminant, the concept of accessibility of contaminant source (ACS) was proposed (Li and Zhao, 2003) to evaluate the effect of contaminant source on a point within a limited period. Later it was integrated with OD (Zhao et al., 2003) to consider the influence of contaminant source on the occupied area in a short period (Zhao et al., 2004). It was also used in the identification of contaminant sources with a limited number of sensors (Cai et al., 2012; Cai et al., 2013). In addition, response coefficient of contaminant source (RCCS) was proposed to describe the influence of a “pulse” contaminant source on any point after the contaminant is released (Li and Zhu, 2009).
Energy and Buildings, November 2019, Vol. 202 ! https://doi.org/10.1016/j.enbuild.2019.109359 26https://escholarship.org/uc/item/85x6r3wv

3. Protection efficiency
Unlike traditional ventilation systems, the principle of POV (protected occupied zone ventilation)/PZV (protected zone ventilation) is to separate an internal space into different personal work areas or subzones using downward plane jets. The POV can be applied in a POZ, which is defined as an area of the occupied zone in a room consisting of the breathing zone and the personal working zone. To specify how the POV protects people from exposure to indoor pollutants, which may be transferred from the polluted zone to the clean zone, the protection efficiency (PE) is proposed. The larger the PE, the better the protection (Cao et al., 2015a).
In order to extract polluted air, additional fresh air can be delivered to each subzone via extra supply. In this way, an indicator, which is defined as the ratio of the contaminant concentration to which the occupants are exposed to the concentration in the exhaust, is subsequently used to evaluate the exposure of occupants to the contaminant source as the personal exposure value. When the supply air velocity increases up to 4 m/s, this exposure indicator is 40% lower than for the fully mixed ventilation (Cao et al., 2015b). However, a recent study shows that the contaminant exposure index may be higher than 0.6 (Aganovic and Cao, 2019).
4. Thermal comfort
The indices to evaluate thermal comfort can be divided into two categories: one is for the air-conditioned environment and the other is for the free-running environments.
For the air-conditioned environment, PMV is a classical and well-recognized parameter used for evaluating thermal comfort levels inside buildings (Fanger, 1970). This index predicts the mean response regarding the thermal sensation of a large group of people exposed to certain thermal conditions for a long time. Correspondingly, PPD is used to predict the percentage of people who are dissatisfied with the thermal environment (Fanger, 1984). The combination of PMV/PPD has been widely used to evaluate the thermal comfort in a uniform indoor environment for several decades (Jang et al., 2007; Wei et al., 2010).
For the free-running environment, the PMV/PPD index has limitation in assessing the environment that occupants are free to adapt since PMV/PPD is focused on the uniform /well-controlled environment (Humphreys, 1978; Nicol and Humphreys, 2002). The adaptive model is based on the principle that the optimal indoor operative temperature is a linear function relating to the outdoor air temperature(ANSI/ASHRAE, 2013; ANSI/ASHRAE, 2017).
Apart from the linear regression model, Fanger and Toftum (2002) proposed the modified ePMV Index by introducing an expectancy factor e, which varies between 0.5 and 1.0 to correct the results that apply to non-air-conditioned buildings. Yao et al. (2009) proposed the aPMV model as a bridge between lab-based and field survey studies to allow extending the application of PMV in free-running buildings. The aPMV model has been adopted in the Chinese standard (Li et al., 2014).
5. Overall performance evaluation
Besides the index to evaluate one aspect of a ventilation system, there are some indices used to evaluate the performance of the ventilation system in a more holistic approach. The Air Diffusion Performance Index (ADPI) (Koestel and Tuve, 1955) and Air Distribution Index (ADI) (Awbi, 2011) are two such kinds of indices. ADPI is used for the non-uniform environment while ADI can be used for both uniform and non-uniform environments.
ADPI is one of the earliest indices to assess the performance of a ventilation system. It was primarily developed for understanding air jet distribution. In this method, the performance of an air distribution system is assessed by the level of draught created in the occupied zone of a room due to the supply air jet. Using the Effective Draught Temperature concept, an analytical procedure was developed (Nevins, 1976) that is based on the measured values of air temperature and velocity at uniformly spaced points throughout the occupied zone to assess the ventilation performance. However, ADPI focuses only on the link between draught and air temperature and does not consider other thermal comfort parameters.
To reflect the effectiveness of the ventilation system for contaminant removal as well as distributing the thermal energy of the supply air, Awbi (2003) proposed the ADI to evaluate the ventilation effectiveness for contaminant removal and heat removal as well as the thermal comfort indices. To make it practical for both uniform and non-uniform environment, two different thermal comfort models were adopted. The index for the uniform environment is called ADI and that for the non-uniform environment is called the New Air distribution Index (ADINew). For uniform conditions in the occupied zone, a single-zone thermal comfort model, such as the Fanger PMV/PPD model, can be used but for non-uniform conditions in the occupied zone, a multi-node thermal comfort model will be required. Details of these models can be found (Awbi, 2003;Awbi, 2011; Awbi, 2017; Almesri et al.,2013).
Energy and Buildings, November 2019, Vol. 202 ! https://doi.org/10.1016/j.enbuild.2019.109359 27https://escholarship.org/uc/item/85x6r3wv

Measurement of airflow field As reviewed by Chen(2009), ventilation study is normally conducted with analytical models, empirical models, small-scale experiment, full-scale experiment, multizone network models, zonal models and Computational Fluid Dynamics (CFD) models, among which CFD model is recognized as the most popular prediction method. Meanwhile, all these prediction models need experimental data for validation, which makes the measurement of flow field crucial for indoor ventilation study.
The measurement scheme for indoor airflow can be divided into intrusive and non-intrusive methods. For intrusive methods, the sensors have direct contact with measured airflow and the typical examples are heating wire anemometer (HWA) and Pitot static tube. An HWA is the most widely used sensor for air velocity test with known drawbacks (Bruun, 1995). For example, the measuring sensor must be placed in the flow field, rendering itself an obstacle for airflow, and the released heat limits its use for low-speed airflow measurement. Further, the lack of flow direction information leads to some missing flow characteristics. More importantly, the point-by-point HWA measuring approach is labor intensive and time-consuming.
For non-intrusive measurement instruments, they can be further divided into point-wise and global-wise according to the measurement space. Point-wise solutions include ultrasonic anemometry (UA) (Knowles et al., 1953), laser Doppler anemometry (LDA) (Cummins et al., 1964). UA and LDA can deliver precise three-component velocity information at one point or on a grid with the help of a mobile system. However, it is difficult to guarantee that the flow field is stable during the testing process, and the test may also be a time-consuming process, making them only suitable for a stationary laboratory test.
Global-wise solutions are normally image based which use seeding particles to visualize the airflow and utilize cameras to record and track the movement of the seeding particles for velocimetry. Particle image velocimetry (PIV) could be the most commercially successful image-based velocimetry for airflow measurement(Adrian, 2005). However, its measurement space is limited: it hardly reaches 1 m2 in a two-dimensional plane model. As the character length of the indoor airflow pattern is several meter(Sandberg, 2007), the measurement space is important for indoor airflow instruments.
Particle streak velocimetry (PSV) which takes an image with a long exposure time to record the path line segments for tracking is more promising for room scale airflow measurement (Sun, 2007). However, the biggest challenge of PSV is the direction ambiguity of streak which limits its use in complex airflow measurement. In order to freeze the image of seeding particles, particle tracking velocimetry (PTV) takes pictures at a very high speed, normally up to 100 Hz (Biwole et al., 2009), and tracks the spots frame by frame for the entire trajectory (Maas et al., 1993). However, a large amount of data, counted in gigabyte/s, limits each sample time to several seconds (Fu et al., 2015). As the frame-rate and resolution are trade-off parameters for cameras, the low resolution of high-speed cameras normally limits the PTV test zone to within 1 m3.
Beside all these systems, color sequence particle streak velocimetry (CSPSV) changed the information-gathering method for image-based velocimetry and proved to be more suitable for room-scale airflow pattern measurement (Wang et al., 2017). The accuracy of CSPSV has been proven by verification with different targets (Wang et al., 2017; Wang et al.,2018). It extends the three-dimensional (3D) measurement zone from several cubic centimeters to several cubic meters and is more feasible in performing real-site large space airflow tests(Wang et al., 2019).
Conclusions
Different advanced ventilation and air distribution methods were reviewed and summarized in terms of their theory research, practical application, main limitations and corresponding solutions. Different advanced air distribution methods suit different types of applications. They can also be used compositely with radiant-dominant way. To evaluate the performance of ventilation methods, different evaluating indices were used including thermal comfort, ventilation efficiency, air quality, healthy effects for avoiding cross-infection, energy efficiency, cognitive performance, etc. Measuring methods for airflow field were also summarized. Some methods are relatively matured with many successful engineering cases, while others are still under concept design and chamber study stage. Some trials, such as pulsate airflows, were made for certain air distribution methods and can be generalized for other air distribution methods. The purpose is to communicate with HVAC researchers, engineers, policy makers, manufacturers, etc.
Acknowledgements
J. Niu contributed to the part of mixing ventilation (MV); C. Zhang, P. V. Nielsen and R. Kosonen contributed to the part of diffuse ceiling ventilation (DCV); R. Kosonen and B. Yang contributed to the part of displacement ventilation (DV); S. Schiavon and F. Bauman contributed to the part of under floor air distribution (UFAD); Z. Lin contributed to the part of stratum ventilation (SV); H. Awbi, G. Cao, R. Yao and T. Karimipanah contributed
Energy and Buildings, November 2019, Vol. 202 ! https://doi.org/10.1016/j.enbuild.2019.109359 28https://escholarship.org/uc/item/85x6r3wv

to the part of impinge jet ventilation (IJV)/confluent jets ventilation (CJV); B. Yang and R. Kosonen contributed to the part of wall attached ventilation (WAV); A.Kabanshi, M. Sandberg and H.Wigö contributed to the part of intermittent air jet strategy (IAJS); G. Cao contributed to the part of protected occupied zone ventilation (POV); A. K. Melikov, B. Yang, S. C. Sekhar, K. W. Tham, K.W. D. Cheong and P. V. Nielsen contributed to the part of personalized ventilation (PV); R. Kosonen contributed to the part of local exhaust ventilation (LEV);G. Cao contributed to the part of laminar airflow (LAF)/piston ventilation (PiV); Z. Lin and A. Hazim contributed to the part of application potentials for heating mode; X. Li, S. Kato, R. Yao and G. Cao contributed to the part of evaluation of different kinds of airflow patterns; X. Li contributed to the part of measurement of airflow field. B. Yang coordinates different parts of the paper. Other co-authors are sequenced in alphabetical order, based on their personal names.
Energy and Buildings, November 2019, Vol. 202 ! https://doi.org/10.1016/j.enbuild.2019.109359 29https://escholarship.org/uc/item/85x6r3wv

Table 1 Performance comparisons among MV, DV, WAV, CAV, SV, DCV, CJV, UFAD, PV, IJV, PZV/POV and IAJS.
MV DV WAV CAV
Schematic
s
Airflow
characterist
ics
Movement
mechanism
Supply air momentum dominant, different
directions between supply air momentum and thermal
plume, inhibited effect
Thermal plume dominant, same direction between
supply air momentum and thermal plume, support
effect
Controlled by both supply air momentum and thermal
plume, same direction between supply air
momentum and thermal plume, support effect
Controlled by both supply air momentum and thermal
plume, same direction between supply air
momentum and thermal plume, support effect
Airflow
mechanism
Strong entrainment Airflow diffusion, buoyancy uplift
Airflow momentum diffusion, buoyancy uplift
Airflow momentum diffusion, buoyancy uplift
Air supply characteristics
Big temperature difference, high air velocity
Small temperature difference, low air velocity
Relatively big temperature difference, relatively high
air velocity
Relatively big temperature difference, relatively high
air velocity
Spatial form
Spatial utilizat
ionUpper space
Lower space (raised access floor, obstacle for occupied
zone)Existing walls (save lower
space)Existing columns (save
lower space)
Air supply
and return
Ceiling supply and return, ceiling supply and floor
return
Floor supply and ceiling return Ceiling supply and return,
ceiling supply and floor return
Ceiling supply and return
Ventilation effect
s
Target Offset total space load, uniform temperature and
humidity
Offset occupied zone load, thermal comfort for
occupied zone
Offset occupied zone load, thermal comfort for
occupied zone
Offset occupied zone load, thermal comfort for
occupied zone
Distribution Uniform Temperature/concentration
stratificationTemperature/concentration
stratificationTemperature/concentration
stratification
Air quality Close to return air quality Close to supply air quality
Between supply and return air quality, more close to
supply air quality
Between supply and return air quality, more close to
supply air quality
Air change efficiency
≈50% 50~100% 50~100% 50~100%
Ventilation
efficiency
About 1.0(Office) 1.2-1.5(Office) 1.1-1.4(Office) 1.1-1.3(Office)
Thermal
comfort
Small temperature difference between head
and feet
Big temperature difference between head and feet, strong draft
Small temperature difference between head
and feet, weak draft
Small temperature difference between head and
feet, weak draft
SV DCV CJV UFAD
Energy and Buildings, November 2019, Vol. 202 ! https://doi.org/10.1016/j.enbuild.2019.109359 30https://escholarship.org/uc/item/85x6r3wv

Schematic
s
Airflow
characterist
ics
Movement
mechanism
Controlled by both supply air momentum and thermal buoyancy, perpendicular
directions between supply air momentum and thermal buoyancy, intervened effect
Thermal plume dominant the air movement
Affected by jet momentum and thermal buoyancy
Controlled by both supply air momentum and thermal
plume, same direction between supply air
momentum and thermal plume, support effect
Airflow
mechanism
Low entrainment, airflow momentum, diffusion,
buoyancy fall (cooling), buoyancy uplift (heating)
Strong entrainment
Jet spread is affected by local entrainment of
individual jets and upward flow due to buoyancy
Partial entrainment, airflow momentum diffusion,
buoyancy uplift
Air supply characteristics
Small temperature difference, relatively high air velocity, high power
spectrum density
Big temperature difference, low air velocity
Medium jet supply velocity and moderate temperature difference between supply
and occupied zone
Medium temperature difference and inlet velocity.
Less than MV, but higher than DV
Spatial form
Spatial utilizat
ionCavity wall (save ceiling
void) Suspended ceiling Ceiling, wall or floor Lower space, partial mixing provided in occupied zone
Air supply
and return
Wall supply, wall, floor or ceiling return
Ceiling supply and floor or ceiling return
Air supply can be at different heights
Floor level supply through raised access floor, ceiling
return
Ventilation effect
s
TargetOffset occupied zone load, IAQ and thermal comfort
for occupied zone
Offset total space load, uniform temperature and
humidity
Achieving long spread along the floor and utilizing the advantages of buoyancy
flow
Offset occupied zone load, thermal comfort for
occupied zone
Distribution
Sandwiched velocity, temperature and
concentration distributions
Uniform (high heat load) Temperature/concentration
stratification (low heat load)
Capable of providing both heating and cooling of the space for moderate heat
loads
Temperature/concentration stratification
Air quality Close to supply air quality Close to return air quality Similar provision to DV
but higher than MV
Between supply and return air quality, more close to
supply air quality
Air change efficiency
Unknown (no transient trace gas test has been
conducted)≈50% 50 to 60% 50~100%
Ventilation
efficiency
1.29-1.76 (Tian et al. 2011, Cheng et al. 2019) Close to 1.0(office) 1.1 to 1.2 1.1-1.3 (Office)
Thermal
comfort
Small temperature difference between head
and feet, weak draft near or above neutral temp’ temp
Small temperature difference between head
and feet, weak draft
Lower temperature stratification in the
occupied zone than DV but higher than MV
Medium temperature difference between head and feet, strong draft if close to
diffuser
PV IJV PZV/POV IAJS
Schematic
s
Energy and Buildings, November 2019, Vol. 202 ! https://doi.org/10.1016/j.enbuild.2019.109359 31https://escholarship.org/uc/item/85x6r3wv

Airflow
characterist
ics
Movement
mechanism
Locally applied flows close to
the breathing zone; local exhaust flows
Affected by jet momentum and thermal buoyancy
Affected by the initial momentum of the plane jet
and indoor heat source
Elevated intermittent airflow supply targeting the sitting
zone
Airflow
mechanism
Free, wall, confined, inserted jets;
Jet spread due to moderate momentum and upward flow due to buoyancy
Downward plane jet will separate a room into two
parts after the impingement of the jet on the floor
Downward unconfined confluent jets, rapid
variations of ventilation flow rate, indoor air
recirculation
Air supply characteristics
Jets with different direction, size and
geometry; low mixing with and entrainment of
surrounding polluted room air aimed
Medium jet supply velocity and moderate temperature difference between supply
and occupied zone
Moderate supply velocity (1.0 m/s - 2.0m/s) may
keep different concentration levels within
a room
Medium jet supply velocity andmoderate temperature difference between supply
and occupied zone
Spatial form
Spatial utilizat
ion
Furniture installed (desk, chair, seat, etc.) and wearable (headset incorporated, etc.)
Walls, corners or columns Under ceiling Suspended below the ceiling
Air supply
and return
Close to occupant’s breathing zone; no exhaust requirements; less efficient ceiling and floor insulations
possible
Air supply about mid-height of the occupied zone
and extract at high level
Return on the floor level or at ceiling level Ceiling supply, return on the
floor level or at ceiling level
Ventilation effect
s
Target Inhaled air to be 100% clean
Achieving long spread along the floor and utilizing the advantages of buoyancy
flow
Separating indoor space into separate zones by
plane jet
Penetration of supply air in the breathing zone,
increased convective cooling
Distribution
Can be used for cooling at warm environment and
heating in moderately cool environment
Capable of providing both heating and cooling of the space for moderate heat
loads
Suitable for cooling and ventilation purpose
Suitable for cooling and ventilation purpose
Air quality
Good design provides very high air quality
Similar provision to DV but higher than MV
Higher protection efficiency than MV with
proper design
Performance is between MV and DV, reduced exposure to contaminants transported in
the CBL
Air change efficiency
- 50 to 60% Similar to MV 50-60%
Ventilation
efficiency
Typically 2-3; good design up to 50 and more 1.1 to 1.2
14-50% protection
efficiency1.1 to 1.2
Thermal
comfort
Excellent thermal comfort due to individual control
provided to the user
Lower temperature stratification in the
occupied zone than DV but higher than MV
Supply velocities of 1.0, 1.5 and 2.0 m/s did not exceed the suggested comfort criterion of 20%
even at lower supply temperatures (Aganovic et
al. 2019)
Increased cooling effect due to fluctuating air flow,
increased risk of draft in low indoor temperatures
Energy and Buildings, November 2019, Vol. 202 ! https://doi.org/10.1016/j.enbuild.2019.109359 32https://escholarship.org/uc/item/85x6r3wv

References
Adrian, R. J. (2005) Twenty years of particle image velocimetry,Exp Fluids.,39:159–169.
Aganovic, A. (2019) Airflow distribution for minimizing human exposure to airborne contaminants in healthcare facilities, PhD thesis (Norwegian University of Science and Technology), 2019:41. ISBN:978-82-326-3686-0, printed by SkipnesKommunikasjon AS.
Aganovic, A. and Cao, G. (2019) Evaluation of airborne contaminant exposure in a single-bed isolation ward equipped with a protected occupied zone ventilation system, Indoor Built. Environ., (https://doi.org/10.1177/1420326X18823048).
Aganovic, A., Cao, G., Stenstad, L-I.andSkogås, J. G. (2017) Impact of surgical lights on the velocity distribution and airborne contamination level in an operating room with laminar airflow system,Build. Environ.,126:42−53.
Aganovic, A., Steffensen, M. and Cao, G. (2019) CFD study of the air distribution and occupant draught sensation in a patient ward equipped with protected zone ventilation. Build. Environ., (https://doi.org/10.1016/j.buildenv.2019.106279).
Almesri, I., Awbi, H. B., Foda, E. and Siren, K. (2013) An air distribution index for assessing the thermal comfort and air quality in uniform and non-uniform environments, Indoor Built. Environ.,22: 618−639.
Arens, E. A., Bauman, F. S., Johnston, L.P. and Zhang, H. (1991) Testing of localized thermaldistribution systems in a new controlled environment chamber, Indoor Air, 1: 263–281.
ASHRAE ANSI/ASHRAE Standard 170-2013: Ventilation of Health Care Facilities.Atlanta, GA, US: American Society of Heating, Refrigerating and Air-Conditioning Engineers, Inc., 2013.
ASHRAE ANSI/ASHRAE Standard 55-2013:Thermal Environmental Conditions for Human Occupancy. Atlanta, GA, US: American Society of Heating, Refrigerating and Air-Conditioning Engineers, Inc., 2013.
ASHRAE ANSI/ASHRAE Standard 55-2017:Thermal Environmental Conditions for Human Occupancy. Atlanta, GA, US: American Society of Heating, Refrigerating and Air-Conditioning Engineers, Inc., 2017.
ASHRAE Handbook – Fundamentals.(2014) Chapter 20 Space Air Diffusion.
ASHRAE UFAD Guide (2013): Design, Construction and Operation of Underfloor Air Distribution Systems. Atlanta, GA, US: American Society of Heating, Refrigerating and Air-Conditioning Engineers, Inc., 2013.
Association Francoise de Normalisation. NF S 90-351: 2003–2006 Etablissement de Santé: SallesPropres et EnvironnementsMaîtrisés et Apparentés Association Francaise de Normalisation. 2003
Aune, K.S. (2014) Design, Commissioning and Testing of Operating Theatre & Isolation Rooms in Norway. Norwegian Hospital Construction Agency. Available: http://sjukehusbygg.no/wp-content/uploads/2015/11/presentasjonen.pdf [Accessed 10th June 2018].
Awbi, H.B. (2003) Ventilation of Buildings. Spon Press, London.
Awbi, H. B. (2011) Energy efficient ventilation for retrofit buildings, Proceedings of the 48thInternational Conference-Energy Performance of Existing Buildings, Baveno, Italy, 22-23 September 2011.
Awbi, H. B. (2017) Ventilation for good indoor air quality and energy efficiency, Energ Procedia, 112: 277−286.
Awbi, H. B. and Gan,G.(1993) Evaluation of the overall performance of room air distribution, Proceedings of the 6th International Conference on Indoor Air Quality and Climate, Helsinki, Finland, 4-8July 1993.
Bauman, F., Webster, T. and Dickerhoff, D. (2016) Field study of capitol area east end complex (CAEEC) Sacramento, California.Center for the Built Environment Report.University of California, Berkeley.
Bauman, F. and Webster, T. (2001) Outlook for underfloor air distribution, ASHRAE J., 43: 18–27.
Bauman, F. S., Carter, T. G., Baughman, A. V. and Arens, E. A. (1998) Field study of the impactof a desktop task/ambient conditioning system in office buildings, ASHRAE Trans., 104:125−142.
Energy and Buildings, November 2019, Vol. 202 ! https://doi.org/10.1016/j.enbuild.2019.109359 33https://escholarship.org/uc/item/85x6r3wv
Bauman, F. S., Zhang, H., Arens, E.A. and Benton, C. C. (1993)Localized comfort control with adesktop task conditioning system: laboratory and field measurements, ASHRAE Trans.,99: 733−749.
Benen, T., Wille, F. and Clausdorff, L. (2013) Influence of different ventilations systems upon the contamination of medical devices, Hyg Med.,38: 142–146.
Bertheussen, B., Mustakallio, P., Melikov, A., Kosonen, R.(2013) Performance of chilled beam with radial swirl jet and diffuse ceiling air supply in heating mode, Proceedings of the 11th REHVA World Congress CLIMA, Prague, Czech Republic, 10-13 June 2013.
Bivolarova, M., Kierat, W., Zavrl, E., Popiolek, Z. andMelikov, A. (2017) Control of airflow interaction in occupant vicinity for reduction of exposure to bioeffluents, Build. Environ.,125: 216−226.
Bivolarova, M., Rezgals, L., Melikov, A. K. andBolashikov, Z. D.(2016) Exposure reduction to human bio-effluents using seat-integrated localized ventilation in quiescent indoor environment, Proceedings of the12th
REHVA World Congress CLIMA,Aalborg, Denmark,22-25May 2016.
Biwole, P. H., Yan, W., Zhang, Y. and Roux, J-J. (2009) A complete 3D particle tracking algorithm and its applications to the indoor airflow study,Meas Sci Technol,20: No. 11.
Bolashikov, Z.,Barova, M. and Melikov, A. (2013b) Exposure control indoors with wearable personal exhaust unit, Proceedings of the 11th REHVA World Congress CLIMA, Prague, Czech Republic, 10-13 June 2013.
Bolashikov, Z., Melikov, A.and Krenek, M. (2009)Improved performance of personalized ventilation by control of the convection flow around occupant body, ASHRAE Trans.,115: 421−431.
Bolashikov, Z., Melikov, A.andKrenek, M. (2010) Control of the free convective flow around the human body for enhanced inhaled air quality: Application to a seat-incorporated personalized ventilation unit, HVAC&R Res.,16:161−188.
Bolashikov, Z., Melikov, A.andSpilak, M. (2013a) Experimental investigation on reduced exposure to pollutants indoors by applying wearable personalized ventilation, HVAC&R Res., 19: 385−399.
Bolashikov, Z., Nikolaev, L., Melikov, A. K., Kaczmarczyk, J. and Fanger, P. O. (2003) New air terminal devices with high efficiency for personalized ventilation application, Proceedings of the 7th International Conference on Healthy Buildings, Singapore, 7-11 December 2003.
Brandt, C., Hott, U., Sohr, D., Daschner, F., Gastmeier, P.andRüden, H. (2008) Operating room ventilation with laminar airflow shows no protective effect on the surgical site infection rate in orthopedic and abdominal surgery,Ann Surg.,248:695−700.
Bruun, H. H. (1995) Hot wire anemometry: principles and signal analysis, Oxford University Press.
Cabanac, M. (1971) Physiological role of pleasure, Science, 173: 1103–1107.
Cai, H., Li, X., Chen, Z. and Kong, L. (2013) Fast identification of multiple indoor constant contaminant sources by ideal sensors: A theoretical model and numerical validation,Indoor Built. Environ.,22: 897−909.
Cai, H., Li, X., Kong, L., Ma, X. and Shao, X. (2012) Rapid identification of single constant contaminant source by considering characteristics of real sensors,J. Cent. South Univ. of Tech. (Chinese journal), 19:593−599.
Cao, G., Awbi, H., Yao, R., Fan, Y., Sirén, K., Kosonen, R. and Zhang, J. (2014) A review of the performance of different ventilation and airflow distribution systems in buildings, Build. Environ.,73: 171−186.
Cao, G., Kandzia, C., Müller, D., Heikkinen, J., Kosonen, R. and Ruponen, M. (2013) Experimental study of the effect of turbulence intensities on the maximum velocity decay of an attached plane jet,EnergBuildings.,65: 127−136.
Cao, G., Liu, S., Boor, B. and Novoselac, A. (2015b)Characterizing the dynamic interactions and exposure implications of a particle- laden cough jet with different room airflow regimes produced by low and high momentum jets, Aerosol Air Qual Res.,15: 1955−1966.
Cao, G., Nielsen, P. V., Jensen, R. L., Heiselberg, P., Liu, L. and Heikkinen, J. (2015a) Protected zone ventilation and reduced personal exposure to airborne cross-infection, Indoor Air, 25: 307−319.
Energy and Buildings, November 2019, Vol. 202 ! https://doi.org/10.1016/j.enbuild.2019.109359 34https://escholarship.org/uc/item/85x6r3wv

Cao, G., Nilssen, A. M., Cheng, Z., Stenstad, L-I., Radtke, A. andSkogås, J. G. (2019) Laminar airflow ventilation and mixing ventilation: which is better for operating rooms regarding airflow distribution near an orthopedic surgical patient?,Am J Infect Control. (https://doi.org/10.1016/j.ajic.2018.11.023)
Cao, G., Storås, M. C. A., Aganovic, A., Stenstad, L-I. and Skogås, J. G. (2018) Do surgeons and surgical facilities disturb the clean air distribution close to a surgical patient in an orthopedic operating room with laminar airflow?,Am J Infect Control., 46: 1115−1122.
CBZ BouwmaatstavenVoorNieuwbouwOperatieafdeling College BouwZorghuisvesting, Utrecht, the Netherlands. 2004.
Cermak, R. and Melikov, A. K. (2003) Performance of personalized ventilation in a room with an underfloor air distribution system: transport of contaminants between occupants, Proceedings of the 7th International Conference on Healthy Buildings, Singapore, 7-11 December 2003.
Cermak, R. and Melikov, A. K. (2004) Transmission of exhaled air between occupants in rooms with personalized and underfloor ventilation, Proceedings of the 9th International Conference on Air Distribution in Rooms, Coimbra, Portugal, 5-8 September 2004.
Cermak, R. and Melikov, A. K. (2006)Air quality and thermal comfort in an office with underfloor, mixing and displacement ventilation, Int. J. Vent., 5: 323−352.
Cermak, R. and Melikov, A. K. (2007) Protection of occupants from exhaled infectious agents and floor material emissions in rooms with personalized and underfloor ventilation, HVAC&R Res., 13: 23−38.
Cermak, R., Melikov, A. K.,Forejt, L. and Kovar, O. (2004) Distribution of contaminants in the occupied zone of a room with personalized and displacement ventilation, Proceedings of the 9th International Conference on Air Distribution in Rooms, Coimbra, Portugal, 5-8 September 2004.
Cermak, R., Melikov, A. K.,Forejt, L. and Kovar, O. (2006) Performance of personalized ventilation in conjunction with mixing and displacement ventilation, HVAC&R Res., 12: 295−311.
Chiang, H., Su, C.C., Pan, C.S. and Tsau, F.H. (2002) Study of an innovative partition-type personal modulation air-conditioning system, Proceedings of the 9th International Conference on Indoor Air Quality and Climate, Monterey, California, June 30-July 5 2002.
Chen, H. (2014)Experimental and numerical investigations of a ventilation strategy – impinging jet ventilation for an office environment, PhD Thesis (Linköping University).
Chen, Q. (2009) Ventilation performance prediction for buildings: A method overview and recent applications,Build Environ,44:848–858.
Cheng, Y. and Lin, Z.(2015a) Experimental study of airflow characteristics of stratum ventilation in a multi-occupant room with comparison to mixing ventilation and displacement ventilation,Indoor Air, 25:662−671.
Cheng, Y. and Lin, Z.(2015b) Experimental investigation into the interaction between the human body and room airflow and its effect on thermal comfort under stratum ventilation,Indoor Air, 26:274−285.
Cheng, Y., Fong, M. L., Yao, T., Lin, Z. and Fong, K. F.(2014) Uniformity of stratum ventilated thermal environment and thermal sensation,Indoor Air, 24: 521−532.
Cheng, Y., Lin, Z. and Fang, Z. (2017)Impact of air supply angle on heating performance of stratum ventilation in winter arranged on the same side as air supply/return terminals,Build. Sci., 33: 120−127.
Cheng, Y., Lin, Z. and Fong, A. M. L.(2015)Effects of temperature and supply airflow rate on thermal comfort in a stratum-ventilated room,Build. Environ.,92: 269−277.
Cheng, Y., Niu, J. and Gao, N.(2012) Stratified air distribution systems in a large lecture theatre: A numerical method to optimize thermal comfort and maximize energy saving, Energ Buildings, 55: 515−525.
Cheng, Y., Niu, J., Liu, X. and Gao, N. (2013) Experimental and numerical investigations on stratified air distribution systems with special configuration: Thermal comfort and energy saving, Energ Buildings, 64: 154–161.
Energy and Buildings, November 2019, Vol. 202 ! https://doi.org/10.1016/j.enbuild.2019.109359 35https://escholarship.org/uc/item/85x6r3wv

Cheng, Y., Zhang, S., Huan, C., Oladokun, M. O. and Lin, Z.(2019)Optimization on fresh outdoor air ratio of stratum ventilation for both targeted indoor air quality and maximal energy saving,Build. Environ.,147: 11−22.
Chiang, H., Su, C.C., Pan, C.S. and Tsau, F.H. (2002) Study of an innovative partition-type personal modulation air-conditioning system, Proceedings of the 9th International Conference on Indoor Air Quality and Climate, Monterey, California, June 30-July 5 2002.
Cho, S. H., Kim, W. T. and Zaheer-uddin, M. (2001) Thermal characteristics of a personal environmentalmodule task airconditioning system: an experimental study, Energ Convers Manage,42: 1023−1031.
Cho, Y., Awbi, H. B. and Karimipanah, T. (2008) Theoretical and experimental investigation of wall confluent jets ventilation and comparison with wall displacement ventilation, Build. Environ.,43: 1091−1100.
Chodor, A. D. and Taradajko, P. P. (2013) Experimental and Numerical Analysis of Diffuse Ceiling Ventilation. Department of Civil Engineering, Aalborg University.
Cummins, H. Z., Knable, N. andYeh, Y. (1964) Observation of diffusion broadening of rayleigh scattered light, Phys Rev Lett, 12:150–153.
Dalewski, M., Melikov, A. K.andVesely, M. (2014) Performance of ductless personalized ventilation in conjunction with displacement ventilation:Physical environment and human response,Build. Environ.,81: 354−364.
Davidson, L. (1987) Calculation of age and local purging flow rate in rooms, Build. Environ., 22: 111−127.
Department of Health. HTM 03-01:2007. Heating and ventilation systems-specialised ventilation for healthcare premises, part A: design and validation. London: Department of Health, 2007.
Diab-Elschahawi, M., Berger, J., Blacky, A., Kimberger, O., Oguz, R., Kuelpmann, R., Kramer, A. andAssadian, O. (2001) Impact of different-sized laminar air flow versus no laminar air flow on bacterial counts in the operating room during orthopedic surgery,Am J Infect Control.,39: 25−29.
DIN. DIN 1946 Raumlufttechnik e Teil 4: Raumlufttechnische Anlagen in Gebäuden und Räumen des GesundheitswesensDeutschesInstitutfürNormunge.V, Berlin, Germany. 2008.
Displacement ventilation.Kosonen, R.(ed), Melikov, A., Mundt, E., Mustakallio, P. and Nielsen, P. V. 2017 REHVA. Guidebook No. 23 Rehva Edition. ISBN 978-2-930521-17-6
DS 474 (1995)Code for Thermal Indoor Climate, Danish Standard, Copenhagen, Denmark.
Elvsén, P-Å.and Sandberg, M. (2009) Buoyant jet in a ventilated room: Velocity field, temperature field and airflow patterns analysed with three different whole-field methods,Build. Environ.,44: 137−145.
Etheridge, D. and Sandberg, M. (1996) Building ventilation: theory and measurement, Wiley.
Fallenius, B.E.G., Sattari, A., Fransson, J.H.M. And Sandberg, M.(2013)Experimental study on theeffect of pulsating inflow to an enclosure forimproved mixing,Int J Heat Fluid Fl, 44, 108−119.
Fan, J., Hviid, C. A. and Yang, H. (2013) Performance analysis of a new design of office diffuse ceiling ventilation system, EnergBuildings,59: 73–81.
Fanger, P. O. (1970) Thermal comfort-Analysis and applications in environmental engineering, Danish Technical Press, Copenhagen, Denmark.
Fanger, P. O. (1984) ISO 7730 Moderate Thermal Environments Determination of the PMV and PPD Indices and Specification of the Conditions for Thermal Comfort.
Fanger, P. O. (2001) Human requirements in future air-conditioned environments, Int. J.Refrig.,24:148−153.
Fanger, P. O. andToftum, J. (2002) Extension of the PMV model to non-air-conditioned buildings in warm climates,Energ Buildings, 34: 533−536.
Faulkner, D., Fisk, W. J. and Sullivan, D. P. (1993) Indoor airflow and pollutant removal in a room withdesktop ventilation, ASHRAE Trans.,99: 750–758.
Energy and Buildings, November 2019, Vol. 202 ! https://doi.org/10.1016/j.enbuild.2019.109359 36https://escholarship.org/uc/item/85x6r3wv

Faulkner, D., Fisk, W. J. and Sullivan, D. P. (1995) Indoor airflow and pollutant removal in a room with floor-based task ventilation: Results of additional experiments,Build. Environ.,30: 323–332.
Faulkner, D., Fisk, W. J., Douglas, P., Sullivan, D. P. andWyon, D. P. (1999) Ventilation efficiencies of desk-mounted task/ambient conditioning systems, Indoor Air,9: 273–281.
Faulkner, D., Fisk, W. J., Sullivan, D. P. and Lee, S. M. (2004) Ventilation efficiencies and thermal comfort results of a desk-edge-mounted task ventilation system,Indoor Air,14: 92–97.
Fong, K. F., Lee, C. K. and Lin, Z. (2018)Investigation on effect of indoor air distribution strategy on solar air-conditioning systems, Renew Energ, 131: 413–421.
Fong, M. L., Lin, Z., Fong, K. F., Chow, T. T. and Yao, T.(2011) Evaluation of thermal comfort conditions in a classroom with three ventilation methods,Indoor Air, 21: 231−239.
Fong, M. L., Lin, Z., Fong, K. F., Hanby, V. and Greenough, R.(2017) Life cycle assessment for three ventilation methods,Build. Environ.,116:73–88.
Fu, S., Biwole, P. H. and Mathis, C. (2015) Particle tracking velocimetry for indoor airflow field: A review,Build Environ.,87:34–44.
Gao, N., Niu, J. and Zhang, H. (2006) Coupling CFD and human body thermoregulation model for the assessment of personalized ventilation, HVAC&R Res., 12: 497–518.
Ghahremanian, S., Svensson, K., Tummers, M. J. and Moshfegh, B.(2014a) Near-field development of a row of round jets at low Reynolds numbers,Exp. Fluids,55: 1–18.
Ghahremanian, S., Svensson, K., Tummers, M.J. and Moshfegh, B.(2014b) Near-field mixing of jets issuing from an array of round nozzles,Int. J. Heat Fluid Fl.,47: 84–100.
Halvoňová, B. and Melikov, A. K. (2010a) Performance of "ductless" personalized ventilation in conjunction with displacement ventilation: Impact of disturbances due to walking person(s), Build. Environ.,45: 427─436.
Halvoňová, B. and Melikov, A. K. (2010b) Performance of "ductless" personalized ventilation in conjunction with displacement ventilation: Impact of intake height, Build. Environ.,45: 996─1005.
Halvoňová, B. and Melikov, A. K. (2010c) Performance of "ductless" personalized ventilation in conjunction with displacement ventilation:Workstations Layout and Partitions, HVAC&R Res., 16: 75─94.
Hamilton, S.D., Roth, K.W. and Brodrick, J. (2004) Displacement ventilation, ASHRAE J., 46: 56─58.
Heiselberg, P. and Topp, C. (1997) Removal of airborne contaminants from a surface tank by a push-pull system, Proceedings ofthe 5th International Symposium on Ventilation for Contaminant Control,Ottawa, Canada, 14-17 September 1997.
Hellwig, R.T. (2015) Perceived control in indoor environments: a conceptual approach, Build. Res. Inf., 43:302–315.
Hiwatashi, K., Akabayashi, S., Morikawa, Y. and Sakaguchi, J. (2000) Numerical study of a new ventilation tower system for fresh air supply in an air-conditioned room, Proceedings of the 7th International Conference on Air Distribution in Rooms, Reading, UK, 9-12 July 2000.
Huan, C., Wang, F. H., Lin, Z., Wu, X. Z., Ma, Z. J., Wang, Z. H. and Zhang L. H.(2016) An experimental investigation into stratum ventilation for the cooling of an office with asymmetrically distributed heat gains,Build. Environ.,110:76−88.
Huan, C., Wang, F. H., Wu, X. Z., Lin, Z., Wang, Z. H. and Wang, G.(2015) A method to predict vertical temperature distribution in a stratum-ventilated environment,HunanDaxueXuebao/Journal of Hunan University Natural Sciences(Chinese journal), 42: 134−140.
Humphreys,M.(1978) Outdoor temperatures and comfort indoors,BuildResPract.,6:92−105.
Hviid, C. A. and Svendsen, S. (2013) Experimental study of perforated suspended ceilings as diffuse ventilation air inlets, EnergBuildings, 56: 160–168.
Energy and Buildings, November 2019, Vol. 202 ! https://doi.org/10.1016/j.enbuild.2019.109359 37https://escholarship.org/uc/item/85x6r3wv

Iqbal, A.,Kazimi, H., Rahimi, S. and Afshari, A. (2013) Use of perforated acoustic panels as supply air diffusers in diffuse ceiling ventilation systems,Danish Building Research Institute, Aalborg University.
ISO 7730 (2005) Moderate thermal environment-determination of the PMV and PPD indices and specification of the conditions for thermal comfort, International Organization for Standardization, Geneva, Switzerland.
Iyengar, R. S., Sekhar, C., Karimabad, A. S., Haghighat, F. and Zhu, K. (2015) Acomparative study of leakage characteristics between an under floor air distribution system and an over head air distribution system, Int. J Vent.,14:1−10.
Izuhara, I., Kuwahara, R. and Mizutani, K.(2002) Experimental and numerical studies on local high efficiency air conditioning system for office buildings, Proceedings of the 9th International Conference on Indoor Air Quality and Climate, Monterey, USA, 30 June-5 July 2002.
Janbakhsh, S. (2015) A ventilation strategy based on confluent jets: an experimental and numerical study,PhD thesis (Linköping University).
Jang, M. S., Koh, C. D. and Moon, I. S. (2007) Review of thermal comfort design based on PMV/PPD in cabins of Korean maritime patrol vessels,Build.Environ.,42:55−61.
Jeong, K.B. and Kim, J.J. (1999) Individual air distribution control system on partition panel at personal task area, Proceedings of the 8th International Conference on Indoor Air Quality and Climate, Edinburgh,UK,8-13 August 1999.
Jin, H., Bauman, F. and Webster, T. (2006) Testing and modeling of underfloor air supply plenums, ASHRAE Trans, 112: 581–591.
Kabanshi, A., Ameen, A., Hayati, A. and Yang, B. (2018)Cooling energy simulation and analysis of an intermittent ventilation strategy under different climates, Energy, 156: 84−94.
Kabanshi, A., Wigö, H. and Sandberg, M. (2016a) Experimental evaluation of an intermittent air supply system ─ Part 1: Thermal comfort and ventilation efficiency measurements, Build. Environ.,95: 99−109.
Kabanshi, A., Wigö, H., Ljung, R. and Sörqvist, P. (2016b) Experimental evaluation of an intermittent air supply system ─ Part 2: Occupant perception of thermal climate, Build. Environ.,108: 240−250.
Kabanshi, A., Wigö, H., Ljung, R. and Sörqvist, P. (2017) Human perception of room temperature and intermittent air jet cooling in a classroom, Indoor Built.Environ.,26: 528−537.
Kabanshi, A., Yang, B., Sörqvist, P. and Sandberg, M. (2019)Occupants’ perception of air movements and air quality in a simulated classroom with an intermittent air supply system,Indoor Built. Environ.,28: 63−76.
Kaczmarczyk, J. (2003) Human response to personalized ventilation, PhD Thesis (Technical University of Denmark).
Kaczmarczyk, J., Melikov, A. K.,Bolashikov, Z., Nikolaev, L. and Fanger, P. O. (2004) Thermal sensation and comfort with five different air terminal devices for personalized ventilation,Proceedings of the 9th International Conference on Air Distribution in Rooms, Coimbra, Portugal, 5-8 September 2004.
Kaczmarczyk, J., Zeng, Q., Melikov, A. andFanger, P.O. (2002) The effect of a personalized ventilation system on perceived air quality and SBS symptoms, Proceedings of the 9th International Conference on Indoor Air Quality and Climate, Monterey, California, June 30-July 5 2002.
Karimipanah, T. and Awbi, H. B.(2002) Theoretical and experimental investigation of impinging jet ventilation and comparison with wall displacement ventilation,Build. Environ.,37: 1329−1342.
Karimipanah, T., Awbi, H. B. and Moshfegh, B. (2008)The air distribution index as an indicator for energy consumption and performance of ventilation systems, J. Hum-Environ syst., 11: 77−84.
Karimipanah, T., Awbi, H. B., Sandberg, M. and Blomqvist, C. (2007) Investigation of air quality, comfort parameters and effectiveness for two floor-level air supply systems in classrooms, Build. Environ.,42: 647−655.
Energy and Buildings, November 2019, Vol. 202 ! https://doi.org/10.1016/j.enbuild.2019.109359 38https://escholarship.org/uc/item/85x6r3wv

Karimipanah, T., Sandberg, M. andAwbi, H. B.(2000) A comparative study of different air distribution systems in a classroom, Proceedings of the 7thInternational Conference on Air Distribution in Rooms,Reading, UK,9-12 July 2000.
Kato, S. and Huang, H. (2009) Ventilation efficiency of void space surrounded by buildings with wind blowing over built-up urban area, J. Wind Eng. Ind. Aerod., 97: 358−367.
Kato, S. and Murakami, S. (1988) New ventilation efficiency scales based on spatial distribution of contaminant concentration aided by numerical simulation, ASHRAE Trans, 94:309−330.
Kato, S., Murakami, S. and Kobayashi,H.(1992) New scales for evaluating ventilation efficiency as affected by supply and exhaust openings based on spatial distribution of contaminant,Proceedings of International Symposium on Room Air Convection and Ventilation Effectiveness, Tokyo, Japan, 22-24 July 1992.
Kierat, W., Bivolarova, M., Zavrl, E., Popiolek, Z. and Melikov, A.(2018) Accurate assessment of exposure using tracer gas measurements, Build. Environ.,131: 163−173.
Knowles, E. M. W. and Athelstan, F. S. (1953) Meteorological instruments, 3rd edition, University of Toronto Press,Toronto.
Koestel, A. and Tuve, G. (1955) Performance and evaluation of room air distribution systems, ASHRAE Trans, 61: 533−550.
Kosonen, R. and Mustakallio, P. (2003) The influence of a capture jet on the efficiency of a ventilated ceiling in a commercial kitchen,Int. J Vent.,1:189−199.
Kulmala, I., Hynynen, P., Welling, I. and Säämänen, A. (2007) Local ventilation solution for large, warm emission sources, Ann Occup.Hyg., 51:35−43.
Larraona, G. S., Rivas, A., Antón, R., Ramos, J. C., Pastor, I. and Moshfegh, B. (2013) Computational parametric study of an impinging jet in a cross-flow configuration for electronics cooling applications, Appl.Therm Eng., 52: 428−438.
Lee, C. K., Fong, K. F., Lin, Z. and Chow, T. T.(2013) Year-round energy saving potential of stratum ventilated classrooms with temperature and humidity control,HVAC&R Research, 19: 986─991.
Lee, K., Xue, G., Jiang, Z. and Chen, Q. (2012) Thermal environment in indoor spaces with under-floor air distribution systems: Part 1. Impact of design parameters (1522-RP),HVAC&R Res., 18: 1182–1191.
Lee, K. H., Schiavon, S., Bauman, F. and Webster, T. (2012) Thermal decay in underfloor air distribution (UFAD) systems: Fundamentals and influence on system performance, Appl. Energ, 91: 197–207.
Lestinen, M., Kilpeläinen, S., Kosonen, R., Jokisalo, J., Koskela, H. and Melikov, A. (2018a) Flow characteristics in occupied zone – An experimental study with symmetrically located thermal plumes and low-momentum diffuse ceiling air distribution, Build. Environ.,128: 77–88.
Lestinen, M., Kilpeläinen, S., Kosonen, R., Jokisalo, J. and Koskela, H. (2018b) Experimental study on airflow characteristics with asymmetrical heat load distribution and low-momentum diffuse ceiling ventilation, Build. Environ.,134: 168–180.
Levy, H. (2002) Individual control by individual VAV, Proceedings of the 8th International Conference on Air Distribution in Rooms, Copenhagen, Denmark, 8-11 September 2002.
Li, A. (2019)Extended Coanda effect and attachment ventilation (Editorial), Indoor Built.Environ.,28: 437–442.
Li, A. and Dai, Q. (1987) Air fluctuation nozzle and its air distribution, Proceedings of the 1st International Conference on Air Distribution in Rooms, Stockholm, Sweden, 10-12June 1987.
Li, A. and Kosonen, R. (2019) Kitchen pollutants control and ventilation, Science Press (Springer Press), Beijing, China.
Li, A., Gou, L., Wang, X. and Zhang, Y. (2016) 2D-PIV experiment analysis on the airflow performance of afloor-based air distribution with a novel mushroom diffuser(FBAD-MD), Energ Buildings, 121: 114─129.
Energy and Buildings, November 2019, Vol. 202 ! https://doi.org/10.1016/j.enbuild.2019.109359 39https://escholarship.org/uc/item/85x6r3wv

Li, A., Qiu, S. and Wang, G. (2008) Vertical wall attached airflow and air lake mode ventilation system, Chinese patent, ZL 200810017349.0.
Li, A., Tao, P., Zhao, Y. and Yin, H. (2010a) A ventilation mode based on circular column attached jet,Chinese patent, ZL 201010548896.9.
Li, A., Tao, P., Zhao, Y. and Yin, H. (2010b) A ventilation mode based on square column attached jet, Chinese patent, ZL 201010549211.2.
Li, A., Yin, H. and Wang, G. (2012b)Experimental investigation of air distribution in the occupied zones of air curtain ventilated enclosure, Int. J Vent., 11: 171─182.
Li, A., Yin, H. and Zhang, W. (2012a) A novel air distribution method-principles of air curtain ventilation, Int. J Vent., 10: 383─390.
Li, B., Yao, R., Wang, Q. and Pan, Y. (2014) An introduction to the Chinese Evaluation Standard for the indoor thermal environment,Energ Buildings, 82: 27−36.
Li, R., Sekhar, S. C. and Melikov, A. K. (2010) Thermal comfort and IAQ assessment of under-floor air distribution system integrated with personalized ventilation in hot and humid climate, Build. Environ.,45: 1906−1913.
Li, R., Sekhar, S. C. and Melikov, A. K. (2011) Thermal comfort and indoor air quality in rooms with integrated personalized ventilation and under-floor air distribution systems, HVAC&R Res., 17: 829−846.
Li, X. and Zhao, B. (2004) Accessibility: a new concept to evaluate the ventilation performance in a finite period of time,Indoor Built.Environ.,13: 287−294.
Li, X. and Zhu, F. (2009) Response coefficient: a new concept to evaluate ventilation performance with "pulse'' boundary conditions, Indoor Built.Environ.,18: 189−204.
Li, X., Cai, H. and Zhao, L. (2009) Antiterrorist Emergency Ventilation: System, Strategy and Decision-Making. ISBN 978-1-60741-041-6. Nova Science Publishers, Inc.
Li, X., Li, D., Yang, X. and Yang, J.(2003) Total air age: an extension of the air age concept, Build.Environ.,38:1263−1269.
Liang, C., Shao, X. and Li, X. (2017) Energy saving potential of heat removal using natural cooling water in the top zone of buildings with large interior spaces, Build. Environ.,124: 323−335.
Licina, D., Melikov, A., Sekhar, C. andTham, K. W. (2015a) Human convective boundary layer and its interaction with room ventilation flow, Indoor Air, 25: 21–35.
Licina, D., Melikov, A., Sekhar, C. andTham, K. W. (2015b) Transport of gaseous pollutants by convective boundary layer around a human body, Sci. Technol. Built En., 21: 1175−1186.
Licina, D., Melikov, A., Pantelic, J., Sekhar, C. and Tham, K.W. (2015c) Human convection flow in spaces with and without ventilation: personal exposure to floor-released particles and cough-released droplets, Indoor Air, 25:672−682.
Lin, Z., Chow, T. T. and Tsang, C.F. (2005) Stratum ventilation? A conceptual introduction,Proceedings of the 10th International Conference on Indoor Air Quality and Climate, Beijing, China, 4-9 September 2005.
Lin, Z., Lee, C. K., Fong, K. F., Chow, T. T., Yao, T. and Chan, A. L. S.(2011b) Comparison of annual energy performances with different ventilation methods for cooling,EnergBuildings, 43: 130–136.
Lin, Z., Wang, J., Yao, T. and Chow T.T.(2012) Investigation into anti-airborne infection performance of stratum ventilation,Build. Environ.,54: 29–38.
Lin, Z., Wang, J., Yao, T., Chow, T. T. and Fong, K. F.(2011a) Comparison of transport and distribution of exhaled droplets under different ventilation methods,World Review of Science, Technology and Sustainable Development, 10: 142─161.
Energy and Buildings, November 2019, Vol. 202 ! https://doi.org/10.1016/j.enbuild.2019.109359 40https://escholarship.org/uc/item/85x6r3wv

Lin, Z., Yao, T., Chow, T. T., Fong, K. F. and Chan, L. S.(2011c) Performance Evaluation and Design Guidelines for Stratum Ventilation,Build. Environ.,46: 2267–2279.
Liu, S., Schiavon, S., Kabanshi, A. and Nazaroff. W. W. (2017) Predicted percentage dissatisfied with ankle draft,Indoor Air,27: 852–862.
Liu, Z. (2018) Application of a novel air distribution mode to ventilation and air conditioning system of underground railway stations, HV&AC (Chinese journal), 48: 40─44.
Lipczynska, A., Kaczmarczyk, J. and Melikov, A. K. (2015)Thermal environment and air quality in office with personalized ventilation combined with chilled ceiling, Build. Environ.,92:603─614.
Loomans, M. G. L. C. (1999) Study on the applicability of the desk displacement ventilation concept,ASHRAETrans.,105: 759−768.
Lyubenova, V. S.,Holsøe, J. W. and Melikov, A. K. (2011) Potential energy savings with personalized ventilation coupled with passive chilled beams, Proceedings of 12th International Conference on Air Distribution in Rooms, Trondheim, Norway, 19-22 June2011.
Maas, H. G., Gruen, A. andPapantoniou, D. (1993) Particle tracking velocimetry in three-dimensional flows Part 1.Photogrammetric determination of particle coordinates, Exp Fluids,15:133–146.
Masip, Y., Rivas, A., Larraona, G. S., Anton, R., Ramos, J. C. and Moshfegh, B. (2012) Experimental study of the turbulent flow around a single wall-mounted cube exposed to a cross-flow and an impinging jet, Int. J. Heat Fluid Fl., 38: 50─71.
McCarthy, J.F., Ludwig, J.F. and Bolsaitis, P.P. (1993) An evaluation of the influence of breathing zone air distribution systems on indoor air quality, Proceedings of the 6th International Conference on Indoor Air Quality and Climate, Helsinki, Finland, 4-8July 1993.
McHugh, S. M., Hill, A. D. and Humphreys, H. (2015) Laminar airflow and the prevention of surgical site infection. More harm than good?,Surgeon.,13: 52─58.
Melhado, M. D. A., Hensen, J. L. M. and Loomans, M. G. L. C. (2006) Review of operating room ventilation standards,Proceedings of the 17thInternationalAir-conditioning and Ventilation Conference, Prague,Czech, 17-19 May 2006.
Melikov, A., Ivanova, T. andStefanova, G. (2012) Seat headrest-incorporated personalized ventilation: Thermal comfort and inhaled air quality, Build. Environ.,47:100─108.
Melikov, A. K. (2004) Personalized ventilation,Indoor Air,14: 157─167.
Melikov, A.K. (2011) Advanced air distribution, ASHRAE J.,53: 73─78.
Melikov, A. K. (2015)Human body micro-environment: The benefits of controlling airflow interaction, Build. Environ.,91: 70─77.
Melikov, A. K. and Dzhartov, V. (2013)Advanced air distribution for minimizing airborne cross-infection in aircraft cabins, HVAC&R Res., 19: 926─933.
Melikov, A. K. andKaczmarczyk, J. (2012) Air movement and perceived air quality, Build. Environ.,47: 400─409.
Melikov, A. K. and Knudsen, G. L. (2007) Human response to an individually controlled microenvironment, HVAC&R Res., 13: 645─660.
Melikov, A.K., Cermak, R. and Mayer, M. (2002) Personalized ventilation: Evaluation of different airterminal devices,Energ Buildings,34: 829─836.
Energy and Buildings, November 2019, Vol. 202 ! https://doi.org/10.1016/j.enbuild.2019.109359 41https://escholarship.org/uc/item/85x6r3wv

Melikov, A. K.,Cermak, R., Kovar, O. and Forejt, L. (2003) Impact of airflow interaction on inhaled air quality and transport of contaminants in rooms with personalized and total volume ventilation,Proceedings of the 7th International Conference on Healthy Buildings, Singapore, 7-11 December 2003.
Melikov, A. K., Langkilde, G. and Derbiszewski, B.(1990) Airflow characteristics in the occupied zone of rooms with displacement ventilation, ASHRAE Trans, 96: 55─63.
Melikov, A.K., Lyubenova, V.S., Skwarczynski, M. and Kaczmarczyk, J. (2011) Impact of air temperature, relative humidity, air movement and pollution on eye blinking, Proceedings of the12th International Conference on Indoor Air Quality and Climate, Austin, USA,5-10 June 2011.
Melikov, A.K., Skwarczynski, M.A., Kaczmarczyk, J. and Zabecky, J.(2013) Use of personalised ventilation for improving health, comfort and performance at high room temperature and humidity, Indoor Air, 23: 250─263.
Nevis, R. G. (1976) Air diffusion dynamics: Theory, design and application, Business News Publishing Company, Birmingham, Michigan, USA.1976. Nicol, J. F. and Humphreys, M. A. (2002) Adaptive thermal comfort and sustainable thermal standards for buildings, Energ Buildings,34: 563─572. Nielsen, P. V.(2008a) Personalized air supplied direct to the boundary layer of a seated person, ASHRAE Seminar Recordings DVD. Nielsen, P. V. and Jakubowska, E. (2009) The performance of diffuse ceiling inlet and other room air distribution systems,Proceedings of Cold Climate HVAC 2009,Sisimiut, Greenland, 16-19 March 2009.
Nielsen, P. V.and Jensen, R. L. (2010b)Diffus loftindblæsning: fra laboratorieforsøg til praktisk anvendelse, HVAC Magasinet, bind 46,10:50−54.
Nielsen, P. V., Barszcz, E., Czarnota, T., Dymalski, D. P., Jasienski, M. A., Nowotka, A., Mozer, A., Wiankowska, S. M.and Jensen, R. L.(2008b)The influence of draught on a seat with integrated personalized Ventilation, Proceedings of the 11th International Conference on Indoor Air Quality and Climate, Copenhagen, Denmark, 17-22 August 2008.
Nielsen, P. V., Bartholomaeussen, N. M., Jakubowska, E., Jiang, H., Jonsson, O. T., Krawiecka, K., Mierzejewski, A., Jessica, S., Trampczynska, K., Polak, M. andSoennichsen, M.(2007)Chair with integrated personalized ventilation for minimizing cross infection, Proceedings of the 10thInternational Conference on Air Distribution in Rooms, Helsinki, Finland, 13-15 June 2007.
Nielsen, P. V., Jensen, R. L. and Rong, L. (2010a) Diffuse ceiling inlet systems and the room air distribution, Proceedings ofClima 2010: 10th REHVA World Congress, Antalya, Turkey, 9-12 May 2010.
Nielsen, P. V., Li, Y., Buus, M. and Winther, F. V. (2010c) Risk of cross-infection in a hospital ward with downward ventilation,Build. Environ.,45: 2008−2014.
Nielsen, P. V., Vilsbøll, R. W., Liu, L. and Jensen, R. L. (2015) Diffuse ceiling ventilation and the influence of room height and heat load distribution, Proceedings of Healthy Buildings Europe 2015, Eindhoven, Netherlands, 18-20 May 2015.
ÖNORM H 6020 Lüftungstechnische Anlagen fürmedizinischgenutzteRäume - Projektierung, Errichtung, Betrieb, Instandhaltung, technische und hygienischeKontrollenÖsterreichischesNormungsinstitut, Wien. 2015.
Petersen, S., Christensen, N. U., Heinsen, C. and Hansen, A. S. (2014) Investigation of the displacement effect of a diffuse ceiling ventilation system, EnergBuildings,85:265–274.
Rohdin, P. andMoshfegh, B.(2009) Impinging jet: A new ventilation strategy for industries- a case study of a light alloy foundry, Proceedings of the 9th international conference on industrial ventilation, ETH Zürich Switzerland, 18-21 October 2009.
Rundström, D. and Moshfegh, B.(2006) Investigation of heat transfer and pressure drop of an impinging jet in a cross-flow for cooling of a heated cube, J. Heat Transf., 128: 150–156.
Sandberg, M. (1981) What is Ventilation Efficiency?,Build. Environ.,16:123−135.
Sandberg, M. (2007) Whole-field measuring methods in ventilated rooms,HVACR Res.,13:951–970.
Energy and Buildings, November 2019, Vol. 202 ! https://doi.org/10.1016/j.enbuild.2019.109359 42https://escholarship.org/uc/item/85x6r3wv

Sandberg, M.AndElvsén, P. Å. (2004)Rapid time varying ventilation flow rates as a mean of increasing the ventilation efficiency,Proceedings of the 9th International Conference on Air Distribution in Rooms, Coimbra, Portugal, 5-8September 2004.
Sasamoto, T., Kato, S. and Zhang,W.(2010) Control of indoor thermal environment based on concept of contribution ratio of indoor climate, Build. Simul.,3: 263−278.
Sattari, A. and Sandberg, M. (2013) PIV study of ventilation quality in certain occupied regions of a two-dimensional room model withrapidly varying flow rates,Int. J. Vent., 12: 187−194.
Schiavon, S., Lee, K. H., Bauman, F. and Webster, T. (2010) Influence of raised floor on zone design cooling load in commercial buildings,EnergBuildings, 42: 1182–1191.
Schiavon, S., Lee, K. H., Bauman, F. and Webster, T. (2011) Simplified calculation method for design cooling loads in underfloor air distribution (UFAD) systems,EnergBuildings, 43: 517–528.
Schrock, D., Bagwell, R and Livchak, A. (2000) Quantifying capture andcontainment for kitchen exhaust hoods, Proceedings ofthe 6th International Symposium on Ventilation for Contaminant Control, Helsinki, Finland, 4-7 June 2000.
Seem, J. E. and Braun, J. E.(1992) The impact of personal environmental control on building energy use, ASHRAE Trans.,98: 903–909.
Sekhar, S.C., Gong, N., Maheswaran, C.R.U., Cheong, K.W., Tham, K.W.,Melikov, A. K. and Fanger, P. O.(2003) Preliminary findings of a pilot study of personalised ventilation in a hot and humid climate, Proceedings of the 7th International Conference on Healthy Buildings, Singapore, 7-11 December 2003.
Sekhar, S.C.,Gong, N.,Tham, K. W., Cheong, K.W., Melikov, A. K., Wyon, D. P. and Fanger, P. O. (2005)Findings of personalized ventilation studies in a hot and humid climate, HVAC&R Res., 11: 603–620.
Sekhar, S. C., Li, R. and Melikov, A. K. (2010) Use of heat-pipe for energy efficiency improvement of personalized ventilation system combined with under-floor air distribution system in a hot and humid climate, Proceedings of the 10th REHVA World Congress CLIMA, Antalya, Turkey, 9-12May 2010.
Sekhar, C. and Zheng, L. (2018)Study of an integrated personalized ventilation and local fan-induced active chilled beam air conditioning system in hot and humid climate, Build Simul., 11:787–801.
Shao, X. and Li, X. (2015) Evaluating the potential of airflow patterns to maintain a non-uniform indoor environment, Renew.Energ.,73: 99−108.
Shao, X., Ma, X., Li, X. and Liang, C. (2017) Fast prediction of non-uniform temperature distribution: A concise expression and reliability analysis, EnergBuildings,141:295−307.
Shao, X., Wang, K., Li, X. and Lin, Z.(2018) Potential of stratum ventilation to satisfy differentiated comfort requirements in multi-occupied zones,Build. Environ.,143: 329−338.
Sodec, F. and Craig, R. (1990)The underfloor air supply system-The European experience. ASHRAE Trans., 96: 690−695.
Sun, W., Cheong, K. W. D. and Melikov, A. K. (2012) Subjective study of thermal acceptability of novel enhanced displacement ventilation system and implication of occupants' personal control, Build. Environ.,57: 49−57.
Sun, Y. (2007) Volumetricparticle streak-tracking velocimetry and its application in indoor airflow measurements, PhD thesis(University of Illinois at Urbana-Champaign).
Takao, O. (1982) Undulant air diffuser, Air Conditioning and Refrigerating (Japanese J.), 22: 117−123.
Thorshauge, J. (1982) Air velocity fluctuations in the occupied zone of ventilated spaces, ASHRAE Trans., 88: 753−764.
Tian, L., Lin, Z. and Wang, Q. (2010) Comparison of gaseous contaminant diffusion under stratum ventilation and under displacement ventilation,Build. Environ.,45:2035−2046.
Energy and Buildings, November 2019, Vol. 202 ! https://doi.org/10.1016/j.enbuild.2019.109359 43https://escholarship.org/uc/item/85x6r3wv

Tian, L., Lin, Z. and Wang, Q.(2011b) Experimental investigation of thermal and ventilation performances of stratum ventilation,Build. Environ.,46: 1309−1320.
Tian, L., Lin, Z., Liu, J., Yao, T. and Wang, Q.(2011a)The impact of temperature on mean local air age and thermal comfort in a stratum ventilated office,Build. Environ.,46: 501−510.
Tian, L., Lin, Z., Wang, Q. and Liu, J.(2009) Numerical investigation of indoor aerosol particle dispersion under stratum ventilation and under displacement ventilation,Indoor Built.Environ.,18: 360−375.
Valkeapää, A. and Sirén, K. (2010)The influence of air circulation, jet discharge momentum flux and nozzle design parameters on the tightness of an upwards blowing air curtain, Int. J. Vent., 8: 337−346.
van Hooff, T. A. J. andBlocken, B. J. E. (2017)Assessment of time-periodic mixing ventilation using a sine function and a step function, Proceedings of the Healthy Buildings Europe 2017, Lublin, Poland, 2-5 July 2017.
Wang, H., Li, X., Shao, X., Wang, B. and Lin, Y. (2017) A colour-sequence enhanced particle streak velocimetry method for air flow measurement in a ventilated space,Build. Environ.,112:77–87.
Wang, H., Wang, G. and Li, X. (2018) High-performance color sequence particle streak velocimetry for 3D airflow measurement, Appl. Opt.,57:1518–1523.
Wang, H., Zhang, H., Hu, X., Luo, M., Wang, G., Li, X. and Zhu, Y. (2019) Measurement of airflow pattern induced by ceiling fan with quad-view colour sequence particle streak velocimetry,Build.Environ.,152:122–134.
Wang, X. and Lin, Z. (2015)An experimental investigation into the pull-down performances with different air distributions,Appl. Therm. Eng., 91: 151−162.
Webster, T., Bauman, F. and Daly, A. (2008) Modeling underfloor air distribution systems,Proceedings of the 3rd National Conference of IBPSA-USA, Berkeley, USA, 30 July-1 August 2008.
Wei, S., Li, M., Lin, W. andSun, Y. (2010) Parametric studies and evaluations of indoor thermal environment in wet season using a field survey and PMV-PPD method,EnergBuildings,42:799−806.
WHO Guideline, Global guidelines for the prevention of surgical site infection, 2016 © World Health Organization 2016.
Wigö, H. (2005) Technique and human perception of intermittent air velocity variation, PhD thesis (KTH Royal Institute of Technology).
Wigö, H. (2013) Effects of intermittent air velocity on thermal and draught perception–A field study in a school environment,Int. J. Vent., 12: 249−256.
Wyon, N.M. and Wyon, D. (1987) Measurement of acute response to draught in theeye, ActaOphthalmol, 65: 385–392.
Xue, G., Lee, K., Jiang, Z. and Chen, Q. (2012) Thermal environment in indoor spaces with under-floor air distribution systems: Part 2. Determination of design parameters (1522-RP), HVAC&R Res.,18: 1192–1201.
Yang, B.and Sekhar, S. C. (2007) Three-dimension numerical simulation of a hybrid fresh air and recirculated air diffuser for decoupled ventilation strategy, Build. Environ.,42: 1975−1982.
Yang, B., Melikov, A. and Sekhar, C. (2009) Performance evaluation of ceiling mounted personalized ventilation system, ASHRAE Trans., 115: 395−406.
Yang, B., Sekhar, S. C. and Melikov, A. K. (2010a) Ceiling-mounted personalized ventilation system integrated with a secondary air distribution system-a human response study in hot and humid climate, Indoor Air,20: 309−319.
Yang, B., Sekhar, C. and Melikov, A. K.(2010b) Ceiling mounted personalized ventilation system in hot and humid climate-An energy analysis, Energ Buildings,42: 2304–2308.
Yang, J., Kaczmarczyk, J., Melikov, A. andFanger, P.O. (2003) The impact of personalized ventilation system on indoor air quality at different levels of room air temperature, Proceedings of the 7th International Conference on Healthy Buildings, Singapore, 7-11 December 2003.
Energy and Buildings, November 2019, Vol. 202 ! https://doi.org/10.1016/j.enbuild.2019.109359 44https://escholarship.org/uc/item/85x6r3wv

Yang, J., Sekhar, C., Cheong, D. and Raphael, B. (2014) Performance evaluation of an integrated Personalized Ventilation-Personalized Exhaust system in conjunction with two background ventilation systems, Build. Environ.,78: 103−110.
Yang, J., Sekhar, S. C., Cheong, K. W. and Raphael, B. (2015a) Performance evaluation of a novel personalized ventilation-personalized exhaust system for airborne infection control, Indoor Air,25: 176−187.
Yang, J., Sekhar, C., Cheong, D. K. W. andRaphael, B. (2015b) A time-based analysis of the personalized exhaust system for airborne infection control in healthcare settings, SciTechnol BuiltEn., 21: 172−178.
Yao, R., Li, B. and Liu, J. (2009) A theoretical adaptive model of thermal comfort –Adaptive Predicted Mean Vote (aPMV),Build.Environ.,44: 2089−2096.
Ye, L. and Dai, Q. (1959) Preliminary investigation on the fluctuating currents produced by a push-pull fan, Xi’an Institute of Metallurgy and Construction Engineering (China)
Yin, H. andLi, A. (2012) Airflow characteristics by air curtain jets in full-scale room, J. Cent. South Univ., 19: 675−681.
Yin, H., Li, A., Liu, Z., Sun, Y. and Chen, T. (2012)Experimental study on airflow characteristics of a square column attached ventilation mode, Build. Environ.,109: 112−120.
Yin, H., Wu, R., Chen, T., Sun, Y. and Li, A. (2017) Study on ventilation effectiveness of circular column attached displacement ventilation mode, Procedia Eng., 205: 3511−3518.
Yu, T., Heiselberg, P., Lei, B., Pomianowski, M. and Zhang, C.(2015) A novel system solution for cooling and ventilation in office buildings: A review of applied technologies and a case study, EnergBuildings, 90: 142–155.
Yu, T., Heiselberg, P., Lei, B., Pomianowski, M., Zhang, C. and Jensen, R. (2015) Experimental investigation of cooling performance of a novel HVAC system combining natural ventilation with diffuse ceiling inlet and TABS, EnergBuildings,105:165–177.
Zeng, Q., Kaczmarczyk, J., Melikov, A. andFanger, P.O. (2002) Perceived air quality and thermal sensation with personalised ventilation system, Proceedings of the 8th International Conference on Air Distribution in Rooms, Copenhagen, Denmark, 8-11 September 2002.
Zhang, C., Heiselberg, P. and Nielsen, P. V. (2014) Diffuse ceiling ventilation - A review, Int. J. Vent., 13: 49–64.
Zhang, C., Heiselberg, P. K., Pomianowski, M., Yu, T. and Jensen, R. L. (2015) Experimental study of diffuse ceiling ventilation coupled with a thermally activated building construction in an office room, EnergBuildings,105:60–70.
Zhang, C., Kristensen, M. H., Jensen, J. S.,Heiselberg, P. K., Jensen, R. L. and Pomianowski, M. (2016) Parametrical analysis on the diffuse ceiling ventilation by experimental and numerical studies, EnergBuildings,111: 87–97.
Zhang, C., Yu, T., Heiselberg, P. K., Pomianowski, M. Z. and Nielsen, P. V.(2016) Diffuse Ceiling Ventilation: Design Guide, Aalborg: Aalborg University, Department of Civil Engineering, DCE Technical Reports.
Zhang, S., Cheng, Y., Huan, C. and Lin, Z.(2018) Modeling non-uniform thermal environment of stratum ventilation with supply and exit air conditions,Build. Environ.,144: 542−554.
Zhang, W. (2005) Prediction and visualizing validation of downward directed vertical wall jets and air lake phenomena, master thesis (Xi’an University of Architecture and Technology).
Zhao, B., Li, X., Chen, X. and Huang,D.(2004) Determining ventilation strategy to defend indoor environment against contamination by integrated accessibility of contaminant source (IACS), Build. Environ.,39:1035−1042.
Zhao, B., Li, X., Li, D. and Yang, J. (2003) Revised air-exchange efficiency considering occupant distribution in ventilated rooms,J. Air Waste Manag., 53: 759−763.
Zheng, S., Cheng, Y., Oladokun, M. O. and Lin, Z. (2019a) Subzone control method of stratum ventilation for thermal comfort improvement, Build. Environ.,149: 39−47.
Energy and Buildings, November 2019, Vol. 202 ! https://doi.org/10.1016/j.enbuild.2019.109359 45https://escholarship.org/uc/item/85x6r3wv

Zheng, S., Lin, Z., Ai, Z., Huan, C., Cheng, Y. and Wang, F. (2019c) Multi-criteria performance optimization for operation of stratum ventilation in a typical office under heating mode,Appl. Energ., 239:969−980.
Zheng, S., Lin, Z., Ai, Z., Wang, F., Cheng, Y. and Huan, C. (2019b) Effects of operation parameters on performances of stratum ventilation for heating mode,Build. Environ.,148: 55−66.
Zhou, B., Wei, P., Tan, M., Xu, Y., Ding, L., Mao, X., Zhao, Y. and Kosonen,R.(2019) Capture efficiency and thermal comfort in Chinese residential kitchen with push-pull ventilation system in winter-a field study,Build. Environ.,149: 182−195.
Zuo, H.,Niu, J. and Chan, W. (2002) Experimental study of facial air supply method for the reduction of pollutant exposure, Proceedings of the 9th International Conference on Indoor Air Quality and Climate, Monterey, USA, 30 June - 5 July 2002.
Energy and Buildings, November 2019, Vol. 202 ! https://doi.org/10.1016/j.enbuild.2019.109359 46https://escholarship.org/uc/item/85x6r3wv