A Reverse Hierarchy Model for Predicting Eye … Reverse Hierarchy Model for Predicting Eye...
8
A Reverse Hierarchy Model for Predicting Eye Fixations Tianlin Shi Institute of Interdisciplinary Information Sciences Tsinghua University, Beijing 100084, China [email protected] Ming Liang School of Medicine Tsinghua University, Beijing 100084, China [email protected] Xiaolin Hu Tsinghua National Laboratory for Information Science and Technology (TNList) Department of Computer Science and Technology, Tsinghua University, Beijing 100084, China [email protected] Abstract A number of psychological and physiological evidences suggest that early visual attention works in a coarse-to-fine way, which lays a basis for the reverse hierarchy theory (RHT). This theory states that attention propagates from the top level of the visual hierarchy that processes gist and ab- stract information of input, to the bottom level that process- es local details. Inspired by the theory, we develop a com- putational model for saliency detection in images. First, the original image is downsampled to different scales to consti- tute a pyramid. Then, saliency on each layer is obtained by image super-resolution reconstruction from the layer above, which is defined as unpredictability from this coarse-to-fine reconstruction. Finally, saliency on each layer of the pyra- mid is fused into stochastic fixations through a probabilis- tic model, where attention initiates from the top layer and propagates downward through the pyramid. Extensive ex- periments on two standard eye-tracking datasets show that the proposed method can achieve competitive results with state-of-the-art models. 1. Introduction Human vision system can selectively direct eyes to in- formative and salient parts of natural scenes. This ability allows adaptive and efficient allocation of limited compu- tational resources to important objects. Though enjoying great potential in various applications of computer vision, predicting eye fixations, however, remains a challenging task. The underlying difficulty inherits from the ambigu- ous notion of what attracts eye fixations, or what is salient. In fact, the theoretical investigation of visual saliency has aroused enduring controversies [38]. One possible expla- nation often adopted in the design of saliency detection ap- Images Human fixations Saliency Stochastic fixations Fixation estimate Figure 1. Saliency computing and fusion in a reverse hierarchy scheme. Images: taken from the TORONTO dataset [3]. Human fixations: eye fixations by human subjects in the eye-tracking ex- periment. Saliency: saliency emerges from image super-resolution from four pairs of coarse-to-fine scales. Stochastic fixations: fixa- tions generated by the reverse hierarchy model. Fixation estimate: blurred from the stochastic fixation map. proaches is the Feature Integration Theory (FIT) [35]. Ac- cording to FIT, attention serves as a mechanism to coher- ently combine features for the perception of objects. There- fore, starting from Itti and Koch [22], eye fixations are com- monly predicted by directly conjoining saliency activations from multiple channels, which can be global and local chan- nels [2], multiple features [15, 13] and so on. Anatomical and physiological studies have shown that human visual system is organized hierarchically, which is believed to be advantageous in efficient processing of visu- al input. Computational studies have shown that hierarchi- cal models (e.g. HMAX [32], CDBN [27]) are effective for object recognition. Most saliency detection models, how- ever, do not seriously take this into account. An obvious method to fill this gap is to develop hierarchical bottom- 1
Transcript of A Reverse Hierarchy Model for Predicting Eye … Reverse Hierarchy Model for Predicting Eye...

A Reverse Hierarchy Model for Predicting Eye Fixations
Tianlin ShiInstitute of Interdisciplinary Information Sciences
Tsinghua University, Beijing 100084, [email protected]
Ming LiangSchool of Medicine
Tsinghua University, Beijing 100084, [email protected]
Xiaolin HuTsinghua National Laboratory for Information Science and Technology (TNList)
Department of Computer Science and Technology, Tsinghua University, Beijing 100084, [email protected]
Abstract
A number of psychological and physiological evidencessuggest that early visual attention works in a coarse-to-fineway, which lays a basis for the reverse hierarchy theory(RHT). This theory states that attention propagates from thetop level of the visual hierarchy that processes gist and ab-stract information of input, to the bottom level that process-es local details. Inspired by the theory, we develop a com-putational model for saliency detection in images. First, theoriginal image is downsampled to different scales to consti-tute a pyramid. Then, saliency on each layer is obtained byimage super-resolution reconstruction from the layer above,which is defined as unpredictability from this coarse-to-finereconstruction. Finally, saliency on each layer of the pyra-mid is fused into stochastic fixations through a probabilis-tic model, where attention initiates from the top layer andpropagates downward through the pyramid. Extensive ex-periments on two standard eye-tracking datasets show thatthe proposed method can achieve competitive results withstate-of-the-art models.
1. IntroductionHuman vision system can selectively direct eyes to in-
formative and salient parts of natural scenes. This abilityallows adaptive and efficient allocation of limited compu-tational resources to important objects. Though enjoyinggreat potential in various applications of computer vision,predicting eye fixations, however, remains a challengingtask. The underlying difficulty inherits from the ambigu-ous notion of what attracts eye fixations, or what is salient.In fact, the theoretical investigation of visual saliency hasaroused enduring controversies [38]. One possible expla-nation often adopted in the design of saliency detection ap-
Images! Human!fixations! Saliency! Stochastic!
fixations!Fixation!estimate!
Figure 1. Saliency computing and fusion in a reverse hierarchyscheme. Images: taken from the TORONTO dataset [3]. Humanfixations: eye fixations by human subjects in the eye-tracking ex-periment. Saliency: saliency emerges from image super-resolutionfrom four pairs of coarse-to-fine scales. Stochastic fixations: fixa-tions generated by the reverse hierarchy model. Fixation estimate:blurred from the stochastic fixation map.
proaches is the Feature Integration Theory (FIT) [35]. Ac-cording to FIT, attention serves as a mechanism to coher-ently combine features for the perception of objects. There-fore, starting from Itti and Koch [22], eye fixations are com-monly predicted by directly conjoining saliency activationsfrom multiple channels, which can be global and local chan-nels [2], multiple features [15, 13] and so on.
Anatomical and physiological studies have shown thathuman visual system is organized hierarchically, which isbelieved to be advantageous in efficient processing of visu-al input. Computational studies have shown that hierarchi-cal models (e.g. HMAX [32], CDBN [27]) are effective forobject recognition. Most saliency detection models, how-ever, do not seriously take this into account. An obviousmethod to fill this gap is to develop hierarchical bottom-
1

up models for saliency detection in the manner of HMAX,CDBN and the like. But there exists theoretical alterna-tives. The Reverse Hierarchy Theory (RHT) [16] arguesthat parallel feedforward feature activation acts implicitlyat first to construct a coarse gist of the scene, while explicitperception incrementally incorporates fine details via feed-back control. This theory potentially has tremendous appli-cations in computer vision including image segmentation,object recognition and scene understanding, however, com-putational studies are scarce. In this paper, we present aneffective model based on RHT for saliency detection, whichproves that RHT is helpful at least in this particular comput-er vision application. As for this application, a more directevidence for the proposed model refers to a psychophysicalstudy [23] which showed that fixations from low-resolutionimages could predict fixations on higher-resolution images.
Our main idea is to model the coarse-to-fine dynamicsof visual perception. We take a simple strategy to construc-t a visual hierarchy by inputting images at different layer-s with different scales, obtained by downsampling the o-riginal image. The higher layers receive coarser input andlower layers receive finer input. On each layer, saliency isdefined as unpredictability in coarse-to-fine reconstructionthrough image super-resolution [9, 8, 41]. The saliency oneach layer is then fused into fixation estimate with a proba-bilistic model that mimics reverse propagation of attention.Throughout the paper, we call the proposed model a reversehierarchy model (RHM).
The coarse-to-fine dynamics, however, is not the onlyproperty of RHT. In fact, RHT is closely related to the bi-ased competition theory of attention [5, 4], which claim-s that attentional competition is biased by either stimulus-driven or task-dependent factors. Our model deals with fix-ation prediction in the free viewing task, which can be re-garded as an implementation of the stimulus-driven bias. Inaddition, the image pyramid is a very coarse approximationof the highly complex structure of the visual hierarchy inthe brain, which only utilizes the fact of increasing recep-tive field sizes along the hierarchy. Therefore, some closelyrelated concepts to RHT, such as perceptual learning [1],would not be discussed in the paper.
2. Related WorkThe majority of computational attention modeling stud-
ies follow the Feature Integration Theory [35]. In particu-lar, the pioneering work by Itti et al. [22, 21] first exploredthe computational aspect of FIT by searching for center-surround patterns across multiple feature channels and im-age scales. This method was further extended through inte-gration of color contrast [26], symmetry [25], etc. RandomCenter Surround Saliency [37] adopted a similar center-surround heuristic but with center size and region randomlysampled. Harel et al. [15] introduced a graph-based model
that treated feature maps as fully connected nodes, while thenodes communicated according to their dissimilarity anddistance in a Markovian way. Saliency was activated as theequilibrium distribution.
Several saliency models adopted a probabilistic ap-proach and modeled the statistics of image features. It-ti and Baldi [20] defined saliency as surprise that arisedfrom the divergence of prior and posterior belief. SUN [43]was a Bayesian framework using natural statistics, in whichbottom-up saliency was defined as self-information. Bruceand Tsotsos [3] proposed an attention model based on in-formation maximization of image patches. Garcia et al. [13]defined the saliency by computing the Hotelling’s T-squaredstatistics of each multi-scale feature channel. Gao et al. [11]considered saliency in a discriminative setting by definingthe KL-divergence between features and class labels.
A special class of saliency detection schemes wasfrequency-domain methods. Hou and Zhang [18] proposeda spectral residual method, which defined saliency as irreg-ularities in amplitude information. Guo [14] explored thephase information in the frequency domain with a Quater-nion Fourier Transform. Recently, Hou et al. [17] intro-duced a simple image descriptor, based on which a compet-itive fast saliency detection algorithm was devised.
Different from our proposal, the conventional practice infusing saliency at different image scales and feature chan-nels was through linear combination. Borji [2] proposed amodel that combined a global saliency model AIM [3] anda local model [22, 21] through linear addition of normalizedmaps. Some models learned the linear combination weightsfor feature channels. Judd et al. [24] trained a linear SVMfrom human eye fixation data to optimally combine the ac-tivation of several low-, mid- and high-level features. Witha similar idea, Zhao and Koch [44] adopted a regression-based approach.
Our model is characterized by a top-down flow of infor-mation. But it differs from most existing saliency detec-tion models that incorporate top-down components such as[39, 34, 43, 28] in two aspects. First, a biased prior (e.g.,context clues, object features, task-related factors) is oftenneeded in those models, serving as the goal of top-downmodulation, which is not necessary in our model. Second,hierarchical structure of the visual cortex is not consideredin those models, but plays a significant role in our model.
Nevertheless, there were a few preliminary studies tryingto make use of the hierarchical structure for saliency detec-tion and attention modeling. The Selective Tuning Mod-el [36] was such a model. It was a biologically plausibleneural network that modeled visual attention as a forwardwinner-takes-all process among units in each visual layer.A recent study [40] used hierarchical structure to combinemulti-scale saliency, with a hierarchical inference procedurethat enforces the saliency of a region to be consistent across
2

Figure 2. Saliency from coarse-to-fine reconstruction. The firstcolumn shows the original images and ground truth saliency. Thesecond to the fourth columns show the reconstructed images byLS, BI and CS, respectively, together with predicted saliency.
different layers.
3. Saliency from Image Super-Resolution
In this section, a coarse-to-fine saliency model based onimage super-resolution is presented. We consider an imageat two consecutive scales in an image pyramid: a coarse oneIl and a fine one Ih. Inspired by RHT, we define saliencyas details in Ih that are unpredictable from Il. In the nextsection, we discuss how to fuse saliency on each layer ofthe pyramid into fixation estimate.
3.1. Saliency as Unpredictability
Predicting Ih using the information of Il is closely relat-ed to image super-resolution, which has been extensively s-tudied using techniques including Markov random field [9],example-based learning [8], compressive sensing [41], etc.In patch-based representation of images, the problem is topredict a high-resolution H × H patch xh ∈ Ih from it-s low-resolution L × L counterpart xl ∈ Il. For conve-nience of notation, we also use xh and xl as H2 and L2
dimensional vectors, which are computed by reshaping thecorresponding patches. Then xl is obtained by blurring and
downsampling xh:
xl = GBxh , (1)
where B denotes a H2 × H2 blurring matrix (throughoutthe paper a Gaussian matrix is used) and G represents aL2 × H2 downsampling matrix. Let xh denote the recon-structed patch by some method A, which summarizes thebest knowledge one can recover from the coarse perceptionof xh via xl. The reconstruction error of xh from xh nat-urally represents the fine-scale information that cannot berecovered. Therefore, we define saliency S(xh|xl) as theNormalized Mean Square Error (NMSE):
S(xh|xl) =||xh − xh||22||xh||22
. (2)
The mean squared error is normalized so that S(xh|xl) isrobust to variations of the patch energy ||xh||2.
3.2. Coarse-to-Fine Reconstruction
The reconstruction from the coarse scale subject to theconstraint (1) is actually not well-defined, since given a low-resolution patch xl, there exists an infinite number of pos-sible high-resolution patches xh. To resolve this issue, thebasic idea is to incorporate some prior knowledge, which in-herits from the properties of natural images. In what followswe discuss several possible reconstruction schemes with in-creasingly sophisticated prior knowledge.
Linear Reconstruction (LR). Consider a trivial case:the coarse patch xl = Bxh is just the blurred version andwe do nothing but output xh = xl. Therefore, no prior isused in this case. Saliency can be computed according to(2). As shown in Fig. 2, this method assigns more salien-cy to patches containing many high-frequency componentslike edges and textures.
Bicubic Interpolation (BI). If we reconstruct xh usingbicubic interpolation, then we utilize a smoothness prior inimage interpolation. Although this approach concentratesless on edges than the linear reconstruction, its prediction isstill far from the ground truth. See Fig. 2.
With LR or BI, the saliency computed in (2) is the nor-malized l2-norm of the Laplacian pyramid. In addition,the two techniques can be used to implement the center-surround strategy adopted in some saliency models, e.g.[22].
Compressive Sensing (CS). We now consider a moresophisticated prior of image structure – sparsity [19]. Ac-cording to this prior, any patch xh of a high-resolution im-age can be sparsely approximated by a linear combinationof items in a dictionaryDh:
xh ≈Dhα, (3)
3

for some sparse coefficients α that satisfies ||α||0 ≤ K forsome small K. Assuming α is sparse, the theory of com-pressive sensing states that α can be recovered from suffi-cient measurements xl = GBxh by solving the followingoptimization problem [7]:
min ||α||0 subject to ||Dlα− xl||2 ≤ ε, (4)
whereDl = GBDh denotes the blurred and downsampleddictionary Dh and ε is the allowed error tolerance. This ishard to solve, and in practice the following relaxed problemis often solved [6, 7]:
min ||α||1 subject to ||Dlα− xl||2 ≤ ε. (5)
The coefficients α are then used to reconstruct xh by
xh =Dhα. (6)
Once we have obtained xh, saliency of the image patchcan be computed using (2). Preliminary results in Fig. 2indicate that the saliency obtained by compressive sensingcan largely differ from that obtained by LR and BI.
The dictionaries Dl and Dh are constructed as follows.For each scale of the image pyramid, we first uniformlysample raw patches {dih}ni=1 of size H × H (n � H2),and stack them into a high-resolution dictionary Dh =[d1h,d
2h, ...,d
nh]. Then we apply the blurring matrix B and
downsampling matrix G to each dih to obtain dil = GBdih.So Dl = [d1l ,d
2l , ...,d
nl ] is the collection of correspond-
ing low-resolution patches. The use of overcomplete rawpatches for Dh and Dl has been shown effective for imagesuper-resolution [41].
3.3. Saliency Map
A saliency mapM is obtained by collecting patch salien-cy defined in (2) over the entire image. First, calculate
M [i, j] = S(xh[i, j] | xl[i, j]), (7)
where xh[i, j] is the patch centered at pixel (i, j) in the im-age and xl[i, j] is its low-resolution version. Then M isblurred with a Gaussian filter [17] and normalized to be be-tween [0, 1] to yield the final saliency map M . One shouldnot confuse this Gaussian filter with B in Sections 3.1 and3.2.
4. Reverse Propagation of SaliencyNow, we present a method to transform the saliency
maps at different scales into stochastic eye fixations on theoriginal image. Based on RHT [16], a reverse propagationmodel is presented, where attention initiates from top leveland propagates downward through the hierarchy.
4.1. Generating Fixations
We model attention as random variables A0, A1, ..., An
on saliency maps M0,M1, ...,Mn, which are ordered in acoarse-to-fine scale hierarchy. Specifically, let Pr[Ak =(i, j)] denote the probability for pixel (i, j) attracting a fix-ation. To define this probability, we need to consider fac-tors that influence the random variable Ak. First of all, thesaliency map Mk is an important factor. Pixels with highervalues should receive more fixations. Second, according toRHT, attention starts from M0, and then gradually propa-gates down along the hierarchy. Therefore, Ak should alsodepend on Ak−1, ..., A0. For simplicity, we assume that on-ly Ak−1 has an influence on Ak while Ak−2, ..., A0 do not.
Based on these considerations, we define
Pr[Ak|Mk, Ak−1, ..., A0] = Pr[Ak|Mk, Ak−1], (8)
for k = 1, ..., n. A log-linear model is used for this condi-tional probability
Pr[Ak = (i, j)|Mk, Ak−1]
∝ exp(ηMk(i, j) + λL(Ak, Ak−1)
),
(9)
where L(Ak, Ak−1) is a spatial coherence term, η and λare two constants. The spatial coherence term restricts thefixated patches to be close in space. The motivation of intro-ducing this term comes from the fact that the visual systemis more likely to amplify the response of neurons that is co-herent with initial perception [16, 29]. To compute the term,we first convert the coordinate Ak−1 into the correspondingcoordinate (u, v) in the saliency map just below it, i.e. Mk.Then compute
L(Ak, Ak−1) = −((i− u)2 + (j − v)2
). (10)
In other words, the farther away a patch x is from Ak−1,the less likely it would be attended by Ak. Therefore, forpredicting the fixation probability of any patch in the cur-rent layer, the model makes a tradeoff between the spatialcoherence with previous attention and its current saliencyvalue.
If we do not consider any prior on the top layer, Pr[A0]depends on the saliency map only
Pr[A0 = (i, j)] ∝ exp(ηM0[i, j]
). (11)
We can then generate fixations via an ancestral samplingprocedure from the probability model. Specifically, we firstsample fixation A0 on map M0 according to (11), and thenfor k = 1, 2, . . . sample Ak on map Mk given Ak−1 onthe coarser scale according to (9). Finally, we collect allsamples on the finest scale, and use them as prediction ofthe eye fixations.
4

Figure 3. Illustration of a three-layer reverse hierarchy model. Theattention initiates from a coarse image of a cat’s face and propa-gates downward to lower-level details such as the cat’s eyes.
4.2. Incorporating Prior of Fixations
The proposed probabilistic model offers great flexibilityfor incorporating prior of fixations. This prior can be usefulin capturing, for example, the top-down guidance of visualsaliency from recognition [10, 42], or central bias in eye-tracking experiments [33]. To achieve this, we extend theexpression of Pr[A0] as follows:
Pr[A0 = (i, j)] ∝ exp(ηM0[i, j] + θP [i, j]
), (12)
where P [i, j] encodes the prior information of pixel (i, j)on the first map M0 and θ is a weighting parameter.
For example, the central bias can be incorporated intothe model by setting P [i, j] = −[(i − cx)2 + (j − cy)2],where (cx, cy) denotes the map center.
5. Experiments
5.1. Experiment Settings
Datasets. The performance of the proposed reverse hi-erarchy model (RHM) was evaluated on two human eye-tracking datasets. One was the TORONTO dataset [3]. Itcontained 120 indoor and outdoor color images as well asfixation data from 20 subjects. The other was the MITdataset [24], which contained 1003 images collected fromFlicker and LabelMe [31]. The fixation data was obtainedfrom 15 subjects.
Parameters. The raw image I in RGB representationwas downsampled by factors of 27, 9, 3 to construct acoarse-to-fine image pyramid. The patch size for super-resolution was set as 9× 9 on each layer. To construct cor-responding coarse patches, we used Gaussian blurring filterB (σ = 3) and downsampling operator G with a factor of3. A total of 1000 image patches were randomly sampledfrom all images at the current scale to construct the dictio-
nary Dh, which is then blurred and downsampled to buildDl.
In some experiments, we included a center bias [33] inthe model. This is achieved by switching θ from 0 to 1 in(12).
Note that the reverse propagation described in (8)-(11)is a stochastic sampling procedure and we need to generatea large number of fixations to ensure unbiased sampling.We found that 20000 points on each image were enoughto achieve good performance, which was adopted in all ex-periments. The stochastic points were then blurred with aGaussian filter to yield the final saliency map. The stan-dard deviation of the Gaussian filter was fixed as 4 pixels onsaliency maps, which was about 5% of the width of salien-cy maps of TORONTO images (TORONTO images had thesame size), similar to [17].
Evaluation metric. Several metrics have been used toevaluate the performance of saliency models. We adoptedArea Under Curve (AUC) [3], Normalized Scanpath Salien-cy (NSS) [30] and Similarity (S) [24]. Specifically, We usedthe AUC code from the GBVS toolbox [15], NSS code from[2] and Similarity code from [24]. Following [24], we firstmatched the histogram of the saliency map to that of thefixation map to equalize the amount of salient pixels in themap, and then used the matched saliency map for evalua-tion. Note that AUC was invariant to this histogram match-ing [24].
Models for comparison. The proposed model was com-pared with several state-of-the-art models: Itti & Koch [21],Spectral Residual Methods (SR) [18], Saliency based onInformation Maximization (AIM) [3], Graph Based Visu-al Saliency (GBVS) [15], Image Signature (ImgSig) [17],SUN framework [43] and Adaptive Whitening Saliency(AWS) [12]. The implementation of these models werebased on publicly available codes/software. Among thesemodels, GBVS [15], ImgSig [17] and AWS [12] usuallyperformed better than the others.
Inspired by the center bias [33], we included a Centermodel as a baseline, which was simply a Gaussian functionwith mean at the center of the image and standard devia-tion being 1/4 of the image width [15]. This simple modelwas also combined with other saliency detection models toaccount for the center bias, which could boost accuracy offixation prediction. Following [15], this was achieved bymultiplying the center model with the saliency maps ob-tained by these models in a point-wise manner.
5.2. Results
First, we compared different super-resolution techniques(LR, BI and CS) for eye fixation prediction. Fig. 5 showsthe results of RHM with the three techniques. The CSmethod significantly outperformed LR and BI. Therefore,sparsity as a prior offers great advantage in discovering
5

Image GT SUN Itti et al. SR PQFT AIM GBVS AWS ImgSig RHM
Figure 4. Saliency maps produced by different models as well as the ground truth (GT). The saliency maps of RHM were obtained fromthe predicted fixations blurred with a Gaussian filter.
TORONTO Dataset [3] MIT Dataset [24]With Center Without Center With Center Without Center
Model AUC NSS S AUC NSS S AUC NSS S AUC NSS SCenter 0.801 1.118 0.472 - - - 0.816 1.160 0.381 - - -
PQFT [14] 0.814 1.466 0.483 0.751 0.362 0.372 0.801 1.033 0.361 0.722 0.645 0.275SR [18] 0.782 1.284 0.439 0.731 0.876 0.353 0.756 1.178 0.324 0.700 0.568 0.262
SUN [43] 0.769 1.144 0.414 0.685 0.678 0.314 0.774 0.653 0.246 0.679 0.577 0.260AIM [3] 0.815 1.656 0.553 0.758 0.960 0.404 0.750 0.782 0.414 0.739 0.569 0.291Itti [21] 0.810 1.276 0.452 0.762 0.884 0.367 0.793 0.962 0.331 0.738 0.550 0.264
GBVS [15] 0.832 1.712 0.554 0.811 1.404 0.476 0.823 1.355 0.375 0.765 0.661 0.310AWS [12] 0.834 1.803 0.537 0.747 1.289 0.414 0.812 0.840 0.403 0.735 0.876 0.314
ImgSig [17] 0.840 1.746 0.548 0.802 1.509 0.478 0.823 0.898 0.376 0.761 0.790 0.311RHM 0.842 1.729 0.573 0.836 1.631 0.553 0.835 1.480 0.425 0.810 1.100 0.383
Table 1. Quantitative comparison of different models.
salient fine details. We then focused on RHM with CS insubsequent experiments.
Fig. 4 shows some qualitative comparison of the pro-posed model against existing models. Table 5 shows quan-titative results under three metrics. As we can see, no s-ingle model could dominate others under all three metrics.However, in most cases (including both “with” and “withoutcenter” settings), the RHM outperformed the current state-of-the-art models. This demonstrated the reverse hierarchytheory as a promising way to predict human eye fixations.
5.3. Contributions of Individual Components
The RHM consists of two components: coarse-to-fine re-construction (especially compressive sensing) and reversepropagation. Although the two components integrated to-gether showed promising results, the contribution of eachcomponent to the performance is unclear. This is discussedas follows.
Compressive sensing. To identify the role of compres-
LR BI CS0.75
0.8
0.85AUC
TO
RO
NT
O
LR BI CS0
1
2NSS
LR BI CS0
0.5
1S
LR BI CS0.75
0.8
0.85AUC
MIT
LR BI CS0.5
1
1.5NSS
LR BI CS0
0.5
1S
Without Center With Center
Figure 5. Performance of RHM with three reconstruction methodsLR, BI and CS.
6
0.793
0.812
0.825
0.790
0.6! 0.7! 0.8! 0.9!
SR!
Itii & Koch!
AIM!
SUN!
Original!Blur!RHM!
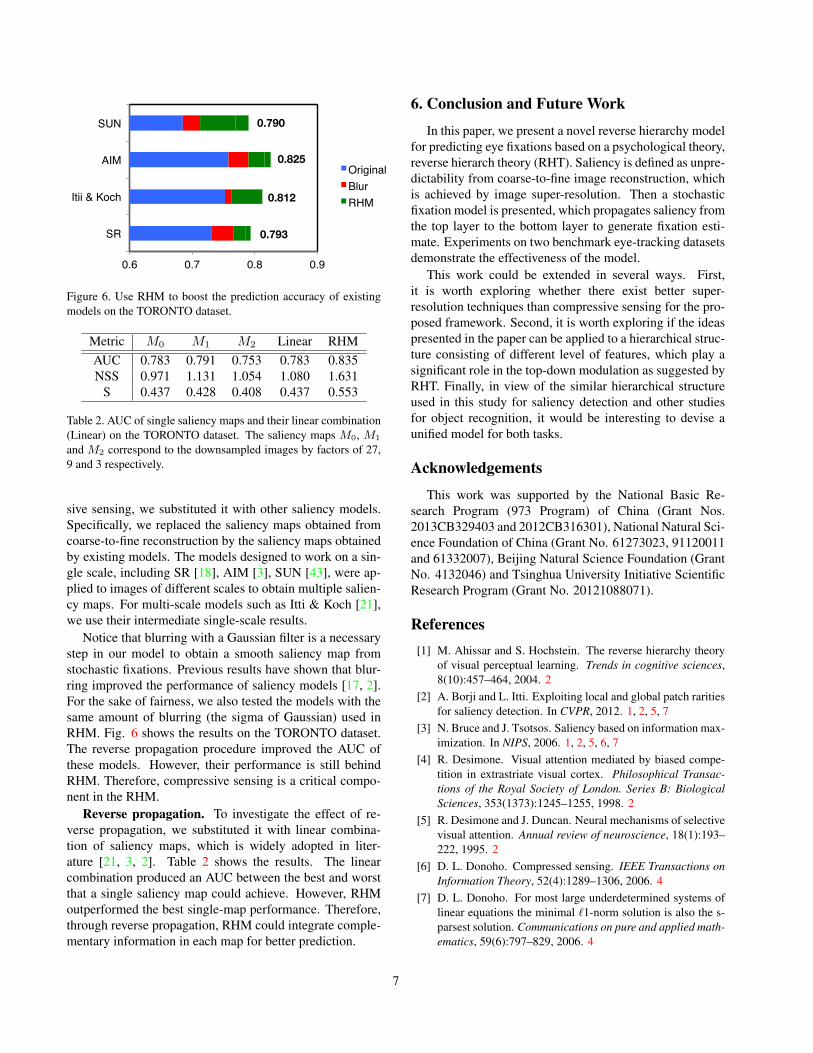
Figure 6. Use RHM to boost the prediction accuracy of existingmodels on the TORONTO dataset.
Metric M0 M1 M2 Linear RHMAUC 0.783 0.791 0.753 0.783 0.835NSS 0.971 1.131 1.054 1.080 1.631
S 0.437 0.428 0.408 0.437 0.553
Table 2. AUC of single saliency maps and their linear combination(Linear) on the TORONTO dataset. The saliency maps M0, M1
and M2 correspond to the downsampled images by factors of 27,9 and 3 respectively.
sive sensing, we substituted it with other saliency models.Specifically, we replaced the saliency maps obtained fromcoarse-to-fine reconstruction by the saliency maps obtainedby existing models. The models designed to work on a sin-gle scale, including SR [18], AIM [3], SUN [43], were ap-plied to images of different scales to obtain multiple salien-cy maps. For multi-scale models such as Itti & Koch [21],we use their intermediate single-scale results.
Notice that blurring with a Gaussian filter is a necessarystep in our model to obtain a smooth saliency map fromstochastic fixations. Previous results have shown that blur-ring improved the performance of saliency models [17, 2].For the sake of fairness, we also tested the models with thesame amount of blurring (the sigma of Gaussian) used inRHM. Fig. 6 shows the results on the TORONTO dataset.The reverse propagation procedure improved the AUC ofthese models. However, their performance is still behindRHM. Therefore, compressive sensing is a critical compo-nent in the RHM.
Reverse propagation. To investigate the effect of re-verse propagation, we substituted it with linear combina-tion of saliency maps, which is widely adopted in liter-ature [21, 3, 2]. Table 2 shows the results. The linearcombination produced an AUC between the best and worstthat a single saliency map could achieve. However, RHMoutperformed the best single-map performance. Therefore,through reverse propagation, RHM could integrate comple-mentary information in each map for better prediction.
6. Conclusion and Future Work
In this paper, we present a novel reverse hierarchy modelfor predicting eye fixations based on a psychological theory,reverse hierarch theory (RHT). Saliency is defined as unpre-dictability from coarse-to-fine image reconstruction, whichis achieved by image super-resolution. Then a stochasticfixation model is presented, which propagates saliency fromthe top layer to the bottom layer to generate fixation esti-mate. Experiments on two benchmark eye-tracking datasetsdemonstrate the effectiveness of the model.
This work could be extended in several ways. First,it is worth exploring whether there exist better super-resolution techniques than compressive sensing for the pro-posed framework. Second, it is worth exploring if the ideaspresented in the paper can be applied to a hierarchical struc-ture consisting of different level of features, which play asignificant role in the top-down modulation as suggested byRHT. Finally, in view of the similar hierarchical structureused in this study for saliency detection and other studiesfor object recognition, it would be interesting to devise aunified model for both tasks.
Acknowledgements
This work was supported by the National Basic Re-search Program (973 Program) of China (Grant Nos.2013CB329403 and 2012CB316301), National Natural Sci-ence Foundation of China (Grant No. 61273023, 91120011and 61332007), Beijing Natural Science Foundation (GrantNo. 4132046) and Tsinghua University Initiative ScientificResearch Program (Grant No. 20121088071).
References[1] M. Ahissar and S. Hochstein. The reverse hierarchy theory
of visual perceptual learning. Trends in cognitive sciences,8(10):457–464, 2004. 2
[2] A. Borji and L. Itti. Exploiting local and global patch raritiesfor saliency detection. In CVPR, 2012. 1, 2, 5, 7
[3] N. Bruce and J. Tsotsos. Saliency based on information max-imization. In NIPS, 2006. 1, 2, 5, 6, 7
[4] R. Desimone. Visual attention mediated by biased compe-tition in extrastriate visual cortex. Philosophical Transac-tions of the Royal Society of London. Series B: BiologicalSciences, 353(1373):1245–1255, 1998. 2
[5] R. Desimone and J. Duncan. Neural mechanisms of selectivevisual attention. Annual review of neuroscience, 18(1):193–222, 1995. 2
[6] D. L. Donoho. Compressed sensing. IEEE Transactions onInformation Theory, 52(4):1289–1306, 2006. 4
[7] D. L. Donoho. For most large underdetermined systems oflinear equations the minimal `1-norm solution is also the s-parsest solution. Communications on pure and applied math-ematics, 59(6):797–829, 2006. 4
7

[8] W. T. Freeman, T. R. Jones, and E. C. Pasztor. Example-based super-resolution. Computer Graphics and Applica-tions, 22(2):56–65, 2002. 2, 3
[9] W. T. Freeman, E. C. Pasztor, and O. T. Carmichael. Learn-ing low-level vision. IJCV, 40(1):25–47, 2000. 2, 3
[10] D. Gao, S. Han, and N. Vasconcelos. Discriminant saliency,the detection of suspicious coincidences, and applications tovisual recognition. PAMI, 31(6):989–1005, 2009. 5
[11] D. Gao, V. Mahadevan, and N. Vasconcelos. The discrimi-nant center-surround hypothesis for bottom-up saliency. InNIPS, 2007. 2
[12] A. Garcia-Diaz, X. R. Fdez-Vidal, X. M. Pardo, and R. Dosil.Decorrelation and distinctiveness provide with human-likesaliency. In Advanced Concepts for Intelligent Vision Sys-tems, pages 343–354. Springer, 2009. 5, 6
[13] A. Garcia-Diaz, X. R. Fdez-Vidal, X. M. Pardo, and R. Dosil.Saliency from hierarchical adaptation through decorrelationand variance normalization. Image and Vision Computing,30(1):51–64, 2012. 1, 2
[14] C. Guo, Q. Ma, and L. Zhang. Spatio-temporal saliency de-tection using phase spectrum of quaternion fourier transfor-m. In CVPR 2008. 2, 6
[15] J. Harel, C. Koch, and P. Perona. Graph-based visual salien-cy. In NIPS, 2006. 1, 2, 5, 6
[16] S. Hochstein and M. Ahissar. View from the top: Hierar-chies and reverse hierarchies in the visual system. Neuron,36(5):791–804, 2002. 2, 4
[17] X. Hou, J. Harel, and C. Koch. Image signature: Highlight-ing sparse salient regions. PAMI, 34(1):194–201, 2012. 2, 4,5, 6, 7
[18] X. Hou and L. Zhang. Saliency detection: A spectral residualapproach. In CVPR, 2007. 2, 5, 6, 7
[19] A. Hyvarinen, J. Hurri, and P. O. Hoyer. Natural Image S-tatistics. Springer-Verlag, 2009. 3
[20] L. Itti and P. Baldi. Bayesian surprise attracts human atten-tion. In NIPS, 2006. 2
[21] L. Itti and C. Koch. Computational modelling of visual at-tention. Nature reviews neuroscience, 2(3):194–203, 2001.2, 5, 6, 7
[22] L. Itti, C. Koch, and E. Niebur. A model of saliency-based vi-sual attention for rapid scene analysis. PAMI, 20(11):1254–1259, 1998. 1, 2, 3
[23] T. Judd, F. Durand, and A. Torralba. Fixations on low-resolution images. Journal of Vision, 11(4):14, 2011. 2
[24] T. Judd, K. Ehinger, F. Durand, and A. Torralba. Learning topredict where humans look. In ICCV, 2009. 2, 5, 6
[25] G. Kootstra, A. Nederveen, and B. De Boer. Paying attentionto symmetry. In BMVC, 2008. 2
[26] O. Le Meur, P. Le Callet, D. Barba, and D. Thoreau. A coher-ent computational approach to model bottom-up visual atten-tion. PAMI, 28(5):802–817, 2006. 2
[27] H. Lee, R. Grosse, R. Ranganath, and A. Y. Ng. Convolution-al deep belief networks for scalable unsupervised learning ofhierarchical representations. In ICML, pages 609–616, 2009.1
[28] T. Liu, Z. Yuan, J. Sun, J. Wang, N. Zheng, X. Tang, andH.-Y. Shum. Learning to detect a salient object. PAMI,33(2):353–367, 2011. 2
[29] J. Newman, B. J. Baars, and S.-B. Cho. A neural globalworkspace model for conscious attention. Neural Networks,10(7):1195–1206, 1997. 4
[30] R. J. Peters, A. Iyer, L. Itti, and C. Koch. Components ofbottom-up gaze allocation in natural images. Vision research,45(18):2397–2416, 2005. 5
[31] B. C. Russell, A. Torralba, K. P. Murphy, and W. T. Free-man. LabelMe: a database and web-based tool for imageannotation. IJCV, 77(1-3):157–173, 2008. 5
[32] T. Serre, L. Wolf, S. Bileschi, M. Riesenhuber, and T. Pog-gio. Robust object recognition with cortex-like mechanisms.PAMI, 29(3):411–426, 2007. 1
[33] B. W. Tatler, R. J. Baddeley, and I. D. Gilchrist. Visual cor-relates of fixation selection: Effects of scale and time. Visionresearch, 45(5):643–659, 2005. 5
[34] A. Torralba, A. Oliva, M. S. Castelhano, and J. M. Hender-son. Contextual guidance of eye movements and attentionin real-world scenes: the role of global features in objectsearch. Psychological review, 113(4):766, 2006. 2
[35] A. M. Treisman and N. G. Kanwisher. Perceiving visual-ly presented objets: recognition, awareness, and modularity.Current opinion in neurobiology, 8(2):218–226, 1998. 1, 2
[36] J. K. Tsotsos, S. M. Culhane, W. Y. K. Wai, Y. Lai, N. Davis,and F. Nuflo. Modeling visual attention via selective tuning.Artificial Intelligence, 78(1-2):507–545, 1995. 2
[37] T. N. Vikram, M. Tscherepanow, and B. Wrede. A saliencymap based on sampling an image into random rectangularregions of interest. Pattern Recognition, 45(9):3114–3124,2012. 2
[38] J. M. Wolfe. Moving towards solutions to some enduringcontroversies in visual search. Trends in cognitive sciences,7(2):70–76, 2003. 1
[39] J. M. Wolfe and T. S. Horowitz. What attributes guide thedeployment of visual attention and how do they do it? NatureNeuroscience, 5(6):495–501, 2004. 2
[40] Q. Yan, L. Xu, J. Shi, and J. Jia. Hierarchical saliency detec-tion. In CVPR, pages 1155–1162, 2013. 2
[41] J. Yang, J. Wright, T. Huang, and Y. Ma. Image super-resolution as sparse representation of raw image patches. InCVPR, 2008. 2, 3, 4
[42] J. Yang and M.-H. Yang. Top-down visual saliency via jointCRF and dictionary learning. In CVPR, 2012. 5
[43] L. Zhang, M. Tong, T. Marks, H. Shan, and G. Cottrell. SUN:A bayesian framework for saliency using natural statistics.Journal of Vision, 8(7), 2008. 2, 5, 6, 7
[44] Q. Zhao and C. Koch. Learning a saliency map using fixatedlocations in natural scenes. Journal of vision, 11(3), 2011. 2
8