A retail branch profitability measurement model for the ...
71
University of Richmond UR Scholarship Repository Master's eses Student Research 1990 A retail branch profitability measurement model for the thriſt industry Rex L. Smith III Follow this and additional works at: hp://scholarship.richmond.edu/masters-theses Part of the Business Administration, Management, and Operations Commons is esis is brought to you for free and open access by the Student Research at UR Scholarship Repository. It has been accepted for inclusion in Master's eses by an authorized administrator of UR Scholarship Repository. For more information, please contact [email protected]. Recommended Citation Smith, Rex L. III, "A retail branch profitability measurement model for the thriſt industry" (1990). Master's eses. Paper 1015.
Transcript of A retail branch profitability measurement model for the ...

University of RichmondUR Scholarship Repository
Master's Theses Student Research
1990
A retail branch profitability measurement model forthe thrift industryRex L. Smith III
Follow this and additional works at: http://scholarship.richmond.edu/masters-theses
Part of the Business Administration, Management, and Operations Commons
This Thesis is brought to you for free and open access by the Student Research at UR Scholarship Repository. It has been accepted for inclusion inMaster's Theses by an authorized administrator of UR Scholarship Repository. For more information, please [email protected].
Recommended CitationSmith, Rex L. III, "A retail branch profitability measurement model for the thrift industry" (1990). Master's Theses. Paper 1015.

A RETAIL BRANCH PROFITABILITY MEASUREMENT MODEL FOR THE THRIFT INDUSTRY
A research project submitted in partial fulfillment of the requirements
for the MBA degree
by
Rex L. Smith, III
Executive MBA, Class of 1990 University of Richmond
James A. Schweikart, PhD, CPA Project Supervisor
March 23, 1990
Reproduction of any part of this document without permission of the author is prohibited.
Section I.
II.
III.
TABLE OF CONTENTS
Page Background and Problem . . . . . . . . . . . . 1
History of Thrift Regulation • . . . . . . . 1 Thrift Operations after Deregulation . • • • 4 Historical Measurements of Profit . • • . 6 Problems of Past Measurement Methods . . . . 8
Performance Measurement in Retail Banking . . . 14 Organizational Structure of a Thrift . . . . 14 Retail Banking Performance • • • • . . . . . 15 Responsibility Accounting as a System of Measurement • • • • . • . . . . . • • . 17 Establishing the Profit Center Concept • • • 19 Defining Expenses • . . . . . • . . Expense Recognition . . . . . . . . • • Revenue Recognition . . . . . . . . . . .'
~-20
• 21 27
A Branch Performance Model Sample Model Results ....
• • • • 34 • • • • 40
IV. Summary • . • . . . . • . • • • . • . . 4 3 The Necessity of a Branch Performance Model • . • . • . • . • . . • • • . . 43 Why the Resposibility Model Works . . . • . . 45
Appendixes A. Formulas for Spreadsheet Calculation • . . • . 48 B. State of Virginia Application to Establish a
Thrift Branch . . . . • . . • . . . . . . 52 c. Branch Manager Position Description . . . . . . 60
Bibliography . . . . . . • . • . . • . • • 64

SECTION I
BACKGROUND AND PROBLEM
Deregulation of the financial services industry has created
a need for management to adapt a different approach to
operations. Drastic regulatory and environmental changes have
forced thrifts and banks to concentrate on increasing efficiency
and core profitability from the retail branch network. Once
considered to be highly bureaucratic, financial institutions are
trimming back off ice review and focusing on a more decentralized
leaner operation.(Middaugh, 1988) Expensive mergers and large
conglomerate financial powerhouses have created a need for
increased management controls and reasonable methods of measuring
the true profitability of the individual business units within a
financial services company.
HISTORY OF THRIFT REGULATION
To fully understand the structural and organizational
changes that have been forced upon the industry requires an
examination of the regulatory changes that have taken place and
the accompanying competitive environment that has evolved. The

2
first of these changes took place in 1980 when Congress: passed'
The Depository Institutions Deregulation and Monetary Control
Act. This law repealed Regulation Q which set the-interest rate
banks and thrifts could pay on deposits. It also eliminated the'
set rate differential of 25 basis points between thrifts··and
banks. The differential gave thrifts a regulated•- competitive
edge over banks.
The. 1980 regulation lifted rate limits on the :·right side of
the balance sheet while holding mortgage rates (a major asset
category for thrifts) at a set non-competitive price .. This
allowed rapid repricing of liabilities (cost side) while·holding
the asset (earnings side) at a regulated low rate._· The prime ·rate
at this time soared to new record highs, and many thrifts were
caught with mismatched portfolios. While deposit products were
very rate competitive and short term in nature, mortgage loan
rates remained fixed at low rates with long maturities. This
lead to negative spreads and erosion of net worth. · ·
The second major regulatory change took place in:l982 with
the passage of The Depository Institutions Act. This law began
to eliminate the barriers to interstate banking and permitted
banks to set up their own brokerage operations .. Later that same
year, interest rate restrictions on residential mortgages were
lifted and entry barriers into the home mortgage market were

3
eliminated. By the time full deregulation was phased in, most
thrifts had been ravaged by the pricing mismatch and the
competition from the deregulated deposit side of the balance
sheet. This problem lead most thrifts to search for new methods
to rapidly increase earnings. New products and services on both
the deposit and loan side were created to emphasize collection of
fee income.
High dollar real estate development loans became extremely
popular because of the large fees collected up front and the
ability of a large variable rate credit to have an almost
immediate effect on the ROA of the loan portfolio. However,
these credits also have a substantial risk of default that can
have an immediate negative effect on ROA and net worth. By the
mid-1980's, many thrifts had suffered losses from bad real estate
holdings. Others managed to use real estate development to help
restructure old fixed rate asset portfolios into profitable
variable rate ones that better matched the liability side.
Adoption of Financial Accounting Standards Board statement
number 91 eliminated immediate credit of fee income and the
desirability of large real estate loans (Financial Accounting
Series, 1988). It required that any fees collected in advance on

4
a loan transaction be amortized to income over the life of the
loan instead of going immediately to income. This reduced the
potential income stream thrifts had prior to FASB number 91.
The most recent regulation has also created the most change
within the thrift industry. The Financial Institutions Reform
Recovery and Enforcement Act of 1989(FIRREA) will eliminate all
differences between banks and thrift institutions. This will
put.extreme pressure on most thrifts to make the balance sheet
and core earnings resemble those of a bank. New capital
requirements, along with asset mix and risk ranking requirements,
are forcing thrifts into a tough and newly competitive arena.
THRIFT OPERATIONS AFTER DEREGULATION
FIRREA has eliminated direct investment in real estate and
has severely restricted the amount of loans that can be made for
commercial real estate projects. Seventy percent of assets are
required to be in residential mortgage notes, an asset that has
carried a very thin margin since the deregulation of 1982.
Thrifts must, therefore, look for highly profitable loans to fill
the remaining thirty percent of the earning asset category.
There will be a lot of new competition for loans that have
traditionally been made by banks. Thrifts must decide what
type of new loan products to market and what channel of

5
distribution to use. The choices for thrifts are: asset based
business loans, trust services, and, consumer loans and services
including upscale professional and executive lending.
Large banks have dominated the first two categories for some
time, and thrifts do not have the manpower nor the expertise to
compete against them. The third, consumer services, is something
thrifts have had experience with, but mostly from a collection of
funds standpoint. Resources must be redirected to place emphasis
on the total consumer relationship. A good consumer service base
has been the foundation for most banks in establishing long run
profitable growth plans (Gopalan, 1988). A solid retail branch
network is the key to building that base.
In addition, efficiency of operation of the branch network
is imperative. In the midst of all the regulatory changes,
technological changes and increased consumer awareness have also
added to the competitive pressure. This combination has brought
about significant changes in business practices that increased
competition between financial institutions. The increased
competition is the reason operating efficiency is so important.
Of course, achieving operating efficiency assumes an accurate and
timely measurement of that efficiency. Most financial
institutions have had the luxury in the past of judging
efficiency through very broad methods of measurement.
6
HISTORICAL MEASUREMENTS OF PROFIT
Generally, the focus for profitability is at the macro level
and consists of many varied micro returns within the institution.
Historically, return on assets (ROA) and return on equity (ROE)
have been the primary measurements that financial institutions
have relied upon to indicate economic health and critical trends.
The traditional assumption holds that if these key ratios are
maximized, then shareholder wealth is also maximized. ROA
defined is, "The ratio of net profit to total assets, measuring
the return on total assets after interest and taxes."(Rao, 1987).
Since asset utilization is simply increasing the rate of return
on loans or increasing the volume of loans, ROA as defined seems
to be a good measure for bank performance. Increased competition
and growth has lead banks to emphasize hurdle spread rates on
loan assets to ensure a certain level of profitability.
These simple ROA "spread pricing" models are made applicable
to both individual credits as well as complete loan portfolios.
The purpose is to motivate staff at all levels to continually
think in terms of total return to the company. However, banks
realize that growth in assets does not necessarily translate to
enhancement of stockholder wealth. This is true when new assets
generated do not meet planned rates of return. If this occurs,
leverage increases because bank assets increase at a rate

7
faster than the rate at which the bank can create equity capital
through earnings. The difference must be funded by additional,
debt.
Return on equity is considered by some to be a better
measurement of performance "because it measures how well the
company is employing capital provided by stockholders" (Bedwell,
1986). Improving ROE has become increasingly popular as the
result of the increasing number of mergers and acquisitions in
the industry. Banks with a high ROE are more difficult to
acquire, and if acquired, the price paid per share is'at a
premium.
While many analysts still use ROA and ROE as the predominant
measures of bank performance, as an internal measure"'.of .a
business unit performance they are weak. First, both are: merely·
snapshot measures pulled from the book entries of the'company.
Book values fail to account for changes in the value of· assets,
liabilities, and equity occurring between their placement on the
books and their removal by sale, repayment, maturity, or
charge-off. The failure of book values to reflect such changes
in net worth is a serious problem when a bank is attempting to
measure the performance of individual units on a momentum basis.
Second, ROA and ROE are subject to a number of variables that~may
or may not be controlled at the business unit level. and,

8
therefore, may not be translatable to that level. Many times
totals and reports of a more macro nature obscure the fact·that
an outstanding performance of one component, such as a product or
branch, can be offset by substandard results in another'".
component. Prospective growth in earnings and potential 1
profitability of each business unit may be much more important as
a measure of bank performance (ABA Journal, 1985)";
Many institutions use the budget as the sole means of
control and performance measurement at the micro level. Budgets
can be helpful to evaluate performance, motivate personnel, or to
plan for future changes. Unfortunately, many institutions try to
accomplish all three purposes using one budgetary device. This
does not work. Use of budgets for motivation requires that · ,. ·
targets be difficult but attainable, as well as relatively rigid.
Use of budgets for planning implies the "most likely" scenario be '
used. Use of budgets for performance evaluation requires that
adjustments be made after the fact to account for unforeseen .
events. Clearly, these budget characteristics are in conflict
with one another (Middaugh, 1988).
PROBLEMS OF PAST MEASUREMENT METHODS
Given the shortcomings of these measurement tools, how does
a thrift or any other financial institution go about measuring
performance on a micro or subunit level? The answer I

9
requires a look at the organizational structure. First, most
institutions have recently gone through a complete structural
change. Some change has been in response to the regulatory
environment, while other change has come from the need to service
newly developed financial products and services designed to help
the institution compete in the environment of the future. The
additions in products and services have meant whole new
departments, adding to the already complex and mammoth structure
of financial institutions.
To be competitive, to comply to regulation, and to be
profitable are becoming tasks of measuring and controlling the
efficiency and effectiveness of each business unit.
Organizational structure is the first step to achieve these three
goals. There are obviously many variations in corporate
structure, each with a particular emphasis and purpose. There
are; centralized management and decentralized management, top
down and bottom up, and matrix management. In some cases, one
division of the institution may be completely different from
another in respect to its management structure. At this crucial
first step, the question then becomes "what type of structure do
we need for our company?".
For the thrift industry the answer has been dictated to the
institution through regulation. The structure needed is the one

10
that best motivates efficient retail banking production through
the established branch network. It becomes imperative that each
institution consistently and accurately measure the performance
of each branch as a decentralized independent unit (Faletti and
Harty, 1989).
In the past, such measurement has typically consisted of
three generic branch goals: 1) performance of expense control as
it relates to a predetermined and focused budget, 2) performance
of deposit intake ability and, 3) performance as it relates to
the quality and quantity of loan business generated. On the
surface, this seems to be an adequate form of measurement for a
retail branch or a unit of branches. These three items seem to
summarize the role of the retail branch within the organization.
The problem with all three measurements is that their
contribution to profitability is usually not specifically or
correctly defined. For example, most branch expense budgets
contain such items as "equipment depreciation" or "equipment
repair and service". To be effective, expense control must
involve more than a budget. A system for costing and cost
allocation must be used in measuring expense (Dallas-Feeney,
1989) •

11
Production goals can be effective but are usually reduced to
"more is better." Different products vary significantly in
servic~ costs, fee income, and interest rate risk.
Some institutions use spread pricing models to measure
production. Spread pricing models attempt to measure the average
asset cost against the average loan yield and give the branch its
true margin on those funds. Most branches, however, directly
lend out less than twenty percent of their total deposits. What
credit, if any, does the branch receive for its excess deposits?
This question as well as the expense and budget questions
raised earlier point to the main issue of analyzing branch
profitability. It is a question of transfer pricing, i.e. the
role of the branch within the organization and how profits and
costs are allocated on a regular basis. It can be seen that the
previous methodology merely raises more questions than it
answers. Given that an efficient and profitable branch system is
imperative to the long run survival of the organization, the
first step is to define in detail all of the components that
could possibly be considered in evaluating branch performance.
12
REFERENCES
Section I
Bedwell, Don. "How Regionals Rack Up Rosy ROEs." Bankers
Monthly, December 1986, pp. 31-32.
Dallas-Feeney, Christopher P. "Improve Your Management
Accounting System." Profitable Banker, August 1989, pp.
7-8.
Falletti, Peter F., and Maureen E. Hartz. "Management Accounting
Reports Aren't for Management Only." Directors Digest,
December 1989, pp. 6-9.
Gopalan, Rams., et al. "Profit Centers Provide Incentive for
Managers to Achieve Profitability." Marketfacts, Vol. 7,
April 1988, pp. 20-23.
"How to Measure Your Bank's Performance." ABA Banking
Journal, April 1985, p. 24.
Middaugh, J. Kendall II. "Management Control in the Financial
Services Industry." Business Horizons, May-June 1988, pp.
79-86.

13
Rao,Ramesh K. S. Financial Management. New York: McMillan
Publishing Company, 1987.
"Statement of Financial Accounting Standards No. 91. 11 Financial
Accounting Series, December 1988.

14
SECTION II
PERFORMANCE MEASUREMENT IN RETAIL BANKING
ORGANIZATIONAL STRUCTURE OF A THRIFT
A typical thrift is divided into three or four very distinct
divisions. These include: (1) a real estate investment division,
(2) a subsidiary group of related entities, and, (3) a retail
banking division. Some thrifts will also run a.separate mortgage
banking division.
(1) The real estate division .is usually responsible for
joint venture development of all types of real estate, from
single family residential neighborhoods to large commercial
retail and office centers. This division may also include income
property lendipg as well as construction and permanent mortgage
lending. Under the new legislation(FIRREA), all joint venture
activity must be divested and the amount of lending done on
nonresidential property has been severely restricted. .No more
than four hundred percent of capital can be loaned out in
commercial real estate. This equates to·approximately .ten
percent of assets for a typical thrift~
(2) The subsidiary group includes. all sorts of small,

15
~ertically integrated companies such as leasing corporations and
title insurance companies. These subsidiaries are usually not a
jrain on the capital of the parent institution and are typically
managed independently. Subsidiary companies have also been
eliminated under FIRREA unless the subsidiary is separately
::::apitalized and conducts business at "arms length".
(3) The retail banking division consists of a branch network
~esponsible for the majority of funds inflow and all consumer
lending. In addition, there also may be a wholesale funds group
to facilitate balance sheet management. Most of the back office
functions at a thrift revolve around supporting the retail branch
network and residential mortgage lending.
RETAIL BANKING PERFORMANCE
Under the new regulatory environment, a majority of the
income must be made by and through the retail branch network.
The responsibility of the branch must change within the corporate
structure if the institution wants to survive in the new
environment. The purpose of this paper is to develop a means
of accurately assessing the profitability of each branch within a
retail network. It is imperative for management to communicate
the expectation of profit for each branch in the system. Losers
must be identified early and eliminated.

,----------------------------
16
But when is a branch considered a loser? The performance:· of
a branch can vary drastically depending upon the methods used for_
costing funds or allocating overhead. In a thrift, the size of
the infrastructure and the number of ancillary products and
services that cross divisional lines make.the method'of
determining profit a very difficult problem.
To overcome this problem, management must determine several
key assumptions before developing a branch profit model. First,
the purpose of the profit model must be well defined. Purpose
will help determine the degree of accuracy needed, as well as,
the basic guidelines for associating costs and reventies,with the
branches. The purposes are: 1) to create a usable scheme that
accurately reflects the true contribution.of each branch and 2)
to create a motivational tool for production and efficiency of
operation.
The second assumption is that the simplest model' is the best
~odel. It is important for the model to be easily understood by
:he branch staff. Understanding will speed:acceptance.
The third decision involves the cost of information. For
many industries, cost and revenue information,_ can be easily :
:traced to finite sources. Unit contribution margins -for each
Product are usually straight forward with resp_ect to revenues and I

17
direct, variable costs. This is not the case for most financial
service companies. Information on individual product margins can
be difficult and costly to specifically define. Management must
decide upon an acceptable level of information and accuracy given
the cost of information restraint.
The last assumption is that the measurement of branch
performance must have a consistent theoretical base. No
measurement model will be useful unless it is based upon accepted
standards that correctly and consistently shows accurate results.
RESPONSIBILITY ACCOUNTING AS THE SYSTEM OF MEASUREMENT
To follow these assumptions, the profit measurement should
utilize responsibility accounting. Responsibility accounting is
a system that measures the plans and actions of each
responsibility center in the organization (Horngren and Foster,
1987). Typically there are four major types of responsibility
centers. They are: (1) cost center; accountable for costs only,
(2) revenue center; accountable for revenues only, (3) profit
center; accountable for costs and revenues, and (4)investment
center; accountable for costs, revenues, and investments.
Ideally this system traces costs and revenues generated to the
individual at the lowest level of the organization which handles
the primary day-to-day decision responsibility for the items.

18
Under the responsibility method, each branch within the
retail network would be identified as a profit center. This is
appropriate since under the new regulations, the role of a
typical thrift branch has been drastically changed. The old role
was simply to be a majority provider of funds for the
institution. The new role is to be not only the provider of
funds, but also the provider of assets. A typical description of
branch responsibility submitted to the Office of Thrift
Regulation would mention, "delivery of many varied financial
products and services to a described market area". It would also
contain phrases such as, "meeting established profitability
goals", or "productivity goals of deposit and loan products". In
other words, the role of the branch is to take in as many
deposits as possible and to lend out as much money as possible in
an efficient manner.
This can best be accomplished by building a measurement
model based upon the responsibility accounting concept of the
profit center. In a profit center, the manager is responsible
for both costs and revenues. Since branches will be under added
pressure to generate loan volume (revenue), the accountability of
both cost and revenue is crucial. In addition, the profit center
concept can be employed in a simple and straight forward manner.
This makes it cost efficient, and easy to understand.

19
ESTABLISHING THE PROFIT CENTER CONCEPT
To establish the profit center concept, it is necessary to
identify all sources of income and expense that could possibly be
attributed to a branch and, then, logically define a method for
determining which are appropriate. A branch profit model must
define: 1) the sources and uses of funds, 2) the costs and yields
and, 3) a method of "fairly" pricing excess funds. Some
additional issues that need to be contended with are: (1) reserve
requirements, (2) regulatory allocations of funds, (3) amount of
credit given for excess funds, (4) method of expense allocation,
(5) credit for "foreign transactions", and 6) federal insurance
premiums. These issues can and should be addressed one at a time
as the profitability model is built.
There are other functions that are a crucial part of branch
activity that are not production oriented. These include: audit
reporting, control requirements, and security and safety
requirements. However, these are secondary responsibilities,
since they are merely offshoots of the production function.
Deciding which activities to include in a branch
profitability model requires a consistent and theoretically
correct approach to the defining costs and revenues. The
contribution approach will be used to define the profitability of
each branch because, "The contribution approach to cost

20
allocation ••• attempts to respond simultaneously to the purposes
of economic decisions and motivation" (Horngren and Foster,
1987). This method matches the original purposes of the model.
Under this method, costs are not allocated unless they are
clearly traceable to the branch network.
The problem occurs when making the distinction between
controllable and uncontrollable costs. Controllability is the
degree of influence that a specific manager has over the costs or
revenues in question (Horngren and Foster, 1987).
Ideally, the system will omit uncontrollable costs from the
determination of contribution. Unfortunately, controllability is
difficult to pinpoint because few costs and revenues are clearly
under the sole influence of one manager. As each category of
expense and revenue is reviewed, the distinction must be made
based upon the contribution of that category to the overall
responsibility of the branch.
DEFINING EXPENSES
Thrifts are formed under either a state or a federal
charter. Bank charters are created under a National Charter
termed "Association" (hence N.A. follows the bank name). In any
case, the governing body of the charter requires that the
institution submit an application for approval for each new

21
branch location that it desires to open. The premise of the
application is to prove that there is both sufficient
demographics to support another branch bank in the proposed trade
area and that the branch can show profitability in a "reasonable"
length of time.
The income statement section of the application lists a
series of expenses that can be categorized as: (1) interest
expense (or cost of funds), (2) personnel expenses, (3) occupancy
expenses (4) equipment expense (5) marketing expense, and (6)
miscellaneous expenses. Most institutions use similar
categories. Each expenses must be reviewed using the
contribution approach to see if it should be incorporated into
the branch profit model.
Once expenses and revenues are defined, a "spread pricing"
model can be established to measure the potential profitability
of each branch. A spread pricing model is a method of
establishing income for each branch. It determines the amount of
credit a branch will receive for loans generated and for deposits
not lent. In effect it prices the "spread" between loans and
deposits for the institution.
EXPENSE RECOGNITION
Interest expense is probably the easiest classification

22
because it involves only one item. It is the interest paid on
the deposits a branch takes in over a period of time. This
obviously meets the first criterion of responsibility accounting.
It is directly associated with the production of deposits.
But, is interest expense controlled by the manager?
Different demographics produce different types of deposits which
vary in cost. For example, a branch located in an affluent
neighborhood with a mean household age greater than fifty will
usually have a heavy concentration of certificates of deposits.
Interest expense on certificates is higher than any other deposit
account. The location of the branch can make a difference in the
deposit expense for that branch.
Since the manager does not make the decision of where to
build a branch (or even its physical characteristics and
capacity), there is an argument that the interest expense of each
branch should not be allocated as it occurs but pooled together
and averaged so each branch is assigned the same cost for
deposits. The only variation between branches would be from the
total dollar amount of deposits. The manager is not penalized by
a potentially bad location decision made somewhere else in the
company.

23
The trouble with that argument is that it hides a real
expense that is necessary to judge performance. If a branch only
attracts expensive deposits, the management of the institution
should know this in evaluating the strategic position of that
branch in the corporate system. Also, it is important to track
changing trends as the deposit mix of branches change. A blended
rate does not accomplish this. Thirdly, an argument can be made
that managers do have the ability to control the deposit mix of a
branch. Product knowledge, better service techniques, and cross
product selling have proven to be successful in promoting
products that previously have not been sold in certain
demographic areas. Therefore, the cost of funds expense should
be accounted for as actually incurred.
While the argument for a pooled rate may seem a bit unusual,
it does illustrate the point that the issues of responsibility
and controllability can be difficult. When building a
profitability model it is necessary to keep the big picture in
mind as the distinction between controllable and uncontrollable
items is made. It is important to remember the overall goals of
the model as decisions of cost and revenue assignments are made.
The next category of expense is personnel costs. These
expenses typically involve all costs associated with labor in the

24
branch. They include benefits and perquisites, such as,
providing food services and education benefits. Most of the
individual expense accounts in this category are easily tracked
to a particular branch of origin. They are definitely controlled
by the manager of the branch because the term "manager" refers to
the responsibility of managing the people of the branch. In
almost all cases, the responsibility is matched by the authority.
Therefore, all cost associated with the personnel of a branch
should be included in the expense of that branch.
The remainder of the expense categories cannot be traced to
the branch in such a direct manner. Occupancy expense is a broad
category that usually includes both real and intangible expenses
associated with the physical location. It includes such items
as rents, maintenance, taxes, utilities, and depreciation. While
it may be obvious that such expenses are necessary for the
production effort, the question of control of these expenses is a
bit more difficult. However, these expenses are necessary to the
daily operation of the branch and should be included as expenses
for the branch. It is important for managers to be aware of the
wide range of costs incurred in operating a branch.
The same logic should also apply to the category of
equipment expense. All items listed are used in the daily
production effort which is the responsibility of the branch to
25
the corporation. Therefore, these items should be expensed
against the branch.
The last two categories of expenses are discretionary in
nature rather than committed. Discretionary costs are costs
arising from periodic or budget appropriation decisions that
directly reflect executive management decisions (Horngren and
Foster, 1987).
Marketing costs can be specific or general in nature
depending upon the purpose. Image advertising for the company as
a whole may or may not have a specific benefit to branch
production. The contribution approach says that if the costs are
not clearly traceable to a particular segment, they should not be
generally allocated. Because of the difficulty in tracing them,
and because the decision for marketing expense is made by
executive management, these costs should not be allocated to the
branch network.
Miscellaneous expenses should be reviewed to determine
which ones are directly associated with production in the branch.
Any expenses previously allocated from other divisions should be
eliminated. Any expenses that cannot be directly traced should

26
Some costs are associated with a particular branch product,
but are not generated by a branch. This creates a problem. The
Automatic Teller Machine(ATM) cards are a prime example. The
cards are sold at the branch level as an added benefit for
checking accounts.
time they are used.
The cards, however, generate an expense each
This expense is not traced by the origin of
the card. Typically, all card expenses are grouped by machine
and summed together. The total is then allocated back to the
branches on a percentage of machine use basis. Those branches
without a machine are not responsible for any expense even though
they give cards to their customers. The costs are tracked this
way because the expense of tracing each transaction cost to a
particular card would be prohibitive.
This is a prime case where management must follow the
contribution assumption and not allocate any of the cost. It is
not clearly traceable to a finite source. This assumption may
seem to distort the accuracy of the profit model, but in reality,
any significant costs are usually traceable. Any costs that are
not traceable are usually that way because they are so
insignificant it is not cost efficient to attempt to track them.
If top management finds a significant cost that is not traceable,
they should take a hard look at whether or not it is allocated to
the branch network. If it is, a fair method of allocation should
27
be used so managers "buy in" to the expense as part of their
operation.
Deciding which expenses to include in the branch model may
appear difficult, but it is not impossible. It should be done
with two basic thoughts in mind; the ultimate goal of the model,
and the cost benefit analysis of information. With these
assumptions, and the contribution approach in mind, the task can
be accomplished.
REVENUE RECOGNITION
The same contribution approach should be used to review
sources of branch revenue. While the income of a branch seems to
be direct and straight forward, the allocation of "excess funds"
is the major determining factor of branch profitability. Excess
funds are deposits attributed to a branch that are not lent back
out directly by that branch. In other words, excess funds are
net deposits minus net loans on a branch by branch basis.
These funds are given to other lending groups in the
company. The profit made between the cost of those funds and the
return on the different loan portfolio is called the "corporate
margin." There are many ways to handle the margin allocation and
each one has a different effect on the branch profit.

28
Most institutions use a "pooled" rate of return and credit
this against the cost of the excess deposits. The pooled rate is
the composite rate of all the other lending areas. In most
cases, the earnings rate applied to excess deposits is between
one and two and a half percent above the cost.
Under the contribution method, interest income and interest
expense should be recorded on an all inclusive basis. Total
interest margin must be allocated to those segments where
interest income is generated. Since the branch network is
usually responsible for less than 30% of the total loan
portfolio, the net margin is split among several different
lending groups. The question is how to assign the margin between
these divisions.
Because other loan departments do not generate their own
funds, they must "buy" their money from the branch network. The
"price" of these funds can be determined in several ways. It is
simply an issue of transfer pricing between two divisions of the
organization. The branch network is the seller and the other
loan divisions are the buyers. Management has the choice of
several basic methods: 1) cost based pricing, 2) arbitrated
pricing, 3) dual pricing, and 4) competitive pricing. Standard
29
cost accounting states that the best potential method should be
based upon the ability of the buyer and the seller to market
their "product" outside of the company.
Unfortunately, the decision is not this simple. In the
financial services industry, it is difficult to say whether a
buyer or seller of money could do their business outside of the
company. The user of funds in a financial institution really has
only two choices for sources of funds. The first is, obviously,.
the branch network. The second is from borrowed funds or
wholesale operations.
Borrowed and wholesale funds are usually short term in
nature and more expensive than branch deposits. Typically they
would only be used to match against a short term loan portfolio
such as single family construction lending. Because of their
high interest rate and short term maturity, these funds are used
only when the resource of branch funds has been exhausted or when
funds are needed for a very short period of time. Therefore,
these funds cannot be considered a viable alternate source for
the loan departments. This leaves the retail branch network as
the one true source of funds.
The branch network, on the other hand, has several buyers of
funds including themselves. The branches are open to a

30
marketplace while the lending groups are not. The solution to
the pricing of funds should be dual pricing. Dual pricing uses
two separate transfer pricing methods to price each
interdepartmental transaction (Hermanson et al, 1980). It is
obviously an arbitrary number set by management. Management
should, however, remember the purposes of the model and utilize
the contribution approach to decide what the price paid for
funds.
The purpose of the model is to motivate the branch to peak
production. Selling excess funds is not as efficient as lending
them out at the branch level. It is certainly not peak
production. The transfer pricing method should encourage more
loan production at the branch level. This produces economies of
scale and expands consumer relationships.
Since the method of pricing is somewhat arbitrary to begin
with, it should be used to encourage compliance with the
strategic plan of the company. This can be done without a
drastic affect on the accuracy of the model. One general rule
should be observed in establishing the selling price. Funds
should never be sold below their costs. This might discourage
a manager from aggressively seeking new deposit business.

31
for loans generated in the branch than for funds sold to other
divisions. This can be accomplished by establishing a price for
sold funds that is between the costs of those funds and the
average rate of return for loans in the branch. If the credit
for excess funds is barely above their cost, then the more
incentive a manager has to produce branch loans.
The typical gross ROA on a corporate loan portfolio is four
percent. This translates to a four hundred basis point spread
above the average cost of funds. Zero percent is the point where
loan yield equals the cost of the deposits. Because branch loan
production is so important and competition for consumer loans is
fierce, the rate paid on excess funds should be tiered based upon
the percentage of deposits lent out.
The more deposits a manager lends back out in loans, the
more credit is given for excess funds. This structure encourages
managers to lend aggressively up to the point where it becomes
less prudent to continue to lend. That point is defined by the
federal reserve requirements. Each branch must keep part of the
deposit base liquid. The law requires twenty percent reserve for
all liquid deposits and six percent for all others.
Each branch has its own distinct reserve requirement based
upon its deposit mix. The contribution method defines reserve

32
requirements as a traceable item and, therefore, one to account
for in the profit structure. The tiered credit system should
encourage aggressive lending up to the needed reserve amount. At
that point, the credit for excess funds should begin to exceed
the potential yield on any branch loan. This still encourages
deposit intake but discourages lending beyond required reserves.
This creates a reasonable and feasible method of income
recognition for the major revenue category, credit for excess
funds. In reality, most branches would never have a loan
portfolio large enough to achieve that point.
All other sources of income are fee related and should be
easily traced to the branch of origin. These include both
deposit account fees and loan fees. In addition, some ancillary
product fees may be shown as branch revenue. This would include
for example: credit card fees, safety deposit box fees, and
travelers check fees.
The last issue that needs to be addressed with regard to the
model is the cost of "foreign" transactions. A branch
transaction is considered foreign if the branch that originated
the account does not service transactions on that account. The
branch that services the account spends their labor hours while
the originating branch gets credit for the deposit balance.

33
There are really only two feasible ways to handle this
dilemma. The first way would involve tracking transactions by
branch to see which ones are foreign. Then, a method of
charging-back the service costs to the originating branch would
be developed. The second way is to assume that a lot of foreign
transactions occur within the system every day and that they
probably come close to equating over time. This should be the
preference, since the costs and time of tracking the transactions
would be large.
REFERENCES
Section II
Hermanson, Roger H., et al. Accounting Principles. Texas:
Business publications, Inc., 1980.
Horgren, Charles T., and George Foster. Cost Accounting.
New Jersey: Prentice-Hall, Inc., 1987.
34
SECTION III
A BRANCH PERFORMANCE MODEL
Once the appropriate income and expense categories have been
defined, the actual branch profit model can be set up on computer
spreadsheet software. The format of the spreadsheet should be
based upon the same assumptions as the model. Therefore, the
inputs of the model should be well defined categories
of revenues and expenses, and the output should be easily
understood by branch managers.
Because managers are accustomed to analyzing income
statements for loan requests, the model should be designed in
income statement form. The model output should show actual
revenue, expense, and profit data on a month by month basis. It
is also possible to design the model to compare actual monthly
results against predicted goals on a monthly basis.
The model utilizes established spreadsheet format. The
spreadsheet is divided into two distinct sections for data input

35
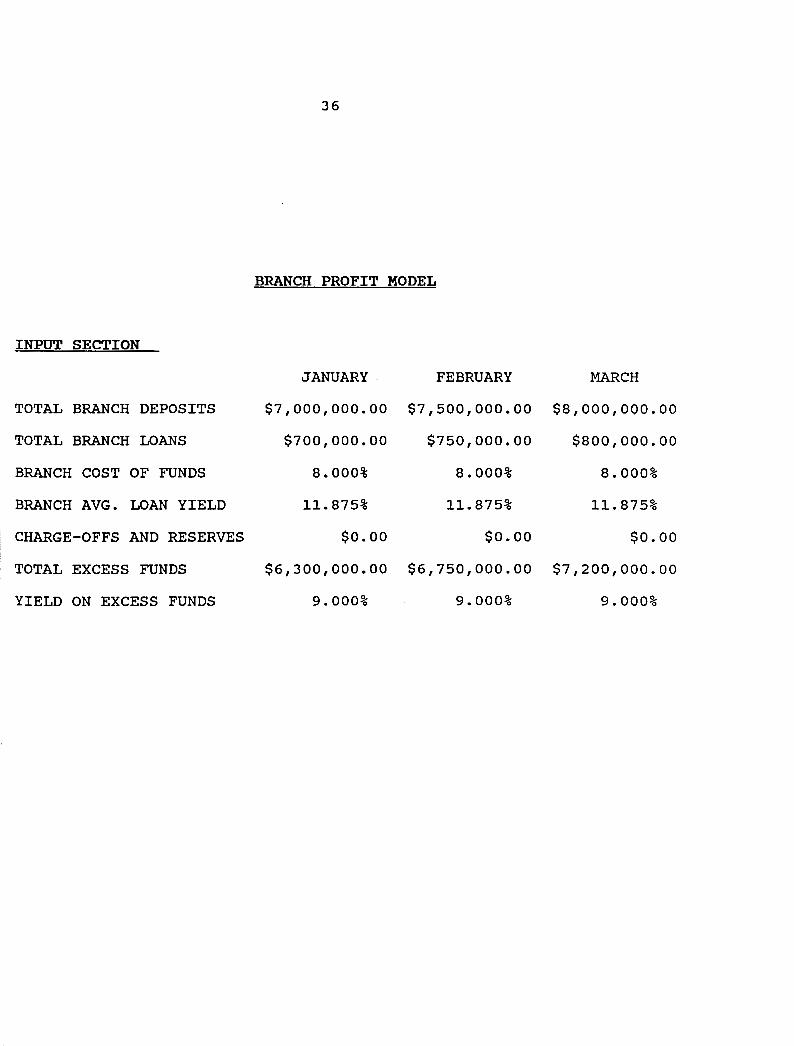
and results output. The data input section lists the major
determinants of branch income and expense in column form in the
top left corner. The calendar months are labeled across the top
for each category. This allows easier input of data, as well as,
a year to date approach to the measurement of profit.
The second section of the model performs the actual
calculations for income and expense and lists the resulting
output by category. The model is extremely flexible, since the
major category calculations are done using cell references and
not absolute numbers. Less significant determinants, such
as direct expenses and fee income, are manual inputs since these
categories are independent of any other references. Total
expenses are subtracted from total revenue to form the monthly
branch profit (or loss). The monthly profit output is then
summed for a year to date figure. All figures are as of the
current month end. An example of the model and an explanation of
the cell labels and references follows.
36
BRANCH PROFIT MODEL
INPUT SECTION
JANUARY FEBRUARY MARCH
TOTAL BRANCH DEPOSITS $7,000,000.00 $7,500,000.00 $8,000,0QO.OO
TOTAL BRANCH LOANS $700,000.00 $750,000.00 $800,000.00
BRANCH COST OF FUNDS 8.000% 8.000% 8.000%
BRANCH AVG. LOAN YIELD 11. 875% 11. 875% 11.875%
CHARGE-OFFS AND RESERVES $0.00 $0.00 $0.00
TOTAL EXCESS FUNDS $6,300,000.00 $6,750,000.00 $7,200,000.00
YIELD ON EXCESS FUNDS 9.000% 9.000% 9.000%
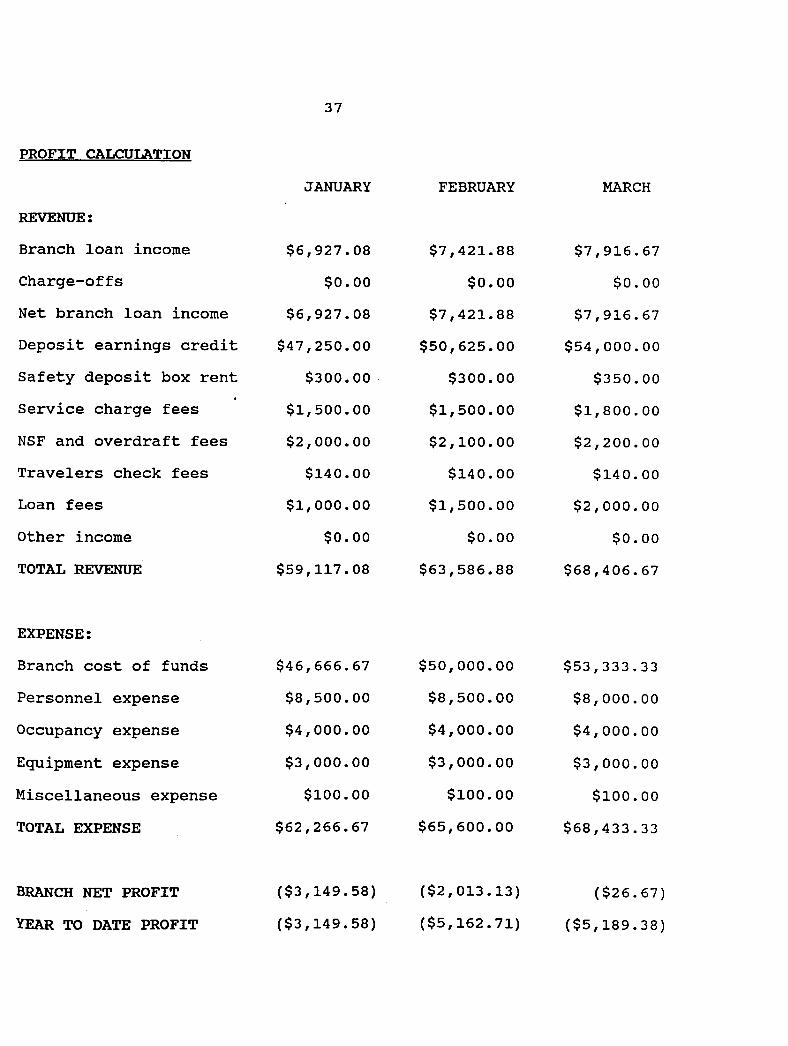
PROFIT CALCULATION
REVENUE:
Branch loan income
Charge-offs
Net branch loan income
Deposit earnings credit
Safety deposit box rent
Service charge fees
NSF and overdraft fees
Travelers check fees
Loan fees
Other income
TOTAL REVENUE
EXPENSE:
Branch cost of funds
Personnel expense
Occupancy expense
Equipment expense
Miscellaneous expense
TOTAL EXPENSE
BRANCH NET PROFIT
YEAR TO DATE PROFIT
37
JANUARY
$6,927.08
$0.00
$6,927.08
$47,250.00
$300.00
$1,500.00
$2,000.00
$140.00
$1,000.00
$0.00
$59,117.08
$46,666.67
$8,500.00
$4,000.00
$3,000.00
$100.00
$62,266.67
($3,149.58)
($3,149.58)
FEBRUARY
$7,421.88
$0.00
$7,421.88
$50,625.00
$300.00
$1,500.00
$2,100.00
$140.00
$1,500.00
$0.00
$63,586.88
$50,000.00
$8,500.00
$4,000.00
$3,000.00
$100.00
$65,600.00
($2,013.13)
($5,162.71)
MARCH
$7,916.67
$0.00
$7,916.67
$54,000.00
$350.00
$1,800.00
$2,200.00
$140.00
$2,000.00
$0.00
$68,406.67
$53,333.33
$8,000.00
$4,000.00
$3,000.00
$100.00
$68,433.33
($26.67)
($5,189.38)

38
TOTAL BRANCH DEPOSITS
This cell contains the actual total dollar deposit amount of
the branch at the current month end.
TOTAL BRANCH LOANS
Total branch loans is the actual dollar loan amount
outstanding for the branch as of the current month end.
BRANCH COST OF FUNDS
Branch cost of funds is calculated by taking the weighted
average interest rate of all the deposit products of the
individual branch.
BRANCH AVERAGE LOAN YIELD
Branch average loan yield is the weighted average yield of
each loan category in the individual branch portfolio.
CHARGE-OFFS AND RESERVES
This category refers to any branch loan amount that has been
classified as a non-performing asset. A loan is non-performing
When the normal payment is delinquent by more than 90 days and
it is doubtful that the principal balance of the loan will be

39
recovered. This balance is entered into the cell to be
subtracted from branch loan income. In addition, some loans
require that a specific reserve be set aside because they have
been assessed as a potential loss. Any specific reserve amount
must also be input in this field to be subtracted from the branch
loan income.
A negative entry in this cell refers to a loan recovery.
Periodically a loan that was previously charged-off can be
will be repaid in part or in full through collection efforts.
Any dollar amount that is recovered should be credited back to
the branch as loan income. A negative charge-off accomplishes
this.
TOTAL EXCESS FUNDS
Total excess funds is simply total branch deposit dollars
minus the total branch loan amount. This is the amount that can
be ''sold" to other loan divisions within the thrift.
YIELD ON EXCESS FUNDS
The interest rate yield assigned to the branch for
"selling" its excess funds to other lending areas is the yield on
excess funds. Based upon the assumptions used to develop the
model this yield will be 100 basis points above the branch
deposit cost.

40
PROFIT CALCULATION
In this section, the cell references from the input section
are used to calculate the following: branch loan income,
charge-offs, net branch loan income, deposit earnings credit, and
branch cost of funds. Input cells for other fee and expense
categories are also contained in this section. Finally, totals
for the revenue, expense, and profit figures are calculated.
This section is designed as a simple income statement so that the
flow of the information is easy to follow.
The model is designed to allow additions to the revenue and
expense categories. Management can decide how simple or
complicated the final output should be. However, if too many
changes are incorporated the model may lose validity.
SAMPLE MODEL RESULTS
The sample numbers used in the model came from a typical
thrift branch open for a one year period (Sheshunoff, 1989). The
results show a distinct logical relationship between the input
factors and the output totals. Since branch profit measurement
is relatively new, there is not a lot of historical data to
verify the findings of the model. There are however, several
facts that indicate the relationships within the model and the
final outputs are accurate and useful.

41
The validity of the model is substantiated by several
industry statistics. Statistics from the Federal Deposit
Insurance Corporation show the breakeven point for a typical
thrift branch should occur where total deposits are approximately
eight million dollars. The results of the model at that level
concur with the F.D.I.C. findings.
The sample branch numbers also substantiate the validity of
the relationship between loan volume and total profit, using the
responsibility approach. The model shows the importance of
having a good loan to deposit ratio and a good loan yield to cost
of funds ratio. The larger the ratios, the more total profit
increases. This will encourage managers to be sensitive to
pricing issues on both sides of the balance sheet. In addition,
the model shows the results of added fee income and the effect of
expense control to the total profit figure.
The model gives branch managers the opportunity to
understand how even the smallest branch decisions (like waiving
overdraft fees) affect the total monthly profit of the branch.
This information should give focus and direction to the managers
regarding total profitability and efficiency of operation.

42
Executive management can use the output generated by the
model to judge the performance of each branch to decide if the
capital expended is achieving the appropriate return. This is
very important in an industry where capital is desperately needed
for survival. An accurate assessment of contribution from each
branch in the retail network is the key to enforcing the correct
use and return on capital. If the model guidelines for the
contribution approach and responsibility accounting are followed,
then the resulting branch profit numbers should represent an
appropriate measure of the branch contribution to corporate
profitability. "When branches are set up as a profit center,
profitability reports must be used to meet overall organizational
goals" (Mickle, 1985).
REFERENCES
"Report of Income." F.D.I.C., 1973-1982, 1982.
Mickle, Collier E., et al. "Analyzing the Profitability of Branch
Banks." Management Accounting, Vol: 67, December 1985,
pp. 61-65.
Sheshunoff, Alex. The Branches of Virginia. Sheshunoff
Information Services, Inc., 1990

43
SECTION IV
SUMMARY
THE NECESSITY OF A BRANCH PERFORMANCE MODEL
For years thrifts have operated on the premise that the
branch network was simply the source of funds for other key
lending divisions. The passage of FIRREA has put pressure on
thrifts to "go back to basics" and to become profitable from core
operations. A sound and reasonable estimate of branch
profitability has become the key to survival for thrifts in
today's competitive, deregulated environment.
Developing a branch profit model takes time, but the result
is a favorable impact on the strategic position of the
institution. Thrifts must be concerned with overall branch
performance and the ability to set attainable goals. A good
estimate of revenues and expenses at the micro level helps
provide better information, and focus, to improve daily decisions
that have long term effects on corporate profitability.
44
Unfortunately, historical measurements of thrift performance
do not translate to the branch level. ROA and ROE fail in the
attempt to create an accurate and timely measurement of branch
profitability. Budgets can be useful under some circumstances,
but again fail to communicate true branch profitability. The key
to measuring branch performance is the development of a system to
track individual branch revenues and expenses.
Numerous software packages exist in the market that claim to
provide profitability analysis. However, a majority of these
packages are more concerned with the macro level. The profit
measurement systems at the business unit level contain
standardized numbers for allocating direct transaction fees.
They also recommend the allocation of corporate overhead to each
branch or business unit.
This type of profit measurement ignores the true importance
of the branch focus. The first objective of a branch
profitability model is to build branch efficiency by having an
accurate assessment of regular performance. Standardized costs
and overhead allocation distort the true performance measurement
of the branch. Corporate overhead should be judged as a separate
cost issue. strategically sound decisions require that executive
management know the contribution of each branch as an independent
Profit center.

45
The second objective is to motivate the branch staff to
perform at the highest level. Accountability is the key to
motivation. If managers are not held accountable for the
decisions they make, then the system lacks incentive.
Accountability can not happen without a reliable measure of
performance. Only when performance is measured with a well
defined and accurate system is there a basis for a goal oriented
culture. A branch profitability model provides this measurement.
WHY THE RESPONSIBILITY MODEL WORKS
The model developed in this paper provides the information
necessary to accurately measure individual branch profitability.
The profit center concept developed under the responsibility
accounting method matches the new role of the thrift branch as a
provider of revenue, and not simply cost. The model addresses
the cost accounting issues that other models have ignored in the
past. Using the contribution approach to define revenues and
costs, the model develops a standard for branch profit that is
theoretically sound.
In addition, the format of the model makes it simple to
use and easy to interpret. The model combines normal budget
cost measurements with goal performance issues to create a more
inclusive measurement of performance than other models have

46
accomplished. A thrift that uses this model will have a
strategic competitive advantage over other financial institutions
that do not have an accurate picture of retail branch
performance.
The responsibility model encourages branch managers to exert
control over the factors that influence branch performance. The
model is also a superior training mechanism for managers because
it gives them a clear understanding of the thrift's financial
criteria, how they affect profitability, and how more efficiency
can be generated.
The future for the thrift industry lies in the ability to
create sound income from basic branch operations. A system to
measure individual branch performance is the first step towards
this goal. Once a system is in place to measure branch
performance, then management can move towards more accurate
product performance measurements. This added direction to the
strategic planning process will help management establish
priorities for resource allocation. Perhaps then thrifts will
begin to recognize the importance of knowing product and
transaction cost when making strategic corporate decisions. The
model developed in this paper is the base for such a system of
information. Responsibility accounting reinforces the profit
center concept and promotes greater efficiencies throughout.

47
This increased efficiency will enable thrifts to create a profit
from core branch operations which will sustain the capital needed
for long term viability.

48
APPENDIX A
Formulas for the spreadsheet model calculations (Enable 2.0 Integrated Software Program)

APPENDIX A
BS: +B3-B4 Bl3: +B4*B6/12 Bl4: +B7 BlS: +Bl3-Bl4 Bl7: +BS*B9/12 B24: @sum{Bl5 .• B23) B27: +B3*B5/12 B32: @sum{B27 •• B31) B34: +B24-B32 B36: +B34 CS: +C3-C4 Cl3: +C4*C6/12 C14: +C7 ClS: +Cl3-Cl4 Cl7: +CS*C9/12 C24: @sum{Cl5 .• C23) C27: +C3*C5/12 C32: @sum{C27 •. C31) C34: +C24-C32 C36: +B36+C34 08: +03-04 013: +04*06/12 014: +07 015: +013-014 017: +08*09/12 024: @sum{DlS .. 023) 027: +03*05/12 032: @sum{D27 •• D31) 034: +024-032 036: +C36+034 ES: +E3-E4 E13: +E4*E6/12 E14: +E7 ElS: +El3-El4 E17: +ES*E9/12 E24: @sum{E15 •• E23) E27: +E3*E5/12 E32: @sum(E27 •• E31) E34: +E24-E32 E36: +D36+E34 FB: +F3-F4 Fl3: +F4*F6/12
49

APPENDIX A
Fl4: +F7 Fl5: +Fl3-Fl4 Fl7: +FS*F9/12 F24: @sum(Fl5 •• F23) F27: +F3*F5/12 F32: @sum(F27 •• F31) F34: +F24-F32 F36: +E36+F34 GS: +G3-G4 Gl3: +G4*G6/12 Gl4: +G7 Gl5: +Gl3-Gl4 Gl7: +G8*G9/12 G24: @sum(Gl5 •• G23) G27: +G3*G5/12 G32: @sum(G27 •• G31) G34: +G24-G32 G36: +F36+G34 HS: +H3-H4 Hl3: +H4*H6/12 Hl4: +H7 Hl5: +Hl3-Hl4 Hl7: +H8*H9/12 H24: @sum(Hl5 .• H23) H27: +H3*H5/12 H32: @sum(H27 .• H31) H34: +H24-H32 H36: +G36+H34 18: +I3-I4 113: +I4*I6/12 114: +I7 115: +Il3-Il4 117: +I8*I9/12 124: @sum(I15 •• I23) I27: +I3*I5/12 I32: @sum(I27 •• I31) I34: +I24-I32 I36: +H36+I34 JS: +J3-J4 Jl3: +J4*J6/12 J14: +J7 Jl5: +Jl3-J14
50

APPENDIX A
J17: +JS*J9/12 J24: @sum(J15 •• J23) J27: +JJ*JS/12 J32: @sum(J27 •• J31) J34: +J24-J32 J36: +I36+J34 KS: +K3-K4 Kl3: +K4*K6/12 Kl4: +K7 KlS: +Kl3-K14 Kl7: +KS*K9/12 K24: @sum(Kl5 •• K23) K27: +KJ*KS/12 K32: @sum(K27 •• K31) K34: +K24-K32 K36: +J36+K34 LS: +L3-L4 LlJ: +L4*L6/12 Ll4: +L7 LlS: +Ll3-Ll4 Ll7: +L8*L9/12 L24: @sum(Ll5 •• L23) L27: +LJ*LS/12 L32: @sum(L27 •• L31) L34: +L24-L32 L36: +K36+L34 MS: +M3-M4 Ml3: +M4*M6/12 Ml4: +M7 MlS: +Ml3-Ml4 Ml7: +M8*M9/12 M24: @sum(Ml5 •• M23) M27: +MJ*MS/12 M32: @sum(M27 •• M31) M34: +M24-M32 M36: +L36+M34
51

52
APPENDIX B
state of Virginia Application to Establish a Thrift Branch

------------------ --------------------------- ------1
CCB-1125(Rev.~/37)ZC 53
APPLICATJOH TO ESTABLISH A BRANCH
APPENDIX B
INFORKATJON ANO INSTRUCTIONS
This application form has ~een designed to elicit the minimum information reQuired by the Bureau of Financial Institutions for the purpose of determining whether 1 particular applicant ought to be grantee I certificate of authority to establish 1 branch office. However. it is the applicant's responsibility to furnish additional infonnation to derronstrate that such authorization will be in the public interest as defined in §6.l-13 of the Code of Virginia. If the space allotted is insufficient. a separate page should be used. Additional infonTBtion and docunents must be submitted on~· X it• paper.
A check for Sl 0 S00 0 :>1yable to the Treasurer of Virginia, must accompany the application. Copies, of the following docunents. as well as the application. must be filed in duplicate.
1. An executed lease or letter of intent from owner(s) of property to be leased. or executed: purchase agreeirent.
2. A scaled map showing the proposed trade area and the locations of ffoancial fostitutions· having trade areas which overlap the applicant's proposed trade area.
3. A detailed current balance sheet. itemizing investnents in land. buildings. leasehold improvet1ents, furniture, fixtures, and equip1Tent 0 and Other fiaed assets.
Once the application and acc~panying docul!l!nts are received by the Bureau. they will be reviewec. Only when it is aetennined that they have been completed satisfactorily. will the Bureau conduct its investigation. Therefore full and complete answers are required.
All docul11:!nts filed will becCJ!le 1 p~r.1 of the public record unless the 1pp1icant makes 1 .,ritte., reQuest for confidential treatl!l!nt of some particular docu!l'Ent or ~nformation. final determination as :o' the confidentiality of such information will rest with the C~issioner of financial Institutions.
lnc;uides concerning the preparnion 1nd filing of this application snould be directed to :he'
Division of Research and Structure, Bureau of Financial lnstHutions, Post Office Box 2A[, Richmond, Virginia, 23205. (Telephone: (804) 786-3657]
The undersigned certifies that he believes the facts contained ;n this aoplication and 111 1ccompanying schedules and stateorrents are true ind that he has been duly authorized to file this 1pplicat1on.
Harre Signature
Address Tit le
Date

CCB-1125(Rev.6/87)2C
Bureau of financial Institutions State Corporation Cosmission Post Office lo1 2AE Rictmx:>nd 0 Virgini& 23205
NAME OF APPLICANT INSTITUTION
HAILING ADDRESS
54
APPllCATIOH FOR A CERTIFICATE OF AUllOUTY TO £STABLISH AHO OPERATE A BRAHCH
I. GENERAL INFOR.KA TJOfC
NAME OF AFFILIATED COMPANY, IF ANY
FILE JN DUPLICATE
DATE IT CD'IMENCED auSINESS
NAME THE COUNTY OR CITY WHERE THE HAIN OFFICE IS LOCATED
PROPOSED BRANCH LOCATION (street. city, or town ano county or otner ident1fic1tion)
NAME OF PROPOSED BRANCH DISTANCE FR~ MAIN OFFICE EXPECTED OPENING CATE
WILL TH[ CAPliAL OF THE APPLICANT 3E iNCREASEO PRIOR TO THE ESTABLISHMENT OF THE PROPOSED BRANCH?
Yes (if yes explain)
No
Nll"IBER OF BRANCHES THE APPLICANT OPERATES:
1. Opened---- 2. Authorized. unopened----
OFFICIAL FOR RESPONDING TO QUESTIONS RELATING TO THIS APPLICATION (n1111e, aaaress. telepnone numoed
--, !

55
II • OUARTERS PROVIDE INFORMATION WITH RESPECT TO TH[ OUART[RS JN •iHICH THE PROPOSED BRANCH WILL BE LOCATED. INOICAT[ WHETHER THE LANO AND/OR BUILDING WILL BE LEASED OR PURCHASED. INDICATE THE SIZE ANO COST OF LANO ANO BUILDING AND THE COST OF SITE IMPROVEMENTS TO BE BORNE BY THE APPLICANT. SPECIFY All TRANSACTIONS ANO ASSOCIATED COSTS TO BE BORNE BY THE .APPLICANT. INDICATE ANY PLANS TO OPEN IN TEMPORARY QUARTERS, DESCRIBE SUCH QUARTERS AND GIVE ASSOCIATED COSTS.
HAM[ ANO ADDRESS OF SELLER OR LESSOR EXPIRATION DATE or LEASE
IS SELLER OR LESSOR RELATED OR CONNECiEO JN ANY WAY WITH THE APPLICANT?
---- Yes (if yes. explain)
____ Ho
Ill. IHV£STMEHT IH FURNITURE. FlXTUR£S, AH'J E~IPKENT (S b . l ) h0w rst1~ tes >..r_ an a sans •
JT[H NO. OF UNITS TOTAL COST ANNUAL RENTAL
Vault doods)
Safe(s)
Safe deoosit bo1es
Counter and Ca_ie fhtures
Drive-in windows and remote Kiost(s)
N~ht deoosHor1_
Securit_y eouitJment
furniture
Other
TOTAL
56
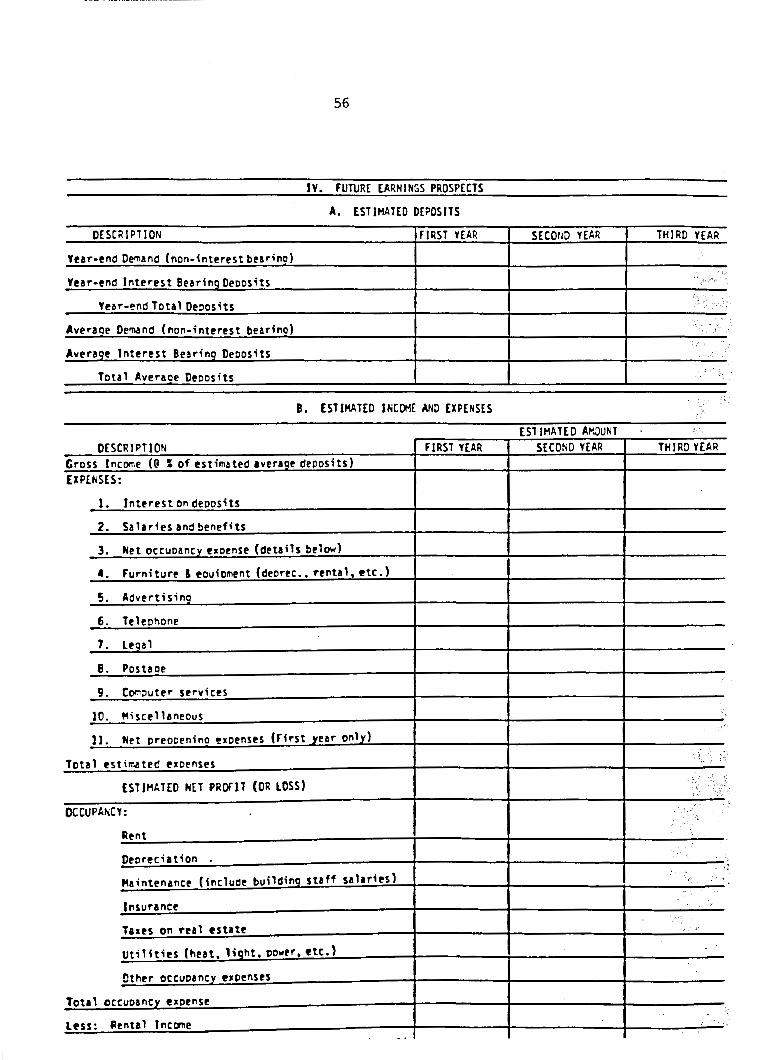
IV. FUTURE EARNINGS PROSPECTS
A. ESTIMATED DEPOSITS
DESCRIPTION FIRST YEAR srcor1n YEAR THIRD YEAR
Year-end Demand (non-interest bearfoc)
Year-end Interest Beari'!.9_0eoosits
Year-end Tota 1 Decos its
AveraEe Demand (non-;nterest bear;nc) '
Avera_g_e Interest Bearing Deoos;ts
Total Averace Deoosits
B. ESTIMATED INCOME AND EXPENSES
ESTIMATED A~~UNT DESCRIPTION FIRST YEAR SECOND YEAR THIRD YEAR
Gross lncorr.e (@ i of est;mated avera_g_e depos;ts) EXPENSES:
1. Interest on deposits
2. Salaries and benefits
3. Net occuoanc_y_exoense (details below)
•• Furniture & eouioment (decree •• rental. etc.)
5. Advert; s; n_g_
6. Telephone
7. Le_g_a1
I!. Postace
9. tom~uter services
10. Mi see 11aneous
ll. Net preooeninc espenses (First 1ear on!l'_)
Total estirMted exoenses
ESTIMATED NET PROFIT (OR LOSS) > ". \
OCCUPANcY: "
Rent
Deorec;ation
Maintenance (include buildi~ staff satar;es l
Insurance " ..
Tues on real .state ~-,
UtiHt;es (heat. Hght. power. etc.)
Other occuoan~ e•oenses
Total occuoanc.1. e•oense
L.ss: flenta 1 lnc(7!1e - - .

57
V. PUBLIC INTEREST A. DEF I NE THE TRADE AREA ANO DESCRIBE ITS ECON()oll C BASE AND DEVELOPMENT, ITS ECON()-11 C ANO DEMOGRAPHIC GROWTH AND POTENTIAL, AND THE LEVEL OF FINANCIAL CG'iPETITION.

58
Y. PUBLIC INTEREST (CONTINUED) I. DISCUSS IHE CHARACTERISTICS or SERVICES OFFERED BY FINANCIAL INSTITUTIONS IN TH[ TRADE AREA ANO SPECIFY HOW THE PROPOSED BRANCH WILL DIFFER OR CCJIPARE IN THE QUANTITY ANO QUALITY OF SERVICES TO BE OFFERED:

59
V. PUBLIC INTEREST LIST ALL TH[ OFFICES or SANKS ANO SAVINGS JNSTllUTJONS WHOSE PRIKARY TRADE AREA OVERLAPS WITH TH[ PRIMARY. TRADE AREA (THE MINIMUM AREA WHERE t()R[ THAN 75.0 PERCENT OF THE DEPOSITS WILL ORIGINATE) OF THE PROPOSED OFFICE. SHOW THE DEPOSITS OF EACH OFFICE JN THE LAST THREE YEARS, SPECIFYING THE DATE.
IN THOUSANDS OF DOLLARS DEPOSITS JN EACH OFFICE
NAME AND LOCATION DISTANCE l DIRECTION _/_Jl9 _/_Jl9 _/_/19
1. Banking Offices .
_/_/19 _/_Jl9 _1_119
2. Savings lnst;tut1on Off;ce
-- l

60
APPENDIX C
The Cole survey Branch Manager Job Description

~COLE 61
BENCHMARK 0 0 0 SURVEYS, INC. A W;-ztt Data Services Company
Position Description
20.5-
POSmONTITLE: BRANCH MANAGER II (LENDING) 418
POSmON NUMBER:
Function: With broad responsibility manages a small branch office and extends credit to businesses and indivXfuals. Oversees the operation of a branch off ice with total loans and deposits between $10 million and $20 mill ion.
Has responsibilities such as:
Note:
-1. Exercising executive and administrative control over the functions of the
office, including implementation of local policy and explanation of company programs, policies, and objectives.
2. Extending credit to businesses and/or individuals through a variety of commercial, instalment, and/or real estate loans.
3. Representing the company in the community and developing and promoting additional business.
4. Attending to the needs of existing and prospective customers, including opening new accounts, certifying checks, and handling customer complaints •
.5. Maintaining prescribed security controls to protect the facility against criminal and fraudulent operations and unnecessary risk or exposure.
6. Exercising the usual authority of a manager concerning staffing, performance appraisals, promotions, salary recommendations, and terminations.
This is a single-incumbent position per branch. Incumbents extend credit to businesses and/or indivXfuals, and may also have some business development responsibilities. The branch size parameters noted above are general guXfelines. Other factors such as branch location, amount of unsecured lending authority, and type and complexity of loans approved should be considered when matching incumbents to this position.
Branch Managers primarily responsible for expanding existing business relationships and developing new business, should be reported as a Branch Manager (Business Development); incumbents who do not extend credit to businesses or indivkiuals, and are not primarily responsible for business development, should be reported as a Branch Manager (Non-Lending).
Commonly reported Cole Levels: 2-3

8'°'coLE 62
BENCHMARK D DD SURVEYS, INC. A Wyatt Data Sm•ices Company .
Position Description
205-POSmONTlll.E:
BRANCH MANAGER IV (LENDING) 416 POSmON NUMBER:
Function: With broad responsibility, manages a large branch offi:e and extends credit to businesses and individuals. Oversees the operation of a branch off .ice with total loans and deposits between $40 million and $75 million, with a full complement of exempt and non-exempt employees.
Has responsibilities such as:
Note:
1. Exercising executive and administrative control over the functions of the off ice, including implementation of local pol.icy and explanation of company programs, policies, and objectives.
2. Extending credit to businesses and/or indiv.iduals through a w.ide variety of commercial, instalment, and/or real estate loans.
3. Representing the company in the community and developing and promoting additional business.
4. Providing platform services for special existing or prospective customers and assisting at times of heavy business.
5. Maintaining prescribed security controls to protect the facility against criminal and fraudulent operations and unnecessary risk or exposure.
6. Exercising the usual authority of a manager concerning staffing, performance appraisals, promotions, salary recommendations, and terminations.
This is a single-incumbent position per branch. Incumbents extend credit to businesses and/or individuals, and may also have business development responsibilities. The branch size parameters noted above are general guidelines. Other factors such as branch location, amount of unsecured lending authority, and type and complexity of loans approved should be considered when matching incumbents to this position.
Branch Managers primarily responsible for expanding existing business relationships and developing new business, should be reported as a Branch Manager (Business Development); incumbents who do not extend credit to businesses or individuals, and are not primarily responsible for business development, should be reported as a Branch Manager (Non-Lending).
Commonly reported Cole Levels: 3-4

~COLE 63
BENCHMARK 000 SURVEYS,INC. A Wyatt Data Snvicrs Company
Position Description
20.5-
POSmONTTil.E: BRANCH MANAGER VI (LENDING) 414
POSmON NUMBER;
Function: With complete responsibility, manages an extremely large branch off ice and extends credit to businesses and individuals. Oversees the operation of a branch office with total loans and deposits of over $1.50 million, with a full complement of exempt and non-exempt employees.
Has responsibilities such as:
Note:
1. Exercising executive and administrative control over the functions of the off ice, including implementation of local policy and explanation of company programs, policies, and objectives.
2. Extending credit to businesses and/or individuals through a w kfe variety of commercial, instalment, and/or real estate loans.
3. Representing the company in the community and developing and promoting additional business.
4. Providing platform services for special existing or prospective customers and assisting at times of heavy business.
.5. Maintaining prescribed security controls to protect the facility against criminal and fraudulent operations and unnecessary risk or exposure.
6. Exercising the usual authority of a manager concerning staffing, performance appraisals, promotions, salary recommendations, and terminations.
This is a single-incumbent position per branch. Incumbents extend credit to businesses and/or indivkfuals, and may also have substantial business· development responsibilities. The branch size parameters noted above are general guidelines. Other factors such as branch location, amount of unsecured lending authority, and type and complexity of loans approved should be considered when matching incumbents to this position.
A number of smaller branches may be under the incumbent's administrative · authority, but their primary responsibility is to manage a branch. Incumbents whose primary responsibility is to manage a group of branches should be reported as a Branch Group Manager.
Branch Managers primarily responsible for expanding existing business relationships and developing new business, should be reported as a Branch Manager (Business Development); incumbents who do not extend credit to businesses or individuals, and are not primarily responsible for business development, should be reported as a Branch Manager (Non-Lending).
Commonly reported Cole Levels: 3-4

64
BIBLIOGRAPHY
Alberts, William. "Pricing a Loan Product Profitably."
Commercial Lending Review, Spring 1988, Volume: 3, pp.
29-43.
Bedoni, Marisa. "Strategies Simulation in an Aggregate Bank
Model." European Journal of Operational Research,
Vol: 30, Winter 1987, pp. 24-29.
Bedwell, Don. "How Regionals Rack Up Rosy ROEs." Bankers
Monthly, December 1986, pp. 31-32.
Clark, Jeffrey. "The Efficient Structure Hypothesis: More
Evidence from Banking." Quarterly Review of Economics
and Business, Vol: 27, Autumn 1987, pp. 25-39.
Dallas-Feeney, Christopher P. "Improve Your Management
Accounting System." Profitable Banker, August 1989,
pp. 7-8.

65
Falletti, Peter F., and Maureen E. Hartz. "Management
Accounting Reports Aren't for Management Only."
Directors Digest, December 1989, pp. 6-9.
Gass, Anthony D. "Translating Profit Goals into Loan Pricing
Targets." Commercial Lending Review, Winter, 1988, pp.
43-55.
Gopalan, Rams., et al. "Profit Centers Provide Incentive
for Managers to Achieve Profitability." Marketfacts,
Vol: 7, April 1988, pp. 20-23.
Hermanson, Roger H., et al. Accounting Principles. Texas:
Business Publications, Inc. 1980.
Horngren, Charles T., and George Foster. Cost Accounting.
New Jersey: Prentice-Hall, Inc. 1987.
"How to Measure Your Bank's Performance." ABA Banking
Journal, April 1985, p. 24.
Mickle, Collier E., et al. "Analyzing the Profit.ability of
Branch Banks." Management Accounting, Vol: 67,
December 1985, pp. 61-65.

66
Middaugh, J. Kendall II. "Management Control in the
Financial Services Industry." Business Horizons,
May-June 1988, pp. 79-86.
Rao, Ramesh K. s. Financial Management. New York:
McMillan Publishing Company, 1987.
"Report of Income." F.D.I.C., 1973-1982, 1982.
Schultz, James P. "A Hi-Tech Approach to Maximizing Branch
Profits." Bank Marketing, June 1988, pp. 18-22.
"Statement of Financial Accounting Standards No. 91. 11
Financial Accounting Series, December 1988.
The Cole survey. Cole surveys, Inc., 1988.


DA'dE. DUE I - - • .. \(it~
" ·- ~ .. -~
_b_t'\.,. ~-UU'1''j..J µ-ovv
~ JQR7,
-~E11 ~1QR7 -,.. ~
~ ... ··~'"l!
Wl-V.L J. \,iVJ
GAYLO"D PfUH1'1lOINU·•·A•