What is the CELDT? California English Language Development Test.

A Research Report on the Development of the Test of
English for Academic Purposes (TEAP) Speaking Test for
Japanese University Entrants – Study 3 & Study 4
Dr. Fumiyo Nakatsuhara
Centre for Research in English Language Learning and Assessment (CRELLA),
University of Bedfordshire, UK
Daniel Joyce and Todd Fouts,
Eiken Foundation of Japan
© 2014 Eiken Foundation of Japan. All rights reserved.

2
Table of Contents
1. Introduction
2. Background to the Studies
2.1 Changes in Stakeholder Needs and Expectations
2.2 Proposed Changes
a. Double Rating Methods and Rating Flow
b. Simplifying the Examiners’ Interlocuting Procedures
3. Research Questions
4. Scope of the Studies and Research Designs: Study 3 and Study 4
5. Results and Discussion: Study 3
5.1 Analytic and Holistic Scores
5.2 Rater and Examiner Feedback on Rating and Test Administration
6. Results and Discussion: Study 4
6.1 Analytic and Holistic Scores
6.2 Examiner Feedback on Rating and Test Administration
7. Conclusion
Acknowledgements
References
Appendix: TEAP Speaking Public Rating Scale

3
1. Introduction
The research report, titled ‘Research Report on the Development of the Test of English for
Academic Purposes (TEAP) Speaking Test for Japanese University Entrants’, described
two initial studies carried out in 2012 (i.e. Studies 1 and 2) that informed the development
and validation of the TEAP Speaking test (Nakatsuhara, 2014). Since those studies, new
stakeholder needs and expectations have emerged that the TEAP project team did not
anticipate during the first phase of the project.
In response to the changes in stakeholder needs and expectations, two follow-up studies
were carried out in 2013 and 2014 (i.e. Studies 3 and 4) to modify test administration
methods without deteriorating the quality of the test. This report presents this follow-up
phase of the project, reporting on:
(a) how optimal solutions were identified to address new needs and expectations of the
TEAP stakeholders, and
(b) how the quality of the test was retained and sometimes even improved after some
modifications were made to the test.
2 Background to the Studies
2.1 Changes in Stakeholder Needs and Expectations
Several factors have resulted in a change in stakeholder needs and expectations regarding
TEAP. A growing awareness of the need for a new style of English entrance exam was
underlined by the government’s announcement in 2013 that the National Center Test for
University Admissions, which is currently used as a university entrance exam by 85% of
Japan’s universities and taken by over 500,000 test-takers annually, would be phased out
over the next five years. This need was further amplified by the announcement of a
Japanese Ministry of Education, Culture Sports, Science and Technology (MEXT) policy to
make use of externally produced English tests for university entrance purposes in Japan.
Since the need for tests that measure all four skills has also been emphasised by MEXT,
the TEAP Speaking test has gained particular attention.
As a result, TEAP has enjoyed increased press coverage, and TEAP seminars held across
the country in 2013 were well attended by representatives from universities, cram schools,
high schools, and educational publishing companies. As of 2014, 53 universities are
involved in the regular TEAP liaison council meetings which have been held since 2012 to
provide information regarding the TEAP tests to educators in Japan. Five of these
universities have officially decided to accept TEAP for admission purposes, and others are

4
expected to do so in the near future.
This growing awareness of TEAP and expectations regarding wider use of the TEAP
Speaking test have had several consequences. While the number of expected test-takers
was originally estimated in the tens of thousands, there is now a need to prepare for the
possibility of hundreds of thousands of test-takers. This in turn has led to a need to rethink
test administration procedures to keep TEAP accessible in terms of cost and to reconsider
rating procedures to ensure timely score reporting for a large number of test-takers while
maintaining scoring reliability.
2.2 Proposed Changes
To respond to these new stakeholder needs and expectations that have emerged since the
first phase of the TEAP project, the project team identified two aspects of the TEAP
Speaking test which could be revisited for revision:
a) Double rating methods and rating flow; and
b) Simplifying the examiners’ interlocuting procedures.
a. Double Rating Methods and Rating Flow
When the project team discussed rating methods in 2010-2012, it was originally proposed
that all test-takers’ performances be double rated using the TEAP Speaking Analytic Rating
Scales (see Appendix for the public version of the rating scales) and that both ratings be
carried out using video-recorded performances. At that time, the team was most concerned
about the feasibility of rating ‘live’ performance; that is, whether examiners during the live
test sessions could reliably play the dual role of interlocutor and rater. It was therefore
suggested that the interlocutor focus only on administering test sessions, and that the rater
focus only on rating test-takers using video-recorded performances. However, no final
decision was made on double rating methods at that point of the test development.
To respond to the public expectations described in Section 2.1, the project team revisited
cost and logistics implications and the pros and cons of various rating methods. After a
review of relevant literature as well as rating systems employed by other international
examination boards, the team held several rounds of discussion and small-scale internal
trials. Then, they agreed to propose a double rating system where the interlocutor gives a
holistic test score during the live test (hence the interlocutor will be called ‘examiner’), and
the rater awards five analytic scores using an audio-recorded performance in a post-hoc
manner. This section will briefly discuss the rationale of this new proposal.

5
Significance of double rating
It has long been suggested that double rating of spoken test performance is essential to
establish scoring validity of a speaking test and to ensure fairness to test-takers (e.g. AERA,
APA & NCME, 1999). Despite its desirability, double rating in speaking assessment is costly
and often considered to be difficult due to practical constraints when it comes to large-scale
test operationalisation. Unfortunately, not many examination boards conduct double rating
for reporting scores to test-takers. However, the project team strongly felt that double rating
is vital for the TEAP Speaking Test. The test is very high stakes, and every effort should be
made to assure its quality and fairness to test-takers.
Rating systems employed by other international examination boards
To make an informed decision, rating systems currently employed in major international
examinations were reviewed. To summarise briefly, some tests such as IELTS and Trinity
College London’s Graded Examinations in Spoken English (GESE) and Integrated Skills in
English (ISE) employ a single rating system with a human rater. Computer-delivered tests
may be rated by a human rater (e.g. TOEFL iBT) or a machine (e.g. Pearson PTE). There
are some examinations that employ double rating by two raters, such as the General
English Proficiency Test (GEPT) in Taiwan, and the Cambridge Main Suite exams; both use
a ‘live’ double rating system with two examiners present at the test sessions. Both of the
examiners assess test-takers’ live performance. One plays a dual role as an
interlocutor/rater with a holistic scale, while the other only observes and assesses with an
analytic scale. Combining holistic and analytic rating in this way contributes to capturing the
multi-dimensional picture of test-takers’ spoken performance (Taylor & Galaczi, 2011), as
well as leading to greater scoring validity through multiple observations.
Gathering multiple observations can be achieved by other means. One is to conduct ‘part
rating’. For example, in the TOEFL iBT, audio-recordings of different parts are sent to
different raters. Another possibility, which is more similar to live double rating, is to adopt a
double rating system with a live examiner and a post-hoc rater who rates the recorded
performance (e.g. BULATS Speaking).
Pros and cons of analytic and holistic approaches to scoring
Multiple advantages and disadvantages of analytic and holistic approaches to scoring have
long been discussed in the field of performance assessment. They are most
comprehensively summarised in Taylor and Galaczi (2011, 177-181). Analytic scoring

6
provides an explicit indication of what examiners should focus on in a performance, and the
standardisation of the examiners’ focus contributes to greater rater agreement (Weir, 1990).
This approach can also be valuable in educational contexts like the one TEAP is targeting.
This is because analytic scoring enables score reporting for diagnostic purposes by
providing information on differential development of test-takers’ individual sub-skills, and
the feedback will benefit those who have a jagged profile. For such reasons, there is a
general consensus that analytic scoring is a preferred option when single rating is required
or is only possible.
However, while holistic scoring cannot credit or penalise the relative strengths and
weaknesses that characterise test-takers’ spoken performance of a multi-dimensional
nature, it also has certain advantages over analytic scoring. It offers a huge economic
benefit, particularly in large-scale testing operations where large test-taker volumes need to
be rated in a short period of time. Its’ cost-effectiveness directly relates to lowering fees for
test-takers, enhancing the test’s accessibility. Holistic raters can make ‘general impression
marking’ (Association of Language Testers in Europe (ALTE) 1998: 147) in a time-efficient
manner, whereas raters who are often also interlocutors would otherwise be overloaded. It
may also represent a more natural, authentic way of judging people’s speaking skills, as it
resembles the overarching consideration which is given in real-life communication.
Nevertheless, it must be kept in mind that different examiners, as in real life, may prioritise
different aspects of the performance to arrive at their evaluation, thus usually resulting in
less reliable results than analytic scoring.
Having gathered information from other international examination boards and reviewed
relevant literature, the project team discussed and agreed to suggest a double rating
system where an examiner awards a holistic score during live test sessions and a rater
awards a set of analytic scores on recorded performances. It was hoped that this would
allow combining advantages of both analytic and holistic scoring without compromising
scoring validity of the test.
Recording format for ‘non-live’ rating
How test sessions should be recorded for double rating was another important issue.
Although the project team originally envisaged using video recording, privacy concerns
were raised about test-takers’ visual information. Recording and transmitting visual data
without sacrificing best audio quality might also add an extra layer of complication to the
scoring system. It was therefore suggested to use audio-recorded data for the second

7
rating purpose rather than video-recorded data. It was however necessary to consider how
assessing audio-recorded performance would compare with assessing video-recorded
performance, and furthermore how assessing ‘non-live’ performance would compare with
assessing ‘live’ performance. For instance, some aspects of language may be more
suitably assessed with visual information (e.g. pronunciation, fluency and interactional
communication), and others without visual information (e.g. grammatical range and
accuracy, lexical range and accuracy). This is a relatively under-researched area in the field
of spoken assessment, for which research has just begun (Nakatsuhara, Inoue and Taylor,
forthcoming). The project team will be kept updated about the latest research findings, and
if necessary, adjustments may be made on recording formats (i.e. sound or video) in the
future.
Development of a holistic scale
The project team then began developing a holistic scale designed to accurately represent
information in the fine-graded analytic scales while being practical enough for use by
examiners who administer the tests. In the development process, four different types of
holistic scale were developed and examined, and the fourth type described below was
considered to be the most appropriate.
The first type included full analytic descriptors but formatted to allow holistic scoring.
Although this reflects the most thorough description of each rating category, it was not
thought to be suitable for operational use. The examiners need to hold conversation as well
as giving a holistic score, and having to use a full scale could overwhelm them.
The second type included band descriptors only at Bands 2 (B1) and 0 (Below A2). The
descriptors at Bands 3 (B2) and 1 (A2) were removed and examiners would use descriptors
at only B1 and Below A2 as benchmarks. As B1 was envisaged to be a passing band for
most universities, retaining descriptors only at the two bands could suffice approximate
decision-making. However, when this rating scale was internally trialled, it was determined
that examiners should be given descriptors at each band level as they reported they would
always like to confirm their judgements against descriptors. In addition, this scale would not
be suitable if a passing band was set at A2 or B2.
A holistic scale featuring only key words in each analytic criterion box was proposed as the
third type. This scale was designed to have descriptors short enough to handle during a live
test session, but provide something that examiners could refer to for each band. This was a

8
preferred version when the consultant of this project carried out a focus group discussion
with examiners of another examination board. However, when this scale was trialled
internally, even this reduced version was felt to contain too much information to deal with,
as the TEAP Speaking Test has strictly structured and timed tasks and the examiners need
to follow rather complex test standardisation guidelines.
Hence, the project team developed an even simpler holistic scale. Unlike the above three
scales that are formatted to include analytic criterion boxes at each level, this scale
contains only one box at each band level. Each level gives five bullet points that carry the
most important information from the five analytic criteria of the level. Selection of the
reduced descriptors was carefully made based on the results of Studies 1 and 2, and the
suggested wording was then put forward for piloting. While this scale with reduced
information was designed to be operationally useful, it was agreed that examiner training
would be carried out using the full analytic scales prior to training with the holistic scale.
This is to ensure that examiners are fully informed about the detailed definition of each level,
preventing potential inconsistency between analytic and holistic ratings caused by a
difference in the level of understanding by examiners and raters.
The four holistic scales are illustrated in simplified forms in Tables 1.1-1.4. Although the full
version of the fourth type of scale (the operational version) is not publicly available, the
public version of the analytic scales is given in Appendix, and this gives a good idea of the
criterial features of the examiner scale.
Table 1.1: Holistic scale (Type 1): Full descriptors (simplified illustration) Score Score Score Score (CEFR)(CEFR)(CEFR)(CEFR)
PRONUNCIATION GRAMMATICAL
RANGE & ACCURACY LEXICAL RANGE &
ACCURACY FLUENCY INTERACTIONAL
EFFECTIVENESS
B2B2B2B2 • full descriptor
• full descriptor
• full descriptor
• full descriptor
• full descriptor
• full descriptor
• full descriptor
• full descriptor
• full descriptor
• full descriptor
B1B1B1B1 • full descriptor
• full descriptor
• full descriptor
• full descriptor
• full descriptor
• full descriptor
• full descriptor
• full descriptor
• full descriptor
• full descriptor
A2A2A2A2 • full descriptor
• full descriptor
• full descriptor
• full descriptor
• full descriptor
• full descriptor
• full descriptor
• full descriptor
• full descriptor
• full descriptor
Below A2Below A2Below A2Below A2 • full descriptor
• full descriptor
• full descriptor
• full descriptor
• full descriptor
• full descriptor
• full descriptor
• full descriptor
• full descriptor
• full descriptor

9
Table 1.2: Holistic scale (Type 2): Full descriptors only at Bands 2 and 0 (simplified illustration) Score Score Score Score (CEFR)(CEFR)(CEFR)(CEFR)
PRONUNCIATION GRAMMATICAL
RANGE & ACCURACY LEXICAL RANGE &
ACCURACY FLUENCY INTERACTIONAL
EFFECTIVENESS
B2B2B2B2 Above Score 2
B1B1B1B1 • full descriptor
• full descriptor
• full descriptor
• full descriptor
• full descriptor
• full descriptor
• full descriptor
• full descriptor
• full descriptor
• full descriptor
A2A2A2A2 Between Score 0
and Score 2
Below A2Below A2Below A2Below A2 • full descriptor
• full descriptor
• full descriptor
• full descriptor
• full descriptor
• full descriptor
• full descriptor
• full descriptor
• full descriptor
• full descriptor
Table 1.3: Holistic scale (Type 3): Short descriptors only with key words (simplified illustration) Score Score Score Score (CEFR)(CEFR)(CEFR)(CEFR)
PRONUNCIATION GRAMMATICAL
RANGE & ACCURACY LEXICAL RANGE &
ACCURACY FLUENCY INTERACTIONAL
EFFECTIVENESS
B2B2B2B2 • short descriptor
• short descriptor
• short descriptor
• short descriptor
• short descriptor • short descriptor
• short descriptor
• short descriptor
• short descriptor • short descriptor
B1B1B1B1 • short descriptor
• short descriptor
• short descriptor
• short descriptor
• short descriptor
• short descriptor
• short descriptor
• short descriptor
• short descriptor
• short descriptor
A2A2A2A2 • short descriptor
• short descriptor
• short descriptor
• short descriptor
• short descriptor
• short descriptor
• short descriptor
• short descriptor
• short descriptor
• short descriptor
Below A2Below A2Below A2Below A2 • short descriptor
• short descriptor
• short descriptor
• short descriptor
• short descriptor
• short descriptor
• short descriptor
• short descriptor
• short descriptor
• short descriptor
Table 1.4: Holistic scale (Type 4): Short descriptors only with key information at each
level
ScoreScoreScoreScore ((((CEFR)CEFR)CEFR)CEFR) Band descriptors
B2B2B2B2
• Short descriptor for PRONUNCIATION
• Short descriptor for GRAMMATICAL RANGE & ACCURACY
• Short descriptor for LEXICAL RANGE & ACCURACY
• Short descriptor for FLUENCY
• Short descriptor for INTERACTIONAL EFFECTIVENESS
B1B1B1B1
• Short descriptor for PRONUNCIATION
• Short descriptor for GRAMMATICAL RANGE & ACCURACY
• Short descriptor for LEXICAL RANGE & ACCURACY
• Short descriptor for FLUENCY • Short descriptor for INTERACTIONAL EFFECTIVENESS
A2A2A2A2
• Short descriptor for PRONUNCIATION
• Short descriptor for GRAMMATICAL RANGE & ACCURACY
• Short descriptor for LEXICAL RANGE & ACCURACY
• Short descriptor for FLUENCY
• Short descriptor for INTERACTIONAL EFFECTIVENESS
Below Below Below Below A2A2A2A2
• Short descriptor for PRONUNCIATION
• Short descriptor for GRAMMATICAL RANGE & ACCURACY
• Short descriptor for LEXICAL RANGE & ACCURACY
• Short descriptor for FLUENCY
• Short descriptor for INTERACTIONAL EFFECTIVENESS
Rating flow
Having agreed to employ the rating system where an examiner carries out ‘live’ rating using
the above holistic scale (in Table 1.4, also see Appendix) and a rater carries out ‘non-live’
rating using a set of analytic scales, the project team then discussed the test’s double rating
flow. In the discussions, particular attention was paid to:

10
a) how a set of analytic scores awarded by raters should be combined with a holistic score
awarded by examiners, and
b) what measures should be taken if there is a large discrepancy between analytic and
holistic scores.
Figures 1 and 2 below illustrate the flow that the team proposed. The examiner’s holistic
score is compared with the rater’s overall score that is an average of all analytic categories.
If there is no or little discrepancy between the two scores for a test, the analytic scores
given by the rater become the final scores of the test-taker. In cases where there is large
discrepancy, the audio-recording is sent to a senior rater who acts as a third judge, and
he/she rates the performance using the analytic rating scales. However, how to define
‘large discrepancy’ remained undecided at this point, and this issue was put forward as one
of the foci in Studies 3 and 4.

Figure 1: TEAP Speaking - Double rating flow (1)
Ex
am
ine
r
Ra
ter
Co
mp
are
Sco
res
giv
en
by
Ex
am
ine
r a
nd
Ra
ter
・E
xam
ine
r’s
ho
listi
c sc
ore
co
mp
are
d w
ith
ra
ter’
s
ove
rall
sco
re (
av
era
ge
of
all
sco
rin
g c
ate
go
rie
s)
・In
ca
ses
wh
ere
th
ere
is
a la
rge
dis
cre
pa
ncy
be
twe
en
th
e t
wo
sco
res
for
a t
est
, th
e t
est
is
rate
d b
y a
2n
d r
ate
r (s
en
ior
rate
r, a
na
lyti
c ra
tin
g)
Sta
rt o
f ra
tin
g
sess
ion
Q
C1
se
t
(5 t
est
s)
Ass
ign
an
aly
tic
sco
res
(1st
ra
ter
sco
re)
Un
rate
d
test
se
ts
Ra
ters
wh
ose
pe
rfo
rma
nce
fails
to
re
ach
QC
1 s
tan
da
rds
sto
pp
ed
fro
m f
urt
he
r ra
tin
g
Ra
ter
ass
ign
s C
EF
R b
an
d s
core
s
in f
ive
ca
teg
ori
es
(C
EF
R B
2-B
elo
w A
2)
Ra
tin
g c
arr
ied
ou
t
usi
ng
on
line
ra
tin
g
syst
em
(W
eb
ma
rc)
Te
st d
ay
Ass
ign
ho
list
ic
sco
re u
sin
g i
Pa
d
sco
rin
g a
pp
(Ex
am
ine
r sc
ore
)
Exa
min
er
ass
ign
s h
oli
stic
sco
re (
CE
FR
B2
-Be
low
A2
) a
t
the
en
d o
f e
ach
te
st
Ca
rry
ou
t
Sp
ea
kin
g
Te
st

Figure 2: TEAP Speaking – Double rating flow (2)
Test Day: Examiner assigns holistic score (CEFR band score [B2-Below A2])
Post-test rating session: Rater 1 assigns analytic scores in 5 scoring categories
(CEFR band score [B2-Below A2] for each scoring category)
Rater 1 overall score is calculated (average score for the 5 scoring categories)
Examiner score and Rater 1 overall score are compared
Convert fair average score to TEAP point score (20-100)
Rater 2 (veteran/senior rater) assigns analytic score
Use rater 1 analytic scores
Calculate fair average score using Facets
Report the following scores to test taker: � Overall point score (20-100) � Overall CEFR band score � CEFR band score for each scoring category
Check discrepancy
between scores
Significant
discrepancy
Little or no
discrepancy

13
b. Simplifying the Examiners’ Interlocuting Procedures
The four parts of the TEAP Speaking test must be carefully timed in order to maintain
standardisation and ensure that all scheduled test sessions can be administered within the
allotted time on test day. The maximum time allowed for each task is given in Table 2.
Table 2: TEAP Speaking Test task timing
Task Maximum time Preparation time
Part 1 2 min.
Part 2 2 min. 30 sec.
Part 3 1 min. 30 sec.
Part 4 4 min.
In the trial and pilot phases of the test development (i.e. Studies 1 and 2), interlocutors kept
time using two different digital timers. The first timer contained four buttons which were
preset to the allotted time limits for each of the four tasks: 2 minutes (Parts 1 and 2), 1
minute (Part 3), and 4 minutes (Part 4). An additional timer was preset to the 30-second
preparation period which precedes Parts 2 and 3.
In order to train examiners to use the timers, the development team provided each trainee
with a video demonstration and written instructions for how to set the timers prior to each
interview. Trainees also took part in a brief practice session at the conclusion of the test-day
orientation program, which gave them an opportunity to use the timers in a simulated test
situation.
Although the examiners who took part in Studies 1 and 2 were able to use the timers
without significant problems, it was determined that the intensive training required would
not be sustainable on a large scale. Using two devices with a total of five different functions
when administering the speaking tests was technically challenging and also increased the
risk of equipment failure. Moreover, the need to manually reset the timers before each test
session required a significant amount of time and attention, and was subject to human
error.
To address these concerns, Eiken commissioned the development of a computer-tablet
(iPad) application which would allow examiners to keep time more easily and accurately. A
prototype version was developed during the autumn of 2013. The application provides an

14
on-screen interface for each of the four tasks, which includes a start button and large timer
display. Examiners simply touch the start button at the beginning of each task and proceed
to the next task by pushing an end button. The application sounds a tone when the time for
each task has elapsed. All timers are automatically reset when the interlocutor proceeds to
the next test-taker.
This prototype version was trialled both internally and at a large-scale trial administration
held at Sophia University in December 2013 (i.e. Study 3; see Sections 4 and 5 for more
details). Computer tablets on which the application had been installed were distributed to
each examiner for use in delivering the tests. Examiners were asked to complete a
questionnaire about their experience using the application and tablet (see Section 5.2).
Following the decision described above to adopt holistic scoring by the examiner and
off-site rating using audio rather than video recordings, the application was modified to (a)
produce an audio recording of each test session using the iPad’s internal microphone; and
(b) include a scoring module to allow examiners to easily assign a holistic score at the
conclusion of each test.
In order to identify each recorded test performance and ensure that both the recording and
holistic score are linked to the test-taker, an additional feature was added which allows the
examiner to digitally capture the test-taker’s name and examinee number by using the iPad
camera to read the unique QR code that appears on each Examinee Form.
The modified version was trialled both internally and at a large-scale trial administration
held at Sophia University in March 2014 (i.e. Study 4; see Sections 4 and 6 for more
details). Examiners were asked to complete a questionnaire about their experience using
the tablet and modified application (see Section 6.2).
3. Research Questions
Following the above-mentioned modifications suggested to the test, two main research
questions were considered in Studies 3 and 4.
RQ1: How well does the test function in terms of scoring validity, incorporating the holistic
and analytic double rating approaches?
RQ1.1: To what extent do the holistic and analytic ratings reach a consensus?
RQ1.2: What are the participating examiners’ perceptions of the holistic rating scale?

15
RQ2: How well does the newly developed iPad application function, and what are the
participating examiners’ perceptions of the test administration methods?
4. Scope of the Studies and Research Designs: Study 3 and Study 4
Study 3
Study 3 was carried out between December 2013 and January 2014. Study 3 was
considered to be a trial test before Study 4. The purposes of Study 3 were:
・ to trial the draft holistic scale to gain some early indications on a) how well the holistic
rating would work, b) the extent to which the analytic and holistic ratings could agree,
and c) where a cut-off point could be set to identify problematic discrepant ratings that
have to be re-assessed by a third judge; and
・ to trial the newly developed iPad application in order to identify possible problems, and
if necessary, suggest modifications to the interface and the double rating flow.
119 first-year students at Sophia University took a single version of the TEAP Speaking test
on one day. The live test sessions were facilitated by 13 examiners who received training
on how to administer the test and use the new computer tablet application. All test sessions
were administered by these examiners using the computer tablets, and the tablets also
audio-recorded all test sessions.
In addition to the 13 live test examiners, three analytic raters and three holistic examiners
who gave post-hoc ratings also took part in the study. Their biographical data are
summarised in Table 3 below.
Table 3: Background information of Raters and Examiners
English teaching experience Experience as examiner for other speaking tests
Rater 1 English language school, 3 years.
Vocational college, 3 years. University, 5
years. Junior/senior high school, 3 years.
EIKEN, IELTS, BULATS
Rater 2 English language school, 2 years.
Junior/senior high school, 2 years.
Vocational college, 2 years. University, 6
years.
IELTS, BULATS, BEC, FCE, and other tests.
Rater 3 University, 12 years. IELTS, BULATS

16
Examiner 1 English Language school, 8 years. Jr high
school, 6 years.
EIKEN (All Grades), BULATS
Examiner 2 English Language school, 3 years.
Vocational college, 1 year. Business, 8
years.
EIKEN (All Grades)
Examiner 3 Junior/senior high school, 25 years. EIKEN, BULATS
It should be noted that although the holistic scale was designed to be used by examiners to
assess test-takers’ live performances, the 13 live test examiners who administered the 119
test sessions did not give ratings in this study. Instead, holistic ratings were conducted
retrospectively by the three holistic examiners using video recordings. This was because
the project team wanted first of all to investigate how well the draft holistic scale could be
applied to test performances before the scale was introduced in live examinations. All test
performances in this study were therefore also video-recorded by stand-alone camcorders.
In addition to the holistic and analytic scores awarded to all test performances, feedback
information was gathered from the three examiners and the three raters. Immediately after
completing ratings, both groups were asked to respond to feedback questionnaires (see
Section 5.2 for more details on the questionnaires). The three examiners were also asked
to participate in a focus group discussion based on the questionnaire and discussed further
any problems and issues that they encountered with the holistic scale.
Given the small scale of this study, both analytic and holistic scores were analysed using
only descriptive statistics. To examine the levels of agreement between analytic and holistic
scores, an average of the analytic scores for each test was calculated, and the average
scores were compared with the examiners’ holistic scores. This information was used to
suggest a cut-off point to identify problematic discrepant ratings to be re-assessed by a
third judge. Questionnaire data were analysed both quantitatively and qualitatively.
Information obtained in the focus group discussion was used to elaborate on the score and
questionnaire findings.
Study 4
Study 4 was carried out in March, 2014. The purposes of Study 4 were:
・ to confirm scoring validity using the two methods of rating when examiners actually
rated test-takers’ live performances;

17
・ to finalise the score discrepancy criteria for having tests rated by a third judge as set
after Study 3; and
・ to confirm that adjustments made to the iPad application as a result of feedback in
Study 3 were functioning as intended and to confirm the feasibility of examiners giving
holistic scores using the scoring function added to the iPad application after Study 3.
49 third-year Japanese high school students took the TEAP Speaking test on one day. Two
versions of the test, Set 1 and Set 2, were used, with 25 students taking Set 1 and 24
students taking Set 2. The live test sessions were facilitated by five examiners who
received training on how to administer the TEAP Speaking test, how to score the responses
based on the holistic examiner scale, and how to use the computer tablet. All test sessions
were administered by these examiners using the computer tablets, which audio-recorded
all tests and also kept a record of scores given by the examiners for each test to be
uploaded following the test. In Study 4, test performances were not video-recorded by
external camcorders.
Following the test session, one rater (Rater 3 from Study 3) gave post-test ratings using the
full analytic scales. Overall scores for each test were then calculated by taking an average
of the analytic scores assigned by the rater for all rating categories. These average scores
were compared to the examiners’ holistic scores to determine any score discrepancies,
which were then reviewed in order to help confirm whether the acceptable discrepancy
suggested by Study 3 was appropriate and practical.
5. Results and Discussion: Study 3
This section will describe and discuss the results of Study 3. It will firstly compare analytic
and holistic scores. It will then describe feedback data obtained from the examiners and
raters on scoring methods, followed by the examiners’ feedback on the use of the computer
tablet.
5.1 Analytic and Holistic Scores
Quality Check for Analytic Raters
Training for raters was conducted according to the regular procedures that will be followed
for the live test administration. All raters had previously rated TEAP trial tests and so had
already completed initial training and achieved the requirements for becoming TEAP
Speaking raters. As would happen in a live administration, all raters went through refresh
training (retraining) using standardised exemplars before the study, and then practiced

18
rating on benchmarked performances from the test set used in the study. All raters also
rated a common quality control set of 5 test sample performances. The three raters all
achieved high levels of agreement with benchmark scores for these 5 performances, so
reached the quality control standards of the TEAP Speaking test. They were all therefore
qualified to carry out further ratings in this study.
Double-rating matrix
Although 119 recorded performances were collected in total, only 107 performances were
used to compare ratings between rater ratings and examiner ratings. Twelve recordings
were not included in the analysis because a malfunction of the video camera placed in one
of the test rooms resulted in the test sessions for that room not being video recorded.
As shown in the double-rating matrix in Table 4 below, almost all performances rated by
Raters 1, 2, and 3 were double rated by Examiners 1, 2 and 3, respectively. The lack of
sufficient overlaps between different raters and examiners in this matrix did not allow for a
more sophisticated analysis of rater-examiner agreement. Due to the preliminary nature of
Studies 3 and 4, simple matrices like this were considered to be sufficient to generate some
early indications of the proposed double rating method at this stage. However, in the
operational tests, recordings rated by examiners need to be distributed to post-hoc raters in
a way that achieves good overlaps between different examiners and raters.
Table 4: Double rating matrix
Rater ID Raters gave analytic scores to: Examiner ID Examiners gave holistic scores to:
Rater 1 Candidates 1-40 Examiner 1 Candidates 1-37
Rater 2 Candidates 41-80 Examiner 2 Candidates 38-72
Rater 3 Candidates 81-107 Examiner 3 Candidates 73-107
Comparing Rater and Examiner Ratings
The examiners’ holistic scores were compared with the average values of the analytic
scores given by the raters. As Table 5 shows, the mean examiner scores and the mean
rater scores were very close (1.794 and 1.710). Differences between examiner and rater
scores ranged from -1.6 to 1.6, and the mean of absolute differences was 0.335.

19
Table 5: Comparisons between examiner and rater scores
(a) Examiner score (b) Rater score Abs difference b/w (a) & (b) Difference b/w (a) & (b)
Mean 1.794 1.710 .335 .084
SD .710 .636 .366 .490
Min .00 .20 .00 -1.60
Max 3.00 3.00 1.60 1.60
Table 6 and 7 and Figures 3 and 4 below show in more detail the extent to which examiner
scores and rater scores agreed. Of the 107 comparisons, 33.6% showed complete
agreement; 61.2% agreed within 0.2 score discrepancy; 72% agreed within 0.4 score
discrepancy; 78.5% agreed within 0.6 score discrepancy; and 92.5% agreed within 0.8
score discrepancy. Therefore, the examiner and rater scores seemed to agree sufficiently
well, most differences falling within 1.0. Only six cases (5.6%) showed 1.0 score
discrepancy, and two cases (1.9%) showed 1.6 score discrepancy.
It should be noted that the score difference was not skewed towards one side of the
histogram in Figure 6, indicating that the holistic ratings did not show a particular
harshness/leniency pattern that is different from the analytic ratings. These eight discrepant
cases were also spread among different raters and examiners (i.e. two cases for Rater 1
and Examiner 1; four cases for Rater 2 and Examiner 2; two cases for Rater 3 and
Examiner 3).
Table 6 & Figure 3: Absolute difference between examiner and rater scores
Abs difference
b/w ratings
Freq. % Cumulative %
.00 36 33.6 33.6
.20 30 28.0 61.7
.40 11 10.3 72.0
.60 7 6.5 78.5
.80 15 14.0 92.5
1.00 6 5.6 98.1
1.60 2 1.9 100.0

20
Table 7 & Figure 4: Difference between examiner and rater scores
Difference b/w
ratings
Freq. % Cumulative %
-1.60 1 .9 .9
-1.00 2 1.9 2.8
-.80 4 3.7 6.5
-.60 3 2.8 9.3
-.40 5 4.7 14.0
-.20 14 13.1 27.1
.00 36 33.6 60.7
.20 16 15.0 75.7
.40 6 5.6 81.3
.60 4 3.7 85.0
.80 11 10.3 95.3
1.00 4 3.7 99.1
1.60 1 .9 100.0
While it was encouraging to find a relatively good agreement rate between the examiner
and rater scores, the eight cases that showed differences of 1.0 and above (see Table 8
below) required further examination, as score discrepancies of 1.0 or higher would impact
on a pass/fail decision made by universities.
Table 8: Large discrepancies between examiner and rater ratings (Study 3)
Cand. ID Examiner ID (a) Examiner rating Rater ID (b) Rater rating Discrepancy (a – b)
33 Examiner 1 2 (B1) Rater 1 1 (A2) 1.0
35 Examiner 1 1 (A2) Rater 1 2.6 (B1/B2) -1.6
49 Examiner 2 3 (B2) Rater 2 1.4 (A2/B1) 1.6
56 Examiner 2 2 (B1) Rater 2 1 (A2) 1.0
69 Examiner 2 3 (B2) Rater 2 2 (B1) 1.0
71 Examiner 2 3 (B2) Rater 2 2 (B1) 1.0
89 Examiner 3 0 (Below A2) Rater 3 1 (A2) -1.0
100 Examiner 3 1 (A2) Rater 3 2 (B1) -1.0

21
To investigate further, the project team asked a third judge to rate the eight performances.
Those recordings and scores were then reviewed to identify reasons that might have
caused such discrepancies. The most obvious reason for the discrepancies of 1.0 was that
the test-takers had jagged profiles and were borderline between two adjacent score bands.
The third judge indicated to the team that giving scores for these cases was very difficult
since the performances displayed characteristics of adjacent band levels. It is also worth
noting, that for five out of the six cases where there were discrepancies of 1.0, the third
independent judge’s scores agreed with the scores given by the rater rather than those
given by the examiner. This supports the proposed rating system that where there is no or
little discrepancy between the two ratings of a test, the rater’s analytic scores will be put
forward as the test-taker’s final scores.
In the case of the two test performances with a discrepancy of 1.6, it was speculated that
the examiners simply input a wrong score on the rating sheet, since the rater’s scores were
obviously correct in both cases. This was actually a problem that the project team was
concerned about for both examiner and rater scoring. Based on this experience, two
measures were taken before Study 4 to avoid the possibility of inputting wrong scores by
accident. As described above, a function was added to the iPad application whereby
examiners input a holistic score at the end of each test and a confirmation message
appears after a score is entered. Additionally, a scoring tool was created using Microsoft
Access to allow raters to input their analytic scores digitally. The effectiveness of these
measures will be investigated in Study 4.
This double rating method successfully identified test performances that were difficult to
rate and flagged rating errors. Although it is impossible to draw general conclusions from
only eight examples, some possible causes for score discrepancies were identified. At this
stage of the rating system development, it was felt appropriate to suggest a cut-off point
either at 1.0 or at >1.0 to identify problematic discrepant ratings that have to be
re-assessed by a third judge. These two suggestions were then revisited in Study 4 (see
Section 6.1).
5.2 Rater and Examiner Feedback on Rating and Test Administration
The three raters and three examiners who participated in Study 3 completed feedback
questionnaires on rating methods immediately after rating the test performances. The 13
examiners who administered the Study 3 test sessions also completed a questionnaire on
test administration methods and procedures using the computer tablet.

22
Rater Feedback Questionnaire on Rating Methods
The results of the rater feedback after rating the Study 3 test performances are summarised
in Table 9. The questionnaire was a reduced version of the questionnaire used in Studies 1
and 2. It consisted of three parts; Section A on the analytic rating scales, Section B on the
rater training, and Section C on the rating procedures.
Table 9: Rating Feedback Questionnaire (Study 3) Question items Responses
Section A: The Rating Scales
The rating descriptors are easy to understand and interpret. (1: strongly disagree – 5: strongly agree)
Mean
Q1 Pronunciation 4.33
Q2 Grammatical range and accuracy 4.33
Q3 Lexical range and accuracy 4.33
Q4 Fluency 4.33
Q5 Interactional effectiveness 4.00
The descriptors for each score point distinguish well between each of the levels of the scales (1: strongly disagree – 5: strongly agree)
Mean
Q6 Pronunciation 4.33
Q7 Grammatical range and accuracy 4.00
Q8 Lexical range and accuracy 4.33
Q9 Fluency 4.33
Q10 Interactional effectiveness 4.33
Q11 Please give any comments you have about the rating scales (Free response)
Section B: Training Mean
Q1 I found the training materials (Stage 1, Stage 2) useful.
4.67
Q2 The rating criteria were clearly explained in the training materials (Stage 2).
4.67
Q3 The standardized exemplars were good examples of the scoring categories for the different criteria.
3.67
Q4 The number of standardized exemplars (3) was sufficient to help me understand how to apply the rating criteria.
2.33
Q5 Rating the benchmark scripts (2) provided useful practice of using the rating scales.
4.67
Q6 After reading through the training materials, I was confident I could apply the rating criteria in samples of test taker performance.
3.33
Q7 Please give any comments you have about the training materials
(Free response)
Section C: Rating Procedures Frequencies
Q1 Was the quality of the audio sufficient for rating the speaking samples?
Yes: 3 No: 0
Q2 Did you need to watch the audio samples more than once to rate them?
Yes: 1 No: 2
Q3 Was the rating form (Excel score-input form) easy to use?
Yes: 3 No: 0
Q4 At what stage of the rating process did you finalize your score for each category?
(Free response)
Q5 Please describe the process you followed when rating the samples.
(Free response)

23
For all of the five analytic scales, all three raters thought that the rating descriptors were
easy to understand and interpret, and felt that the descriptors for each score point
distinguished well between each of the levels of the scales. However, Rater 2 reported that
“there were some words such as ‘sufficient’ and ‘basic’ that were difficult to interpret”. Rater
1 pointed out that “even B2 candidates tended to make more than ‘very few’ mistakes”.
Rater 3 thought that “more information was necessary about Below A2 rating”.
It is encouraging that all raters found the training they received before the Study 3 ratings
generally effective. However, Raters 2 and 3 expressed that they would have liked “more
exemplars with some short explanation of why the scores were assigned”. More exemplars
were particularly felt “necessary at the Below A2 level”. Such additions should solve the
above-mentioned problem by helping to define the relative terms that were reported difficult
to interpret and more explicitly describe the Below A2 performance.
Raters thought that the quality of the audio was sufficient for rating the speaking samples
and that the Excel score-input form was easy to use. All three raters waited until the end of
the test to finalise their score for each category. They assigned provisional marks for most
categories at the early stage of the test session, and they adjusted the marks throughout
the test. While the general approach was similar, it seems they also developed their own
rating processes. For example, Rater 1 reported that “it was more efficient to dip in and out
rather than listen solidly for every single detail from beginning to end, which could actually
cause the listener to lose concentration”. He said that he would first form an opinion about
Pronunciation while listening to the initial questions in Part 1. Then, he would give
provisional scores on Grammar and Fluency during the Part 2 role-play, by asking himself
questions such as whether the candidate can form questions correctly, and whether he or
she can interact or simply asking mechanically. The provisional scores on Grammar and
Fluency would be confirmed during the Part 3 monologue task. Finally, the Part 4 abstract
questions were used to confirm all previous assumptions. Rater 3 also reported a similar
process. He would start with Pronunciation, and then get a sense of Fluency, Lexis and
Grammar during Parts 1 and 2. The theories would then be tested in Parts 3 and 4, and all
scores would be finalised at the end of the test. In contrast, Rater 2 also showed concerns
about forming a hypothesis early in the interview. He said that “forming a hypothesis earlier
in the test session is worrying, because if the initial hypothesis was wrong, it could be more
likely to end up with the wrong grade”.
24
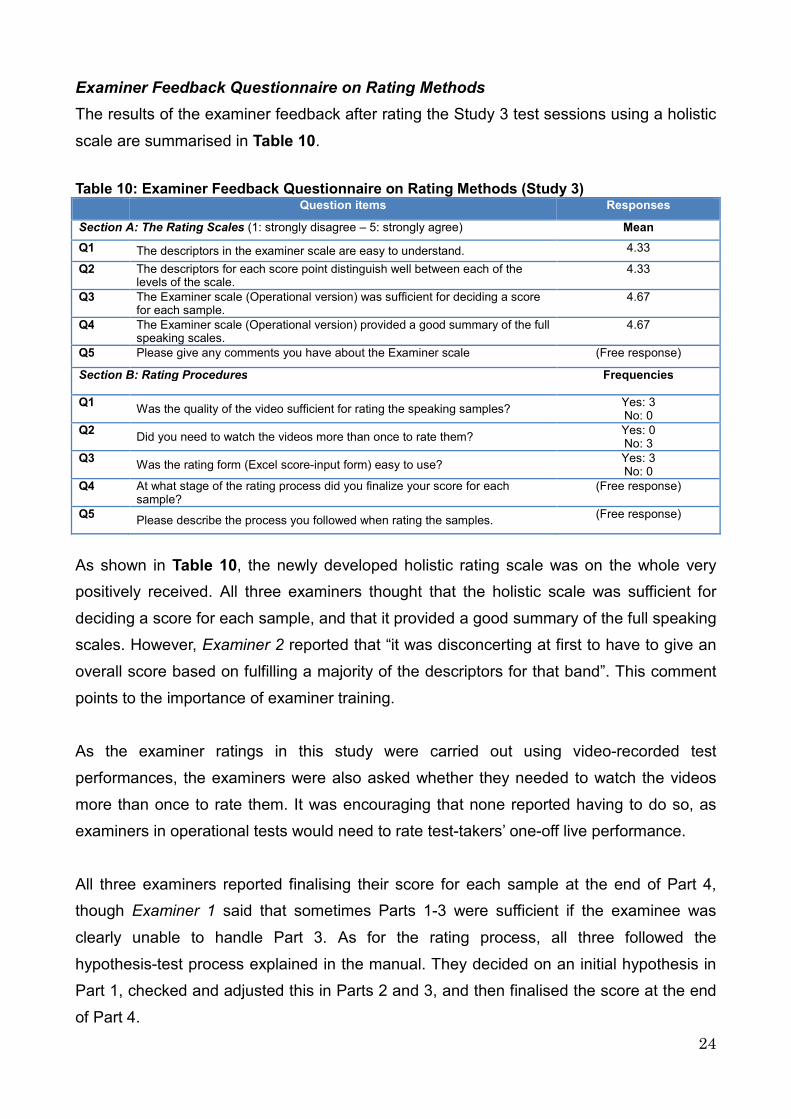
Examiner Feedback Questionnaire on Rating Methods
The results of the examiner feedback after rating the Study 3 test sessions using a holistic
scale are summarised in Table 10.
Table 10: Examiner Feedback Questionnaire on Rating Methods (Study 3) Question items Responses
Section A: The Rating Scales (1: strongly disagree – 5: strongly agree) Mean
Q1 The descriptors in the examiner scale are easy to understand. 4.33
Q2 The descriptors for each score point distinguish well between each of the levels of the scale.
4.33
Q3 The Examiner scale (Operational version) was sufficient for deciding a score for each sample.
4.67
Q4 The Examiner scale (Operational version) provided a good summary of the full speaking scales.
4.67
Q5 Please give any comments you have about the Examiner scale (Free response)
Section B: Rating Procedures Frequencies
Q1 Was the quality of the video sufficient for rating the speaking samples?
Yes: 3 No: 0
Q2 Did you need to watch the videos more than once to rate them?
Yes: 0 No: 3
Q3 Was the rating form (Excel score-input form) easy to use?
Yes: 3 No: 0
Q4 At what stage of the rating process did you finalize your score for each sample?
(Free response)
Q5 Please describe the process you followed when rating the samples.
(Free response)
As shown in Table 10, the newly developed holistic rating scale was on the whole very
positively received. All three examiners thought that the holistic scale was sufficient for
deciding a score for each sample, and that it provided a good summary of the full speaking
scales. However, Examiner 2 reported that “it was disconcerting at first to have to give an
overall score based on fulfilling a majority of the descriptors for that band”. This comment
points to the importance of examiner training.
As the examiner ratings in this study were carried out using video-recorded test
performances, the examiners were also asked whether they needed to watch the videos
more than once to rate them. It was encouraging that none reported having to do so, as
examiners in operational tests would need to rate test-takers’ one-off live performance.
All three examiners reported finalising their score for each sample at the end of Part 4,
though Examiner 1 said that sometimes Parts 1-3 were sufficient if the examinee was
clearly unable to handle Part 3. As for the rating process, all three followed the
hypothesis-test process explained in the manual. They decided on an initial hypothesis in
Part 1, checked and adjusted this in Parts 2 and 3, and then finalised the score at the end
of Part 4.

25
Examiner Feedback Questionnaire on Test Administration Methods and Procedures
The results of the examiner feedback after carrying out the Study 3 test sessions are
summarised in Table 11.
Table 11: Examiner Feedback Questionnaire on Test Administration Methods and
Procedures (Study 3)
Question items Responses
5.The initial training, test-day training session, and the interview test.
Mean About the test-day training session and initial training (1: Definitely not - 6: Definitely)
Q30* Was today's training session useful? 5.54
Q31 Were the interlocutor frames easy to understand and use? 5.69
Q32 Were the iPad app instructions easy to understand? 5.31
Q33 Was the practice test session during today's training useful? 5.92
Q34 After finishing the training, were you confident in acting as an interlocutor in the
live test sessions? 5.38
Q35 Was the training DVD helpful? 5.69
Q36 Was the number of interview examples in the DVD sufficient? 4.62
Q37 If you answered 3, 4, or 5 for Q36, please write the number of interview examples
you think would be appropriate. (Appropriate number of examples) See discussion below
About the interview test Frequencies
Q38 For today's speaking test, you were given 2 minutes of preparation time for each
10-minute interview. How was the length of this preparation time?
Too short: 1
Appropriate: 12
Too long: 0
Q39 Were you able to carry out the interview by following the Interlocutor Frame? Yes: 13
No: 0
Q40 How was the interview room arrangement? Appropriate: 11
Not appropriate: 2
Q41 If you answered (2) for Q40, please say what feature(s) of the room arrangement
you found inappropriate. See discussion below
Q42 How was the distance between you and the test taker?
Too close: 0
Appropriate: 9
Too far: 4
Q43 Were you able to use the iPad to read the QR codes without any problems? No problems: 10
Some problems: 3

26
Q44 How did you find using the timer app?
Easy: 12
Difficult but OK: 1
Too difficult: 0
Q45 What did you think of the type of sound made by the timer?
Appropriate: 13
Would prefer a
different sound: 0
Q46 How was the volume of the sound made by the timer?
Too quiet: 0
Appropriate: 13
Too loud: 0
Q47 Did you find it intrusive that the tests were being videotaped and audio-recorded? Yes: 3
No: 10
Q48 Did you find that using the iPad interfered with your ability to deliver the tests? Yes: 0
No: 13
* numbering begins at Q30as this was part of a longer questionnaire used to gain feedback about all aspects of TEAP.
As shown in Table 11, examiners generally found the initial training and the test day training
session useful. However, the questionnaire responses for Q36 indicated that examiners
would prefer to have more examples of the test on the initial training DVD. In response to
Q37 regarding how many examples would be suitable, the number suggested by those
interlocutors who responded ranged from two to five. With the decision to have examiners
assign holistic scores in Study 4, this issue was addressed since standardised exemplars
were also included in the initial training DVD. Examiners also had few problems following
the instructions in the examiner frame. The large majority of examiners found the
arrangement of the test room appropriate, although two examiners gave comments such as
“desks closer together as in interview DVD better,” and asked for “more desk space.” To
address this issue, before Study 4, changes were made to instructions for the staff who set
up the test rooms to clarify the ideal distance between desks.
Regarding use of the computer tablet timer application, it was pleasing to see that
examiners generally found it easy to use and said that it did not interfere with their ability to
deliver the tests. They also found the timer sounds and the volume to be appropriate.
However, three examiners did experience difficulty scanning the QR code on the test-takers’
examination forms, with one examiner commenting that “it was extremely difficult to scan
the square code on the paper.” Review of the video recordings of the tests by the project
team revealed that this issue occurred with several of the examiners and that it sometimes

27
interfered with smooth delivery of the speaking test. To address this problem, a digital finder
image was added to the QR code-scanning screen to make it easier for examiners to scan
the code. The effectiveness of this addition was then investigated in Study 4.
6. Results and Discussion: Study 4
This section will describe and discuss the results of Study 4. It will first compare holistic and
analytic scores given by examiners and raters, respectively. It will then describe feedback
data obtained from the examiners regarding carrying out the tests and assigning holistic
scores using the computer tablet.
6.1 Analytic and Holistic Scores
Quality Check for Analytic Rater
Rater training and rater quality control were carried out in the same way as in Study 3,
using the regular procedures that will be used for the operational rating of TEAP Speaking.
Comparing Rater and Examiner Ratings
The examiners’ holistic scores were compared with the average values of the analytic
scores given by the rater. As Table 12 shows, the mean examiner scores and the mean
rater scores were very close (1.76 and 1.83). Differences between examiner and rater
scores ranged from -1.0 to 1.2, and the mean of absolute differences was 0.43.
Table 12: Comparisons between examiner and rater scores (Study 4)
(a) Examiner score (b) Rater score Abs difference b/w (a) & (b) Difference b/w (a) & (b)
Mean 1.76 1.83 0.43 0.07
SD 1.07 0.67 0.39 0.58
Min 0.00 0.20 0.00 -1.00
Max 3.00 3.00 1.20 1.20
There were only seven cases in which the difference between rater and examiner scores
was 1.0 or greater than 1.0, as shown in Table 13 below.

28
Table 13: Large discrepancies between examiner and rater ratings (Study 4)
Cand. ID Examiner ID* (a) Examiner rating Rater ID (b) Rater rating Discrepancy (a-b)
187 4 0 (Below A2) 3 1.0 (A2) -1.0
169 1 0 (Below A2) 3 1.0 (A2) -1.0
125 2 3 (B2) 3 2.0 (B1) 1.0
216 5 0 (Below A2) 3 1.0 (A2) -1.0
30 3 0 (Below A2) 3 1.2 (A2) -1.2
176 3 0 (Below A2) 3 1.2 (A2) -1.2
147 1 0 (Below A2) 3 1.2 (A2) -1.2
*Examiners in Study 4 differed from examiners in Study 3
These results showed that there was little difference between the “live” holistic scores given
by examiners and the average post-hoc analytic scores given by raters, indicating to the
team that the system of having examiners assign holistic scores was working well. The
results also gave the team confidence that the examiners were generally using the rating
scale as intended in the training materials. It is interesting to note that raters on the whole
seemed to be more lenient than examiners, especially at the lower proficiency levels. To
investigate this further, the team plans to continue collecting data for discrepant scores
during live testing. This will help identify any patterns in rating, which could then be used to
improve rater and/or examiner training.
The double rating system seemed to be functioning well, and it successfully identified test
performances which were difficult to rate and would therefore require re-assessment by a
third judge. As in Study 3, a third independent judge was asked to rate all cases in which
there was a score discrepancy of 1.0 or more. Again, it was found that the most obvious
reason for these discrepancies was that the performances were borderline cases between
two adjacent score bands. For three out of the four cases, the third judge agreed with the
rater rather than with the examiner, but in a focus discussion held after the rating session,
the third judge said that assigning scores for all four cases was difficult, and that the scores
given could have “gone either way” for many of the rating categories. Study 4 therefore
seemed to confirm the findings of Study 3, i.e. that even in cases where there was a
discrepancy of 1.0, the discrepancy was not due to human error, such as the misapplication
of the rating criteria by either the examiner or the rater, but instead was the result of the
test-taker's performance incorporating features of both of the score bands that were
assigned. Although this suggested that there was probably no need to have such cases

29
reassessed by a third judge, the team decided to set the cut-off point for reassessment by a
third judge at 1.0 in order to ensure the accuracy of scores when the test becomes
operational and to further investigate the causes of such discrepancies. It was also decided,
however, that this cut-off point would be monitored in future test administrations and
adjusted if necessary.
6.2 Examiner Feedback on Rating and Test Administration
Feedback was collected from examiners after carrying out the Study 4 test sessions. The
questionnaire used was an adapted version of the examiner questionnaire used in Study 3
with additions to collect feedback regarding rating using the examiner scale. The results are
summarised in Table 14.
Table 14: Examiner Feedback Questionnaire (Study 4)
Question items Responses
5. The initial training, test-day training session, and the interview test. Frequencies
About the initial training
Q30* Were the initial training materials easy to understand? Yes: 5
No: 0
Q31 Did watching the standardized exemplars in the initial training help you
understand the scoring criteria?
Yes: 4
No: 0
No response: 1
Q32 Is there anything you think should be added to the initial training materials?
Yes: 1
No: 2
No response: 2
About the test-day orientation and the interview test Frequencies
Q33 Was the Examiner Test-Day Manual easy to understand? Yes: 5
No: 0
Q34 Is there anything you think should be added to the Examiner Test-Day Manual?
Yes: 2
No: 2
No response: 1
Q35 Is there anything you think should be added to the Test-Day Orientation CD? Yes: 0
No: 5
Q36 How was the length of the practice session during the test-day orientation?
Too short: 0
Appropriate: 5
Too long: 0

30
Q37 Is there anything you think should be added to the test-day orientation? Yes: 2
No: 3
Q38 Was the Examiner scale easy to use? Yes: 1
No: 4
Q39 How was the distance between you and the test taker?
Too close: 0
Appropriate: 5
Too far: 0
Q40 Were you able to use the iPad to read the QR codes without any problems? No problems: 2
Some problems: 3
Q41 Were you able to use the iPad to carry out the test without any problems? No problems: 3
Some problems: 2
* numbering begins at Q30as this was part of a longer questionnaire used to gain feedback about all aspects of TEAP.
We can see from Table 14 that examiners generally found the training and the Examiner
Test-Day Manual easy to understand. They also indicated that the standardised exemplars
were useful for helping them understand the rating criteria. Regarding initial training
materials, the Examiner Test-Day Manual, and the test-day orientation, several examiners
commented that it would be useful to have more instructions regarding what to do in
unexpected or irregular cases (particularly in Part 2). In response to this, the project team
will consider adding examples of how to handle irregular cases to the examiner materials in
time for the live test administration.
In terms of the arrangement of the room, all examiners stated that the distance between
desks was appropriate, which suggested that the changes made to instructions for setting
up the room after Study 3 were successful.
Two aspects of concern to the project team were that four out of five examiners responded
negatively to Q38: “Was the examiner scale easy to use?” and three out of five examiners
still experienced problems reading the QR codes using the computer tablet. Regarding the
rating criteria, examiner comments suggested that the difficulties stemmed from examiners
having trouble deciding scores in borderline cases between two score bands (particularly
between A2 and B1) rather than with the content of the descriptors themselves. In order to
help examiners decide a score in such cases, additions will be made to training materials in
time for the live test administration. Regarding capturing of the QR code, comments
suggested that the main issue was that the computer tablet screen would sometimes not

31
respond when pressed. The issue was discussed by the project team, but it was decided
that little further could be done to solve the problem since this is an inherent characteristic
of using a computer tablet. To address this issue, both the training and operational test-day
manuals instruct examiners to enter the test-taker’s ID number manually, should the QR
code reader fail to work. The problem will be monitored during future test sessions,
however, and if it is judged that the effect on test administration is too great, measures to
adjust test procedures (such as modifying or removing the QR code reader) will be
considered.
7. Conclusion
This report has outlined two studies that verified or modified the ways in which the TEAP
project team responded to necessary alterations to test administration and scoring
procedures proposed as a result of changes in stakeholder expectations. A decision was
made to introduce a double rating system in which for each test, a holistic score is assigned
to live performances by the examiner and an analytic score is assigned post-hoc by a rater.
As examiners would now need to evaluate test-takers, it was felt necessary to simplify
interlocuting procedures so as not to overload examiners, which could affect their ability to
effectively administer the tests. Studies 3 and 4 were designed to determine how well the
proposed double rating system works in terms of scoring validity (RQ1), as well as how well
the newly developed computer tablet application functions (RQ2).
The findings of the two studies indicated that the suggested double rating system and the
rating flow were generally working well. The examiner and rater ratings agreed sufficiently
well. At the same time, the double rating system also successfully flagged a few
problematic cases where the examiner and rater scores showed some notable
discrepancies. Further examinations of these cases identified that they were difficult
performances to assess due to test-takers’ jagged profiles and/or borderline performances
between two adjacent score bands. It was decided that in operational testing flagged test
performances with discrepancy of 1.0 or above would be passed onto a third judge to
ensure accurate scoring. The examiners and raters who participated in the studies found
both analytic and holistic rating scales and examiner/rater training generally useful and
effective. However, some problems were also reported, such as occasional difficulties in
assessing Below A2 performances and borderline test-takers, particularly between A2 and
B1. To address these issues, it was decided to add more performance exemplars to training
materials and to focus more on assessment of lower proficiency level performances. The
project team is also planning to continue to monitor the agreement rate between the

32
examiner and rater scores and check possible reasons for score differences in the
operational tests. This would help to identify further reasons for score discrepancy,
informing further improvement of the rating scales and training materials.
The completely bespoke computer-tablet application was found to be functioning very well.
It simplified the examiners’ work and facilitated administration of the test by timing test tasks,
making an audio-recording of test-taker performances, keeping a record of examiners’
holistic scores, and reading test-takers’ QR codes. The use of the computer tablet with all
these functions has remarkably reduced the examiners’ workload, enabling them to give
greater and more careful attention to administering the test. This is likely to decrease the
risk of human error. For the occasional problems reported related to the use of the QR
reader, the training and operational test-day manuals will be revised to include
troubleshooting instructions.
As mentioned in Section 2, despite the desirability of double rating, carrying it out in
large-scale speaking assessment can be difficult due to practical constraints. However,
through the two empirical studies informed by a review of practice by other international
examination boards and relevant literature, it is hoped that the TEAP Speaking test has
succeeded in identifying a way to carry out double ratings without compromising its scoring
validity or accessibility in terms of cost. It is also quite remarkable that the TEAP Speaking
test will be administered using computer tablets with a bespoke application. The use of the
advanced computer technology will certainly contribute to the test’s quality assurance, by
standardising the test administration procedures, reducing the examiner’s workload, and
minimising the risk of human error. As mentioned above, the modifications to the rating and
test administration methods outlined in this report will be monitored during future test
sessions and their effectiveness will be regularly examined.
This report has demonstrated the project team’s commitment to iterative revision and
improvement of testing procedures, scoring methods, and training materials in order to
provide high-quality Speaking examinations and to better meet the changing needs of
stakeholders. While this report has added to the a-priori validation studies carried out in
studies 1 and 2, the team is well aware of the need for ongoing validation studies, and the
fact that a-posteriori validation is equally important once the test goes live. The intention is
to carry out such studies based on the recommendations given in Nakatsuhara (2014).

33
Acknowledgements
The TEAP development team wish to thank all of the test takers who participated in Studies
3 and 4, without whose cooperation the studies could never have been carried out. Much
gratitude also goes to Sophia University, who allowed the use of the university’s facilities,
and to the Sophia staff who helped the team to set up and run the studies. It is our hope
that the genuine care and concern demonstrated by everyone involved in the project will be
reflected in the quality of the test and in the positive washback it generates.

References
American Educational Research Association (AERA), American Psychological Association
(APA) & National Council of Measurement in Education (NCME) (1999). Standards for
educational and psychological testing. Washington, DC: AERA.
Association of Language Testers in Europe (ALTE) (1998) Multilingual glossary of language
testing terms, Studies in Language Testing 6: Cambridge: UCLES/Cambridge University
Press.
Nakatsuhara, F. (2014) A Research Report on the Development of the Test of English for
Academic Purposes (TEAP) Speaking Test for Japanese University Entrants – Study 1 &
Study 2, Project report submitted to Eiken Foundation of Japan.
Nakatsuhara, F., Inoue, C. and Taylor, L. (forthcoming) An investigation into double-marking
methods: comparing live, video and audio rating of performance on the IELTS Speaking
Test, IELTS joint funded research programme.
Taylor, L. and Galaczi, E. (2011). Scoring validity, In L. Taylor. (Ed.) Examining speaking:
Research and practice in assessing second language speaking, Studies in Language
Testing 30 (pp.171-233). Cambridge: UCLES/Cambridge University Press.
Weir, C. J. (1990) Communicative language Testing, New York: Prentice Hall.

35
Appendix: TEAP Speaking Public Rating Scale
TEAP SPEAKING
CEFR
score Scoring category Level Descriptors
B2
PRONUNCIATION Speech easy to understand; accurate stress and intonation; some L1 influence on individual sounds.
GRAMMATICAL RANGE & ACCURACY Sufficient range of grammatical structures to deal with the range of functions required in the test; very few
grammatical mistakes.
LEXICAL RANGE & ACCURACY Range of vocabulary sufficient to deal with the full range of topics presented in the test; word choice
occasionally incorrect.
FLUENCY Speaks at natural speed; only occasional hesitation.
INTERACTIONAL EFFECTIVENESS Effective active and receptive communication; indicates communication problems naturally and
effectively; gives relevant comments in Part 2.
B1
PRONUNCIATION Speech intelligible; noticeable L1 influence on stress, intonation, and individual sounds.
GRAMMATICAL RANGE & ACCURACY Mostly uses basic grammatical structures reasonably accurately; errors occur when attempting complex
grammatical forms.
LEXICAL RANGE & ACCURACY Vocabulary sufficient for everyday topics; incorrect word choice occasionally impedes communication.
FLUENCY Speaks slowly with some reformulation; hesitation noticeable and occasionally demands patience from
listener.
INTERACTIONAL EFFECTIVENESS Sometimes dependent on examiner; signals communication problems effectively, but awkwardly; some
evidence of back-channeling in Part 2.
A2
PRONUNCIATION Speech mostly intelligible; heavy L1 influence on stress, intonation, and individual sounds; some
mispronunciations impede communication.
GRAMMATICAL RANGE & ACCURACY Uses some basic grammatical structures and memorized phrases accurately; makes systematic errors.
LEXICAL RANGE & ACCURACY Vocabulary limited to routine, everyday exchanges; incorrect word choice and/or lack of vocabulary
frequently impede communication.
FLUENCY Speaks very slowly with frequent reformulation; hesitation very noticeable and frequently demands
patience from listener.
INTERACTIONAL EFFECTIVENESS Almost entirely dependent on examiner; does not signal communication problems effectively; limited
attempt to carry out Part 2.
Below
A2
No response OR:
� Often unintelligible; mispronunciations very frequent.
� Grammar almost entirely inaccurate
� Uses only the simplest words and phrases.
� Speech disconnected; almost impossible to follow.
� Communicates poorly; does not indicate communication problems; very limited (or no) attempt to carry out Part 2.