A Representation-Driven Ontology for Spatial Data … · a representation-driven ontology for...
6
A REPRESENTATION-DRIVEN ONTOLOGY FOR SPATIAL DATA QUALITY ELEMENTS, WITH ORTHOIMAGERY AS RUNNING EXAMPLE J.-F. Hangouët a a Institut national de l’information géographique et forestière, DPR/SCOP, Saint-Mandé, France, [email protected] Commission II, WG II/4 KEY WORDS: Spatial data quality concepts, Spatial data quality components, Representation, Semiotics, Orthoimagery ABSTRACT: The many facets of what is encompassed by such an expression as “quality of spatial data” can be considered as a specific domain of reality worthy of formal description, i.e. of ontological abstraction. Various ontologies for data quality elements have already been proposed in literature. Today, the system of quality elements is most generally used and discussed according to the configuration exposed in the “data dictionary for data quality” of international standard ISO 19157. Our communication proposes an alternative view. This is founded on a perspective which focuses on the specificity of spatial data as a product: the representation perspective, where data in the computer are meant to show things of the geographic world and to be interpreted as such. The resulting ontology introduces new elements, the usefulness of which will be illustrated by orthoimagery examples. 1. INTRODUCTION Ontology is both “the science of ‘what is’” (Vasseur et al., 2006) and, resulting from scientific investigation, any framework apt “to model a field of knowledge” (ibid.). As a specific domain of reality involving numerous intricate notions, spatial data quality has attracted much ontological attention indeed. Approaches to investigate, abstract and organise the fundamentals of this domain vary with the numbers, the names, the definitions and the configurations of the constitutive components they identify. The diversity of the resulting abstractions, or ontologies, shows through the epistemological observations reported in academic monographs on spatial data quality (see e.g. Servigne et al., 2006 or Morrison, 2013). Our communication proposes yet another view on the system of quality elements for spatial data. This view is inspired by, and focuses on, the specificity of spatial data as a man-made product, which lies in their representational status. According to the representation paradigm (here applied to spatial information), data in the computer are forms that are meant first to show (parts of) things of the geographic world and then to be interpreted as such by human or computational processing. When founded on this perspective, quality modelling leads to classify quality components under three major headings: 1) quality of notation, i.e. integrity of the form given to the information, 2) quality of denotation, i.e. exactness of the informational content, 3) quality of connotation, i.e. reliability of the information for given or typical applications. Because it originates from a single explanatory paradigm, this ontological structuring is intrinsically more focused and coherent than composite typologies that omit to state their ontological motivations, such as the now widely-used “data dictionary for data quality” of ISO 19157 (ISO, 2013). Also, the subcategories implied cover a wide range of actual quality issues, as can be illustrated with examples from orthoimagery data that ISO 19157’s elements fail to account for. 2. THE REPRESENTATION APPROACH 2.1 Semiotic triangle as a basis The representation perspective finds its theoretical basis in the science of signs called Semiotics, established from the works of such famous thinkers as Ferdinand de Saussure, Charles Peirce, Charles W. Morris, Umberto Eco or Nelson Goodman, to name a few. Our approach to its application for constructing an ontological view on the quality aspects of spatial data starts with the most basic form of the so-called “semiotic triangle”. The semiotic triangle is meant to illustrate the triple fact: 1) that a symbol materializes as a sign, the form of which is inspired by some conventions, 2) that the symbol points to something, 3) that what the symbol points to is intuited by human intelligence once the form shows itself. The introduction of such concepts from semiotics in cartography or geomatics is not innovative by itself: Jacques Bertin’s Semiology of Graphics (Bertin, 1983) or Alan MacEachren’s How Maps Work (MacEachren, 2004) are illustrious proofs of the epistemological potency of the semiotic paradigm when map-making and spatial data are to be talked or thought about. Figure 1. Notation, Denotation and Connotation DENOTATION CONNOTATION World Applications Signs show serve NOTATION trace Spatial data ISPRS Annals of the Photogrammetry, Remote Sensing and Spatial Information Sciences, Volume II-3/W5, 2015 ISPRS Geospatial Week 2015, 28 Sep – 03 Oct 2015, La Grande Motte, France This contribution has been peer-reviewed. The double-blind peer-review was conducted on the basis of the full paper. Editors: A.-M. Olteanu-Raimond, C. de-Runz, and R. Devillers doi:10.5194/isprsannals-II-3-W5-173-2015 173
Transcript of A Representation-Driven Ontology for Spatial Data … · a representation-driven ontology for...

A REPRESENTATION-DRIVEN ONTOLOGY FOR SPATIAL DATA QUALITY ELEMENTS,
WITH ORTHOIMAGERY AS RUNNING EXAMPLE
J.-F. Hangouët a
a Institut national de l’information géographique et forestière, DPR/SCOP, Saint-Mandé, France, [email protected]
Commission II, WG II/4
KEY WORDS: Spatial data quality concepts, Spatial data quality components, Representation, Semiotics, Orthoimagery ABSTRACT: The many facets of what is encompassed by such an expression as “quality of spatial data” can be considered as a specific domain of reality worthy of formal description, i.e. of ontological abstraction. Various ontologies for data quality elements have already been proposed in literature. Today, the system of quality elements is most generally used and discussed according to the configuration exposed in the “data dictionary for data quality” of international standard ISO 19157. Our communication proposes an alternative view. This is founded on a perspective which focuses on the specificity of spatial data as a product: the representation perspective, where data in the computer are meant to show things of the geographic world and to be interpreted as such. The resulting ontology introduces new elements, the usefulness of which will be illustrated by orthoimagery examples.
1. INTRODUCTION
Ontology is both “the science of ‘what is’” (Vasseur et al., 2006) and, resulting from scientific investigation, any framework apt “to model a field of knowledge” (ibid.). As a specific domain of reality involving numerous intricate notions, spatial data quality has attracted much ontological attention indeed. Approaches to investigate, abstract and organise the fundamentals of this domain vary with the numbers, the names, the definitions and the configurations of the constitutive components they identify. The diversity of the resulting abstractions, or ontologies, shows through the epistemological observations reported in academic monographs on spatial data quality (see e.g. Servigne et al., 2006 or Morrison, 2013). Our communication proposes yet another view on the system of quality elements for spatial data. This view is inspired by, and focuses on, the specificity of spatial data as a man-made product, which lies in their representational status. According to the representation paradigm (here applied to spatial information), data in the computer are forms that are meant first to show (parts of) things of the geographic world and then to be interpreted as such by human or computational processing. When founded on this perspective, quality modelling leads to classify quality components under three major headings: 1) quality of notation, i.e. integrity of the form given to the information, 2) quality of denotation, i.e. exactness of the informational content, 3) quality of connotation, i.e. reliability of the information for given or typical applications. Because it originates from a single explanatory paradigm, this ontological structuring is intrinsically more focused and coherent than composite typologies that omit to state their ontological motivations, such as the now widely-used “data dictionary for data quality” of ISO 19157 (ISO, 2013). Also, the subcategories implied cover a wide range of actual quality issues, as can be illustrated with examples from orthoimagery data that ISO 19157’s elements fail to account for.
2. THE REPRESENTATION APPROACH
2.1 Semiotic triangle as a basis
The representation perspective finds its theoretical basis in the science of signs called Semiotics, established from the works of such famous thinkers as Ferdinand de Saussure, Charles Peirce, Charles W. Morris, Umberto Eco or Nelson Goodman, to name a few. Our approach to its application for constructing an ontological view on the quality aspects of spatial data starts with the most basic form of the so-called “semiotic triangle”. The semiotic triangle is meant to illustrate the triple fact: 1) that a symbol materializes as a sign, the form of which is inspired by some conventions, 2) that the symbol points to something, 3) that what the symbol points to is intuited by human intelligence once the form shows itself. The introduction of such concepts from semiotics in cartography or geomatics is not innovative by itself: Jacques Bertin’s Semiology of Graphics (Bertin, 1983) or Alan MacEachren’s How Maps Work (MacEachren, 2004) are illustrious proofs of the epistemological potency of the semiotic paradigm when map-making and spatial data are to be talked or thought about.
Figure 1. Notation, Denotation and Connotation
DENOTATION
CONNOTATION
World
Applications Signs
show
serve
NOTATION
trace
Spatial data
ISPRS Annals of the Photogrammetry, Remote Sensing and Spatial Information Sciences, Volume II-3/W5, 2015 ISPRS Geospatial Week 2015, 28 Sep – 03 Oct 2015, La Grande Motte, France
This contribution has been peer-reviewed. The double-blind peer-review was conducted on the basis of the full paper. Editors: A.-M. Olteanu-Raimond, C. de-Runz, and R. Devillers
doi:10.5194/isprsannals-II-3-W5-173-2015
173

2.2 Quality of notation
In the continuity of this perspective, now applied to the specific concepts of spatial data quality, what we call “quality of notation” (following one first apex of the semiotic triangle, cf. Figure 1) consists in observing whether the material forms of the actual data follow the prescribed formalism. This aspect addresses both the issue of legibility of data (to the human eye or to the computer system), and that of ease of legibility. Quality elements here are distributed into three major kinds of integrity criteria: conventional integrity of sign, material integrity of sign, and aspectual integrity of sign. The first major kind of integrity, conventional integrity, splits into two subcategories: • formal conformity, i.e. conformity to legend, or to data
model, which hosts conformity to expected computer formats as well as ISO 19157’s “logical consistency”;
• referential conformity, i.e. conformity to the notation systems proper to the applicable spatial, temporal and thematic reference frames.
Material integrity (on the map or in the dataset) encompasses: • integrity of the material form of the data (which for
example is affected when cartographic symbols are poorly printed on the map, or when pixels are disordered in corrupted image files),
• integrity of supporting medium (which tends to be affected with wear and tear on the map paper, or with the aging of an external hard drive).
The third major kind of sign integrity is aspectual integrity, the material form of a sign being expected to be easily discernible under certain physical conditions of displaying. Aspectual integrity includes what we call “continuum of aspect of signs assembled” and “holistic individuality of signs”: • Continuum of aspect of signs assembled addresses the
following phenomenological issue: when reading a collection of signs, human perception expects each of them to look as if its individual material form, whatever its actual origin, resulted from one homogeneously applied manufacturing process. Interpretation is made difficult indeed when its first task is to sort out actual differences in denotation from formal discrepancies in notation. What is more, such perceptual limits tend to replicate in the computerized reading and processing of data. For example, regular performance of tools that mix data from multiple origins requires recourse to some pivot format. It also requires that data, at the moment when they are actually processed, have similar geometric resolutions (for example, similarly resampled or geometrically pruned vector lines). In the domain of collaborative multi-sourcing, such homogeneousness issues are now becoming as crucial as geographical ontology-matching.
• Holistic individuality of signs accounts for the combined expressiveness of signs in their milieu. Local overcrowding of individual signs should be kept at a minimum indeed, and saturation of the supporting medium (where the material imprint of signs forms) must be obviated. This criterion is meant to encompass, albeit in very broad terms, both cartographic generalization and optimization of data encoding.
2.3 Quality of denotation
What we call “quality of denotation” (second apex of the semiotic triangle) accounts for the performance of data at
depicting the actual selves of geographic phenomena. The issue is that of the tracing of the geographic world: is the geographic world to be depicted faithfully shown indeed? Quality elements here include three categories and their subcategories: • Spatial accuracy, which is made of absolute geometric
accuracy (exactness of reported coordinates in a given spatial reference system), of relative geometric accuracy (exactness of reported differences of coordinates in a given spatial reference system), and of topologic accuracy (exactness of non-metric expression of relative spatial positioning),
• Temporal accuracy, which is made of absolute chronometric accuracy (exactness of reported dates in a given calendar), of relative chronometric accuracy (exactness of reported differences of dates in a given calendar), and of chronologic accuracy (exactness of non-metric expression of relative temporal positioning),
• Natural accuracy, which is made of absolute ontic accuracy (exactness of reported essential geographic signatures in a given identification system), of relative ontic accuracy (exactness of reported differences of essential geographic signatures in a given identification system), and of (geographical) ontologic accuracy (exactness of system-independent expression of relative geographic signatures). Here is something that is referenced as a specific road in the actual dataset. Is it nominally a road? Is it nominally that specific road? Is the integrity of that specific road taken care of? Such questions relate to “absolute ontic accuracy”. Here in the actual dataset are two roads that, for whatever traffic or connectivity reason, are set at a specific semantic distance one from the other. Is this the nominal semantic distance between the two? Such a question relates to “relative ontic accuracy”. Here again are two roads, one being presented to be of lesser importance than the other. Is it, nominally, a relatively secondary road? Such a question relates to “ontologic accuracy”.
For the sake of formal parallelism, the sub-categories here are named from analogous morphological constructions: qualificatives “absolute” and “relative” point to characteristics that can be measured with “intuitive” distance metrics (e.g. Euclidean, or Semantic distance), and “-logic” sub-categories address characteristics that are best apprehended as stable through elastic deformations of the underlying reference system (although distances can be mathematically constructed to make these characteristics computationally tractable). These present “space”, “time” and “nature” categories more or less correspond to what spatial data quality literature usually calls “positional accuracy” (or “geometric accuracy”), “temporal accuracy”, and “thematic accuracy” (or “semantic accuracy”) combined with “completeness” (see e.g. Devillers and Jeansoulin, 2006; ISO 19157, 2013; Servigne et al., 2006). However, the scope of the present categories is strictly limited. It is not meant to encompass issues that extend beyond the possible differences between the information contents as provided by the actual data and the expected nominal values. For example, date when a geographical database was last updated, or place where a geographical dataset was last used, are not addressed by the present denotation criteria. Such temporal and spatial issues belong with database management in general, not with spatial information specifically.
ISPRS Annals of the Photogrammetry, Remote Sensing and Spatial Information Sciences, Volume II-3/W5, 2015 ISPRS Geospatial Week 2015, 28 Sep – 03 Oct 2015, La Grande Motte, France
This contribution has been peer-reviewed. The double-blind peer-review was conducted on the basis of the full paper. Editors: A.-M. Olteanu-Raimond, C. de-Runz, and R. Devillers
doi:10.5194/isprsannals-II-3-W5-173-2015
174

2.4 Quality of connotation
What we call “quality of connotation” (third apex of the semiotic triangle) consists in considering data for the way they lend themselves to purposes. In what measure will given spatial data prove reliable for applications? Quality elements here include performance for a variety of basic applications: display, coordinate measurements, distance and length measurements, area measurements, volume measurements, direction measurements, quantity measurements, date measurements, period measurements, overlaying with other specific datasets. Quality elements also include reliability for expert applications, notably in the fields of spatial analysis or image interpretation. This requires application-specific assessment of data in view of users’ needs, which Vasseur et al. 2006 proposed to contextualize within a “Problem Ontology” framework.
3. COMPARISON WITH ISO 19157’S CATEGORIES
It appears that ISO 19157’s categories for quality elements, and their sub-elements, are redistributed in the present representation-driven ontology, which ensures some kind of general compatibility (cf. Table 2).
ISO 19157 approach Representation approach x Notation
Completeness x x Material integrity Omission x Medium integrity
Commission x Aspectual integrity: continuum of aspect of signs assembled
Logical consistency x x Aspectual integrity: holistic Conceptual consist. individuality of signs
Conventional integrity: Domain consist. formal encoding Format consist. Conventional integrity:
Topological consist. referential encoding
Positional accuracy x x Denotation Absolute (external) Space: absolute geometry
Relative (internal) Space: relative geometry Gridded data Space: topology
Time: absolute chronometry Thematic accuracy x Time: relative chronometry
Classification Time: chronology correctness Nature: absolute ontic
Non-quantitative x Nature: relative ontic attribute correctness x Nature: ontology
Quantitative attribute accuracy Connotation
x Display Temporal quality x x Quantity measurements
Accuracy of x Position measurements a time measurement x Distance measurements
Temporal x Length measurements consistency x Area measurements
Temporal validity x Volume measurements x Direction measurements
Usability element x Date measurements x Period measurements x Overlaying x Expert usage: spatial analysis x Expert usage: remote sensing
Table 2. Indicative kinship links between ISO 19157’s and Representation-driven ontologies for spatial data quality elements
Some quality concepts from ISO 19157 can be considered to be more developed in the present ontology. This is the case of the “usability” element, which in ISO 19157 (§7.4.7) covers in comprehension the issue of conformance to specific user requirements. Renamed “quality of connotation”, this element is now given a tentative definition in extension, by means of an explicit list of frequent basic applications (cf. §2.4 above).
ISO 19157’s “logical consistency” (§7.4.3) also finds extension in our model. Flanked with additional subcategories in the “quality of notation” category, it is no longer the only element available when strictly formal issues have to be addressed. Some quality sub-elements are reclassified. For example, “temporal validity” in ISO 19157 belongs with the “Temporal quality” group (ISO 19157, §7.4.6). This particular sub-element is dedicated to the reporting of invalid temporal data such as “March 33”. No longer part of “Temporal accuracy” in the present ontology, this element is considered as belonging with the “quality of notation” family instead. This is because “conventional integrity” in our model covers the requirement that dates (as well as spatial positions indeed, and geographical ontological identifications) be indicated in conformance with the codification specified by the applicable temporal (resp. spatial, ontological) frame of reference. Element “completeness” from ISO 19157 is also reclassified. No longer left as a first-rank category by itself, it is subsumed in the “absolute ontic accuracy” subcategory in the “quality of denotation” category. This does not mean that omissions or commissions in the data are given secondary or even tertiary consideration. But because they affect the informational content of the data, they belong with denotation issues. And because they distort the geographical nature of the phenomena depicted, they belong with “absolute ontic accuracy”. New elements appear, such as what we call “continuum of aspect of signs assembled”, and “holistic individuality of signs assembled” (cf. §2.2 above).
4. ASSESSMENT METHODS PER CATEGORIES
Elements in this semiotically-structured way of presenting Spatial Data Quality come with their pragmatically preferred methods of assessment. 4.1 Automated and visual methods
Legibility of data (pertaining to “quality of notation”), being mostly a matter of logical consistency, can be fully automatedly assessed, while visual or expert judgement is most efficient for assessing ease of legibility (i.e. for “aspectual integrity”, also pertaining to “quality of notation”). 4.2 Comparison with reference data
Error measurements, relying on the use of well-defined (or well-known) though sampled reference data, are preferred for the assessment of quality of denotation. The statistics involved deal with variables that are either continuous (for absolute and relative spatial and temporal positioning) or discrete (for ontological classifications and logical spatial, temporal or ontological relations). 4.3 Error models in data and applications
Even if error measurements can be used to assess quality of connotation, error modelling may prove more efficient, at least in terms of understanding and control of the production process. It poses, indeed, such challenging questions as “What is the distribution of errors in the data?”, “Is it specific or normal?”, “If the distribution is specific, in what measure does
ISPRS Annals of the Photogrammetry, Remote Sensing and Spatial Information Sciences, Volume II-3/W5, 2015 ISPRS Geospatial Week 2015, 28 Sep – 03 Oct 2015, La Grande Motte, France
This contribution has been peer-reviewed. The double-blind peer-review was conducted on the basis of the full paper. Editors: A.-M. Olteanu-Raimond, C. de-Runz, and R. Devillers
doi:10.5194/isprsannals-II-3-W5-173-2015
175
it depart from the normal distribution?”, “What are the effects on the distribution of errors in basic applications?” etc.
5. ORTHOIMAGERY AS EXAMPLE
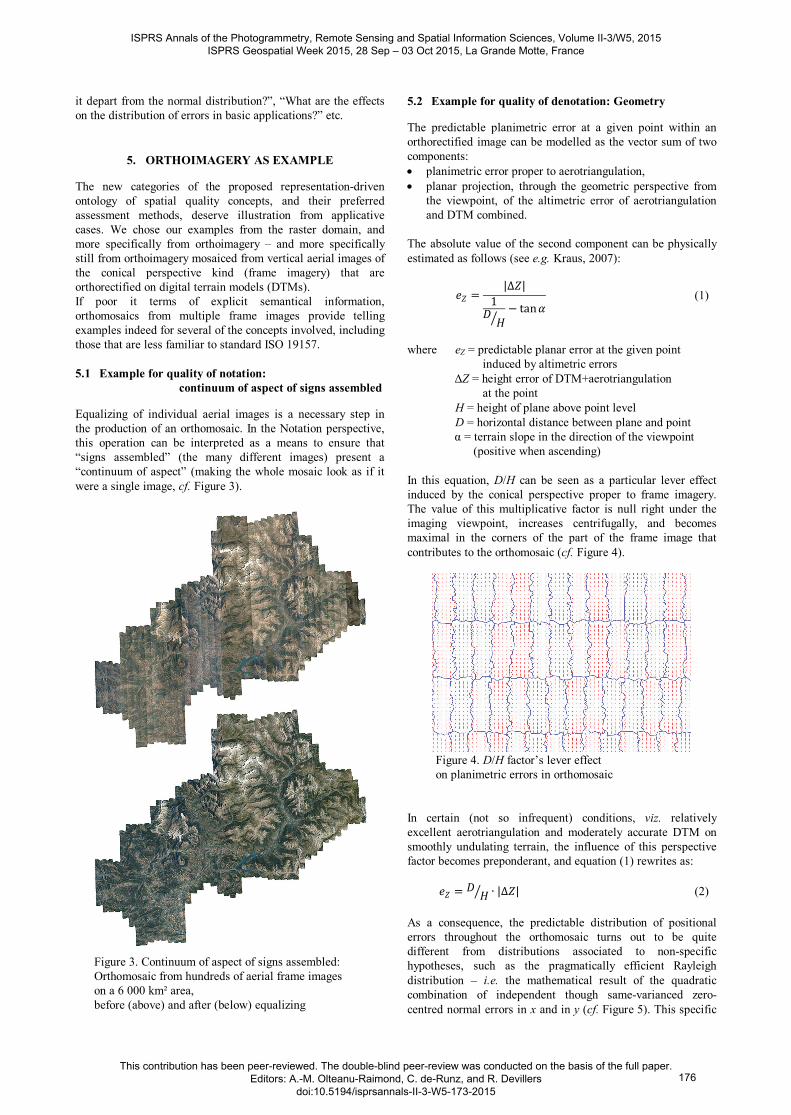
The new categories of the proposed representation-driven ontology of spatial quality concepts, and their preferred assessment methods, deserve illustration from applicative cases. We chose our examples from the raster domain, and more specifically from orthoimagery – and more specifically still from orthoimagery mosaiced from vertical aerial images of the conical perspective kind (frame imagery) that are orthorectified on digital terrain models (DTMs). If poor it terms of explicit semantical information, orthomosaics from multiple frame images provide telling examples indeed for several of the concepts involved, including those that are less familiar to standard ISO 19157. 5.1 Example for quality of notation:
continuum of aspect of signs assembled
Equalizing of individual aerial images is a necessary step in the production of an orthomosaic. In the Notation perspective, this operation can be interpreted as a means to ensure that “signs assembled” (the many different images) present a “continuum of aspect” (making the whole mosaic look as if it were a single image, cf. Figure 3).
Figure 3. Continuum of aspect of signs assembled: Orthomosaic from hundreds of aerial frame images on a 6 000 km² area, before (above) and after (below) equalizing
5.2 Example for quality of denotation: Geometry
The predictable planimetric error at a given point within an orthorectified image can be modelled as the vector sum of two components: • planimetric error proper to aerotriangulation, • planar projection, through the geometric perspective from
the viewpoint, of the altimetric error of aerotriangulation and DTM combined.
The absolute value of the second component can be physically estimated as follows (see e.g. Kraus, 2007):
𝑒𝑒𝑍𝑍 =|∆𝑍𝑍|
1𝐷𝐷𝐻𝐻�− tan𝛼𝛼
(1)
where eZ = predictable planar error at the given point induced by altimetric errors ΔZ = height error of DTM+aerotriangulation at the point H = height of plane above point level D = horizontal distance between plane and point α = terrain slope in the direction of the viewpoint (positive when ascending) In this equation, D/H can be seen as a particular lever effect induced by the conical perspective proper to frame imagery. The value of this multiplicative factor is null right under the imaging viewpoint, increases centrifugally, and becomes maximal in the corners of the part of the frame image that contributes to the orthomosaic (cf. Figure 4).
Figure 4. D/H factor’s lever effect on planimetric errors in orthomosaic
In certain (not so infrequent) conditions, viz. relatively excellent aerotriangulation and moderately accurate DTM on smoothly undulating terrain, the influence of this perspective factor becomes preponderant, and equation (1) rewrites as:
𝑒𝑒𝑍𝑍 = 𝐷𝐷𝐻𝐻� ∙ |∆𝑍𝑍| (2)
As a consequence, the predictable distribution of positional errors throughout the orthomosaic turns out to be quite different from distributions associated to non-specific hypotheses, such as the pragmatically efficient Rayleigh distribution – i.e. the mathematical result of the quadratic combination of independent though same-varianced zero-centred normal errors in x and in y (cf. Figure 5). This specific
ISPRS Annals of the Photogrammetry, Remote Sensing and Spatial Information Sciences, Volume II-3/W5, 2015 ISPRS Geospatial Week 2015, 28 Sep – 03 Oct 2015, La Grande Motte, France
This contribution has been peer-reviewed. The double-blind peer-review was conducted on the basis of the full paper. Editors: A.-M. Olteanu-Raimond, C. de-Runz, and R. Devillers
doi:10.5194/isprsannals-II-3-W5-173-2015
176

distribution is constrained by the sizes and elongations of the mosaiced cells. It should be taken into account by the statistical inference processes involved in the assessment of geometric accuracy in terms of mean values, standard deviations and confidence intervals.
Figure 5. Distribution of planimetric errors in orthomosaic for a given camera and flight plan configuration with σDTMz = 15.σAxy (σDTMz: altimetric precision of DTM; and σAxy: planimetric precision of aerotriangulation)
5.3 Example for quality of denotation: Ontic
Predictable planimetric error eZ in equation (1) was presented as an absolute value, while the formula included a difference of two quantities. Can the difference be negative? Physically, it can be indeed, when terrain slope at the given point is steeper than angle from horizon to viewpoint (cf. Figure 6). However, this does not mean that the given detail will be misplaced on the orthoimage. It means, quite differently, that it will not show up at all, being hidden from the viewpoint by interposing terrain forms. The denotation issue at stake is no longer of the geometric kind, but of the ontic kind, and should be treated as such, i.e. as omission. Through the orthorectification process, other geographic details will show instead: those from the visible parts of ground that are aligned between viewpoint and hidden point. These unduly duplicated details contribute to commission (cf. Figure 7).
Figure 6. Local slope as mask from viewpoint Completeness in orthoimagery is also affected by other factors: • Topographic peaks, trees, buildings, and other elevated
structures, as well as aerial structures or phenomena, may also interpose between ground and viewpoint. They are photographed in place of the expected ground information, and mask it.
• Positive DTM errors (i.e. elevation data above nominal ground) tend to constrict topography on a single orthorectified image, while negative errors tend dilate it. As a consequence, on the seamline junction between two images, details are duplicated or erased, respectively.
Figure 7. Precipitous chalk cliff on the French coast: shore platform (sea, foam and rocks) and land on bedrock (harvested field and wood) as showing on two orthorectified images, one with a strictly vertical viewpoint (above) and the other with a southern viewpoint (below). Ontic accuracy in the latter is poor: littoral details are missing, replaced by spuriously duplicated land details.
5.4 Two examples for quality of connotation
The model of predictable planimetric errors can also serve as a basis for further statistically-quantifiable models meant to estimate the performances of various applications, i.e. to assess quality of connotation. Errors in the measurements of positions, of lengths or of areas on an orthomosaic can be predicted with more statistical confidence indeed when the distribution of planimetric errors is taken into account. For example, errors in area measurement can be deduced from the known positional errors of the limiting polygon, as already shown and mathematically expressed by Oort et al., 2005, for vector data. Similar considerations applied to orthoimagery data, with a model for planimetric errors based on equation (2), in realistic acquisition conditions where lever D/H’s maximal value is about 1/3, show relative errors in area measurements to be of the magnitudes reported in Table 8. The full statistical implications of such figures as given in Table 8 require knowledge of the distribution of DTM errors and of the distribution of intersections between geographical polygons and mosaicing graph. Calculations mixing those elements lead to conclusions of actual pertinence for users, such as: “If the area of an average cultural parcel is to be measured on the French orthoimagery product named
H
Terrain
Viewpoint
D
α
atan(H/D)
ISPRS Annals of the Photogrammetry, Remote Sensing and Spatial Information Sciences, Volume II-3/W5, 2015 ISPRS Geospatial Week 2015, 28 Sep – 03 Oct 2015, La Grande Motte, France
This contribution has been peer-reviewed. The double-blind peer-review was conducted on the basis of the full paper. Editors: A.-M. Olteanu-Raimond, C. de-Runz, and R. Devillers
doi:10.5194/isprsannals-II-3-W5-173-2015
177

BD ORTHO®, a 10% error will not occur more than once in 400 000 cases” (an event which, by the way, is still rarefying, more and more accurate DTMs being used to produce BD ORTHO®).
Local altimetric error of DTM |ΔZ| = 2m |ΔZ| = 10m Nominal area of parcel (ha) 1 16 1 16 Parcel within cell 0.1% 0.1% 0.5% 0.5% Parcel astride cell’s longer side 0.5% 0.1% 2.5% 0.6% Parcel astride cell’s shorter side 1.5% 0.4% 7.5% 2.0% Parcel over a cell corner 2.0% 0.5% 10.0% 2.5%
Table 8. Relative errors in area measurement on orthoimagery: contribution of the perspective lever effect for (D/H)max = 1/3 Of course, besides positional errors in the image, other quantifiable factors affect the performance of area measurements on orthomosaics, notably: • Projection, when non-equivalent. • Projection, because it reduces slope area to horizontal area. • Interpretation, when it neglects the occlusion effect of
relatively tall trees or buildings when delineating ground limits.
• Interpretation, when it is biased, e.g. when limits tend to be delineated either as the largest polygon that can be inscribed within the geographic area identified in the image, or on the contrary as the smallest circumscribing polygon. This factor is usually the most important of all.
The model of planar errors can also serve as a basis for modelling the performance of other kinds of applications. For example, it can contribute to the assessment of the distribution of planar discrepancies when two orthomosaics are overlaid (cf. Figure 9).
Figure 9. D/H lever effect for a second orthomosaic covering the same area as in Figure 4 (above) and differences between the D/H lever effects of the two orthomosaics (below)
6. CONCLUSION
The limits of our representational approach, when it comes to organize the many concepts of spatial data quality, deserve discussion. The ontology of quality aspects we propose does not pretend at completeness (both because ontological modelling is inherently non exhaustive, whatever the conception efforts, and because our approach tightly focuses on the representation role of geographic data). Nor does it aim at supplanting the now widely accepted and highly practical “data dictionary for data quality” of ISO 19157. It is merely an invitation to look at apparently basic concepts anew.
ACKNOWLEDGEMENTS
The author wishes to thank the anonymous reviewers for their expert suggestions on formal issues. He also thanks Thierry Prin and Joël Peron for their stimulating discussions on spatial data quality, and Olivier Dissard and Pierre-Yves Curtinot for having shared their inspiring expertise in quality of photogrammetric data and processes.
REFERENCES
Bertin, J., 1983 [first publ. 1967]. Semiology of Graphics: Diagrams, Networks, Maps, University of Wisconsin Press, Madison.
Devillers, R., Jeansoulin, R., 2006. Spatial Data Quality: Concepts. In: Devillers, R., and Jeansoulin, R., Fundamentals of Spatial Data Quality, ISTE – GIS Series, London, pp. 31-42.
ISO, 2013. Geographic information — Data quality, ISO 19157:2013(en), Geneva, pp. 6-15.
Kraus, K., 2007 [first publ. 1982]. Photogrammetry, de Gruyter, Berlin - New York, pp. 366-399.
McEachren, A., 2004 [first publ. 1995]. How Maps Work: Representation, Visualization, and Design, The Guilford Press, New York, pp. 217-243.
Morrison, J., 2013 [first publ. 1995]. Spatial data quality. In Guptill, S., and Morrison, J. (eds), Elements of Spatial Data Quality, ICA-ACI, Pergamon, Oxford, pp. 1-12.
Servigne, S., Lesage, N., Libourel, Th., 2006. Quality Components, Standards and Metadata. In: Devillers, R., and Jeansoulin, R., Fundamentals of Spatial Data Quality, ISTE – GIS Series, London, pp. 179-210.
Van Oort, P., Stein, A., Bregt, A.K., De Bruin, S., Kuipers, J., 2005. A variance and covariance equation for area estimates with a Geographical Information System. Forest Science, 51, pp. 347-356.
Vasseur, B., Jeansoulin, R., Devillers, R., Frank, A., 2006. External Quality Evaluation of Geographical Applications: An Ontological Approach. In: Devillers, R., and Jeansoulin, R., Fundamentals of Spatial Data Quality, ISTE – GIS Series, London, pp. 255-270.
ISPRS Annals of the Photogrammetry, Remote Sensing and Spatial Information Sciences, Volume II-3/W5, 2015 ISPRS Geospatial Week 2015, 28 Sep – 03 Oct 2015, La Grande Motte, France
This contribution has been peer-reviewed. The double-blind peer-review was conducted on the basis of the full paper. Editors: A.-M. Olteanu-Raimond, C. de-Runz, and R. Devillers
doi:10.5194/isprsannals-II-3-W5-173-2015
178