A Report on the Impact of Lactation Consultant Services...
21
January 30, 2015 1 Georgia Health Policy Center A Report on the Impact of Lactation Consultant Services and Breastfeeding Presented to: Healthy Mothers, Healthy Babies Coalition of Georgia
Transcript of A Report on the Impact of Lactation Consultant Services...
January 30, 2015 1 Georgia Health Policy Center
A Report on the Impact of
Lactation Consultant Services and
Breastfeeding
Presented to:
Healthy Mothers, Healthy Babies Coalition of Georgia
January 30, 2015 2 Georgia Health Policy Center
A Report on the Impact of Lactation Consultant Services and Breastfeeding
Table of Contents
Background ...................................................................................................................................................... 1
Federal Recommendations......................................................................................................................... 1
Purpose .............................................................................................................................................................. 2
Data Summary ................................................................................................................................................. 2
Key Questions .................................................................................................................................................. 5
Summary ........................................................................................................................................................ 14
Appendices
Appendix A: Medicaid Mothers’ Responses to Breastfeeding Questions
This report was prepared for Healthy Mothers, Healthy Babies Coalition of Georgia by representatives of the Georgia Health Policy Center at Georgia State University:
Debra Kibbe, Senior Research Associate, Georgia Health Policy Center
Bo Feng, Doctoral Student, Department of Public Management and Policy (PMAP), Andrew Young School of Policy Studies
Angela Snyder, Assistant Research Professor, PMAP; Associate Director, Georgia Health Policy Center

1 Georgia Health Policy Center
Background International Board Certified Lactation Consultants (IBCLCs) are health care professionals (HCPs) who specialize in helping new mothers in the management of breastfeeding (BF). Certification of these HCPs is administered by the International Board of Lactation Consultant Examiners®, Inc. (under the direction of the US National Commission for Certifying Agencies). Evidence indicates that, on discharge, rates of exclusive BF and any BF are higher among women who have delivered their babies in hospitals with IBCLCs on staff than in those without these professionals.1,2 Due to having specific clinical expertise and training in the clinical management of complex problems with lactation, the 2011 Surgeon General’s Call to Action to Support Breastfeeding3 suggests that IBCLCs become “covered providers” for insurance coverage purposes. Specifically, the report states:
Provide reimbursement for IBCLCs independent of their having other professional certification or licensure. The taxonomy for health care clinicians defines qualifications of clinicians to be reimbursed. One option for reimbursement would be to place certified lactation consultants within the category of “nursing service related providers,” and specifying the nature of care they provide would allow for reimbursement of IBCLCs without requiring that they are also registered nurses. Alternatively, developing state licensure of lactation consultants could help to achieve the same purpose. (p. 48)
Healthy Mothers, Healthy Babies Coalition of Georgia (HMHB) introduced House Bill (HB) 363 in 2013. HB 363’s main purpose was to establish a licensure process for lactation consultants in Georgia. The Georgia Occupational Regulation Review Council reviewed the information from HMHB as well as its own information and chose not to recommend passage of House Bill 363 (LC 33 5015) mainly due to the cost associated with the licensure process and associated reimbursement via Medicaid. Federal Recommendations and Guidelines
A number of Healthy People 20204 recommendations for Maternal, Infant, and Child Health (MICH) focus on BF. MICH-21 is to “Increase the proportion of infants who are breastfed.” Specific BF recommendations and targets are presented below:
1. MICH-21.1 Increase () the proportion of infants who are ever BF: baseline 74% / target 81.9%
2. MICH-21.2 the proportion of infants who are BF at 6 months: baseline 43.5% / target 60.6%
1 Castrucci BC, Hoover KL, Lim S, Maus KC. A comparison of breastfeeding rates in an urban birth cohort among women delivering infants at hospitals
that employ and do not employ lactation consultants. J Public Health Manag Pract 2006;12:578–585. 2 Bonuck KA, Trombley M, Freeman K, McKee D. Randomized controlled trial of a prenatal and postnatal lactation consultant intervention on duration and
intensity of breastfeeding up to 12 months. Pediatrics 2005;116:1413–1426. 3 U.S. Department of Health and Human Services. The Surgeon General’s Call to Action to Support Breastfeeding. Washington, DC: U.S. Department of Health and Human Services, Office of the Surgeon General; 2011. 4 U.S. Department of Health and Human Services. Healthy People 2020. Maternal, Infant and Child Health Objectives. Accessed September 11, 2014 at:
http://www.healthypeople.gov/2020/topics-objectives/topic/maternal-infant-and-child-health/objectives.

2 Georgia Health Policy Center
3. MICH-21.3 the proportion of infants who are BF at 1 year: baseline 22.7% / target 34.1%
4. MICH-21.4 the proportion of infants who are BF exclusively thru 3 months: baseline 33.6% / target 46.2%
5. MICH-21.5 the proportion of infants who are BF exclusively thru 6 months: baseline 14.1% / target 25.5%
The American Academy of Pediatrics (AAP) recommends exclusive BF for the first 6 months of life. AAP further recommends BF continue up to 1 year as complementary foods are introduced into an infant’s diet.5 Purpose The purpose for this report is to identify the impacts -- on families, insurers, and the state of Georgia (GA) – that result from breastfeeding. Specifically, HMHB requested an analysis of the cost savings associated with having licensed IBCLCs providing support services and breastfeeding consultant services in clinical settings in GA. This analysis focused on the evidence regarding the role of IBCLCs in breastfeeding cost savings or increased expenditures. To the extent possible, the cost impact analysis in GA includes the percentage of Medicaid mothers in GA who initiate breastfeeding, an estimate of the percentage of mothers who would use IBCLC services if available, the costs associated with IBCLC services/visits, and costs associated with diminished risk of specific conditions or enhanced health due to breastfeeding vs. formula feeding. Data Summary Breastfeeding
Between 2006 and 2013, BF rates have continued to rise in the United States. While initiation was almost 80% in 2011, the BF duration recommendations are not being achieved by the majority of women.6 The Centers for Disease Control and Prevention (CDC) reports (p. 2): “Of infants born in 2011, 49% were BF at 6 months and 27% at 12 months.”8 As noted above, the targets for these behaviors are 60.6% and 34.1% respectively.
The GA Supplemental Nutrition Program for Women, Infants and Children (WIC) provides BF peer counselor support for low income mothers in all 18 health districts. GA WIC reports7 the percent of low income mothers who initiate BF and infants who are breastfed at least 6 months has remained relatively stable over time, but still below national benchmarks. Table 1 summarizes GA WIC BF data from 2011 to 2014.
5 American Academy of Pediatrics Section of Breastfeeding. Policy statement: breastfeeding and the use of human milk. Pediatrics. 212;129:e827-41. 6 Centers for Disease Control and Prevention. Breastfeeding report card United States 2014. Retrieved October 2, 2014 from http://www.cdc.gov/breastfeeding/pdf/2014breastfeedingreportcard.pdf. 7 Stormant T, Georgia Department of Public Health Supplemental Nutrition Program for Women, Infants and Children. Georgia WIC Breastfeeding Gold Standard. Presented to Healthy Mothers, Healthy Babies Coalition of Georgia. October 7, 2014.

3 Georgia Health Policy Center
Table 1. Georgia WIC Breastfeeding Rates Year % initiate BF % infants BF 6
months 2011 55.18 35.20 2012 57.19 34.48 2013 57.80 35.58 2014 (as of Oct 2014) 57.21 35.55
Breastfeeding data reported on the U.S. Standard Certificate of Live Birth8 from 2009 to 2012 was obtained from the Georgia Department of Public Health (GDPH).9 This information is reviewed in detail in Key Question #1 later in this document.
There is good news. From 2009 to 2012, the percent of mothers in Georgia answering “yes” to the question on the birth certificate “Is the infant being breastfed at discharge?” is increasing across all payment methods (e.g. insurance types). Importantly, 15% more of Medicaid mothers were BF at discharge in 2012 vs. in 2009.9 This information is summarized in Table 2.
Table 2. Percent of “Yes” Responses to BF at Discharge by Insurance Type by Year9
Payment Year Increase in %
Type 2009 2010 2011 2012 2009 to 2012
Medicaid 43.19 45.91 50.42 58.37 15%
Private 71.15 71.83 75.36 82.05 11%
Self-Pay 57.19 58.71 63.84 70.87 14%
Other 58.17 63.41 67.99 70.99 13%
Unknown 24.45 22.61 32.57 44.33 20%
When comparing BF data from southern states to the United States percentages, one can see similarities and differences as presented in Table 3. The 70.3% of GA women who ever breastfed in 2011 is an increase from the 66% reported in the 2006 National Immunization Survey. With the exception of North Carolina, southern state BF rates are far below the national average. To compare, in 2011, mothers in Vermont and California reported the highest rates of exclusive BF at 3 months exceeding 56%, and more than 27% mothers in Vermont and Alaska reported exclusive BF at 6 months.9
8 Centers for Disease Control and Prevention. U.S. Standard Certificate of Live Birth. Retrieved August 21, 2014 from: http://www.cdc.gov/nchs/data/dvs/birth11-03final-ACC.pdf 9 Georgia Department of Public Health. State Office of Vital Records. Live Birth Certificate Data by Health District and County, 2009-2012.

4 Georgia Health Policy Center
Table 3. Comparison of Breastfeeding Rates (as a %) among Southern States, 201110
State Ever
Breastfed
BF at BF at Exclusive
BF Exclusive
BF 6
months 12
months at 3
months at 6
months
Alabama 67.3 32.1 11.8 26.6 13.2
Georgia 70.3 40.1 20.7 27.2 14.5
Mississippi 61.5 28.9 10 28.8 10.1
N Carolina 77.2 48.3 24.5 42.6 20.7
S Carolina 73.4 37.4 14 32 13.4
Tennessee 74.9 40.7 20.9 39.1 15.4 United States 79.2 49.4 26.7 40.7 18.8
Lactation Support
Since 2006, CDC’s Breastfeeding Report Card has tracked the number of International Board Certified Lactation Consultants (IBCLCs) per 1,000 live births.8 In 2006, in the U.S., the number of IBCLCs was 2.1 per 1,000 live births. Nationally, this number increased to 3.5 per 1,000 live births in 2013. Continuing to increase the number of IBCLCs in Georgia is an important goal as evidence suggests that support by an individual trained in lactation services both in and after the hospital can influence BF initiation and duration.11, 12 Currently, Georgia is below the national average in terms of the number of IBCLCs per 1,000 live births at 2.5; the total number of IBCLCs in Georgia is 326.
The CDC report8 also examines a number of indicators by state to assess BF support. A subset of the indicators is presented below including:
Results on the Maternity Practices in Infant Nutrition and Care (mPINC) survey: This is a national survey of maternity care practices and policies.13 The survey is administered by CDC to all hospitals and birth centers with registered maternity beds in the US and Territories. CDC calculates scores for every facility and state to indicate their performance on the mPINC survey.
10 Centers for Disease Control and Prevention. National Immunization Survey. 2011 births. 11 Castrucci BC, Hoover KL, Lim S, Maus KC. Availability of lactation counseling services influences breastfeeding among infants admitted to to neonatal intensive care units. Am J Health Promot. 2007 May-Jun;21(5):410-5. 12 Fu I, Fong D, Heys M, Lee I, Sham A, Tarrant M. Professional breastfeeding support for first-time mothers: a multicentre cluster randomised controlled trial. BJOG. 2014 Dec;121(13):1673-83. 13 Centers for Disease Control and Prevention. Maternity Practices in Infant Nutrition and Care. Retrieved October 15, 2014 from: http://www.cdc.gov/breastfeeding/data/mpinc/index.htm

5 Georgia Health Policy Center
Baby-Friendly Facility Live Births: The Baby-Friendly Hospital Initiative (BFHI) is a global program launched by the World Health Organization and the United Nations Children’s Fund (UNICEF) in 1991 to encourage and recognize hospitals and birthing centers that implement best practices for infant feeding and mother/baby bonding.
Number of Certified Lactation Counselor (CLCs) and IBCLCs per 1000 live births.
Whether or not the state’s child care regulations support breastfeeding onsite.
Key Questions Key Question #1: What is the estimated percentage of Georgia Medicaid Mothers who currently initiate breastfeeding?
Based on an examination of national and state trends in breastfeeding, particularly in the largest counties in GA, the estimated average percentage of GA Medicaid moms who currently initiate breastfeeding is 61.17%.14 Georgia Data: Information from Georgia’s Live Birth Certificate data set allows us to estimate the percentage of Georgia infants who were being breastfed at discharge by insurance type.9 Specifically:
Question 38 on the Certificate asks the respondent to identify the “Principal Source of Payment for this Delivery.” Answer options include: Private Insurance, Medicaid, Self-Pay, Other (Specify). The GDPH-provided data also includes the number and percent of responses for “Unknown” payment type by year.
14 Centers for Disease Control and Prevention. PRAMS On-line Data for Epidemiologic Research. Access online August 25, 2014 at: http://apps.nccd.cdc.gov/cPONDER/default.aspx?page=DisplayAllYears&state=6&year=0&category=
3&variable=5&view=2&boc=Break%20Out%20by%20Medicaid%20recipient%20%28at%20any%20time%29&selection=0
Table 4. Breastfeeding Support Indicators among Southern States7 (p.5)
State
Average mPINC Score
% of live births
occurring at Baby-Friendly
Facilities
% of breastfed infants
receiving formula before 2 days of age
# of CLCs per 1000 live births
# of IBCLCs
per 1000 live
births
State’s child care
regulation supports onsite BF
Alabama 67 2.50 27.0 1.49 2.38 No
Georgia 69 0 27.1 6.69 2.50 No
Mississippi 59 0 15.1 0.57 1.81 Yes
N Carolina 75 9.75 14.3 0.96 4.91 Yes
S Carolina 78 9.25 22.6 2.76 2.73 No
Tennessee 67 0.13 14.6 4.13 2.21 No
U.S. 75 7.79 19.4 3.84 3.48 7 states

6 Georgia Health Policy Center
Question 58 on the Certificate asks “Is the infant being breastfed at discharge?” with “Yes” or “No” as the answer options.
Among all payer types, the percent responding “yes” to BF at discharge has steadily risen over time: 2009 = 50.9%; 2010 = 53.7%; 2011 = 59.2%; and 2012 = 67.5%. In 2009, 43.19% of Georgia mothers on Medicaid (n=24,796) indicated “yes” to the BF initiation at discharge. In 2012, the percent of live births covered by Medicaid with a positive response was 58.37% (n=34,031); an increase of 15.9%.
Chart 1. Percent of “Yes” Responses on Breastfeeding at Discharge Question by Year by Insurance Type
Chart 1 demonstrates that BF at discharge is increasing across all payment types. The Georgia counties with the largest number of annual births (2009 to 2012) covered by Medicaid are DeKalb, Fulton, Gwinnett, Cobb, and Clayton. Chart 2 provides a snapshot of the percentage of infants BF at discharge covered by Medicaid for the GA counties with the highest birth volumes over a four year period. Hall County was excluded from this summary due to the fact that the data was inconsistent over time.

7 Georgia Health Policy Center
Chart 2. Percent of “Yes” Responses on Breastfeeding at Discharge Question for Medicaid Births by Year for Georgia Counties with Highest Number of Annual Births
In 2011, 50% of Georgia’s Medicaid mothers indicated they were still breastfeeding four weeks after delivery; that number dropped to 39.3% at 8 weeks post-delivery. More detailed tables on Medicaid mothers’ responses to BF questions are presented in Appendix A. For additional details on the BF data from the Live Birth Certificate, Table 5 presents information by Health District and two types of payment (Medicaid vs. Private).
Table 5. Total Number of Births by Health District and Number / Percent of “Yes” Responses to BF at Discharge by GA Health District for 2 Insurance Types
HEALTH DISTRICT (HD)
# BIRTHS (Source: OASIS, 2012)
Medicaid: Total # “YES”
Responses (2012)
Medicaid: % of Yes
Responses (2012)
Private: Total # “YES”
Responses (2012)
Private: % of Yes
Responses (2012)
Clayton County HD (Jonesboro) Total
4155 818 34.7 547 67.4
Coastal HD (Savannah) Total 9205 1770 45.5 1598 72.2
Cobb/Douglas HD Total 11090 2833 74.9 4744 86.8
DeKalb HD Total 11003 4024 83.4 3417 88.5
East Central HD (Augusta) Total 6366 1929 54.3 1405 82.6
East Metro HD (Lawrenceville) Total
13421 3724 76.3 4335 84.3
Fulton HD Total 12622 2765 60.9 4666 85.7
LaGrange HD Total 9247 2411 54.7 3059 80.1
North Central HD (Macon) Total 6745 1616 41.4 1574 78.5
North Georgia HD (Dalton) Total 5337 1320 74.5 1818 83.7

8 Georgia Health Policy Center
HEALTH DISTRICT (HD)
# BIRTHS (Source: OASIS, 2012)
Medicaid: Total # “YES”
Responses (2012)
Medicaid: % of Yes
Responses (2012)
Private: Total # “YES”
Responses (2012)
Private: % of Yes
Responses (2012)
North HD (Gainesville) Total 7382 2583 82.4 2487 88.7
Northeast HD (Athens) Total 5747 1501 57.1 1799 81.4
Northwest HD (Rome) Total 7843 2301 60.3 2321 79.9
South Central HD (Dublin) Total 1696 372 33.0 229 64.9
South HD (Valdosta) Total 3493 1003 43.1 317 53.6
Southeast HD (Waycross) Total 4764 1324 45.1 603 65.7
Southwest HD (Albany) Total 4770 718 38.6 339 67.3
West Central HD (Columbus) Total
5226 1019 39.5 672 76.5
2012 Totals 130,112 34,031 58.4% 35,930 82.1%
National Data: Chart 3 below summarizes Georgia data analyzed by CDC, from 2004 to 2011, regarding whether a mother has ever breastfed or pumped breast milk to feed their new baby after delivery.14 Chart 3. Have you ever breastfed or pumped breast milk to feed your new baby after delivery? %
of “yes” responses, 2004 to 2011, State of Georgia
Key Question #2: What is the estimated number of Georgia women on Medicaid who would need or utilize the services of International Board Certified Lactation Consultants (IBCLCs) if these health care providers were available?

9 Georgia Health Policy Center
The latest published data shows that in 2012, Georgia had 130,112 live births. Of those deliveries, approximately 44.8% were Medicaid recipients9 (58,304 women). Of the 58,304 women, 61.17% (as stated above) will initiate breastfeeding. Therefore, Georgia has an estimated 35,665 breastfeeding Medicaid recipients. Research indicates that approximately 75% of BF mothers have difficulty;15,16,17,18 therefore, in 2012, Georgia had approximately 26,748 women on Medicaid who could have benefited from the assistance of an IBCLC. There is a related issue regarding whether every women who requires breastfeeding clinical care has access to an IBCLC in her area. As explored further below, it is clear that Georgia is experiencing a shortage of IBCLCs to support BF initiation, duration and education. Strategies to improve this situation may include licensure, increasing the number of baby-friendly hospitals, and supporting education and certification for breastfeeding peer counselors in the WIC setting to achieve the requirements to obtain IBCLC designation.
IBCLC Staffing Requirements A 2006 study reviewed lactation program productivity reports at a large teaching hospital with an estimated 4200 births per year.19 The study examined hours worked by IBCLCs over two years and categorized these hours into specific activities. Then, the authors developed ratios for “optimal IBCLC staffing” for each activity. Information from the publication is summarized below:
mother/baby inpatient requires 1 full-time equivalent (FTE) per 783 BF couplets;
neonatal intensive care unit (NICU) inpatient requires 1 FTE per 235 infant admits;
mother/baby outpatient requires 1 FTE per 1292 BF couplets discharged;
NICU outpatient requires 1 FTE per 818 BF infants discharged;
telephone follow-up requires 1 FTE per 3915 BF couplets or infants discharged;
education requires 0.1 FTE per 1000 deliveries; program development/administration requires 0.1 FTE per 1000 deliveries; and
research requires 0.1 to 0.2 FTE total.
In July 2010, the United States Lactation Consultant Association (USLCA) released staffing recommendations for the inpatient setting.20 For a Level III (tertiary care) hospital or facility, the recommendation is 1.9 FTEs per 1000 deliveries per year. A Level II neonatal service hospital would have 1.6 FTEs and a Level I facility 1.3 FTEs per 100 deliveries per year.
15 Perrine CG, Scanlon KS, et al. Baby-friendly hospital practices and meeting exclusive breastfeeding intention. Pediatrics. 2012 Jul;130(1):54-60. 16 Odom E et al. Reasons for earlier than desired cessation of breastfeeding. Pediatrics. 2013 Mar;131(3):e726-32. 17 Wagner EA, Chantry CJ, et al. Breastfeeding concerns at 3 and 7 days postpartum and feeding status at 2 months. Pediatrics. 2013 Oct;132(4):e865-75. 18 Chantry CJ. Supporting the 75%: Overcoming barriers after breastfeeding initiation. Breastfeed Med. 2011 Oct;6:337-9. 19 Mannel R, Mannel RS. Staffing for hospital lactation programs: Recommendations from a tertiary care teaching hospital. J Hum Lact 22(4), 2006. 20 United States Lactation Consultant Association. International board certification lactation consultant staffing recommendations for the inpatient setting. 2010 July. Retrieved November 21, 2014 from: http://www.ilca.org/files/USLCA/Resources/Publications/IBCLC_Staffing_Recommendations_July_2010.pdf

10 Georgia Health Policy Center
Considering the inpatient and outpatient ratios presented in the Mannel study, the USLCA, CDC and the U.S. Surgeon General, data shows Georgia has an insufficient number of IBCLCs.
The Surgeon General’s report3 recommends 8.6 IBCLCs for every 1,000 births. Currently, CDC indicates Georgia has 2.5 IBCLCs per 1,000 births.8 Using these basic numbers, GA’s current shortage is 6.1 IBCLCs per 1000 births.
Going back to key question #2, one might propose that virtually 100% of Georgia women may “need” the services of an IBCLC immediately after birth, even if the mother is having a second or third child. This will ensure that successful, sustained BF occurs. In Georgia, with initiation rates at 68.2% and an estimated 326 full-time IBCLCs available to provide services,21, it is clear that far fewer mothers who may want help can currently access IBCLC services. [For the purpose of this analysis, we assume 326 full-time IBCLCs are providing services as it is unknown how many are not practicing lactation services on a full-time basis in the state.] The GDPH reports that, in 2012, Georgia had 130,112 births.22 Using the Surgeon General’s suggested ratio, Georgia should have a total of 1,119 IBCLCs to provide services to 130,112 birthing mothers.
A more realistic estimate considers the fact that approximately 68.2% of the 130,112 (n=88,736) mothers who had a baby in 2012 initiated BF. Thus, 763 full-time IBCLCs would be required to provide the services recommended by the Surgeon General at the service rate of 8.6 per 1000 births.
Key Question #3: What is the estimated cost to Georgia Medicaid if each Medicaid mother who has a breastfeeding problem accesses clinical lactation assistance from an IBCLC, with an initial visit and a follow-up visit? The estimated costs to Georgia Medicaid to provide 100% of Georgia’s breastfeeding Medicaid mothers two visits with an IBCLC would be $3.48 million (Table 6). One issue to consider: In 2012, there were 14,847 “Other” payment types and 7,605 “Unknown23” payment types reported inclusive of “yes,” “no,” and “unknown” responses. Of those 22,452 Other/Unknown responses, 5,309 (23.6%) of certificates indicated “unknown” with regard to BF at discharge. Since insurance type is self-reported by the mother or a hospital staff member, it is almost certain that a subset of the 22,452 Other/Unknown responses should be classified within the Medicaid results, but what percentage cannot be estimated. Because of the high percentage of unknown/other responses in Georgia’s live birth certificate data, the CDC PRAMS trend data to estimate the baseline BF measure for Georgia. The Medical Assistance Plans Division of the Georgia Department of Community Health (“Georgia Medicaid”) would ultimately determine the reimbursement fee schedule for IBCLC services. Georgia Medicaid may use a “time based unit” model similar to the fee structure that Georgia Medicaid uses for dietitians or a “visit based” billing model. 21 United States Lactation Consultant Association. Statistical report for USLCA. November 8, 2013. Retrieved November 20, 2014 from: uslca.org/wp-content/uploads/2013/02/IBLCE-Stats-on-IBCLCs.pdf. Note: Number of IBCLCs within the 326 who are not practicing full-time is unknown. 22 Georgia Department of Public Health. Online Analytical Statistical Information System. Retrieved November 10, 2014 from https://oasis.state.ga.us/ 23 * This means no answer was marked on the birth certificate form.

11 Georgia Health Policy Center
Time-Based Unit Billing:
Currently, in Georgia, Medicaid pays doctors using the federal Medicare fee schedule, based on CPT codes.24 Payments are made based on the CPT codes used. The ICD-9 diagnosis codes are provided by the provider to further clarify (justify) the “level” used for the CPT codes in terms of procedures completed or services performed. Some GA IBCLCs have successfully billed for lactation services using CPT code 98960 – education and training for patient self-management by a qualified, non-physician health care professional. Depending on patient need, one or two units may be billed with this code. GA Medicare/Medicaid reimburses $24.80 for a unit under code 98960. If IBCLCs were able to bill directly:
1. Medicaid would be billed a total of $24.80 x three 15-minute units = $74.40.
2. Private insurers would be paying $24.80 + 15% = $28.52 x three units = $85.56.
The Perinatal Health Committee of the North Carolina (NC) Child Fatality Task Force, a legislative study commission, completed an analysis of lactation support services in 2013.25 Using the NC cost calculation model with some modifications for “realistic” goal attainment and data availability, a summary for GA is presented in Table 6.
Table 6. Cost to Georgia Medicaid using Time Based Unit Billing
Georgia Births, 2012 130,112
Births Covered by Medicaid, 201226
58,304
Estimated Number of Women on Medicaid initiating BF from
GA Live Birth Certificate data = 61.17%
35,665
Estimated Number of Women who need lactation support visit
(estimated at 75%)
26,748
Estimated Number of Lactation Support Visits (1 initial & 1
follow-up)
34,772
Estimated Cost of Visits at 100% utilization (assuming
$100/visit)
$3.48 million
The $100 value for cost of visits cited above is calculated considering a cost of $25.00 per unit (rounded up from the $24.80 cited on p. 13) and includes an initial BF counseling segment of one 45-minute (three 15-minute units) period and one 15-minute follow-up visit. Preliminary cost analysis indicates that coverage of lactation support services by GA Medicaid would not exceed $3.48 million annually.
24
Georgia Department of Community Health. Requirements to Receive the ACA Primary Care Physician Rate Increase.
2013. Retrieved December 19, 2014 from: https://dch.georgia.gov/sites/dch.georgia.gov/files/ ACA%20Rate%20Increase%20Guide%20FAQ%20AUG-1-FINAL.pdf 25 North Carolina Child Fatality Task Force, Perinatal Health Committee. Lactation support services cost/benefit analysis. Retrieved November 24, 2014 from: http://www.ncleg.net/DocumentSites/Committees/NCCFTF/ Perinatal%20Health/2013-2014/PHC%20-%20Lactation%20Cost%20Benefit%20Estimates.pdf. 26 Georgia Department of Public Health. Vital Records Live Birth Certificate Data 2009-2012.

12 Georgia Health Policy Center
E & M Coded “visit based” billing: Right now in Georgia, there appears to be much variance for this fee-for-service care, ranging from $50-$202 from sixteen different sources. Some of the pricing depends on the length of the evaluation and the place for care--whether the care is rendered on hospital premises, in a physician’s office or rendered in the patient’s home. The average of these sixteen different fees is $138.69 for an initial visit.27 Assuming that Medicaid will discount the private marketplace 15-20%, Medicaid is likely to get interest in participation at $110 for an initial consultation and $40 for a follow-up visit.
Key Question #4: After examining the 1999 Ball study results, what would the costs be if updated in today's dollars? What is the cost to Georgia of suboptimal breastfeeding rates? The Ball study28, published in 1999, analyzed the records of 1000 healthy born HMO insured babies who were breastfed for three (3) months against 1000 healthy born HMO insured babies who were formula fed, and looking only at the three (3) most common illnesses during the first year of life (ear infections, lower respiratory infections and gastrointestinal infections) and after adjusting for confounders (maternal education, and maternal smoking), researchers determined that in aggregate, the 1000 babies who were not breastfed had 2033 extra doctor visits, 212 extra days in the hospital, and 600 extra prescriptions. The average additional HMO cost per baby who was not breastfed, in 1995 dollars, was between $331-$475. Updating the Ball figures to 2014 dollars, the average additional cost per baby who is never breastfeed compared to babies who are breastfed for three months would be at least $750 per baby.
Table 7 below summarizes the cost comparisons between 1995 and 2014. All figures in this updated analysis are calculated based upon Ball’s original study and upon the Consumer Price Index (CPI) for Medical care documented in the Bureau of Labor Statistics.
Table 7. Ball Study # Services/1000 Cost/Service Total Cost Total Cost
Type of Service Never Breastfed (1995) (2014)
Office visits 1693 $65.75 $111,315 $215,954
Follow-up visits 340 $65.75 $22,355 $43,369
Medications
LRI 29 $3.80 $110 $183
OM 580 $13.05 $7,569 $12,591
Chest Radiography 51 $36.00 $1,836 $3,186
Days of hospitalization
LRI 30 $886.16 $26,585 $67,125
OM 182 $886.16 $161,281 $407,226
27 Gober M, Curl B. Costs of outpatient care for IBCLC lactation services: an informal survey of 10 hospitals and 6 private practice IBCLCs, January 19-26, 2015. Personal Communication. Note: Estimates suggest that more than 75% of clinical outpatient IBCLC services offered in Georgia are provided via these hospitals and private practices. 28 Ball TM, Wright AL. Health Care Costs of Formula-feeding in the First Year of Life. Pediatrics. 1999 April;104(4): 870-876.

13 Georgia Health Policy Center
Total $331,051 $749,634
1995 2014
CPI for Medical care 224.7 435.92
Medical care commodities 207.2 344.69
Medical care services 228.5 465.17
Pro Medical care services 204.7 355.17
Hosp and related services 291.4* 735.77 *: Data in 1995 was not recorded; 1998 is used as this is the earliest recorded number for this measure in the BLS report. Due to the fact that medical inflation is rising on an annual basis, using the 1998 index will underestimate the magnitude of inflation on this specific service.
Note: Numbers could be larger or smaller in the state of Georgia due to # services/1000 utilized as well as basic costs for each service with respect to different HMO pricing.
According to Ball, in year 1995, for every 1000 newborns never breastfed, there will be, on average, 1693 office visits and the expected costs were $111,315. If this trend maintains or keeps relatively stable on an annual basis, the same statistics will generate $215,954 in year 2014 due to medical cost inflation. In terms of follow-up doctor visits, for every 1000 newborns never breastfed, there will be, on average, 340 encounters in year 1995. The 1995 expected total costs were calculated to be $22,355. This figure will be inflated to $43,369 in today’s dollars. Among children, infectious illness is a major reason for medical consultation. Lower respiratory tract illness (LRI) such as bronchiolitis, croup, bronchitis, and pneumonia are common reasons for medical services provided to children. On average, for every 1000 newborns never breastfed, there will be 29 newborns who have medication treatment due to LRI in year 1995 with the expected total costs at $110. On a consistent assumption, this cost in year 2014 will be $183. According to Ball, for children younger than 15 years of age, otitis media (OM) is the most frequent diagnosis in physician office practices. If total cost on OM treatment using medication was estimated to be $7,569 in year 1995, this cost will translate to $12,591 in today’s dollars. By no means is medication the sole treatment for LRI or OM, hospitalization is sometimes utilized due to illness severity. On average, 30 days of hospitalization were spent due to LRI for every 1000 newborns not breastfed in year 1995. The costs were estimated to be $26,585 in 1995, and are projected to be $67,125 in today’s dollars. Further, for every 1000 newborns not breastfed, there were 182 expected days of hospitalization due to OM in year 1995. The costs on OM were $161,281 back then, but would be estimated at $407,226 in 2014. Chest radiography is utilized to detect any lung problems. For every 1000 newborns in year 1995 with no BF exposure whatsoever, the correlated costs were estimated to be $1,836 in total. Based on a similar assumption, the cost for chest radiography would increase to an estimated $3,186 in 2014.

14 Georgia Health Policy Center
Bartick and Reinhold published a cost analysis of suboptimal breastfeeding and its impact on the pediatric population.29 This study concludes that, if the Healthy People 2010 BF goals were met, $2.2 billion in savings and 741 infant deaths would have been prevented. The incidence and cost information from this analysis and the updated Ball study information are applied to Georgia data to the extent possible. This analysis assumes that support of IBCLCs and other targeted BF promotion strategies currently used in GA would lead to Healthy People 2020 goal attainment, i.e., proportion of infants who are ever BF is 81.9%, and the proportion of infants who are BF at 6 months is 60.6%. The 2012 Live Birth Certificate data for those indicating “no” BF at discharge are used as the baseline for the Medicaid population in Table 8 below. Table 8: Costs to GA in 2012 associated with Sub Optimal BF rates in Medicaid Infants
Condition* Incidence Direct Costs
Potential Costs to GA in 2012 associated
with Non-BF Initiation in Medicaid Infants
Otitis Media (OM) n=10,488 infants
1.9 episodes, children 6-11 months30
$29131 per episode $5,798,966
Lower Respiratory Tract Infection (LRT) n=3,255 infants
29 of every 1000 newborns never BF
$183 medication $67,125 hospitalization $6,353,539
Necrotizing Enterocolitis (NEC) LBW = 12,182; VLBW = 2,347
0.00308 low birth weight (LBW) infants; 0.0414 very LBW (VLBW) infants
Medical Costs: LBW $81,219; VLBW $140,858 Surgical Costs: LBW $150,406; VLBW $260,506
$7,140,878
*OM infant number based on GA Live Birth Certificate data in 2012, percent of “no” responses to BF at discharge. LRT and LBW/VLBW infant numbers retrieved from GDPH OASIS data for 2012; estimated 1/3 of NEC infants need surgery.
The most costly of these conditions that can be positively impacted by BF is NEC. NEC is potentially responsible for up to 20% of NICU expenses annually.32 One study estimated that feeding 10 babies with breast milk exclusively can prevent one case of NEC and treating eight infants with breast milk can prevent one case of surgical NEC or death.33 The costs above do not consider the indirect costs associated with treating or caring for infants with these conditions (such as work time lost by parents, personal expenses incurred, etc.). These expenses could be considerable if the infant has a serious condition such as NEC requiring extensive hospitalization, e.g. 60 or more days.38
29 Bartick M, Reinhold A. The Burden of Suboptimal Breastfeeding in the United States: A Pediatric Cost Analysis. Pediatrics. 2010 May;125(5):e1048-56. 30 Chonmaitree T, Revai K, Grady JJ, et al. Viral upper respiratory tract infection and otitis media complication in young children. Clin Infect Dis. 2008;46(6):815-823. 31 Agency for Healthcare Research and Quality. Management of acute otitis media, appendix A. Available at: www.ncbi.nlm.nih.gov/books/bv.fcgi?rid=hstat1.chapter.21026. 32 Gephart SM, McGrath JM, Effken JA, Halpern MD. Necrotizing enterocolitis risk: State of the science. Advances in Neonatal Care. 2012;12(2):77-89. 33 Sullivan S, Schanler RJ, Kim JH, et al. An exclusively human milk-based diet is associated with a lo wer rate of necrotizing enterocolitis than a diet of human milk and bovine milk-based products. J Pediatr. 2010;156(4):562–567.

15 Georgia Health Policy Center
In summary, Georgia’s Medicaid program could have saved an estimated $19,293,383 conservatively in 2012 in direct medical costs for just THREE of the many healthcare conditions which breastfeeding reduces if Georgia mothers were optimally breastfeeding. Summary
It is clear from this analysis that there are short- and long-term costs and cost savings associated with lactation counseling services and improved breastfeeding initiation and duration. Due to the lack of published studies, documented services and impact of IBCLCs compared to other healthcare professionals who are providing BF support, and complex coding and billing processes; it is unclear is if the increased availability of IBCLC services (specifically) contributes to the cost savings associated with BF. At the most basic expense level, one could hypothesize that because the rate paid for IBCLC service provision per billable unit costs the state of Georgia less than that billed by a physician or nurse practitioner, cost savings would be realized if these individuals were licensed. Further, the costs associated with specific conditions, that could be averted if a higher percent of mothers, particularly low income mothers, were to initiate and opt for exclusive breastfeeding for three months, are considerable. At the state level, it is important to contrast the costs associated with covering basic lactation support services by GA Medicaid at $3.48 million annually with the estimated costs to the state of Georgia in 2012 for treating infant conditions in the first year of life exacerbated due to no breastfeeding at $19 million, a net savings of more than $15 million annually. While more in-depth cost-benefit and cases averted analyses is necessary, this comparison suggests the investment in increasing the number of and services available through IBCLCs is warranted. More research is needed in a number of areas that could further the case for IBCLC services and licensure in Georgia: 1) Demonstrating the economic value of employing IBCLCs to both health care facilities (i.e.,
hospitals and clinics) and public and private insurers; 2) Documenting BF support services including who is providing them (IBCLCs vs. other
professionals), when they are provided, how much counseling time is provided, and the reimbursement rates associated with specific services/time by specific providers;
3) Exploring methods to increase rates of BF in GA among populations with current low rates and among populations at greatest risk for childhood obesity and chronic disease;
4) Implementing worksite BF interventions in large employers that utilize IBCLC services and support delivered via telehealth or other technologies; and
5) Detailing the impact of Georgia 5-star hospital program on BF rates by mothers in those facilities and examining the outcomes by those facilities with IBCLCs and those without IBCLCs.
The Georgia Health Policy Center appreciates the opportunity to prepare and submit this report to Healthy Mothers Healthy Babies Coalition of Georgia.
1 Georgia Health Policy Center
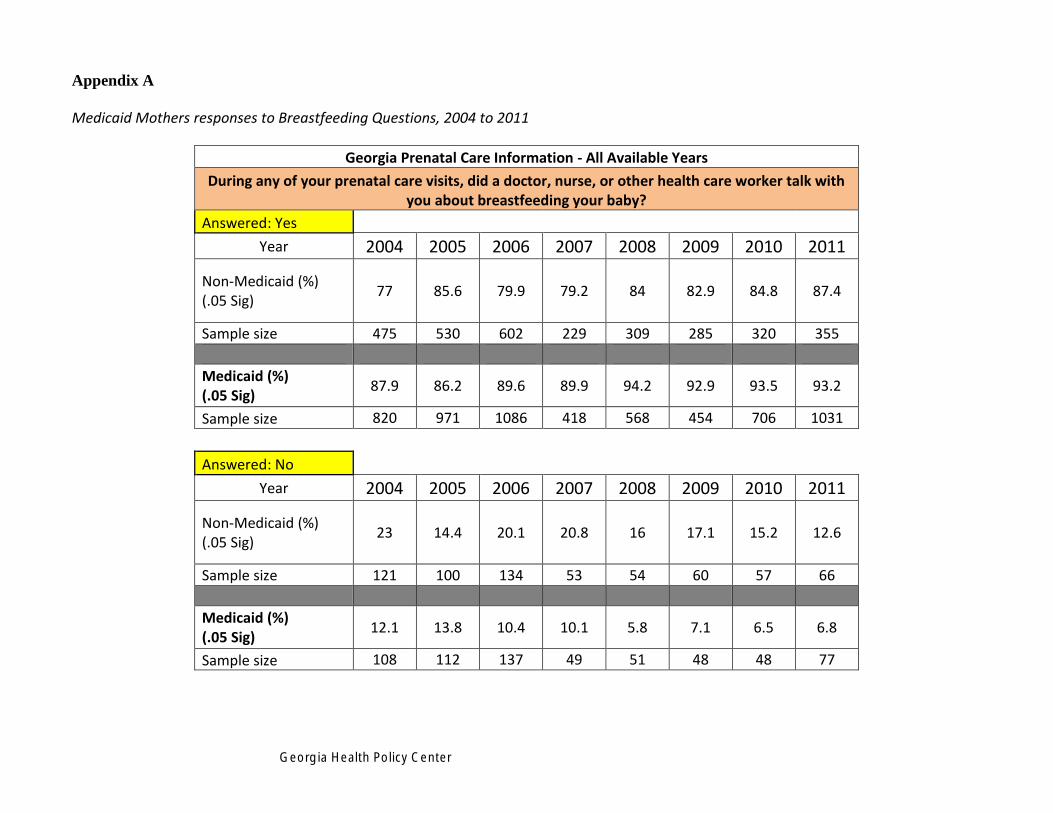
Appendix A
Medicaid Mothers responses to Breastfeeding Questions, 2004 to 2011
Georgia Prenatal Care Information - All Available Years
During any of your prenatal care visits, did a doctor, nurse, or other health care worker talk with you about breastfeeding your baby?
Answered: Yes
Year 2004 2005 2006 2007 2008 2009 2010 2011
Non-Medicaid (%) (.05 Sig)
77 85.6 79.9 79.2 84 82.9 84.8 87.4
Sample size 475 530 602 229 309 285 320 355
Medicaid (%) (.05 Sig)
87.9 86.2 89.6 89.9 94.2 92.9 93.5 93.2
Sample size 820 971 1086 418 568 454 706 1031
Answered: No
Year 2004 2005 2006 2007 2008 2009 2010 2011
Non-Medicaid (%) (.05 Sig)
23 14.4 20.1 20.8 16 17.1 15.2 12.6
Sample size 121 100 134 53 54 60 57 66
Medicaid (%) (.05 Sig)
12.1 13.8 10.4 10.1 5.8 7.1 6.5 6.8
Sample size 108 112 137 49 51 48 48 77

2 Georgia Health Policy Center
Georgia Breastfeeding Information - All Available Years
Were you still breastfeeding 4 weeks after delivery?
Answered: Yes
Year 2004 2005 2006 2007 2008 2009 2010 2011
Non-Medicaid (%) (.05 Sig) 72.8 68.7 70 65.8 75.1 77.3 73.4 83.1
Sample size 420 415 513 199 268 253 270 307
Medicaid (%) (.05 Sig) 47.3 44.8 46.8 43.5 50.7 48.3 51.6 49.8
Sample size 389 459 561 204 308 208 308 438
Answered: No
Year 2004 2005 2006 2007 2008 2009 2010 2011
Non-Medicaid (%) (.05 Sig) 27.2 31.3 30 34.2 24.9 22.7 26.6 16.9
Sample size 166 198 217 82 92 79 103 103
Medicaid (%) (.05 Sig) 52.7 55.2 53.2 56.5 49.3 51.7 48.4 50.2
Sample size 526 590 660 249 297 279 427 664

3 Georgia Health Policy Center
Georgia Breastfeeding Information - All Available Years
Were you still breastfeeding 8 weeks after delivery?
Answered: Yes
Year 2004 2005 2006 2007 2008 2009 2010 2011
Non-Medicaid (%) (.05 Sig)
64.4 60.5 60.3 57.6 63.2 65.9 61.4 71.7
Sample size 355 349 445 165 221 205 228 262
Medicaid (%) (.05 Sig)
38.9 36.8 38.2 32.7 39.0 35.2 35.5 39.3
Sample size 299 348 422 156 238 153 223 328
Answered: No
Year 2004 2005 2006 2007 2008 2009 2010 2011 Non-Medicaid (%) (.05 Sig)
35.6 39.5 39.7 42.4 36.8 34.1 38.6 28.3
Sample size 231 264 285 116 139 127 145 148
Medicaid (%) (.05 Sig)
61.1 63.2 61.8 67.3 61.0 64.8 64.5 60.7
Sample size 616 701 799 297 367 334 512 774

Georgia Health Policy Center