A Report on the Best Rand-Denominated High Growth Unit …€¦ · · 2017-11-077.1 Outright...
18
Daberistic Wealth Management An authorised financial services provider, FSP 25477 Address: Infinity Business Park, 4 Pieter Wenning Road, Fourways, 2191 www.daberistic.com Tel: 011 658 1333 A Report on the Best Rand-Denominated High Growth Unit Trusts in South Africa By Kevin Yeh, CFP® November 2017
Transcript of A Report on the Best Rand-Denominated High Growth Unit …€¦ · · 2017-11-077.1 Outright...

Daberistic Wealth Management
An authorised financial services provider, FSP 25477
Address: Infinity Business Park, 4 Pieter Wenning Road, Fourways, 2191
www.daberistic.com Tel: 011 658 1333
A Report on the
Best Rand-Denominated
High Growth Unit Trusts
in South Africa
By Kevin Yeh, CFP®
November 2017

P a g e | 2
Daberistic ©2017 Daberistic. All rights reserved. This report is
intended for Financial Advisors, not for retail investors.
Table of Contents 1 Executive summary ............................................................................................................. 3
1.1 Best High-growth unit trusts to consider over long-term (5 years plus): ................... 3
1.2 High-growth unit trusts best to avoid over long-term (5 years plus): ........................ 3
1.3 Constructing a high-growth investment portfolio ...................................................... 3
2 Preamble ............................................................................................................................. 4
3 9-step fund selection process ............................................................................................. 4
4 Methodology ...................................................................................................................... 5
5 Why the past is not indicative of the future ...................................................................... 6
6 High-growth funds selected ............................................................................................... 7
7 Analysis ............................................................................................................................... 8
7.1 Outright performance ................................................................................................. 8
7.2 Risk return scatterplot............................................................................................... 11
7.3 Risk statistics ............................................................................................................. 13
7.4 Correlation................................................................................................................. 16
8 Observations ..................................................................................................................... 18
8.1 Clear, strong corporate investment philosophy, team approach ............................. 18
8.2 Transitioning to the above ........................................................................................ 18
8.3 Star performers ......................................................................................................... 18
8.4 Index tracker ............................................................................................................. 18
P a g e | 3
Daberistic ©2017 Daberistic. All rights reserved. This report is
intended for Financial Advisors, not for retail investors.
1 Executive summary
1.1 Best High-growth unit trusts to consider over long-term (5 years
plus):
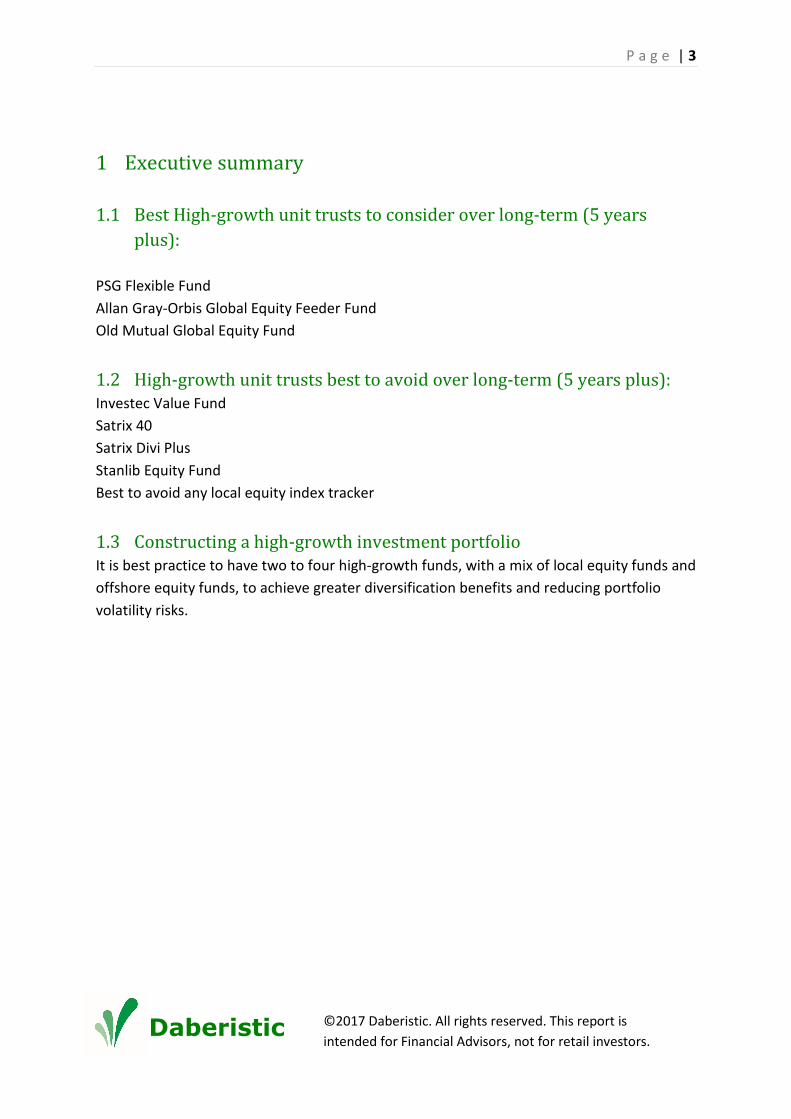
PSG Flexible Fund
Allan Gray-Orbis Global Equity Feeder Fund
Old Mutual Global Equity Fund
1.2 High-growth unit trusts best to avoid over long-term (5 years plus): Investec Value Fund
Satrix 40
Satrix Divi Plus
Stanlib Equity Fund
Best to avoid any local equity index tracker
1.3 Constructing a high-growth investment portfolio It is best practice to have two to four high-growth funds, with a mix of local equity funds and
offshore equity funds, to achieve greater diversification benefits and reducing portfolio
volatility risks.

P a g e | 4
Daberistic ©2017 Daberistic. All rights reserved. This report is
intended for Financial Advisors, not for retail investors.
2 Preamble
Firstly, let me dedicate this report to my Lord and Saviour Jesus Christ, may honour and
glory be to Him forever and ever!
As a Financial Advisor with actuarial qualifications, I am particularly fascinated by
investments. I have spent lots of time over the last 21 years studying the subject of
investment. I have learnt and analysed all kinds of financial instruments, including shares,
unit trusts, CFDs, futures, warrants and ETFs.
Over the years the investment markets have taught me a lot of things. It has taught me to
be humble. It has taught me to be a ready student, to continue to learn, think and reflect.
In the past I have written about share analysis, technical analysis, and general investment
advice. This is the first time I write and share a comprehensive report on unit trusts. Over
the years I have appreciated the way good unit trusts, or Collective Investment Schemes,
has helped me and my clients grow my wealth. They have provided many investors an
excellent way of investing in a diversified portfolio of assets, that over the long term have
demonstrated significant real returns.
This first comprehensive report on unit trusts focuses on high-growth unit trusts. I share this
report with my fellow financial advisors in the hope of helping you help your clients make
better, independent, informed investment decisions.
If you like this report and think this report has helped you, please like it on LinkedIn and
share it with financial advisors. Please also comment on this report, so that I can know
whether I am on the right track, and how I can continue to refine my investment thinking.
3 9-step fund selection process
Over the years our Company has developed our proprietary 9-step fund selection process,
as follows:

P a g e | 5
Daberistic ©2017 Daberistic. All rights reserved. This report is
intended for Financial Advisors, not for retail investors.
1. The investment management company: We examine its history, investment
philosophy, investment process and human capital.
2. The portfolio manager: We ask whether the portfolio manager(s) have the right
qualifications (e.g. CA, CFA, Actuary, MBA) and relevant investment management
experience (10 years plus). We do not want to give clients’ money to someone that is
junior in the arena of portfolio management, not having the experience of managing
money in a severe downturn in stock markets.
3. Past performance: Performance figures are the most visible in the public domain.
We pay most of our attention to long-term performance figures, i.e. over 5- and 10-
years.
4. Risk management: Fund managers can make most money for clients by managing
risks well. We focus on managing downside risks, as well as the risk of permanent
loss of capital.
5. Independent fund ratings: We make use of independent fund ratings, such as
Fundhouse, PlexCrown, Morningstar and Citywire, in assessing the qualitative and
quantitative factors of funds.
6. Cost: We examine a fund’s cost structure in terms of performance fees, TIC (Total
Investment Charge) relative to its long-term returns after fees.
7. Fund size: In South Africa we consider a fund less than R5 billion in fund size to be a
small fund, we will generally be concerned about its limited resources and liquidity.
On the other hand, a really large fund might struggle to outperform the market,
depending on its mandate and its size relative to its available investment universe.
8. Client’s needs: A client’s investment objectives, time horizon and risk profile will
determine a portfolio of funds with suitable risk budgets.
9. Market conditions: When markets are at extremes, i.e. either too cheap or too
expensive, we may advise the client to be more aggressive (when markets are too
cheap) or more cautious (when markets are too expensive).
4 Methodology
The methodology I use in selecting and analysing the high-growth unit trust funds is as
follows:
1. I classify high-growth unit trust funds as funds that can invest up to 100% in equities,
with an effective equity exposure of over 75% over the long ter. The equities can be
local or offshore.

P a g e | 6
Daberistic ©2017 Daberistic. All rights reserved. This report is
intended for Financial Advisors, not for retail investors.
2. Screen all the funds available in South Africa and shortlist most of the best-
performing funds over the long term for analysis.
3. Select a couple of not-the-best funds for contrast and illustration.
4. Use data provided by Profile Data to conduct various analyses. I looked at outright
performance, risk-return scatterplot, risk statistics and correlation.
5. Consider the fund ratings from independent fund rating agencies.
5 Why the past is not indicative of the future
I have made this mistake many times in the past, and I may make more of them in the
future. Fund managers and fund rating agencies always warn you that past performance is
no guarantee of future results. Over the years I have identified some of the reasons for the
past performance being a poor predictor of future performance:
• An investment management company may go through significant changes, such as
changes in its executive team, its board of directors, its key portfolio investment
staff, investment processes or even its investment philosophy. These may render an
analysis of a fund’s statistics close to useless in predicting the company’s ability to
perform in the future.
• A fund may change its mandate significantly, rendering historic statistics irrelevant.
• Changes in the fund manager. Many funds have keyman risk, when their star
performer leaves the fund, the fund performance then becomes very ordinary.
• Fund managers are human, they have some level of inherent inconsistencies. As
people age, experiences accumulate, wisdom has grown, the way they think and
make decisions evolves over time.
• Fund managers may not keep up with technological changes. With technological
changes happening at an ever-faster pace, fund managers may not fully comprehend
how new technologies and adoption thereof are impacting companies and their
future prospects.
• Fund management fee structure or trading frequency changes over time. A fund with
an increasing TIC (total investment charge) over time may have a deteriorating
relative performance, while a fund with a reducing TIC over time may have an
improving relative performance.
As you can see, an analysis of historic statistics can be at best half useful when taking into
account the afore-mentioned changes.

P a g e | 7
Daberistic ©2017 Daberistic. All rights reserved. This report is
intended for Financial Advisors, not for retail investors.
However, if an investment management company has a consistent investment philosophy,
consistent processes, a stable executive team and a stable team of investment
professionals, its proven ability to outperform in the past is likely to be a better predictor of
its ability to outperform in the future.
6 High-growth funds selected
We have shortlisted and chosen the following funds for the purpose of this report (in
alphabetical order):
Allan Gray Equity Fund A Class
Allan Gray-Orbis Global Equity Feeder Fund A Class
Coronation Optimum Growth Fund A Class
Coronation Top 20 Fund A Class
Coronation Equity Fund A Class
Discovery Equity Fund A Class
Foord Equity Fund R Class
FTSE/JSE All Share Index Total Return (as a benchmark)
Investec Equity Fund R Class
Investec Value Fund A Class
Marriot Dividend Growth Fund R Class
Old Mutual Global Equity Fund R Class
Prudential Equity Fund A Class
PSG Equity Fund A Class
PSG Flexible Fund A Class
SIM General Equity Fund R Class
Satrix 40 Portfolio A Class
Satrix DIVI Plus Portfolio A Class
Stanlib Equity Fund R Class
A total of 19 funds, including the All Share Index Total Return, are included in this analysis.
Most of these funds represent the best high-growth unit trusts denominated in rands.

P a g e | 8
Daberistic ©2017 Daberistic. All rights reserved. This report is
intended for Financial Advisors, not for retail investors.
7 Analysis
The period of analysis is the 10-year period to 12 October 2017. This also include the Global
Financial Crisis (GFC) from 2008 to 2009. This period includes a period of severe market
downturn, very useful to assess how fund managers do in times of great stress.
7.1 Outright performance
The chart below shows the performance graph of funds over the 10-year period, including
reinvestments.
The chart below shows the performance graph of funds over the 5-year period to 12
October 2017, including reinvestments.

P a g e | 9
Daberistic ©2017 Daberistic. All rights reserved. This report is
intended for Financial Advisors, not for retail investors.
Below is the performance summary table of all these funds:

P a g e | 10
Daberistic ©2017 Daberistic. All rights reserved. This report is
intended for Financial Advisors, not for retail investors.
Comment: Over the 10-year period, the best performers are:
1. Allan Gray-Orbis Global Equity Feeder Fund, 13.95% annualised
2. PSG Flexible Fund, 13.57% annualised
3. Old Mutual Global Equity, 13.16% annualised
The worst performers are:
1. Investec Value Fund, 6.86% annualised
2. Stanlib Equity Fund, 7.40% annualised
3. Satrix 40, 8.66% annualised
Over the 5-year period, the best performers are:
1. Old Mutual Global Equity, 26.21% annualised
2. Allan Gray-Orbis Global Equity Feeder Fund, 24.96% annualised
3. Coronation Optimum Growth Fund, 18.59% annualised
No surprise here, the funds with highest offshore exposure have performed the best due to
strong global markets and significant rand depreciation.

P a g e | 11
Daberistic ©2017 Daberistic. All rights reserved. This report is
intended for Financial Advisors, not for retail investors.
The worst performers are:
1. Satrix DIVI Plus, 6.24% annualised
2. Discovery Equity Fund, 6.78% annualised
3. Investec Value Fund, 10.05% annualised
7.2 Risk return scatterplot
With risk return scatterplots, we are looking for funds that offer highest returns at lower
risks. The theory of the efficient frontier is the set of optimal portfolios that offers the
highest expected return for a defined level of risk or the lowest risk for a given level of
expected return. Portfolios that lie below the efficient frontier are sub-optimal, because
they do not provide enough return for the level of risk. Portfolios that cluster to the right of
the efficient frontier are also sub-optimal, because they have a higher level of risk for the
defined rate of return. To read more on Efficient Frontier:
http://www.investopedia.com/terms/e/efficientfrontier.asp#ixzz4xggLgHgF
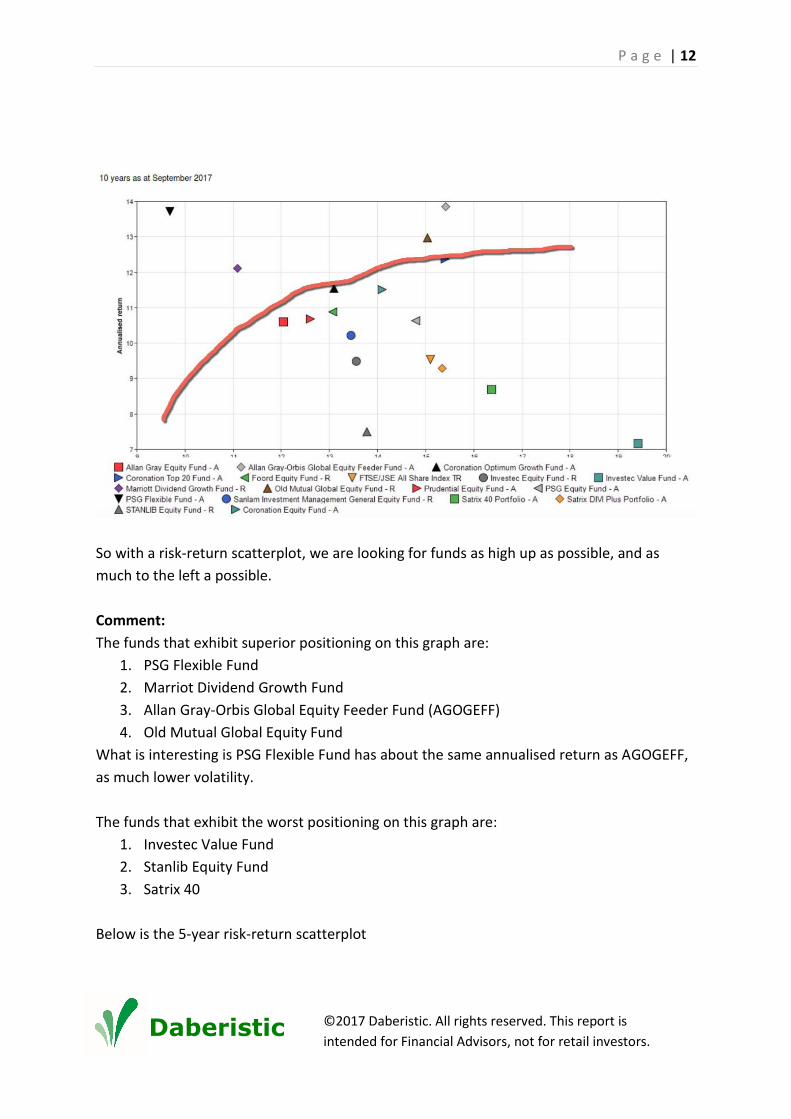
Below is the 10-year risk-return scatterplot. The vertical axis (the left axis) represents
annualised return, the horizontal axis (the bottom axis) represents volatility (standard
deviation). The higher the return, the better. The higher the volatility, the more ups and
downs in investment performance. The red curve indicates the efficient frontier (excuse my
hand drawing!)
P a g e | 12
Daberistic ©2017 Daberistic. All rights reserved. This report is
intended for Financial Advisors, not for retail investors.
So with a risk-return scatterplot, we are looking for funds as high up as possible, and as
much to the left a possible.
Comment:
The funds that exhibit superior positioning on this graph are:
1. PSG Flexible Fund
2. Marriot Dividend Growth Fund
3. Allan Gray-Orbis Global Equity Feeder Fund (AGOGEFF)
4. Old Mutual Global Equity Fund
What is interesting is PSG Flexible Fund has about the same annualised return as AGOGEFF,
as much lower volatility.
The funds that exhibit the worst positioning on this graph are:
1. Investec Value Fund
2. Stanlib Equity Fund
3. Satrix 40
Below is the 5-year risk-return scatterplot

P a g e | 13
Daberistic ©2017 Daberistic. All rights reserved. This report is
intended for Financial Advisors, not for retail investors.
Comment:
The funds that exhibit superior positioning on this graph are:
1. Old Mutual Global Equity Fund
2. Allan Gray-Orbis Global Equity Feeder Fund (AGOGEFF)
3. Coronation Optimum Growth Fund
4. PSG Equity Fund
5. PSG Flexible Fund
The funds that exhibit the worst positioning on this graph are:
1. Investec Value Fund
2. Satrix Divi Plus
4. Discovery Equity Fund
7.3 Risk statistics
Risk statistics measure how a fund price behaves over a period of time.
In finance, standard deviation is a statistical measurement; when applied to the annual rate
of return of an investment, it sheds light on the historical volatility of that investment. The
greater the standard deviation of a security, the greater the variance between each price

P a g e | 14
Daberistic ©2017 Daberistic. All rights reserved. This report is
intended for Financial Advisors, not for retail investors.
and the mean, indicating a larger price range. For example, a volatile stock has a high
standard deviation, while the deviation of a stable blue-chip stock is usually rather low.
Generally, for funds in the same category, the lower the standard deviation, the better.
A maximum drawdown (MDD) is the maximum loss from a peak to a trough of a portfolio,
before a new peak is attained. Maximum Drawdown (MDD) is an indicator of downside risk
over a specified time period. It can be used both as a stand-alone measure or as an input
into other metrics such as "Return over Maximum Drawdown" and Calmar Ratio. Maximum
Drawdown is expressed in percentage terms and computed as:
(Trough Value – Peak Value) ÷ Peak Value
The Sharpe ratio and the Sortino ratio are both risk-adjusted evaluations of return on
investment. The Sortino ratio is a variation of the Sharpe ratio that only factors in downside
risk.
A Sharpe ratio is calculated by subtracting the rate of return on an investment considered
risk-free, such as a U.S. Treasury bill, from the expected or actual return on an equity
investment portfolio or on an individual stock, then dividing that number by the standard
deviation of the stock or portfolio. The Sharpe ratio indicates how well an equity investment
is performing compared to a risk-free investment, taking into consideration the additional
risk level involved with holding the equity investment. A negative Sharpe ratio indicates that
the investor would have a better risk-adjusted rate of return using a risk-free investment. A
Sharpe ratio of 1 or higher is commonly considered to be a good risk-adjusted return rate.
The Sortino ratio variation of the Sharpe ratio only factors in downside, or negative
volatility, rather than the total volatility used in calculating the Sharpe ratio. The theory
behind the Sortino variation is that upside volatility is a plus for the investment, and it
therefore should not be included in the risk calculation. Therefore, the Sortino ratio takes
upside volatility out of the equation and uses only the downside standard deviation in its
calculation instead of the total standard deviation that is used in calculating the Sharpe
ratio.
Analysts commonly prefer to use the Sharpe ratio to evaluate low-volatility investment
portfolios and the Sortino variation to evaluate high-volatility portfolios.

P a g e | 15
Daberistic ©2017 Daberistic. All rights reserved. This report is
intended for Financial Advisors, not for retail investors.
(Reference: Investopedia.com)
Below is the risk summary table for 10 years to 30 September 2017.
Comment: During this period the JSE Total Return Index fell by as much as 45% during the
GFC. Any fund that fell more than this percentage might be dubious in its risk management
during that period.
The funds with the best risk statistics are:
1. PSG Flexible Fund
2. Marriot Dividend Growth Fund
3. Allan Gray-Orbis Global Equity Feeder Fund (AGOGEFF)
The funds with the worst risk statistics are:
1. Investec Value Fund
2. Stanlib Equity Fund – maximum drawdown of 49.48%, losing more money for
investors during the GFC.
3. Satrix 40 Portfolio
P a g e | 16
Daberistic ©2017 Daberistic. All rights reserved. This report is
intended for Financial Advisors, not for retail investors.
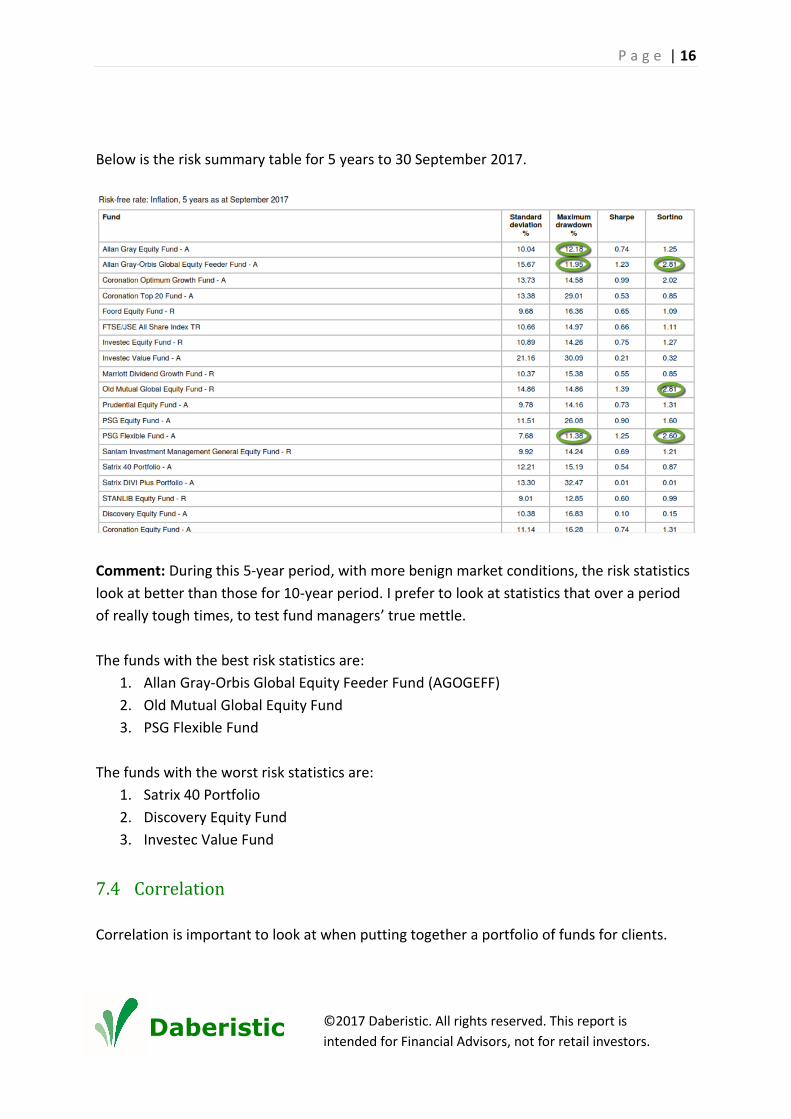
Below is the risk summary table for 5 years to 30 September 2017.
Comment: During this 5-year period, with more benign market conditions, the risk statistics
look at better than those for 10-year period. I prefer to look at statistics that over a period
of really tough times, to test fund managers’ true mettle.
The funds with the best risk statistics are:
1. Allan Gray-Orbis Global Equity Feeder Fund (AGOGEFF)
2. Old Mutual Global Equity Fund
3. PSG Flexible Fund
The funds with the worst risk statistics are:
1. Satrix 40 Portfolio
2. Discovery Equity Fund
3. Investec Value Fund
7.4 Correlation
Correlation is important to look at when putting together a portfolio of funds for clients.

P a g e | 17
Daberistic ©2017 Daberistic. All rights reserved. This report is
intended for Financial Advisors, not for retail investors.
Correlation, in the finance and investment industries, is a statistic that measures the degree
to which two funds move in relation to each other. Correlations are used in advanced
portfolio management. Correlation is computed into what is known as the correlation
coefficient, which has value that must fall between -1 and 1.
A perfect positive correlation means that the correlation coefficient is exactly 1. This implies
that as one security moves, either up or down, the other security moves in lockstep, in the
same direction. A perfect negative correlation means that two assets move in opposite
directions, while a zero correlation implies no relationship at all.
When you construct a portfolio of unit trusts, you would want to use funds with highest
returns and lowest correlation.
Below is the correlation table for 10 years to 30 September 2017.
Comment: A glance will show funds with high offshore exposure have low correlation with
funds with high local equity exposure. It will therefore be good strategy to use a local equity
fund with an offshore fund, to achieve greater diversification benefits.
Although Investec Value Fund has a lower correlation with most funds, it should not be
considered if taking into account other measures contained in this report.

P a g e | 18
Daberistic ©2017 Daberistic. All rights reserved. This report is
intended for Financial Advisors, not for retail investors.
8 Observations
I put these fund managers into these four baskets (from the best to possibly the worst):
8.1 Clear, strong corporate investment philosophy, team approach Allan Gray, Coronation, Prudential. These investment management companies have a clear,
strong corporate investment philosophy, with greater depth in the teams, less keyman risk.
8.2 Transitioning to the above PSG. These investment management companies are progressing towards the tier above.
8.3 Star performers Foord, Investec, Marriot, Old Mutual, SIM, Stanlib. These investment management
companies tend to rely more on individual talents rather than consistent investment
philosophy across the firm. There is more keyman risk.
8.4 Index tracker Satrix. These investment management companies develop and/or track indices, the so-
called passive investing. The huge problem I see is these indices don’t evolve with time, so
investors have to get off one train (old index not working so well anymore) to try to catch
another train (a promising new index), hopefully to get to your final destination
(comfortable retirement). Local equity index trackers do not have the same merits as a
developed market tracker like S&P500.