A Report on a Survey of New Zealanders’ Use of Social ... Reports/2018/Research New Zealand... ·...
13
1 A Report on a Survey of New Zealanders’ Use of Social Media and Opinions on Cyber Security 2018 Level 7, 45 Johnston St, PO Box 10 617, Wellington, New Zealand P 04 499 3088 F 04 499 3414 E [email protected] W www.researchnz.com 2015 Research New Zealand
Transcript of A Report on a Survey of New Zealanders’ Use of Social ... Reports/2018/Research New Zealand... ·...
1
A Report on a Survey of New Zealanders’ Use of Social Media and Opinions on Cyber Security 2018
Level 7, 45 Johnston St, PO Box 10 617, Wellington, New Zealand P 04 499 3088 F 04 499 3414 E [email protected] W www.researchnz.com
2015 Research New Zealand
2
Preface
According to the Digital in 2018 report released by We Are Social and Hootsuite, in 2018, the number
of people using the internet globally has passed the 4 billion mark. This translates into over one half
of the world’s population.
Due to more affordable handsets and mobile data plans on the market, the number of mobile phone
users continues to increase year-on-year. This year, there are around 5 billion mobile phone users
worldwide. It is not surprising to learn that more than one half of these are ‘smart’ devices.
Ease of access to the internet also means that social media use continue to grow rapidly – 11 new
users sign up every second to a social media account. Almost all social media engagement is done
through a mobile phone device.
“People are spending more time online; the average user now spends around 6 hours each
day using the internet. If we add this together for all 4 billion of the world’s internet users,
people will spend a massive 1 billion years online in 2018” Source: We are Social and
Hootsuite; Digital in 2018 Report.
3
Introduction
Research New Zealand first conducted the Survey of New Zealanders’ Use of
Smartphones and other Mobile Communication Devices in 2013. In that survey, we
focused on the ownership and use of laptops, tablets, PCs, smartphones and other
mobile phones (feature phones).
This survey was repeated in 2014 and in 2015 to keep abreast of the pace of change
and to continue monitoring emerging trends. This year, the survey was repeated with
some of the core questions asked in previous years, but also additional topical
questions around social media, cyber security and children’s use of technology.
This report focuses on the areas of social media and cyber security.
Key findings
There are four key findings:
1. 4 in 5 adult New Zealanders visited a social media site in the last seven days. The top visited
sites, by far, are Facebook and YouTube.
2. Opinion is mixed as to the pros and cons of social media. For example, the majority of New
Zealanders agree that social media is a great way to stay in touch and catch up with friends (56
percent agree) and that it is a very important part of today’s society (51 percent agree). However,
many New Zealanders worry about privacy issues when it comes to social media (53 percent
agree) and believe it has an overall negative effect on young people (45 percent agree).
3. The majority of New Zealanders state they have experienced some sort of cyber security
issue (79 percent). The most common experience is being the target of a scam either online or
by phone (72 percent).
4. Three-quarters of adult New Zealanders believe that cyber security is a major issue (76
percent). Over 2 in 5 often worry about what happens to the personal data they provide online
(44 percent). A third of New Zealanders do not think the internet is a safe place (33 percent).
4
Detailed findings
4 in 5 New Zealanders visited a social media site in the past seven days
Respondents were presented with a list of everyday activities and asked to indicate which of them
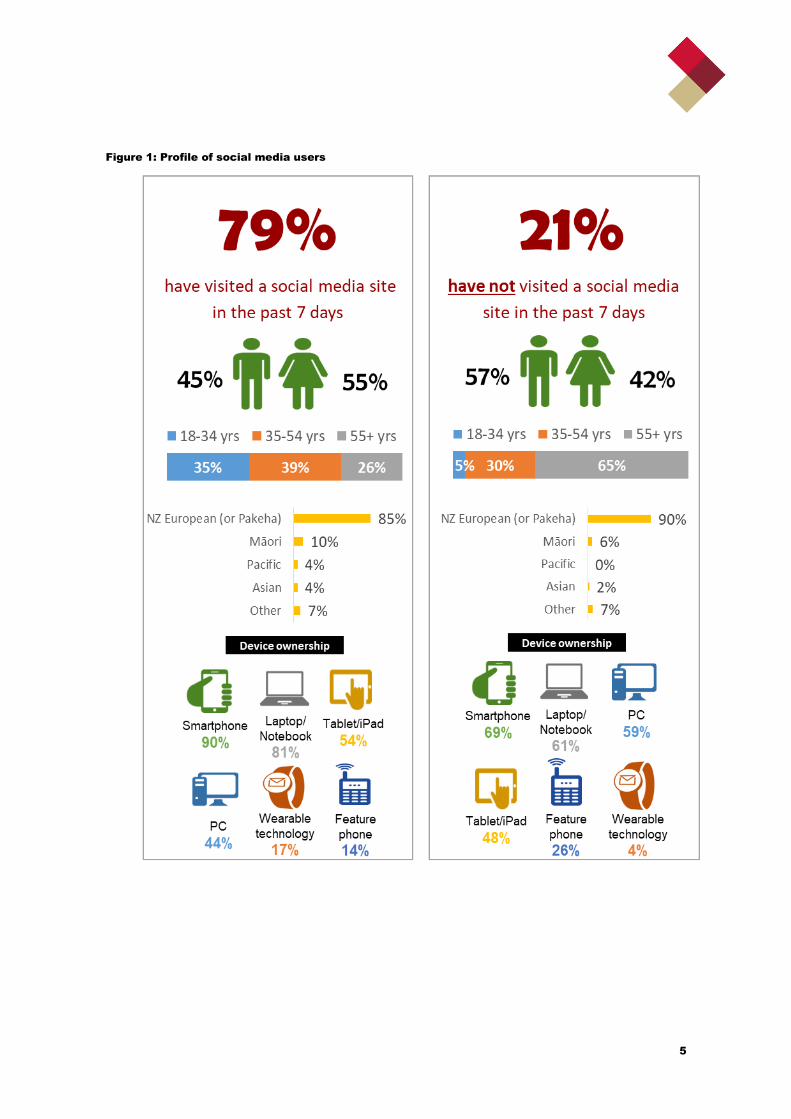
they had engaged in, in the past seven days. As illustrated in Figure 2 overleaf, 79 percent of
respondents reported that they had visited a social media site (e.g. Facebook, Instagram,
Snapchat, etc.) in the previous seven days. Comparing those who had visited a social media with
those who had not leads to the following conclusions:
Differences by gender:
Fifty-five percent of respondents who had visited a social media site were female, 45
percent were male. The reverse is true when we will examine those who have not visited a
social media site. Forty-two percent of those who had not visited a social media site were
female, 57 percent were male.
Differences by age:
Respondents who had visited a social media site tended to be of a younger age group. Of
those who visited a social media site, 35 percent were under the age of 34 years. This
compares to just 5 percent of those who had not visited a social media site.
Differences by ethnicity:
Māori and Pacific respondents were more likely to fall into the category of those
respondents who had visited a social media site than those who had not. Ten percent of
respondents who had visited a social media site identified as Māori and four percent
identified as Pacific. In comparison, six percent of respondents who had not visited a social
media site were Māori and none were of Pacific ethnicity.
Device ownership/access:
Differences also existed when it came to the type of devices each group owned or had
access to. Those who had visited a social media site in the past seven days were more
likely to own/have access to a smartphone (90 percent compared with 69 percent of
respondents who had not visited a social media site), a laptop or notebook (81 percent
compared with 61 percent) and wearable technology (e.g. smart watch, activity trackers)
(17 percent compared with 4 percent).
Respondents who had not visited a social media site were more likely to own/have access
to a PC (59 percent compared with 44 percent of respondents who had visited a social
media site) and another type of mobile phone (26 percent compared with 14 percent).
5
Figure 1: Profile of social media users
6
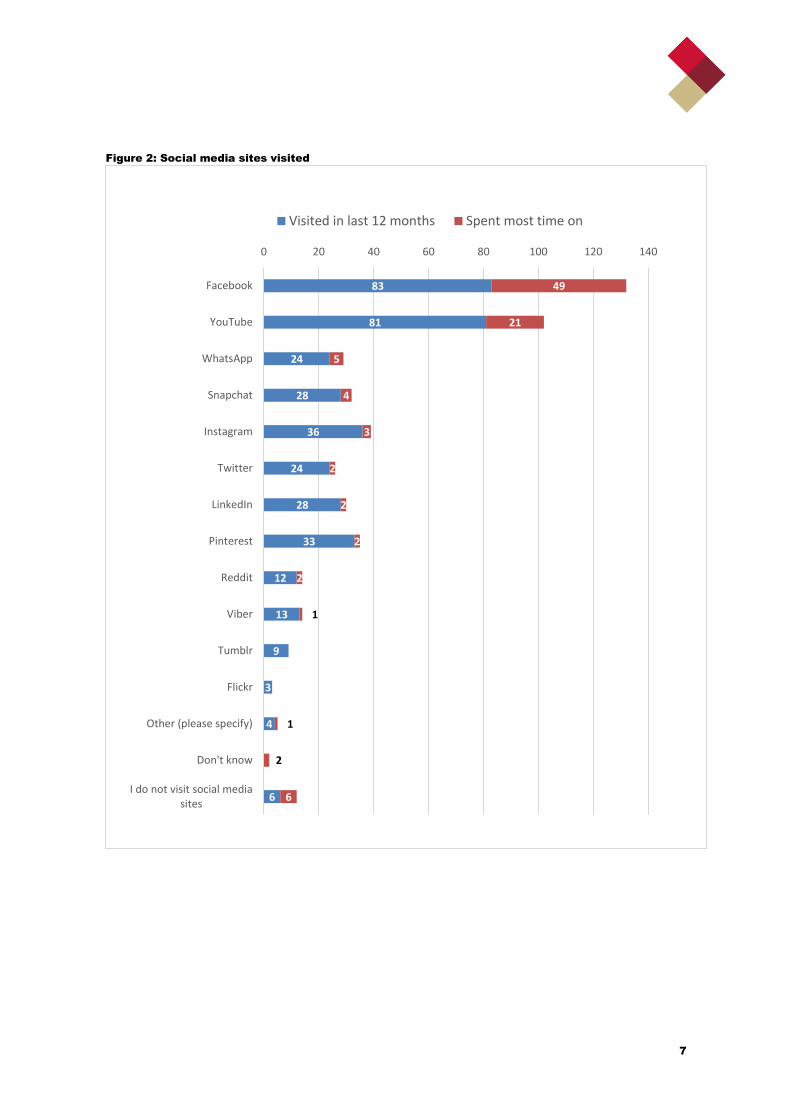
Facebook is the most visited social media site among New Zealanders
As illustrated in Figure 2 overleaf, over 4 in 5 respondents reported visiting Facebook in the past
12 months (83 percent). Over one-half of respondents spent the most time on this social media site
(49 percent).
The second most visited site was YouTube. Eighty-one percent reported that they visited YouTube
in the past 12 months, while one in five reporting that this was the social media site they spent the
most time on (21 percent).
Adult New Zealanders, on average, visited 4 social media sites in the past 12 months. There are
some differences in the profile of respondents who spent the most time on Facebook compared to
the respondents who spent the most time on YouTube. These differences can be summarised as
follows:
By gender:
Females show a greater preference for Facebook, while males prefer YouTube. Respondents
who reported they spent the most time on Facebook were more likely to be female (59 percent)
when compared with those who spent the most time on YouTube (27 percent). Seventy-three
percent of respondents who spent the most time on YouTube were male compared with 40
percent of those who spent the most time on Facebook.
By other social media site preferences:
Respondents who spent the most time on Facebook where more likely than those who spent
the most time on YouTube to also visit other social networking sites such as Instagram (39
percent compared with 20 percent), Snapchat (29 percent compared with 12 percent) and
LinkedIn (29 percent compared with 20 percent).
Respondents who spent the most time on YouTube where more likely than those who spent the
most time on Facebook to also visit the social news and discussion website Reddit (20
percent compared with 7 percent).
7
Figure 2: Social media sites visited
83
81
24
28
36
24
28
33
12
13
9
3
4
6
49
21
5
4
3
2
2
2
2
1
1
2
6
0 20 40 60 80 100 120 140
YouTube
Snapchat
Viber
Tumblr
Flickr
Other (please specify)
Don't know
I do not visit social mediasites
Visited in last 12 months Spent most time on
8
Over one half of adult New Zealanders worry about privacy issues when it comes to social media
To better understand New Zealanders’ attitudes toward social media, respondents were
presented with a list of statements and asked on a 11-point scale to rate their level of agreement
with each of them, where 0 was ‘strongly disagree’ and 10 was ‘strongly agree’.
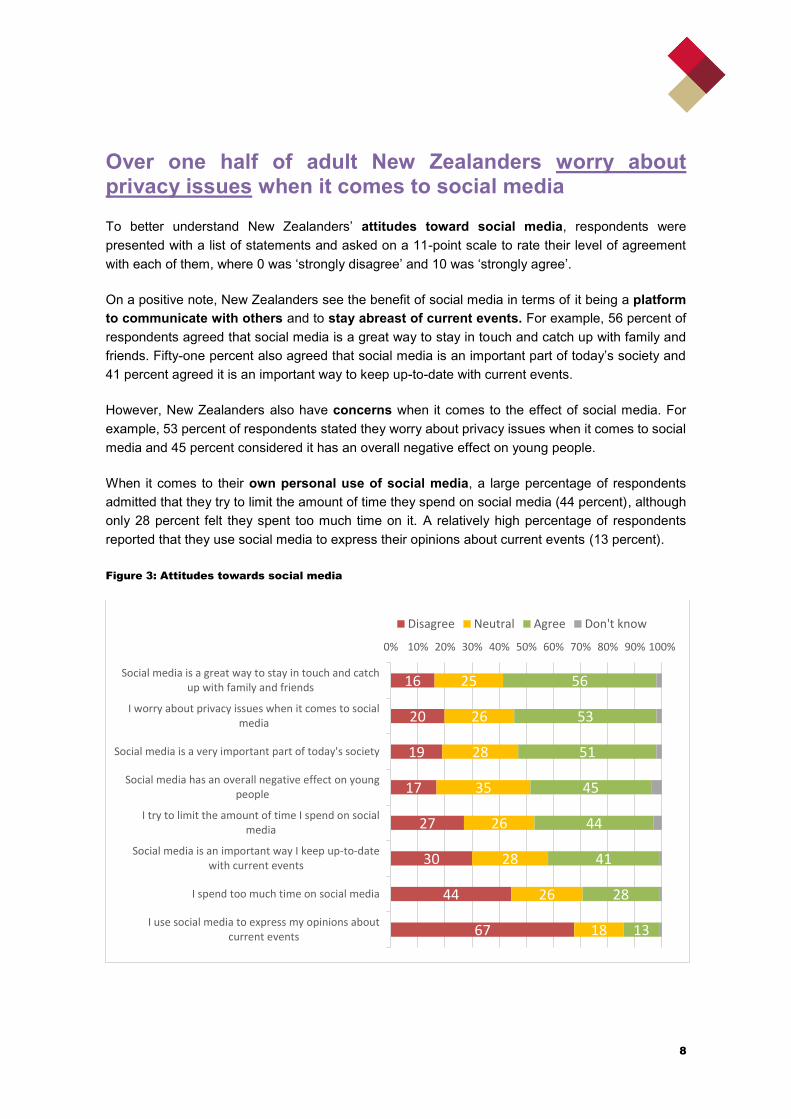
On a positive note, New Zealanders see the benefit of social media in terms of it being a platform
to communicate with others and to stay abreast of current events. For example, 56 percent of
respondents agreed that social media is a great way to stay in touch and catch up with family and
friends. Fifty-one percent also agreed that social media is an important part of today’s society and
41 percent agreed it is an important way to keep up-to-date with current events.
However, New Zealanders also have concerns when it comes to the effect of social media. For
example, 53 percent of respondents stated they worry about privacy issues when it comes to social
media and 45 percent considered it has an overall negative effect on young people.
When it comes to their own personal use of social media, a large percentage of respondents
admitted that they try to limit the amount of time they spend on social media (44 percent), although
only 28 percent felt they spent too much time on it. A relatively high percentage of respondents
reported that they use social media to express their opinions about current events (13 percent).
Figure 3: Attitudes towards social media
16
20
19
17
27
30
44
67
25
26
28
35
26
28
26
18
56
53
51
45
44
41
28
13
0% 10% 20% 30% 40% 50% 60% 70% 80% 90% 100%
Social media is a great way to stay in touch and catchup with family and friends
I worry about privacy issues when it comes to socialmedia
Social media is a very important part of today's society
Social media has an overall negative effect on youngpeople
I try to limit the amount of time I spend on socialmedia
Social media is an important way I keep up-to-datewith current events
I spend too much time on social media
I use social media to express my opinions aboutcurrent events
Disagree Neutral Agree Don't know
9
One third of social media users have disconnected, or thought about disconnecting, from social media in the past year
Respondents that reported they had visited at least one social media site in the last year were
presented with a list of statements about disconnecting from social media and were asked which of
the statements applied to them in the last year.
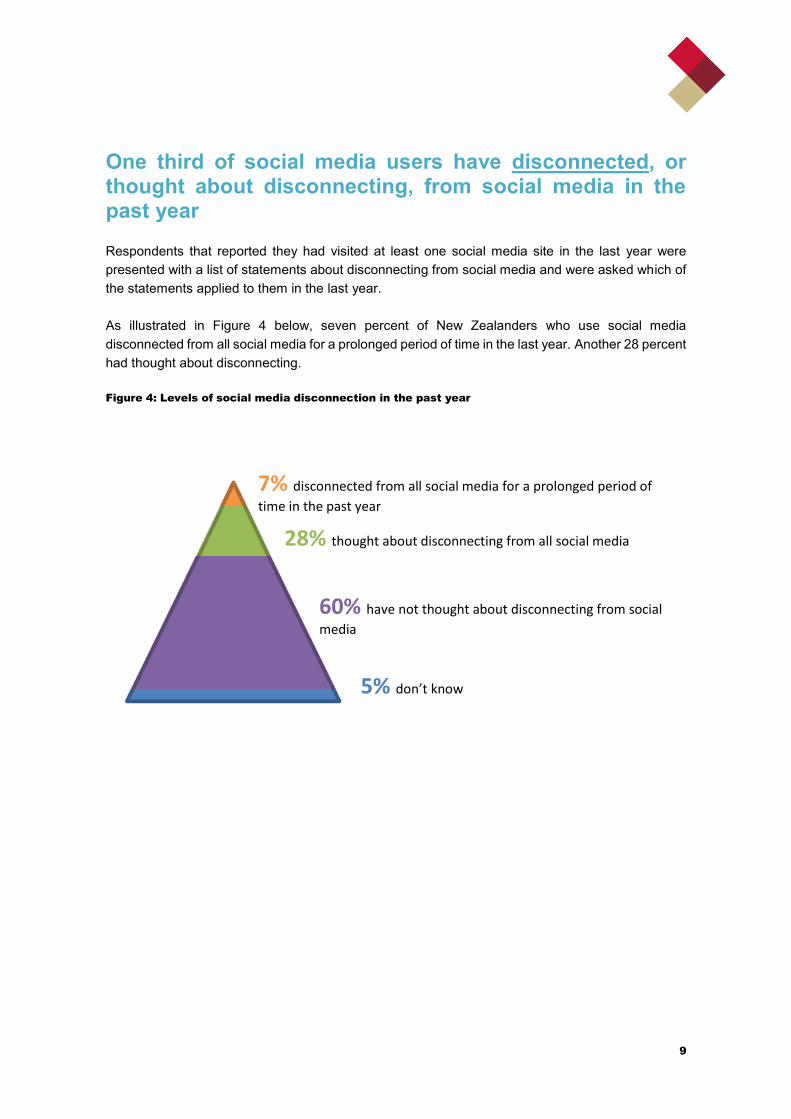
As illustrated in Figure 4 below, seven percent of New Zealanders who use social media
disconnected from all social media for a prolonged period of time in the last year. Another 28 percent
had thought about disconnecting.
Figure 4: Levels of social media disconnection in the past year
7% disconnected from all social media for a prolonged period of
time in the past year
28% thought about disconnecting from all social media
60% have not thought about disconnecting from social
media
5% don’t know
10
The majority of New Zealanders have been the target of a scam, either online or by telephone
Respondents were presented with different types of cyber security scenarios and asked if they had
ever experienced any of them.
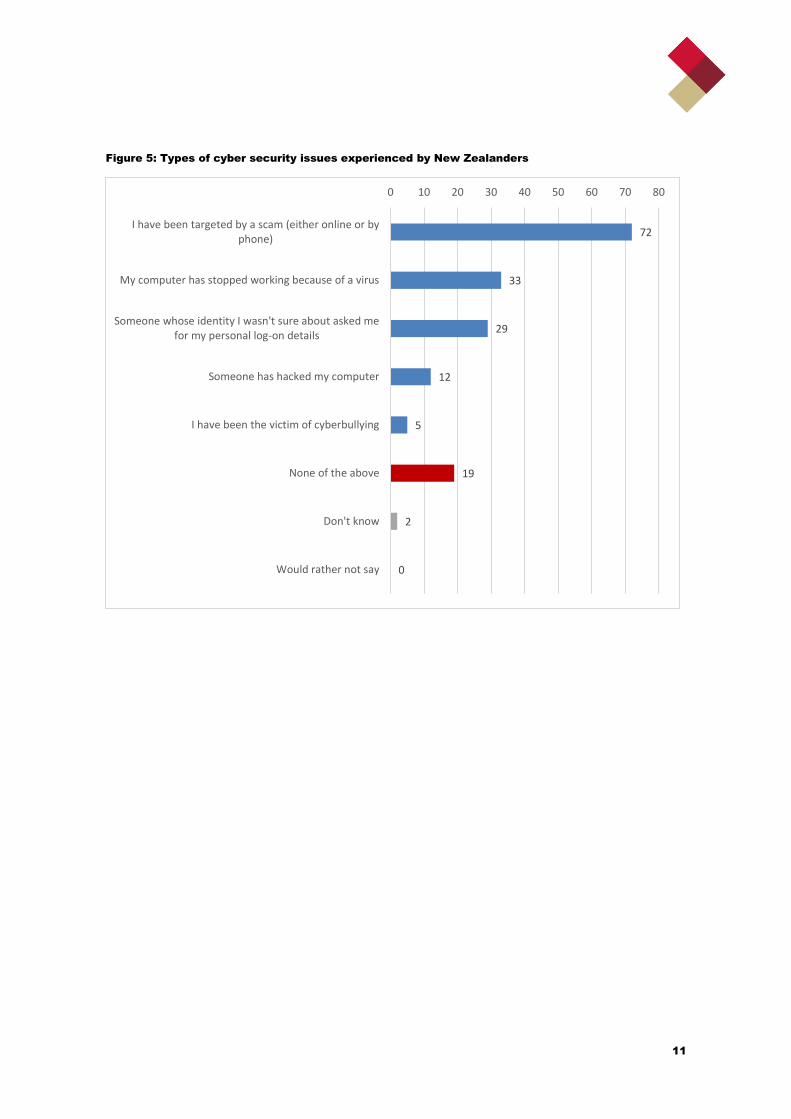
As illustrated in Figure 5 overleaf, almost three-quarters of respondents reported that they had been
targeted by a scam (either online or by phone) (72 percent). Only about one in five New Zealanders
stated they had never experienced a cyber security issue (19 percent).
One third of respondents also stated their computers had stopped working because of a virus.
Almost one third stated they had been asked for their personal log-on details by someone whose
identity they weren’t sure of (29 percent). Twelve percent stated their computer had been hacked
and five percent stated they had been the victim of bullying.
There are some differences in the profile of respondents who stated they had been a victim of any
cyber security issue and those who had not. These differences can be summarised as follows:
By age:
Younger respondents, aged 18 to 34 years, were more likely to have never experienced a cyber
security issue when compared to those who have (37 percent compared to 27 percent).
By device ownership:
Respondents who had experienced a cyber security issue where more likely to own or have
access to a PC (49 percent) when compared with those who had never experienced such an
issue (38 percent).
By social media disconnection:
Respondents who had experienced a cyber security issue were also more likely to have
disconnected from social media for a prolonged period of time in the last year (nine percent) or
had thought about it (30 percent) (this compares with one percent and 20 percent respectively,
of those who have not had a cyber security related issue).
11
Figure 5: Types of cyber security issues experienced by New Zealanders
72
33
29
12
5
19
2
0
0 10 20 30 40 50 60 70 80
I have been targeted by a scam (either online or byphone)
My computer has stopped working because of a virus
Someone whose identity I wasn't sure about asked mefor my personal log-on details
Someone has hacked my computer
I have been the victim of cyberbullying
None of the above
Don't know
Would rather not say
12
Over three-quarter of adult New Zealanders believe that cyber security is a major issue
To better understand New Zealanders’ attitudes toward cyber security, respondents were
presented with a list of statements and asked on a 11-point scale to rate their level of agreement
with each of them, where 0 was ‘strongly disagree’ and 10 was ‘strongly agree’.
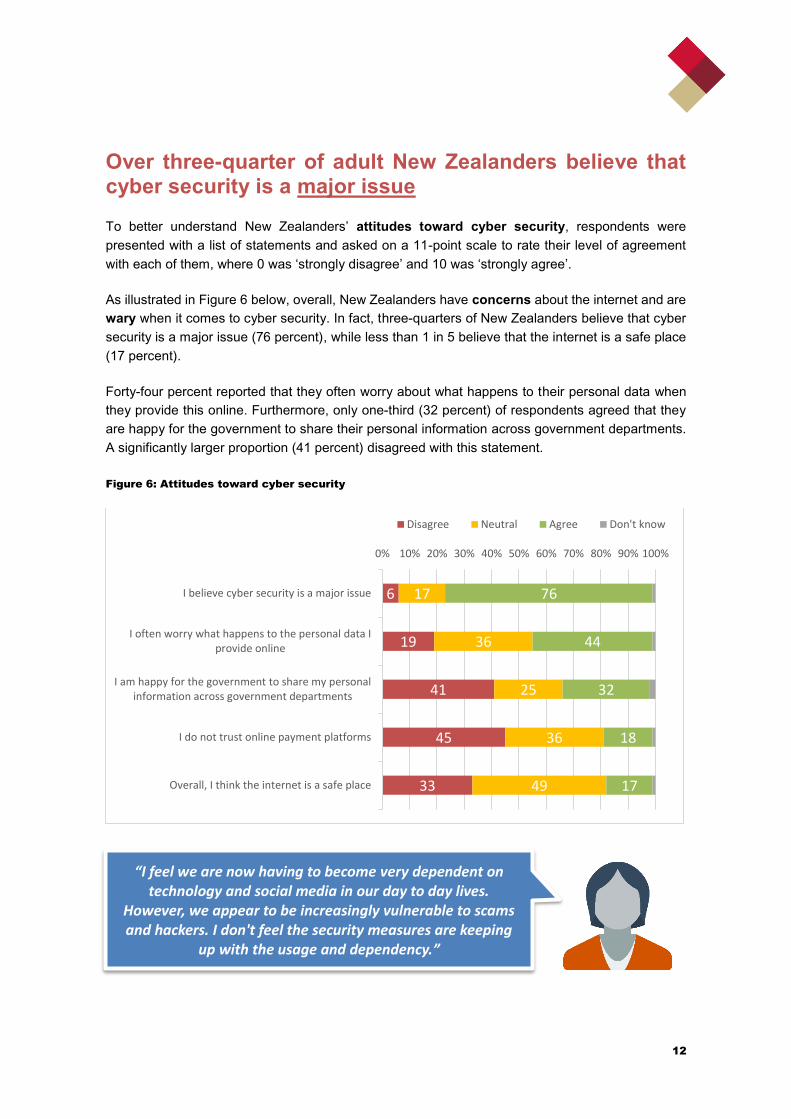
As illustrated in Figure 6 below, overall, New Zealanders have concerns about the internet and are
wary when it comes to cyber security. In fact, three-quarters of New Zealanders believe that cyber
security is a major issue (76 percent), while less than 1 in 5 believe that the internet is a safe place
(17 percent).
Forty-four percent reported that they often worry about what happens to their personal data when
they provide this online. Furthermore, only one-third (32 percent) of respondents agreed that they
are happy for the government to share their personal information across government departments.
A significantly larger proportion (41 percent) disagreed with this statement.
Figure 6: Attitudes toward cyber security
6
19
41
45
33
17
36
25
36
49
76
44
32
18
17
0% 10% 20% 30% 40% 50% 60% 70% 80% 90% 100%
I believe cyber security is a major issue
I often worry what happens to the personal data Iprovide online
I am happy for the government to share my personalinformation across government departments
I do not trust online payment platforms
Overall, I think the internet is a safe place
Disagree Neutral Agree Don't know
“I feel we are now having to become very dependent on technology and social media in our day to day lives.
However, we appear to be increasingly vulnerable to scams and hackers. I don't feel the security measures are keeping
up with the usage and dependency.”
13
Appendix A: Survey methodology
This report presents the results to the Social Media and Cyber Security modules
contained in the fourth Research New Zealand Mobile Communication Device Use
Survey.
Fieldwork took place between February and May 2018 and was administered online using Research
New Zealand’s own online panel. A nationally representative sample of n=1,002 New Zealanders,
18 year of age and over, was interviewed.
The data has been weighted to ensure that the results are truly representative of the New Zealand
population. The weighting parameters were sourced from Statistics New Zealand and are based on
the 2013 Census of Population and Dwellings.
Results based on the (weighted) total sample are subject to a maximum margin of error of +/- 4.0
percent (at the 95 percent confidence level)1. This means, for example, that if 50 percent of
respondents owned a smartphone, we could be 95 percent sure of getting the same result, plus or
minus 4.0 percent, had we interviewed everyone in the population. Higher margins of error apply in
the case of sub-samples.
1 The margin of error is slightly higher than the conventional margin of error calculation as it takes into account the fact that
the data has been weighted.