A report in the Mapping Queensland’s Creative...
72
Creative Industries Research and Applications Centre Queensland University of Technology A report in the Mapping Queensland’s Creative Industries series creative i ndustries research and applications centre C iRAC a university for the
Transcript of A report in the Mapping Queensland’s Creative...

Creative Industries Research and Applications CentreQueensland University of Technology
A report in the Mapping Queensland’s Creative Industries series
creative industries research and applications centreCiRACa university for the

MAPPING QUEENSLAND'S CREATIVE INDUSTRIES: ECONOMIC FUNDAMENTALS
Citation: SGS Economics and Planning Pty Ltd in conjunction with Creative IndustriesResearch and Applications Centre (2005) Mapping Queensland’s CreativeIndustries: Economic Fundamentals. Technical Report, CIRAC, QueenslandUniversity of Technology. 0ISBN: 1 74107 088 0 0
Key Words Creative Industries, Economic Impacts; Cluster Linkages; Critical EconomicGrowth, Queensland 0
Abstract: This report, “Mapping Queensland's Creative Industries: EconomicFundamentals”, is part of a series of research reports titled MappingQueensland's Creative Industries. The research has been undertaken by theCreative Industries Research and Applications Centre (CIRAC) atQueensland University of Technology. The project has been funded by anAustralian Research Council Linkage grant (LP0219438) with the support ofthe Brisbane City Council Department of Economic Development, ArtsQueensland, and the Department of State Development (now Department ofState Development, Trade and Innovation). 0
Reports in the Mapping Queensland’s Creative Industries series include:
1 Brisbane's Creative Industries 2003
2 Queensland Music Industry Value Web: From the Margins to the Main-stream
3 Queensland Music Industry Basics: People, Businesses and Markets
4 Queensland Music Industry Trends: Independence Day?
5 Mapping Queensland’s Creative Industries: Economic Fundamentals
6 The Ecology of Queensland Design
For copies of the reports see: <http://eprints.qut.edu.au> 0
Disclaimer The report has been prepared by SGS Economics and Planning Pty Ltd inconjunction with Creative Industries Research and Applications Centre. Anyrepresentation, statement, opinion or advice expressed or implied in thispublication is made in good faith. CIRAC and/or SGS Economics andPlanning are not liable to any person or entity for any damage or loss that hasor may occur in relation to that person or entity taking or not taking action inrespect of any representation, statement, opinion or advice referred toabove. 0
Acknowledgements CIRAC wishes to thank the Australian Research Council for its financialsupport as a Linkage Project (LP0219438) and CIRAC’s industry partners(Brisbane City Council, Arts Queensland and the Department of StateDevelopment, Trade and Innovation) for their support and co-operation onthis project. In particular, CIRAC appreciates the assistance and contributionto this report by the following: Lisa Hewson from Community and EconomicDevelopment at Brisbane City Council, Bret Mannison from the Policy Unitat Arts Queensland, and Stewart MacIntyre from the Department of StateDevelopment, Trade and Innovation. 0

creative industries research and applications centreCiRAC
Pageii
Table of Contents
1 Introduction . . . . . . . . . . . . . . . . . . . . . . . . . . . . . . . . . . . . . . . . . . . . . . . . . . . . . . . . . . . . . . . . . . . . . . . . . . . . . . . . . . . . . . . . . . . . . . . . . . . 1
1.1 Background and Objective .............................................................................................................................................1 1.2 Defining Queensland’s Creative Industries ....................................................................................................................1
1.2.1 Six Creative Industries Segments ................................................................................................................1 1.2.2 Creative Industries’ Characteristics .............................................................................................................3
1.3 A Global Phenomenon – the Rise of Knowledge and Creativity as Drivers of Economic Growth............................................................................................................................................................................4
1.3.1 Creative Industries are High Value ..............................................................................................................4 1.3.2 ‘Creativity’ is a Critical Economic Growth Factor ......................................................................................4 1.3.3 Governments Recognise Creative Industries’ Potential ...............................................................................4
1.4 The Creative Industries Challenge..................................................................................................................................5
1.4.1 Growing Competitive Clusters ....................................................................................................................5 1.4.2 Economic Clusters Defined .........................................................................................................................6
1.5 An Empirical Survey-based Study Approach .................................................................................................................8
1.5.1 A Purpose-built Input-Output Model ...........................................................................................................8 1.5.2 The Creative Industries Survey....................................................................................................................8
2 Creative Industries – Economic Impacts and Cluster Linkages . . . . . . . . . . . . . . . . . . . . . . . . . . 9
2.1 Capturing the Data – the Creative Industries Survey......................................................................................................9 2.2 An Economic Model of Queensland’s Creative Industries........................................................................................... 10 2.3 Creative Industries Economic Impacts and Cluster Linkages....................................................................................... 12
2.3.1 Output ........................................................................................................................................................ 12 2.3.2 Employment............................................................................................................................................... 14 2.3.3 Value Added .............................................................................................................................................. 17
2.4 Creative Industries Segments – Economic Impacts ...................................................................................................... 26
2.4.1 Advertising, Graphic Design & Marketing ................................................................................................ 26 2.4.2 Architecture, Visual Arts & Design........................................................................................................... 32 2.4.3 Music Composition & Production ............................................................................................................. 38 2.4.4 Writing, Publishing & Print Media ............................................................................................................ 44 2.4.5 Film, Television & Entertainment Software .............................................................................................. 50 2.4.6 Performing Arts ......................................................................................................................................... 57
3 Summary and Conclusions . . . . . . . . . . . . . . . . . . . . . . . . . . . . . . . . . . . . . . . . . . . . . . . . . . . . . . . . . . . . . . . . . . . . . . . . . . . . 63
References

creative industries research and applications centreCiRAC
List of Figures
Figure 1 The Six Creative Industries Segments...................................................................................................................2 Figure 2 Regional Cluster Framework ................................................................................................................................7 Figure 3 Share of Output by Creative Industries Segment, Queensland............................................................................ 12 Figure 4 Creative and Non-creative Employment by Segment, Queensland..................................................................... 15 Figure 5 Share of Value Added by Creative Industries Segment, Queensland.................................................................. 17 Figure 6 Value Added Contribution to Output by Creative Industries Segment, Queensland........................................... 18 Figure 7 Sector Summary - Advertising, Graphic Design and Marketing Segment .......................................................... 29 Figure 8 Sector Summary - Architecture, Visual Arts & Design....................................................................................... 35 Figure 9 Sector Summary - Music Composition & Production ......................................................................................... 41 Figure 10 Sector Summary - Writing, Publishing & Print Media........................................................................................ 47 Figure 11 Sector Summary - Film, Television & Entertainment Software.......................................................................... 53 Figure 12 Sector Summary - Performing Arts Segment ...................................................................................................... 60

creative industries research and applications centreCiRAC
List of Tables Table 1 Queensland’s Creative Industries as Defined by the Australian and New Zealand Standard Industrial
Classification (ANZSIC).......................................................................................................................................9 Table 2 Employment in Queensland’s Creative Industries Segments .............................................................................. 14 Table 3 Structure of Employment within Creative Industries Segments.......................................................................... 16 Table 4 Output Demand Side Linkages (Backward Multipliers) ..................................................................................... 20 Table 5 Output Multipliers Supply Side Linkages (Forward Multipliers)........................................................................ 21 Table 6 Employment Demand Side Linkages (Backward Multipliers) ............................................................................ 21 Table 7 Employment Supply Side Effects (Forward Multipliers) .................................................................................... 22 Table 8 Value Added Demand Linkages (Backward Multiplier) ..................................................................................... 24 Table 9 Value Added Supply Linkages (Forward Multiplier).......................................................................................... 25 Table 10 Advertising, Graphic Design & Marketing Input Flows ..................................................................................... 27 Table 11 Advertising, Graphic Design and Marketing Output Flows ................................................................................ 28 Table 12 Advertising, Graphic Design and Marketing Demand Multipliers...................................................................... 30 Table 13 Advertising, Graphic Design and Marketing Supply Multipliers ........................................................................ 31 Table 14 Architecture, Visual Arts & Design Input Flows ................................................................................................ 33 Table 15 Architecture, Visual Arts & Design Output Flows.............................................................................................. 34 Table 16 Architecture, Visual Arts & Design Demand Multipliers ................................................................................... 36 Table 17 Architecture, Visual Arts & Design Supply Multipliers...................................................................................... 37 Table 18 Music Composition & Production Input Flows................................................................................................... 39 Table 19 Music Composition & Production Output flows ................................................................................................. 40 Table 20 Music Composition & Production Demand Multipliers...................................................................................... 42 Table 21 Music Composition & Production Supply Multipliers ........................................................................................ 43 Table 22 Writing, Publishing & Print Media Input flows .................................................................................................. 45 Table 23 Writing, Publishing & Print Media Output flows................................................................................................ 46 Table 24 Writing, Publishing & Print Media Demand Multipliers .................................................................................... 48 Table 25 Writing, Publishing & Print Media Supply Multipliers....................................................................................... 49 Table 26 Film, Television & Entertainment Software Input flows .................................................................................... 51 Table 27 Film, Television & Entertainment Software Output flows.................................................................................. 52 Table 28 Film, Television & Entertainment Software Demand Multipliers....................................................................... 55 Table 29 Film, Television & Entertainment Software Supply Multipliers......................................................................... 56 Table 30 Performing Arts Input Flows............................................................................................................................... 58 Table 31 Performing Arts Output Flows ............................................................................................................................ 59 Table 32 Performing Arts Demand Multipliers.................................................................................................................. 61 Table 33 Performing Arts Supply Multipliers.................................................................................................................... 62

creative industries research and applications centreCiRAC
Mapping Queensland’s Creative Industries: Economic Fundamentals
Page. 1
1 Introduction
1.1 Background and Objective
'Creative industries' is a new term in academic, policy and industry communication. It captures new economy dynamics which older categorisations like 'the arts', 'media' and 'cultural industries' did not. This project – Mapping Queensland’s Creative Industries: Economic Fundamentals– has been undertaken to help advance the conceptualisation of creative industries, and to assist policy makers and industry by analysing creative industries’ dynamics and value to the Queensland economy. Significantly, it highlights the integrated value chain relationships that exist between industries rather than concentrating on the 'silo' constructions of individual industry sectors. The Mapping Queensland’s Creative Industries: Economic Fundamentals has been commissioned and led by the Creative Industries Research & Applications Centre (CIRAC) within the Queensland University of Technology (QUT). CIRAC has administered the research for this project as part of its mission to contribute to the research and applications needs of the creative industries locally, at a state level, nationally and internationally. This report presents data that will assist industry partners in developing informed economic and cultural development strategies. By developing a better understanding of the scale and dynamics of creative industries in Queensland, the Mapping Queensland’s Creative Industries: Economic Fundamentals can inform the continual development of appropriate government policy that assists all businesses within and supporting the creative industries. In short, by enhancing the collective knowledge and understanding of the creative industries, the project outcomes will help inform policy planning, research priorities and investment strategies.
1.2 Defining Queensland’s Creative Industries
1.2.1 Six Creative Industries Segments
The term ‘creative industries’ is relatively new to Australia, but has been adopted in recent years by countries across the globe including the UK, Canada, Denmark, Singapore and New Zealand. In 2004 the Queensland Government released its creative industries strategy titled “Creativity is Big Business: A Framework for the Future”. The strategy identifies six interrelated creative industries segments. These six segments have been adopted as the basis for the cluster mapping and value chain analysis reported in this document.
creative industries research and applications centreCiRAC
Mapping Queensland’s Creative Industries: Economic Fundamentals
Page. 2
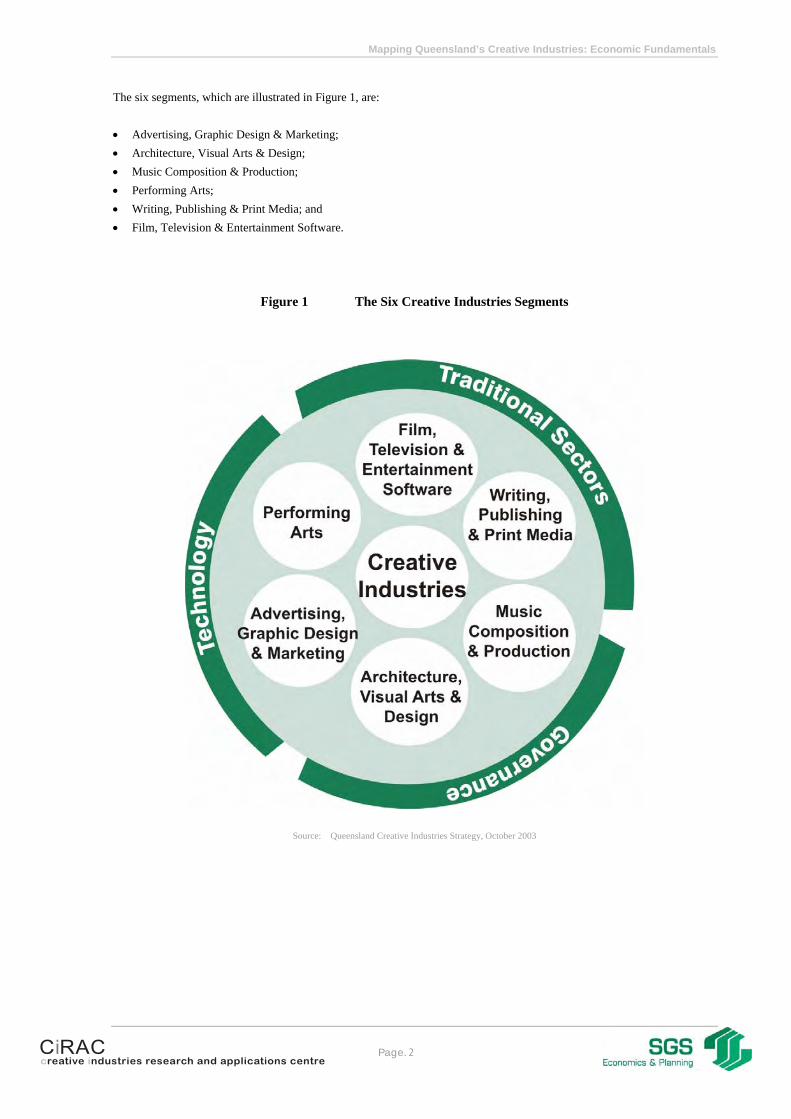
The six segments, which are illustrated in Figure 1, are: • Advertising, Graphic Design & Marketing; • Architecture, Visual Arts & Design; • Music Composition & Production; • Performing Arts; • Writing, Publishing & Print Media; and • Film, Television & Entertainment Software.
Figure 1 The Six Creative Industries Segments
Source: Queensland Creative Industries Strategy, October 2003

creative industries research and applications centreCiRAC
Mapping Queensland’s Creative Industries: Economic Fundamentals
Page. 3
Figure 1, which is taken from the Queensland Creative Industries Strategy, shows how the six segments relate to each other and to the external environment. The external environment includes traditional industries such as manufacturing, business services and construction for example. It also includes government and other institutions, such as universities and research organisations as well as industry peak bodies (collectively referred to as governance). It also includes new technologies that are constantly emerging and which are influencing, or being influenced by, the development of the creative industries.
1.2.2 Creative Industries’ Characteristics
Creative industries are best understood as businesses whose products’ origins lie in individual creativity, skill and talent. They have the potential to generate sustained wealth and job creation through the generation, utilisation and commercialisation of their intellectual property. While creative industries are often micro businesses or small to medium sized enterprises that focus on local markets, they can develop into economic clusters, helping to drive economic growth and development by exporting their intellectual property outside their own regions, either nationally or internationally. The creative industries include, but are not limited to, those industry sectors that are characterised by new forms of cultural production. Leveraging cultural roots and assets but focusing on generating an export income, creative industries link creativity with commercial markets. Highly dependent on creative talent, their economic value lies in their intellectual property. In other words, they can be distinguished from other industries because ‘creativity’ is their primary source of value. The creative industries include traditional cultural sectors like the visual and performing arts, acknowledging the role that culture has in economic development, both as an essential economic input foundation, or piece of ‘enabling infrastructure’, as well as an export earner in its own right. They also include ‘creative enterprises’, which utilise creative (human) capital and technology to generate wealth in sectors that are often dubbed ‘new media’ or ‘multi-media’ and which include a range of activities in areas like film and television, broadcasting, computer animation, web design and music. Creative industries also comprise a range of other ‘knowledge based’ sectors including architecture and urban design, industrial design, designer fashion, writing and publishing. Creative industries are like any business in that they manufacture a product or provide a service. The product or service provided in the case of creative industries is intellectual property.

creative industries research and applications centreCiRAC
Mapping Queensland’s Creative Industries: Economic Fundamentals
Page. 4
1.3 A Global Phenomenon – the Rise of Knowledge and Creativity as Drivers of Economic Growth
1.3.1 Creative Industries are High Value
The creative industries are gaining visibility as they become a growing source of direct exports to the global marketplace. Recent estimates suggest that the creative industries are worth $US2.25 trillion (AUD $3.0 trillion) worldwide (and are rapidly growing).1 Of this growing market: • Music Composition and Production was US$40 billion in 2002; • Film, Television and Entertainment Software was: Film market US$12 billion in 2002; television distribution market is
estimated at US$154.3 billion in 2002; and computer games and entertainment software was expected to reach US$35 billion in 2007;
• Architecture, Visual Arts and Design together were up to US$8 billion; • Performing Arts was part of the US$213.7 billion in worldwide trade in cultural goods; • Writing, Publishing and Print Media amounted to US$120 billion in 1999; and • Advertising, Graphic Design and Marketing services were key parts of a total US$435 billion wider “advertising
market” outside the US in 1998, and a $60 billion in the U.S.2
1.3.2 ‘Creativity’ is a Critical Economic Growth Factor
A key feature of economic globalisation over the past twenty years has been the ‘unbundling’ of the value chain where key corporate input is increasingly outsourced by larger firms to specialist providers of business and technical services. As a result, creative industries have grown as they provide inputs that are central to businesses across many industries, from manufacturing and construction to retailing and entertainment. Creative industries add value to production through design, technical performance, packaging and branding. For this reason, ‘creativity’ has become a critical growth factor in the development of all industry sectors looking for a competitive edge in the global marketplace.
1.3.3 Governments Recognise Creative Industries’ Potential
The Commonwealth Government has recognised the importance and growth potential of the creative industries and in 2002 commissioned a national creative industries cluster study. That study indicated that Australia’s creative industries (using a broader definition of the term than that used in this report) are a high growth sector which was worth $19 billion in 2000. It also suggested that the economic multipliers arising from the creative industries are significant and that Australia has
1 Source: Howkins, John (2001), The Creative Economy: How people make money from ideas,
Allen Lane, The Penguin Press 2 Source: various, as quoted in the Queensland Creative Industries Strategy (October 2003)

creative industries research and applications centreCiRAC
Mapping Queensland’s Creative Industries: Economic Fundamentals
Page. 5
established a significant niche position in the areas of film, television, computer games, indigenous art and media, particularly in relation to international markets.3 The Queensland Creative Industries Strategy indicates that the State’s creative industries are still an emerging sector. Queensland’s creative industries primarily consist of smaller and younger enterprises. Enhancing and sustaining the economic potential of these industries is a focus of the Queensland Government.
1.4 The Creative Industries Challenge
1.4.1 Growing Competitive Clusters
While often characterised by ‘micro’ businesses or small to medium sized enterprises (SMEs), creative industries can develop into powerful economic clusters, helping to drive economic growth and development by exporting their intellectual property. The Queensland Creative Industries Strategy (QCIS) promotes the merits of a cluster-based approach to facilitating the growth of Queensland’s creative industries and therefore, the State’s economic prosperity. The six segments illustrated in Figure 1 each represent a ‘cluster’ of creative industries, each one in a different phase of its economic lifecycle. This project is designed to build on the findings of the QCIS by providing more intelligence on the creative industries through empirically-based cluster mapping and value chain analysis.
3 Commonwealth Department of Communications and Information Technology and National Office
of the Information Economy (2002), Creative Industries Cluster Study: Stage One and Two Reports, Canberra

creative industries research and applications centreCiRAC
Mapping Queensland’s Creative Industries: Economic Fundamentals
Page. 6
1.4.2 Economic Clusters Defined
A regional cluster is not simply a bunch of co-located businesses. Taking the originator of the term, Michael Porter’s definition (1990)4, a cluster can be described as a group of linked enterprises and institutions, which directly or indirectly share a common purpose in holding and expanding an export income for a region. In doing so, clusters draw on common talent (skills), technology, infrastructure, and support base. While it is true that regional clusters often sit within a recognised geographic community, these are quite large and by necessity, go beyond the area of the local business & industry precinct or urban area. Successful clusters typically have strong, competitive businesses, appropriate research and education facilities and supportive labour markets, infrastructures, policy and governance environments. A successful cluster, or industries that satisfy the general principles of successful clusters, will comprise: • The key exporter firms; • The supply chains (input suppliers) linked to those firms; • The R&D institutions, which help spark innovation in product development; • Education and training institutions (TAFEs, universities and other training providers), which help the skills flow to match
innovation; • Providers of advanced business services such as legal, accounting, finance and business management services, which
serve the operation of cluster businesses; • Government agencies, which are responsible for policies and programs at the higher planning level, and regulations and
infrastructure on the ground, which frame and support business and industry; • ‘Hard’ and ‘soft’ infrastructure service providers (both private and government); and • The planning, lobbying and industry leadership groups, which help develop an awareness of business and industry needs
and work to keep government policies aligned with competitive interests. Figure 2 illustrates this regional cluster framework.
4 Porter, M.E. (1990), The Competitive Advantage of Nations, Macmillan

creative industries research and applications centreCiRAC
Mapping Queensland’s Creative Industries: Economic Fundamentals
Page. 7
Figure 2 Regional Cluster Framework
Source: SGS Economics and Planning
Creative industries clusters (like any industry cluster) cannot be artificially created. Cluster development must be industry led; it must be based on local competencies and start from an established base of firms. Nevertheless, governments and institutions (such as Universities and research bodies) do have a role to play and can support cluster development by providing the information, infrastructure and forums through which they can grow. Importantly, all components of an economic cluster, from support institutions to input suppliers to exporting businesses, should be seen to be continually evolving. Over time a cluster may develop new products, new markets and new requirements, and generate new industries that allow new businesses to form. These sorts of developments may lead to the emergence of a separate cluster in its own right. Equally, just because two or more separate industries are ‘creative’ this does not necessarily make them cluster partners. Just the same, different creative industries clusters can be interrelated with, for example, graphic design firms providing critical input for marketing music or music composers providing input to a film or television production.

creative industries research and applications centreCiRAC
Mapping Queensland’s Creative Industries: Economic Fundamentals
Page. 8
1.5 An Empirical Survey-based Study Approach
1.5.1 A Purpose-built Input-Output Model
The strategies and actions contained in the 2003 Queensland Creative Industries Strategy (QCIS) were partly informed by information collected and analysed as part of that exercise on the value of the creative industries to the Queensland economy. However, that analysis, while thorough, was limited by the fact that it relied on estimates of the worth of the State’s creative industries from interpretations of published data. This included the Australian Bureau of Statistics’ (ABS) Journey to Work data and Queensland Treasury’s Input-Output tables, which focus on traditional industry categories. This Creative Industries Cluster Mapping & Value Chain Analysis differs in that the creation of a purpose-built Input-Output table has been informed by an extensive survey of over 350 businesses across Queensland’s six creative industries segments. Survey participants were asked to provide information on their number of ‘creative’ as distinct from other employees (e.g. administrative), their products and production levels, markets and production inputs and spatial information relating to the inputs and outputs of industries. While the Creative Industries Cluster Mapping & Value Chain Analysis adds significantly to our understanding of the value and dynamics of the creative industries, it has some limitations. It is not a complete census of the creative industries in Queensland, but is a sample of creative industries with reasonable representation. Nevertheless, it is superior to any previous efforts to model the value and dynamics of Queensland’s creative industries.
1.5.2 The Creative Industries Survey
The study findings are based on a telephone survey of businesses defined as belonging to the creative industries. There is some limitation in that the creative industries are rapidly evolving and therefore, difficult to define, at least by standard industry classification methods. Therefore, the ability to accurately quantify the value and dynamics of the creative industries is limited by the difficulty in defining what constitutes ‘creative’. Accurately quantifying the creative industries is faced with some other limitations. For example, information on each firm’s accounting practices was not practically available and so the analysis relies on the information provided by business representatives during the interviews. Information provided was qualified through an additional round of in-depth face-to-face interviews with a small sample of businesses in the six creative industries segments. The baseline information upon which the value and dynamics of the creative industries was estimated (using the survey findings), is sourced from the National Accounts of the Australian Bureau of Statistics (ABS). The survey results, and the economic modelling that they inform, have been used to identify the interrelationships between creative industries and between creative enterprises and other industries. Despite the data limitations, the economic modelling has estimated, with greater certainty than before, the contribution of the creative industries to the Queensland economy in terms of output, employment and value added.

creative industries research and applications centreCiRAC
Mapping Queensland’s Creative Industries: Economic Fundamentals
Page. 9
2 Creative Industries – Economic Impacts and Cluster Linkages
2.1 Capturing the Data – the Creative Industries Survey
The survey created for the Cluster Mapping & Value Chain Analysis was administered to businesses in 23 industry sectors within the six creative industries segments. The 23 industry sectors are defined according to the Australia and New Zealand Standard Industrial Classification (ANZSIC). Table 1 shows the six creative industries segments and the 23 sectors that fall under those as defined for the purposes of this study. Table 1 Queensland’s Creative Industries as Defined by the Australian and New Zealand
Standard Industrial Classification (ANZSIC)
Creative Industries Segment ANZSIC Industry Code & Industry Sector
Writing, Publishing & Print Media: 2421 Newspaper Printing or Publishing 2422 Other Periodical Publishing 2423 Book and Other Publishing 2430 Recorded Media Manufacturing & Publishing
Architecture, Visual Arts and Design: 7821 Architectural Services 7869 Business Services nec 9523 Photographic Studios 7823 Consulting Engineering Services
Advertising, Graphic Design & Marketing: 7851 Advertising Services
7852 Commercial Art and Display Services
Film, Television & Entertainment Software: 7834 Computer Consultancy Services 9111 Film and Video Production 9112 Film and Video Distribution 9113 Motion Picture Exhibition 9121 Radio Services 9122 Television Services
Performing Arts: 8440 Other Education 9241 Music and Theatre Productions 9252 Performing Arts Venues 9259 Services to the Arts, nec 9330 Other Recreation Services
Music Composition and Production: 9251 Sound Recording Studios 9242 Creative Arts
Source: CIRAC and SGS Economics and Planning

creative industries research and applications centreCiRAC
Mapping Queensland’s Creative Industries: Economic Fundamentals
Page. 10
2.2 An Economic Model of Queensland’s Creative Industries
Using the creative industries business survey outputs, it was possible to modify the Queensland 107 industry sector Input-Output Table as produced by Queensland Treasury to estimate the impact (or worth) of Queensland’s creative industries segments to the Queensland economy. Economic impact assessment examines how a particular project or industry affects an economy through all of the backward and forward linkages between industries. In short, economic impact assessment takes the initial effect of a project or industry stimulus, known as the ‘economic stimulus’, and traces all of the multiplier or ‘flow-on’ effects – ‘production’ and ‘consumption’ induced effects - in the national, State or regional economy. The final result is an overall picture of the industry’s total economic impact. Economic impact assessment is based on the following: Total Effects = (Initial Effect) + (Flow On Effects)
= (Initial Effect) + (Production Induced Effects + Consumption Induced Effects) In the second equation above, production induced effects relate to how local upstream industries benefit from the increased demand for their goods and services as a result of gaining project related supply contracts, and their increases in local purchasing required which enables them to service these supply contracts. Consumption induced effects relate to the increased regional spending of project associated wage and salary earners on items such as food, clothing, housing, etc. and how local suppliers’ purchases change in order to meet the induced sales. In economic impact assessment a project’s (or industry’s) initial effect and its flow-on effects are usually expressed in terms of impacts on regional economic output, value added and employment.5 These impacts are described as follows: • Output refers to the value of total purchases of goods and services produced in the economy (i.e. expenditure). It is the
value of goods and services that are produced using a combination of factor inputs, including imports. • Value Added is the contribution to Gross State Product and is the equivalent of net output. It refers to each industry’s
contribution to the value of all goods and services produced in the Queensland economy less the value of goods and services imported into the State. It represents an industry’s contribution to the sum of all private consumption expenditure, private investment expenditure, government consumption and investment expenditure and exports less imports from interstate and from overseas. By excluding imports, ‘value added’ avoids double counting as it does not include expenditure that is actually escaping from the regional economy via imports. In other words, it represents only the value added to products and services that the creative businesses in Queensland produce.
• Employment refers to the number of jobs according to the ABS Journey to Work (JTW) data (jobs recorded by location).
This translates to total full-time, part-time and casual employment as reported by the Census.
5 While these measures describe how the initial effect is manifest in a regional economy in
different ways, they are not cumulative.

creative industries research and applications centreCiRAC
Mapping Queensland’s Creative Industries: Economic Fundamentals
Page. 11
An analysis of the demand side multipliers (also known as the backward multipliers) for each industry in each creative industries segment is provided in the tables below. Demand side multipliers are the most commonly used method to evaluate change in the economy given investment in an industry. We can derive the Demand Side multipliers by examining the products and services that the industry under investigation needs to purchase in order to meet production requirements. If production levels increase, then the suppliers to the creative industries must increase their production levels to meet demand and must purchase more products and services, including labour inputs (i.e. employees) as a result. For example, looking at Table 4 , if the Performing Arts segment increases its demand by $1, it requires all industries in the Queensland economy to generate $3.06 worth of goods and services (the Total Multiplier) that eventually supply the Performing Arts Sector. The $2.06 flow-on effect plus the initial increase in $1 of production totals an overall increase of $3.06 in the Queensland economy. This figure is the demand side (or backward) multiplier. Demand side multipliers have been provided in the tables below for Output, Value Added and Employment for all industries in Queensland. Another form of Input Output analysis is the generation of supply side multipliers (also known as the forward multipliers). These multipliers are similar in nature to the backward multiplier, but instead examine which sectors the industry is supplying products to (as opposed to the industries it purchases from). Supply side multipliers are less commonly used for economic analysis, as it is assumed that there is unlimited demand for the products and services supplied by the industry. In reality, this assumption does not hold due to the fact there are limited customers in the market place and some may not require the associated increase in the product or service produced. Nevertheless, supply side multipliers are good indicators of the economic sectors that will benefit due to the increased supply of a certain creative industries product or service. In this way the supply side multiplier can be used to examine which industries in the economy are ultimately responsible for the demand of the industry under study. This is particularly useful for understanding inter-industry dynamics in an economy. Again, supply side multipliers are provided in the tables below in terms of Industrial Output, Value Added and Employment.

creative industries research and applications centreCiRAC
Mapping Queensland’s Creative Industries: Economic Fundamentals
Page. 12
2.3 Creative Industries Economic Impacts and Cluster Linkages
2.3.1 Output
Value
According to the Input-Output modelling, Queensland’s creative industries generate output to the value of approximately $3.4 billion. Figure 3 shows the value of Queensland’s six creative industries segments.
Figure 3 Share of Output by Creative Industries Segment, Queensland
Film, Television & Entertainment
Software,$0.85 billion
Performing Arts,$0.22 billion
Writing, Publishing & Print Media, $0.88
billion
Architecture, Visual Arts & Design, $0.60
billionAdvertising, Graphic Design & Marketing,
$0.70 billion
Music Composition & Production, $0.14
billion
Source: Creative Industries Cluster Mapping Survey, 2004 with interpretations by SGS Economics and Planning
As shown in Figure 3, the Writing, Publishing & Print Media segment is the largest contributor to creative industries output in Queensland ($880 million or 26% of total creative industries output). This is followed closely by Film, Television & Entertainment Software ($850 million or 25%) then Advertising, Graphic Design & Marketing ($70 million or 21%).

creative industries research and applications centreCiRAC
Mapping Queensland’s Creative Industries: Economic Fundamentals
Page. 13
The Music Composition & Production segment is the smallest contributor to creative industries output in Queensland.
Industry F lows: Demand-s ide Mult ipl iers (Backward Linkages)
As seen in Table 4, the creative industries enjoy relatively high demand side multipliers when compared to the rest of the economy, especially within the Music Composition & Production segment, which has the highest output multiplier of all creative industries. A high output multiplier indicates that the industry in question sources most of its required goods and services from local industries (Queensland in this case). Here, the use of imports is limited, and any investment in these industries will be highly beneficial to the local economy as most of the value of that industry’s output is ‘captured’ and retained in Queensland. For policy makers, this means potentially more wealth and more jobs for Queenslanders. Examining the table further, it can be seen that the creative industries have relatively high Output multipliers, primarily due to consumption induced effects such as those seen in the Music Composition & Production segment. This suggests that creative industries are strongly linked to household expenditure and growth in employee wages in the local population.
Industry F lows: Supply -s ide Mult ipl iers (Forward Linkages)
The creative industries’ supply side multipliers (also known as the forward linkages) are shown in Table 5. Here a low multiplier indicates an industry that either has a high export potential or significant gross fixed capital formation, whereas a high multiplier is representative of an important support industry in the local economy. Of the creative industries sectors, it is clear that the Music Composition & Production Segment has a comparatively low supply side multiplier (of 2.0). This is primarily due to that segment’s large export component. This is particularly interesting, as the segment also has a relatively high demand side multiplier of 3.17. This helps to confirm findings from the earlier work of the Queensland Creative Industries Strategy that Music Composition & Production is a small but emerging segment with high growth potential if nurtured, promoted and supported by government and private sector partners.

creative industries research and applications centreCiRAC
Mapping Queensland’s Creative Industries: Economic Fundamentals
Page. 14
2.3.2 Employment
In Queensland, the creative industries collectively employ around 67,500 people and account for about 5% of total employment across all industries. Of these, around 46% are defined as ‘creative’ workers. The remaining 54% are non-creative employees such as administrative and clerical workers (i.e. support staff of the creative workers). As illustrated by the proportion of total employment in Queensland that is attributed to the creative industries, and the proportions of inputs that are made up of compensation of employees (i.e. wages and salaries) we find that the creative industries are more labour intensive than other industry sectors. On average, compensation of employees in the creative industries accounts for 45% of inputs compared to 29% across all other sectors. Therefore, growth in the creative industries can be expected to bring with it significant employment growth. Table 2 shows employment numbers in each of the creative sectors based on ABS Journey to Work (JTW) data. The table identifies the Writing, Publishing & Print Media segment as employing the highest number of people (6,218 or 23% of all people employed in the creative industries). This is followed by the Film, Television & Entertainment Software segment, which employs approximately 6,200 people or just under 23% of people employed in the creative industries. Table 2 Employment in Queensland’s Creative Industries Segments
Segment Total Employment % of creative industries
Creative Non-creative Total Creative Non-creative
Architecture, Visual Arts and Design 9,240 12,875 22,115 29.9% 35.2% Film, Television and Entertainment Software 7,561 9,727 17,288 24.5% 26.6% Performing Arts 8,387 6,664 15,051 27.1% 18.2% Writing, Publishing & Print Media 3,223 2,995 6,218 10.4% 8.2% Advertising, Graphic Design and Marketing 2,078 3,170 5,248 6.7% 8.7% Music Composition and Production 416 1,161 1,577 1.3% 3.2% Total 30,906 36,591 67,497 100% 100%
Source: ABS Journey to Work Data, 2001 and Creative Industries Cluster Mapping Survey, 2004

creative industries research and applications centreCiRAC
Mapping Queensland’s Creative Industries: Economic Fundamentals
Page. 15
Figure 4 illustrates the breakdown of employment into ‘creatives’ and ‘non-creatives’ for each segment. Figure 4 Creative and Non-creative Employment by Segment, Queensland
0
5,000
10,000
15,000
20,000
25,000
Architecture,Visual Arts &
Design
Film, TV &Entertainment
Software
PerformingArts
Writing,Publishing &Print Media
Advertising,Graphic
Design &Marketing
MusicComposition &
Production
Non-creativesCreatives
Source: ABS Journey to Work Data, 2001 and Creative Industries Cluster Mapping Survey, 2004
Table 3 illustrates the structure of employment of Queensland’s creative industries as derived from the survey data. It identifies both the administrative and creative staff in each of the categories of full time, part time and casual. Part time employees are more often administration staff, while casual employees are more likely to be creative. In an overall sense, however, employees in the creative industries are more likely to be employed on a full time basis. For example, 49% of staff in the Writing, Publishing and Print Media segment is employed on a full time basis; 42% is employed part time and 9% as casuals. Creative workers account 60% of all full time staff, and the remaining 40% are administrative workers.

creative industries research and applications centreCiRAC
Mapping Queensland’s Creative Industries: Economic Fundamentals
Page. 16
Table 3 Structure of Employment within Creative Industries Segments
Full time Part Time Casual Creative Admin Creative Admin Creative Admin Writing, Publishing & Print Media 49% 42% 9% 60% 40% 43% 58% 50% 50%
Architecture, Visual Arts and Design 54% 29% 17% 37% 63% 18% 82% 100% 0%
Advertising, Graphic Design and Marketing 58% 41% 1% 45% 55% 31% 69% 85% 15%
Film, Television and Entertainment Software 57% 43% 1%
45% 55% 41% 59% 80% 20%
Performing Arts 47% 34% 19%
72% 28% 39% 61% 46% 54%
Music Composition & Production 21% 79% 0% 35% 65% 24% 76% 0% 0%
Source: Creative Industries Cluster Mapping Survey, 2004
Tables 4 through 9 outline the various employment multipliers within the Queensland economy. The initial multiplier represents the amount of employment generated for every million dollars of output generated. In Table 6 it can be seen that the Performing Arts segment and Music Composition & Production generate high employment numbers for every million dollars of production output (each segment having an initial employment multiplier of 11.6). Of particular note is the demand side multiplier for the Music Composition & Production segment. This multiplier demonstrates that Music Composition & Production has an extremely high consumption induced effect, and if viewed in relation to its industry links, it indicates that any development in this industry will not only generate a large amount of employment within the industry itself, but will also directly generate a substantial amount of employment in supporting sectors, such as retailing. When the supply side multipliers are considered, it is notable that support effects are relatively high in the Performing Arts segment. This is due to the fact that Performing Arts is key input to local industries that have a large employment requirement.

creative industries research and applications centreCiRAC
Mapping Queensland’s Creative Industries: Economic Fundamentals
Page. 17
2.3.3 Value Added
Value and Contr ibut ion to Industry Output
Value added is the equivalent of net output and refers to the value of goods and services produced in the economy less imports. According to the Input-Output modelling, Queensland’s creative industries contribute approximately $1.96 billion to Queensland’s value added. This is worth over half (58%) of the value of Queensland’s creative industries output. By comparison, for the non-creative industry sectors collectively, value added is significantly lower in proportional terms, worth only 45% of total industry output. Figure 5 shows the contribution of Queensland’s six creative industries segments to the State’s value added.
Figure 5 Share of Value Added by Creative Industries Segment, Queensland
Advertising, Graphic Design and Marketing,
$0.43 billion
Film, Television & Entertainment
Software,$0.48 billion
Architecture,Visual Arts and Design,
$0.32 billion
Writing, Publishing & Print Media,$0.48 billion
Performing Arts,$0.15 billion
Music Composition & Production, $0.10 billion
Source: Creative Industries Cluster Mapping Survey, 2004 with interpretations by SGS Economics and Planning

creative industries research and applications centreCiRAC
Mapping Queensland’s Creative Industries: Economic Fundamentals
Page. 18
As shown in Figure 5, the Writing, Publishing & Print Media and Film, Television & Entertainment Software segments both contribute equally the largest share of value added to Queensland’s creative industries ($480 million or 24% of total creative industries value added). This is followed closely by Advertising, Graphic Design & Marketing ($430 million or 22%). The Performing Arts and Music Composition & Production segments are the smallest contributors to creative industries value added in Queensland ($150 million and $100 million respectively). Interestingly, these two sectors also contribute a higher share of value added to their total industry output than any other creative industries segment. Each creative industries segment’s value added contribution to total segment output is illustrated in Figure 6.
Figure 6 Value Added Contribution to Output by Creative Industries Segment, Queensland
55% 53% 62% 56% 68% 76%
0%
10%
20%
30%
40%
50%
60%
70%
80%
Writing,Publishing &Print Media
Architecture,Visual Arts and
Design
Advertising,Graphic Designand Marketing
Film, Television& Entertainment
Software
Performing Arts MusicComposition &
Production
Source: Creative Industries Cluster Mapping Survey, 2004 with interpretations by SGS Economics and Planning
Industry F lows: Demand-s ide Mult ipl iers (Backward Linkages)
The demand and supply value added multiplier tables are provided in Table 8 and Table 9. These tables show how further development in these industries ultimately affect Queensland’s Gross State Product.

creative industries research and applications centreCiRAC
Mapping Queensland’s Creative Industries: Economic Fundamentals
Page. 19
Considering the demand linkages, it can be seen again that both the Performing Arts and Music Composition & Production segments make a substantial contribution to Gross State Product with a total increase of approximately 1.66 and 1.79 respectively for every $1 invested in these sectors.
Industry F lows: Supply -s ide Mult ipl iers (Forward Linkages)
When the supply side value added multipliers are considered, it can be seen that both the Film, Television & Entertainment Software segment and the Music Composition & Production segment have low multipliers. This would be due to the fact both these industries have a high proportion of export sales (and thus have the potential to grow the local economy).

creative industries research and applications centreCiRAC
Mapping Queensland’s Creative Industries: Economic Fundamentals
Page 20
Table 4 Output Demand Side Linkages (Backward Multipliers)
First Industrial Production Consumption
INDUSTRY Initial Round Support Induced Induced Simple Total Type 1A Type 1B Type 2A Type 2B
Effects Effects Effects Effects Effects Multipliers Multipliers
Writing, Publishing & Print Media Segment 1.00 0.34 0.29 0.62 1.26 1.62 2.88 1.34 1.62 2.88 1.88
Architecture, Visual Arts and Design Segment 1.00 0.36 0.33 0.69 1.38 1.69 3.06 1.36 1.69 3.06 2.06
Advertising, Graphic Design and Marketing Segment 1.00 0.28 0.19 0.47 1.57 1.47 3.03 1.28 1.47 3.03 2.03
Film, Television and Entertainment Software Segment 1.00 0.29 0.22 0.51 1.13 1.51 2.64 1.29 1.51 2.64 1.64
Performing Arts Segment 1.00 0.26 0.19 0.45 1.60 1.45 3.06 1.26 1.45 3.06 2.06
Music Composition and Production Segment 1.00 0.21 0.17 0.38 1.79 1.38 3.17 1.21 1.38 3.17 2.17
Agriculture, Forestry and Fishing 1.00 0.48 0.42 0.90 0.75 1.90 2.65 1.48 1.90 2.65 1.65
Mining 1.00 0.37 0.29 0.66 0.86 1.66 2.52 1.37 1.66 2.52 1.52
Manufacturing 1.00 0.51 0.44 0.95 0.89 1.95 2.84 1.51 1.95 2.84 1.84
Electricity, Gas & Water Supply 1.00 0.39 0.29 0.68 0.68 1.68 2.36 1.39 1.68 2.36 1.36
Construction 1.00 0.45 0.41 0.86 0.82 1.86 2.68 1.45 1.86 2.68 1.68
Wholesale Trade 1.00 0.55 0.47 1.01 1.21 2.01 3.22 1.55 2.01 3.22 2.22
Retail Trade 1.00 0.39 0.32 0.71 1.30 1.71 3.01 1.39 1.71 3.01 2.01
Accommodation, Cafes & Rest. 1.00 0.44 0.37 0.81 1.10 1.81 2.91 1.44 1.81 2.91 1.91
Transport & Storage 1.00 0.48 0.42 0.90 0.96 1.90 2.86 1.48 1.90 2.86 1.86
Communication Services 1.00 0.28 0.24 0.52 0.98 1.52 2.51 1.28 1.52 2.51 1.51
Finance & Insurance 1.00 0.36 0.26 0.62 1.14 1.62 2.76 1.36 1.62 2.76 1.76
Property & Business Services 1.00 0.49 0.40 0.89 0.76 1.89 2.64 1.49 1.89 2.64 1.64
Govt. Admin. & Defence 1.00 0.52 0.46 0.98 1.54 1.98 3.52 1.52 1.98 3.52 2.52
Education 1.00 0.13 0.10 0.24 1.99 1.24 3.23 1.13 1.24 3.23 2.23
Health & Community Services 1.00 0.24 0.18 0.42 1.69 1.42 3.10 1.24 1.42 3.10 2.10
Cultural & Recreational Services 1.00 0.47 0.39 0.86 0.96 1.86 2.82 1.47 1.86 2.82 1.82
Personal & Other Services 1.00 0.20 0.17 0.37 1.55 1.37 2.92 1.20 1.37 2.92 1.92

creative industries research and applications centreCiRAC
Mapping Queensland’s Creative Industries: Economic Fundamentals
Page 21
Table 5 Output Multipliers Supply Side Linkages (Forward Multipliers)
First Industrial Production Consumption
INDUSTRY Initial Round Support Induced Induced Simple Total Type 1A Type 1B Type 2A Type 2B
Effects Effects Effects Effects Effects Multipliers Multipliers
Writing, Publishing & Print Media Segment 1.00 0.51 0.25 0.76 1.28 1.76 3.04 1.51 1.76 3.04 2.04
Architecture, Visual Arts and Design Segment 1.00 0.46 0.42 0.89 0.92 1.89 2.81 1.46 1.89 2.81 1.81
Advertising, Graphic Design and Marketing Segment 1.00 0.67 0.47 1.14 1.47 2.14 3.61 1.67 2.14 3.61 2.61
Film, Television and Entertainment Software Segment 1.00 0.38 0.36 0.74 0.70 1.74 2.44 1.38 1.74 2.44 1.44
Performing Arts Segment 1.00 0.35 0.30 0.66 2.01 1.66 3.67 1.35 1.66 3.67 2.67
Music Composition and Production Segment 1.00 0.20 0.11 0.31 0.69 1.31 2.00 1.20 1.31 2.00 1.00
Agriculture, Forestry and Fishing 1.00 0.75 0.79 1.55 1.06 2.55 3.61 1.75 2.55 3.61 2.61
Mining 1.00 0.35 0.30 0.65 0.37 1.65 2.02 1.35 1.65 2.02 1.02
Manufacturing 1.00 0.52 0.38 0.90 0.96 1.90 2.86 1.52 1.90 2.86 1.86
Electricity, Gas & Water Supply 1.00 0.64 0.56 1.20 2.06 2.20 4.26 1.64 2.20 4.26 3.26
Construction 1.00 0.04 0.04 0.09 0.08 1.09 1.17 1.04 1.09 1.17 0.17
Wholesale Trade 1.00 0.52 0.38 0.89 1.22 1.89 3.11 1.52 1.89 3.11 2.11
Retail Trade 1.00 0.13 0.10 0.23 2.74 1.23 3.97 1.13 1.23 3.97 2.97
Accommodation, Cafes & Rest. 1.00 0.27 0.24 0.51 1.93 1.51 3.44 1.27 1.51 3.44 2.44
Transport & Storage 1.00 0.68 0.61 1.28 1.10 2.28 3.38 1.68 2.28 3.38 2.38
Communication Services 1.00 0.74 0.59 1.33 2.01 2.33 4.35 1.74 2.33 4.35 3.35
Finance & Insurance 1.00 0.62 0.60 1.23 2.25 2.23 4.47 1.62 2.23 4.47 3.47
Property & Business Services 1.00 0.61 0.52 1.14 2.11 2.14 4.25 1.61 2.14 4.25 3.25
Govt. Admin. & Defence 1.00 0.52 0.48 1.00 0.87 2.00 2.87 1.52 2.00 2.87 1.87
Education 1.00 0.10 0.09 0.19 1.69 1.19 2.88 1.10 1.19 2.88 1.88
Health & Community Services 1.00 0.15 0.09 0.25 2.40 1.25 3.64 1.15 1.25 3.64 2.64
Cultural & Recreational Services 1.00 0.14 0.06 0.20 2.64 1.20 3.84 1.14 1.20 3.84 2.84
Personal & Other Services 1.00 0.11 0.09 0.20 2.61 1.20 3.82 1.11 1.20 3.82 2.82
Table 6 Employment Demand Side Linkages (Backward Multipliers)

creative industries research and applications centreCiRAC
Mapping Queensland’s Creative Industries: Economic Fundamentals
Page 22
First Industrial Production Consumption
INDUSTRY Initial Round Support Induced Induced Simple Total Type 1A Type 1B Type 2A Type 2B
Effects Effects Effects Effects Effects Multipliers Multipliers
Writing, Publishing & Print Media Segment 7.08 2.00 1.58 3.58 10.24 10.66 20.90 1.28 1.51 2.95 1.95
Architecture, Visual Arts and Design Segment 9.06 2.43 1.80 4.23 11.25 13.28 24.54 1.27 1.47 2.71 1.71
Advertising, Graphic Design and Marketing Segment 7.50 1.91 1.04 2.95 12.77 10.45 23.22 1.26 1.39 3.10 2.10
Film, Television and Entertainment Software Segment 7.31 1.57 1.22 2.79 9.21 10.10 19.31 1.21 1.38 2.64 1.64
Performing Arts Segment 11.60 1.95 1.08 3.03 13.08 14.63 27.71 1.17 1.26 2.39 1.39
Music Composition and Production Segment 11.60 1.45 0.93 2.39 14.56 13.99 28.55 1.13 1.21 2.46 1.46
Agriculture, Forestry and Fishing 8.79 3.47 2.57 6.04 6.10 14.83 20.93 1.39 1.69 2.38 1.38
Mining 1.26 2.37 1.66 4.02 7.00 5.28 12.28 2.88 4.21 9.78 8.78
Manufacturing 4.05 2.62 2.55 5.17 7.24 9.22 16.46 1.65 2.28 4.06 3.06
Electricity, Gas & Water Supply 3.12 1.33 1.61 2.94 5.55 6.06 11.61 1.43 1.94 3.72 2.72
Construction 6.33 2.32 2.25 4.57 6.69 10.89 17.58 1.37 1.72 2.78 1.78
Wholesale Trade 6.71 2.90 2.59 5.49 9.89 12.20 22.10 1.43 1.82 3.29 2.29
Retail Trade 15.09 2.20 1.78 3.99 10.61 19.08 29.69 1.15 1.26 1.97 0.97
Accommodation, Cafes & Rest. 9.81 2.29 2.07 4.36 8.97 14.17 23.14 1.23 1.44 2.36 1.36
Transport & Storage 5.39 2.80 2.38 5.18 7.83 10.57 18.40 1.52 1.96 3.41 2.41
Communication Services 5.70 1.84 1.37 3.21 8.02 8.91 16.92 1.32 1.56 2.97 1.97
Finance & Insurance 5.47 2.17 1.45 3.62 9.32 9.09 18.40 1.40 1.66 3.36 2.36
Property & Business Services 3.84 2.56 2.22 4.77 6.16 8.61 14.77 1.67 2.24 3.85 2.85
Govt. Admin. & Defence 9.69 3.63 2.72 6.35 12.60 16.04 28.64 1.37 1.66 2.96 1.96
Education 17.11 0.91 0.58 1.50 16.27 18.61 34.88 1.05 1.09 2.04 1.04
Health & Community Services 15.90 1.70 1.02 2.72 13.75 18.62 32.37 1.11 1.17 2.04 1.04
Cultural & Recreational Services 9.54 3.11 2.23 5.33 7.82 14.88 22.70 1.33 1.56 2.38 1.38
Personal & Other Services 14.85 1.22 0.94 2.15 12.62 17.00 29.63 1.08 1.14 1.99 0.99
Table 7 Employment Supply Side Effects (Forward Multipliers)

creative industries research and applications centreCiRAC
Mapping Queensland’s Creative Industries: Economic Fundamentals
Page 23
First Industrial Production Consumption
INDUSTRY Initial Round Support Induced Induced Simple Total Type 1A Type 1B Type 2A Type 2B
Effects Effects Effects Effects Effects Multipliers Multipliers
Writing, Publishing & Print Media Segment 7.08 5.88 1.71 7.59 10.39 14.67 25.07 1.83 2.07 3.54 2.54
Architecture, Visual Arts and Design Segment 9.06 2.67 2.79 5.46 7.48 14.52 22.00 1.30 1.60 2.43 1.43
Advertising, Graphic Design and Marketing Segment 7.50 6.31 3.14 9.45 11.93 16.95 28.88 1.84 2.26 3.85 2.85
Film, Television and Entertainment Software Segment 7.31 2.46 2.58 5.04 5.71 12.35 18.06 1.34 1.69 2.47 1.47
Performing Arts Segment 11.60 2.78 2.06 4.85 16.31 16.45 32.76 1.24 1.42 2.82 1.82
Music Composition and Production Segment 11.60 1.94 0.73 2.67 5.62 14.27 19.90 1.17 1.23 1.72 0.72
Agriculture, Forestry and Fishing 8.79 4.51 4.96 9.46 8.63 18.25 26.88 1.51 2.08 3.06 2.06
Mining 1.26 1.34 1.87 3.21 3.02 4.46 7.48 2.07 3.56 5.96 4.96
Manufacturing 4.05 3.29 2.42 5.71 7.77 9.76 17.53 1.81 2.41 4.33 3.33
Electricity, Gas & Water Supply 3.12 3.91 3.54 7.45 16.70 10.57 27.27 2.25 3.39 8.75 7.75
Construction 6.33 0.19 0.29 0.48 0.66 6.80 7.46 1.03 1.08 1.18 0.18
Wholesale Trade 6.71 3.60 2.41 6.01 9.89 12.72 22.62 1.54 1.89 3.37 2.37
Retail Trade 15.09 0.95 0.64 1.59 22.24 16.68 38.92 1.06 1.11 2.58 1.58
Accommodation, Cafes & Rest. 9.81 1.76 1.57 3.33 15.70 13.14 28.84 1.18 1.34 2.94 1.94
Transport & Storage 5.39 3.76 3.81 7.57 8.91 12.97 21.87 1.70 2.40 4.06 3.06
Communication Services 5.70 6.14 3.89 10.03 16.35 15.73 32.08 2.08 2.76 5.63 4.63
Finance & Insurance 5.47 3.88 3.85 7.73 18.25 13.20 31.45 1.71 2.41 5.75 4.75
Property & Business Services 3.84 4.00 3.42 7.42 17.16 11.25 28.41 2.04 2.93 7.41 6.41
Govt. Admin. & Defence 9.69 4.00 3.20 7.20 7.07 16.89 23.95 1.41 1.74 2.47 1.47
Education 17.11 0.72 0.57 1.29 13.70 18.40 32.11 1.04 1.08 1.88 0.88
Health & Community Services 15.90 0.91 0.51 1.42 19.45 17.32 36.77 1.06 1.09 2.31 1.31
Cultural & Recreational Services 9.54 1.26 0.44 1.70 21.43 11.25 32.68 1.13 1.18 3.42 2.42
Personal & Other Services 14.85 0.88 0.57 1.44 21.22 16.30 37.52 1.06 1.10 2.53 1.53

creative industries research and applications centreCiRAC
Creative Industries Cluster Mapping & Value Chain Analysis
Page. 24
Table 8 Value Added Demand Linkages (Backward Multiplier)
First Industrial Production Consumption
INDUSTRY Initial Round Support Induced Induced Simple Total Type 1A Type 1B Type 2A Type 2B
Effects Effects Effects Effects Effects Multipliers Multipliers
Writing, Publishing & Print Media Segment 0.55 0.15 0.12 0.27 0.60 0.82 1.42 1.28 1.50 2.60 1.60
Architecture, Visual Arts and Design Segment 0.53 0.14 0.14 0.29 0.66 0.81 1.47 1.27 1.54 2.79 1.79
Advertising, Graphic Design and Marketing Segment 0.62 0.14 0.09 0.22 0.75 0.84 1.59 1.22 1.36 2.57 1.57
Film, Television and Entertainment Software Segment 0.56 0.14 0.10 0.24 0.54 0.80 1.34 1.25 1.42 2.39 1.39
Performing Arts Segment 0.68 0.13 0.08 0.21 0.76 0.90 1.66 1.19 1.31 2.43 1.43
Music Composition and Production Segment 0.76 0.10 0.07 0.17 0.85 0.94 1.79 1.13 1.23 2.34 1.34
Agriculture, Forestry and Fishing 0.41 0.19 0.17 0.37 0.36 0.78 1.14 1.46 1.88 2.74 1.74
Mining 0.55 0.17 0.12 0.30 0.41 0.85 1.26 1.31 1.54 2.29 1.29
Manufacturing 0.27 0.20 0.18 0.39 0.42 0.65 1.08 1.76 2.45 4.03 3.03
Electricity, Gas & Water Supply 0.55 0.19 0.13 0.32 0.32 0.87 1.20 1.35 1.58 2.17 1.17
Construction 0.41 0.16 0.17 0.33 0.39 0.74 1.14 1.40 1.82 2.77 1.77
Wholesale Trade 0.36 0.24 0.20 0.44 0.58 0.80 1.38 1.66 2.22 3.83 2.83
Retail Trade 0.49 0.17 0.14 0.31 0.62 0.79 1.41 1.35 1.63 2.91 1.91
Accommodation, Cafes & Rest. 0.42 0.18 0.16 0.33 0.52 0.75 1.28 1.42 1.80 3.05 2.05
Transport & Storage 0.42 0.19 0.18 0.36 0.46 0.78 1.24 1.45 1.87 2.96 1.96
Communication Services 0.62 0.12 0.10 0.22 0.47 0.84 1.31 1.19 1.36 2.11 1.11
Finance & Insurance 0.54 0.19 0.12 0.30 0.54 0.84 1.39 1.35 1.56 2.57 1.57
Property & Business Services 0.44 0.22 0.18 0.40 0.36 0.84 1.20 1.50 1.90 2.71 1.71
Govt. Admin. & Defence 0.44 0.22 0.19 0.41 0.74 0.85 1.58 1.50 1.95 3.64 2.64
Education 0.83 0.06 0.04 0.11 0.95 0.94 1.89 1.08 1.13 2.27 1.27
Health & Community Services 0.70 0.11 0.08 0.19 0.80 0.89 1.69 1.16 1.28 2.43 1.43
Cultural & Recreational Services 0.41 0.21 0.17 0.37 0.46 0.78 1.24 1.51 1.92 3.04 2.04
Personal & Other Services 0.71 0.09 0.07 0.16 0.74 0.87 1.61 1.13 1.23 2.27 1.27

creative industries research and applications centreCiRAC
Creative Industries Cluster Mapping & Value Chain Analysis
Page. 25
Table 9 Value Added Supply Linkages (Forward Multiplier)
First Industrial Production Consumption
INDUSTRY Initial Round Support Induced Induced Simple Total Type 1A Type 1B Type 2A Type 2B
Effects Effects Effects Effects Effects Multipliers Multipliers
Writing, Publishing & Print Media Segment 0.55 0.27 0.11 0.37 0.61 0.92 1.53 1.49 1.69 2.80 1.80
Architecture, Visual Arts and Design Segment 0.53 0.21 0.18 0.39 0.44 0.92 1.35 1.39 1.74 2.57 1.57
Advertising, Graphic Design and Marketing Segment 0.62 0.31 0.20 0.51 0.70 1.13 1.83 1.50 1.83 2.96 1.96
Film, Television and Entertainment Software Segment 0.56 0.19 0.16 0.35 0.33 0.91 1.24 1.34 1.62 2.22 1.22
Performing Arts Segment 0.68 0.18 0.13 0.31 0.95 0.99 1.95 1.26 1.45 2.85 1.85
Music Composition and Production Segment 0.76 0.09 0.05 0.13 0.33 0.90 1.23 1.11 1.18 1.61 0.61
Agriculture, Forestry and Fishing 0.41 0.25 0.30 0.55 0.50 0.96 1.47 1.59 2.32 3.54 2.54
Mining 0.55 0.13 0.12 0.25 0.18 0.80 0.97 1.23 1.45 1.78 0.78
Manufacturing 0.27 0.20 0.16 0.36 0.45 0.63 1.08 1.76 2.35 4.04 3.04
Electricity, Gas & Water Supply 0.55 0.28 0.23 0.52 0.98 1.07 2.05 1.51 1.94 3.71 2.71
Construction 0.41 0.02 0.02 0.04 0.04 0.45 0.49 1.04 1.09 1.19 0.19
Wholesale Trade 0.36 0.22 0.16 0.38 0.58 0.74 1.32 1.62 2.06 3.66 2.66
Retail Trade 0.49 0.06 0.04 0.10 1.30 0.58 1.88 1.11 1.20 3.87 2.87
Accommodation, Cafes & Rest. 0.42 0.12 0.10 0.22 0.92 0.64 1.56 1.28 1.53 3.72 2.72
Transport & Storage 0.42 0.28 0.25 0.53 0.52 0.95 1.47 1.67 2.27 3.52 2.52
Communication Services 0.62 0.35 0.26 0.60 0.96 1.22 2.18 1.56 1.97 3.50 2.50
Finance & Insurance 0.54 0.30 0.26 0.56 1.07 1.10 2.17 1.55 2.04 4.02 3.02
Property & Business Services 0.44 0.27 0.23 0.50 1.00 0.94 1.94 1.61 2.12 4.39 3.39
Govt. Admin. & Defence 0.44 0.23 0.21 0.44 0.41 0.88 1.29 1.54 2.01 2.96 1.96
Education 0.83 0.05 0.04 0.09 0.80 0.92 1.72 1.06 1.11 2.07 1.07
Health & Community Services 0.70 0.09 0.04 0.12 1.14 0.82 1.96 1.12 1.18 2.81 1.81
Cultural & Recreational Services 0.41 0.06 0.03 0.09 1.25 0.50 1.75 1.15 1.22 4.30 3.30
Personal & Other Services 0.71 0.06 0.04 0.09 1.24 0.80 2.04 1.08 1.13 2.88 1.88
creative industries research and applications centreCiRAC
Mapping Queensland’s Creative Industries: Economic Fundamentals
Page. 26
2.4 Creative Industries Segments – Economic Impacts
2.4.1 Advertising, Graphic Design & Marketing
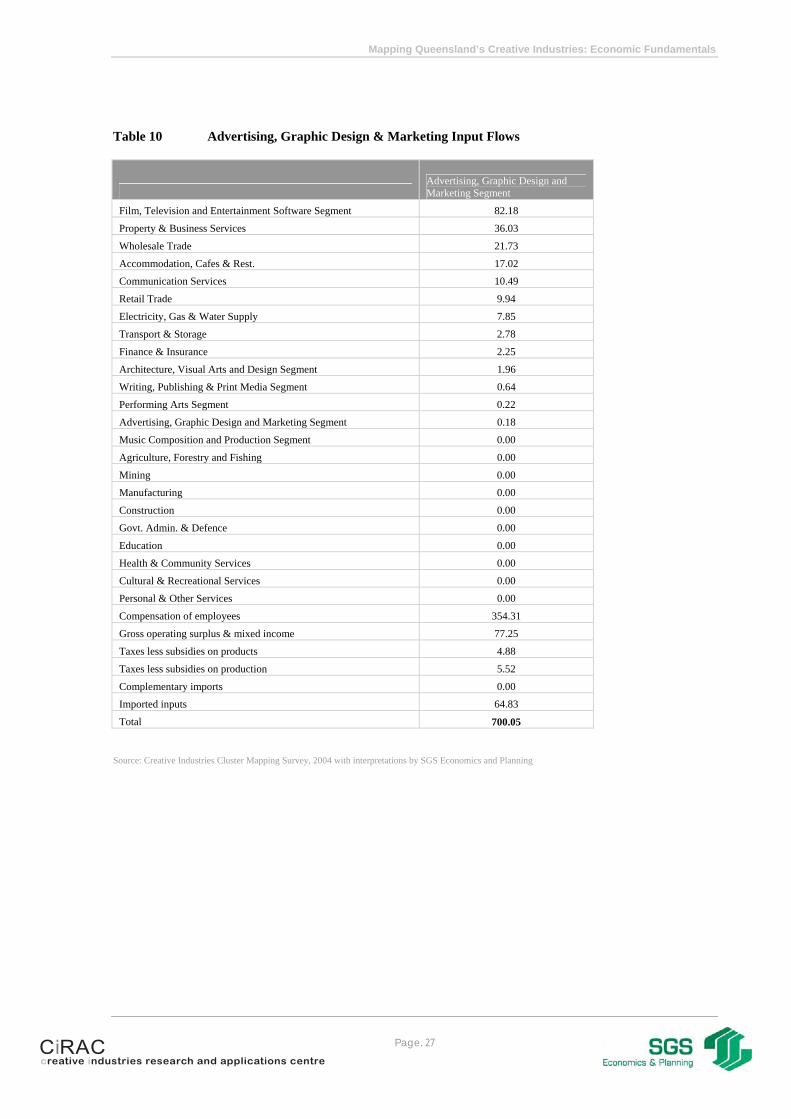
The numbers in the tables below are presented in terms of millions of dollars. Table 10 refers to the inputs and outputs of the Advertising, Graphic Design and Marketing segment. This segment has an annual expenditure of $700 million, with the value added component being some $432 million. The Advertising, Graphic Design and Marketing segment’s primary supplier industry is the film, television and entertainment software segment, providing approximately 12% of its inputs. Just over 9% of inputs are imported in the Advertising, Graphic Design & Marketing segment. This is slightly above the average import percentage across all the creative industries (of 8%). Generally speaking, employee compensation (wages and salaries paid to staff) forms a higher proportion of creative industries inputs (average 45%) than that of other industries (average of 29%). When compared to other creative industries, the Advertising, Graphic Design and Marketing segment’s proportion of employee compensation (51%) is relatively high, but still greater than the average across the other (non-creative) industries. It could be argued that this implies the creative industries offer higher paid, higher value employment compared to industry averages. In other words, the value of employment in the creative industries is higher than the State average for all industry sectors. Exports account for the largest proportion of the Advertising, Graphic Design & Marketing segment’s outputs (30% of outputs), and total approximately $210 million. The major local purchasers are the retail trade sector and the property and business services sector. Together these account for over 47% of total output of Queensland’s Advertising, Graphic Design and Marketing segment. According to the tailored Input–Output table for Queensland, when compared to the other creative industries, the Advertising, Graphic Design & Marketing segment and the Performing Arts segment’s outputs contribute relatively large proportions as intermediate flows to other industries than to the final demand segments, making them important as inputs to other industries. The charts in this and subsequent sections of the report (for each creative industries segment) display the proportions attributable to each industry. For each segment, the chart provides a summary of the creative industries segment and its relation to other industries. The size of the rectangle in the middle represents the size of the industry, with the bar at the top left indicating the relative size compared to other creative industries. The size of the circles beside each of the industries on the left and right indicate the size of flows either to or from that industry to the creative industries segment under consideration.
creative industries research and applications centreCiRAC
Mapping Queensland’s Creative Industries: Economic Fundamentals
Page. 27
Table 10 Advertising, Graphic Design & Marketing Input Flows
Advertising, Graphic Design and Marketing Segment
Film, Television and Entertainment Software Segment 82.18
Property & Business Services 36.03
Wholesale Trade 21.73
Accommodation, Cafes & Rest. 17.02
Communication Services 10.49
Retail Trade 9.94
Electricity, Gas & Water Supply 7.85
Transport & Storage 2.78
Finance & Insurance 2.25
Architecture, Visual Arts and Design Segment 1.96
Writing, Publishing & Print Media Segment 0.64
Performing Arts Segment 0.22
Advertising, Graphic Design and Marketing Segment 0.18
Music Composition and Production Segment 0.00
Agriculture, Forestry and Fishing 0.00
Mining 0.00
Manufacturing 0.00
Construction 0.00
Govt. Admin. & Defence 0.00
Education 0.00
Health & Community Services 0.00
Cultural & Recreational Services 0.00
Personal & Other Services 0.00
Compensation of employees 354.31
Gross operating surplus & mixed income 77.25
Taxes less subsidies on products 4.88
Taxes less subsidies on production 5.52
Complementary imports 0.00
Imported inputs 64.83
Total 700.05
Source: Creative Industries Cluster Mapping Survey, 2004 with interpretations by SGS Economics and Planning

creative industries research and applications centreCiRAC
Mapping Queensland’s Creative Industries: Economic Fundamentals
Page. 28
Table 11 Advertising, Graphic Design and Marketing Output Flows
Advertising, Graphic Design and
Marketing Segment
Retail Trade 170.49
Property & Business Services 160.22
Govt. Admin. & Defence 52.45
Accommodation, Cafes & Rest. 27.45
Cultural & Recreational Services 20.92
Finance & Insurance 11.18
Manufacturing 7.27
Electricity, Gas & Water Supply 4.81
Education 3.57
Communication Services 2.63
Transport & Storage 2.19
Construction 2.12
Performing Arts Segment 1.65
Wholesale Trade 1.43
Personal & Other Services 0.66
Writing, Publishing & Print Media Segment 0.49
Advertising, Graphic Design and Marketing Segment 0.18
Architecture, Visual Arts and Design Segment 0.12
Film, Television and Entertainment Software Segment 0.09
Health & Community Services 0.05
Music Composition and Production Segment 0.00
Agriculture, Forestry and Fishing 0.00
Mining 0.00
Household 1.46
Government 0.52
Private 15.54
Public Enterprise 0.00
General Government 0.00
Change in inventories 0.00
Exports 212.53
Total 700.05
Source: Creative Industries Cluster Mapping Survey, 2004 with interpretations by SGS Economics and Planning

creative industries research and applications centreCiRAC
Mapping Queensland’s Creative Industries: Economic Fundamentals
Page. 29
Figure 7 Sector Summary - Advertising, Graphic Design and Marketing Segment
Source: Creative Industries Cluster Mapping Survey, 2004 with interpretations by SGS Economics and Planning

creative industries research and applications centreCiRAC
Mapping Queensland’s Creative Industries: Economic Fundamentals
Page. 30
Table 12 shows the demand multipliers for the Advertising, Graphic Design & Marketing segment. The multipliers identify the effects on the economy of changes in outputs and linkages in the economy. The total demand multiplier suggests that an increase of output in the Advertising, Graphic Design & Marketing segment by $1 million requires a $2.03 million corresponding increase in required supply by the economy and thus a total of $3.03 million increase in the economy’s output (i.e. including the initial stimulus in the Advertising, Graphic Design & Marketing segment). The largest responding industries are the property and business services and retail trade sectors. Other important sectors to note are the manufacturing and the film, television & entertainment software segment. Table 12 Advertising, Graphic Design and Marketing Demand Multipliers
Advertising, Graphic Design and
Marketing Segment
Advertising, Graphic Design and Marketing Segment 1.01
Property & Business Services 0.50
Retail Trade 0.23
Manufacturing 0.21
Film, Television and Entertainment Software Segment 0.13
Accommodation, Cafes & Rest. 0.12
Wholesale Trade 0.11
Health & Community Services 0.11
Finance & Insurance 0.10
Transport & Storage 0.10
Communication Services 0.07
Education 0.06
Electricity, Gas & Water Supply 0.06
Personal & Other Services 0.05
Agriculture, Forestry and Fishing 0.05
Govt. Admin. & Defence 0.04
Cultural & Recreational Services 0.04
Mining 0.03
Construction 0.01
Writing, Publishing & Print Media Segment 0.01
Architecture, Visual Arts and Design Segment 0.01
Performing Arts Segment 0.00
Music Composition and Production Segment 0.00
Total 3.03
Source: Creative Industries Cluster Mapping Survey, 2004 with interpretations by SGS Economics and Planning
Table 13 shows the supply side multipliers or ‘forward’ effects of the Advertising, Graphic Design & Marketing segment throughout the Queensland economy.

creative industries research and applications centreCiRAC
Mapping Queensland’s Creative Industries: Economic Fundamentals
Page. 31
The outputs of the Advertising, Graphic Design & Marketing segment largely supply the property and business services and the retail trade sectors. The magnitudes of both the total multipliers are relatively large, indicating that the industry relies largely on local inputs and is also a large local supplier rather than exporter. Table 13 Advertising, Graphic Design and Marketing Supply Multipliers
Advertising, Graphic Design and
Marketing Segment
Advertising, Graphic Design and Marketing Segment 1.01
Property & Business Services 0.54
Retail Trade 0.42
Manufacturing 0.29
Govt. Admin. & Defence 0.18
Wholesale Trade 0.14
Construction 0.13
Transport & Storage 0.13
Accommodation, Cafes & Rest. 0.12
Health & Community Services 0.12
Education 0.10
Mining 0.10
Finance & Insurance 0.09
Cultural & Recreational Services 0.06
Agriculture, Forestry and Fishing 0.05
Personal & Other Services 0.04
Communication Services 0.04
Electricity, Gas & Water Supply 0.03
Writing, Publishing & Print Media Segment 0.01
Film, Television and Entertainment Software Segment 0.01
Architecture, Visual Arts and Design Segment 0.01
Performing Arts Segment 0.01
Music Composition and Production Segment 0.00
Total 3.61
Source: Creative Industries Cluster Mapping Survey, 2004 with interpretations by SGS Economics and Planning

creative industries research and applications centreCiRAC
Mapping Queensland’s Creative Industries: Economic Fundamentals
Page. 32
2.4.2 Architecture, Visual Arts & Design
The Architecture, Visual Arts & Design segment forms a significant component of the Queensland creative industries and, according to estimates prepared as part of this study, is currently worth just over $600 million. It has a value added component of approximately $319 million. By far the largest component of the Architecture, Visual Arts & Design segment’s inputs are derived from the wholesale trade sector. The flows to each of the next largest industries of accommodation, cafes & restaurants, property and business services, and transport and storage are only approximately one tenth the size of the flows to the wholesale trade sector. As shown in Table 15, the outputs of the segment are demanded predominantly by the property and business services sector. Exports account for only 13% of outputs, which is the lowest across the creative industries in Queensland. However, anecdotal information gathered by SGS Economics and Planning suggests that the segment’s export contribution may be understated. Interviews with selected businesses in the Architecture, Visual Arts & Design segment revealed that some firms provide their services to brokers located in Queensland but whose end client or customer is actually from interstate or overseas. Imports account for 9% of the Architecture, Visual Arts & Design segment’s inputs, which constitutes the fourth highest across the creative sectors, and is slightly above the average of 8% across all the creative industries segments. Therefore, the Architecture, Visual Arts & Design segment relies marginally less on the local economy for its inputs.

creative industries research and applications centreCiRAC
Mapping Queensland’s Creative Industries: Economic Fundamentals
Page. 33
Table 14 Architecture, Visual Arts & Design Input Flows
Architecture, Visual Arts and Design
Segment
Wholesale Trade 140.40
Accommodation, Cafes & Rest. 16.88
Property & Business Services 13.94
Transport & Storage 13.83
Architecture, Visual Arts and Design Segment 9.41
Communication Services 7.82
Film, Television and Entertainment Software Segment 5.44
Electricity, Gas & Water Supply 3.31
Retail Trade 2.51
Finance & Insurance 1.64
Performing Arts Segment 0.38
Advertising, Graphic Design and Marketing Segment 0.12
Writing, Publishing & Print Media Segment 0.00
Music Composition and Production Segment 0.00
Agriculture, Forestry and Fishing 0.00
Mining 0.00
Manufacturing 0.00
Construction 0.00
Govt. Admin. & Defence 0.00
Education 0.00
Health & Community Services 0.00
Cultural & Recreational Services 0.00
Personal & Other Services 0.00
Compensation of employees 232.78
Gross operating surplus & mixed income 85.91
Taxes less subsidies on products 6.88
Taxes less subsidies on production 7.99
Complementary imports 0.00
Imported inputs 55.61
Total 604.84
Source: Creative Industries Cluster Mapping Survey, 2004 with interpretations by SGS Economics and Planning

creative industries research and applications centreCiRAC
Mapping Queensland’s Creative Industries: Economic Fundamentals
Page. 34
Table 15 Architecture, Visual Arts & Design Output Flows
Architecture, Visual Arts and Design
Segment
Property & Business Services 170.57
Construction 28.99
Govt. Admin. & Defence 20.51
Retail Trade 17.93
Manufacturing 12.54
Architecture, Visual Arts and Design Segment 9.41
Wholesale Trade 6.08
Education 3.61
Finance & Insurance 2.52
Electricity, Gas & Water Supply 2.33
Advertising, Graphic Design and Marketing Segment 1.96
Personal & Other Services 1.16
Writing, Publishing & Print Media Segment 0.53
Health & Community Services 0.38
Transport & Storage 0.31
Performing Arts Segment 0.23
Film, Television and Entertainment Software Segment 0.23
Cultural & Recreational Services 0.20
Communication Services 0.09
Music Composition and Production Segment 0.00
Agriculture, Forestry and Fishing 0.00
Mining 0.00
Accommodation, Cafes & Rest. 0.00
Household 22.31
Government 23.65
Private 118.15
Public Enterprise 45.38
General Government 35.11
Change in inventories 0.00
Exports 80.67
Total 604.84
Source: Creative Industries Cluster Mapping Survey, 2004 with interpretations by SGS Economics and Planning

creative industries research and applications centreCiRAC
Mapping Queensland’s Creative Industries: Economic Fundamentals
Page. 35
Figure 8 Sector Summary - Architecture, Visual Arts & Design
Source: Creative Industries Cluster Mapping Survey, 2004 with interpretations by SGS Economics and Planning
Table 16 shows the strong linkages between the Architecture, Visual Arts & Design segment, the property and business services and the wholesale trade sectors.

creative industries research and applications centreCiRAC
Mapping Queensland’s Creative Industries: Economic Fundamentals
Page. 36
Table 16 Architecture, Visual Arts & Design Demand Multipliers
Architecture, Visual Arts and Design
Segment
Architecture, Visual Arts and Design Segment 1.02
Property & Business Services 0.47
Wholesale Trade 0.31
Manufacturing 0.21
Retail Trade 0.20
Transport & Storage 0.14
Accommodation, Cafes & Rest. 0.11
Health & Community Services 0.10
Finance & Insurance 0.10
Communication Services 0.06
Education 0.05
Electricity, Gas & Water Supply 0.05
Agriculture, Forestry and Fishing 0.05
Personal & Other Services 0.04
Govt. Admin. & Defence 0.04
Cultural & Recreational Services 0.03
Mining 0.03
Film, Television and Entertainment Software Segment 0.01
Construction 0.01
Writing, Publishing & Print Media Segment 0.01
Advertising, Graphic Design and Marketing Segment 0.01
Performing Arts Segment 0.00
Music Composition and Production Segment 0.00
Total 3.06
Source: Creative Industries Cluster Mapping Survey, 2004 with interpretations by SGS Economics and Planning
According to Table 16, under the current situation, demand for the supply of goods and services from the Architecture, Visual Arts & Design segment is channelled largely through the property and business services, wholesale trade, manufacturing, construction and retail trade sectors.

creative industries research and applications centreCiRAC
Mapping Queensland’s Creative Industries: Economic Fundamentals
Page. 37
Table 17 Architecture, Visual Arts & Design Supply Multipliers
Architecture, Visual Arts and Design
Segment
Architecture, Visual Arts and Design Segment 1.02
Property & Business Services 0.53
Manufacturing 0.21
Retail Trade 0.15
Construction 0.14
Wholesale Trade 0.11
Govt. Admin. & Defence 0.10
Transport & Storage 0.08
Health & Community Services 0.08
Education 0.07
Mining 0.07
Accommodation, Cafes & Rest. 0.06
Finance & Insurance 0.05
Agriculture, Forestry and Fishing 0.03
Personal & Other Services 0.03
Communication Services 0.02
Electricity, Gas & Water Supply 0.02
Cultural & Recreational Services 0.02
Advertising, Graphic Design and Marketing Segment 0.01
Writing, Publishing & Print Media Segment 0.01
Film, Television and Entertainment Software Segment 0.01
Performing Arts Segment 0.00
Music Composition and Production Segment 0.00
Total 2.81
Source: Creative Industries Cluster Mapping Survey, 2004 with interpretations by SGS Economics and Planning
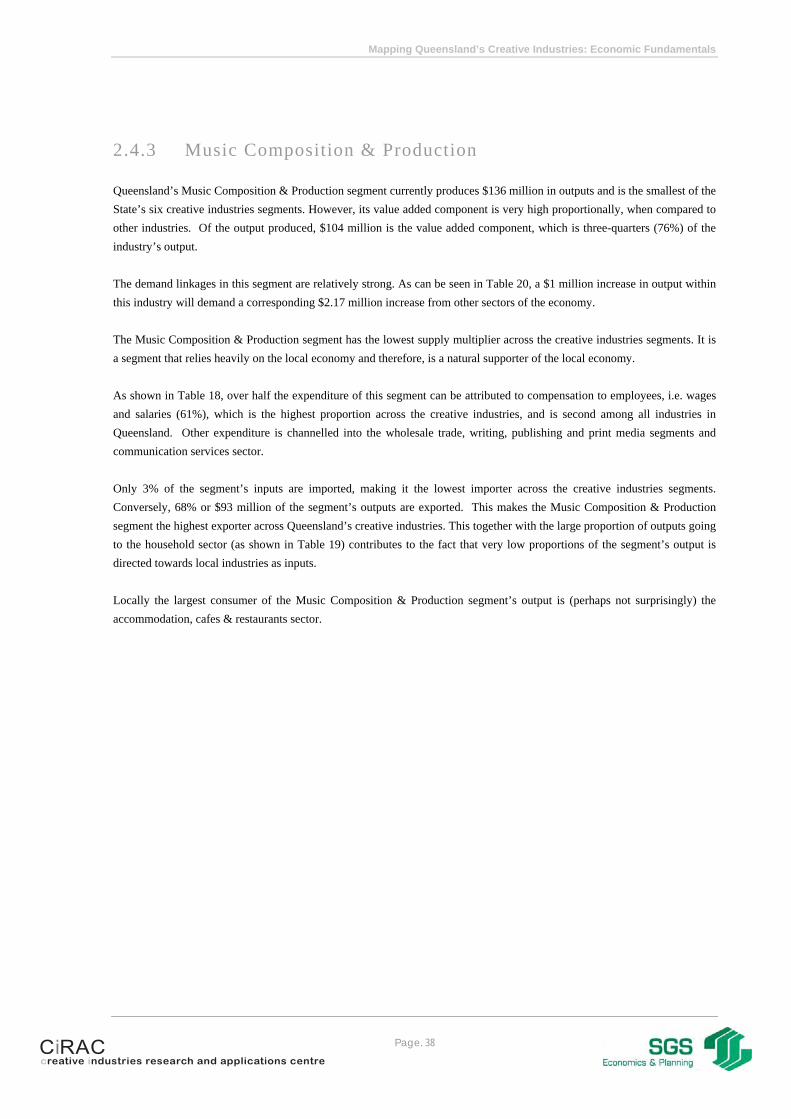
creative industries research and applications centreCiRAC
Mapping Queensland’s Creative Industries: Economic Fundamentals
Page. 38
2.4.3 Music Composition & Production
Queensland’s Music Composition & Production segment currently produces $136 million in outputs and is the smallest of the State’s six creative industries segments. However, its value added component is very high proportionally, when compared to other industries. Of the output produced, $104 million is the value added component, which is three-quarters (76%) of the industry’s output. The demand linkages in this segment are relatively strong. As can be seen in Table 20, a $1 million increase in output within this industry will demand a corresponding $2.17 million increase from other sectors of the economy. The Music Composition & Production segment has the lowest supply multiplier across the creative industries segments. It is a segment that relies heavily on the local economy and therefore, is a natural supporter of the local economy. As shown in Table 18, over half the expenditure of this segment can be attributed to compensation to employees, i.e. wages and salaries (61%), which is the highest proportion across the creative industries, and is second among all industries in Queensland. Other expenditure is channelled into the wholesale trade, writing, publishing and print media segments and communication services sector. Only 3% of the segment’s inputs are imported, making it the lowest importer across the creative industries segments. Conversely, 68% or $93 million of the segment’s outputs are exported. This makes the Music Composition & Production segment the highest exporter across Queensland’s creative industries. This together with the large proportion of outputs going to the household sector (as shown in Table 19) contributes to the fact that very low proportions of the segment’s output is directed towards local industries as inputs. Locally the largest consumer of the Music Composition & Production segment’s output is (perhaps not surprisingly) the accommodation, cafes & restaurants sector.
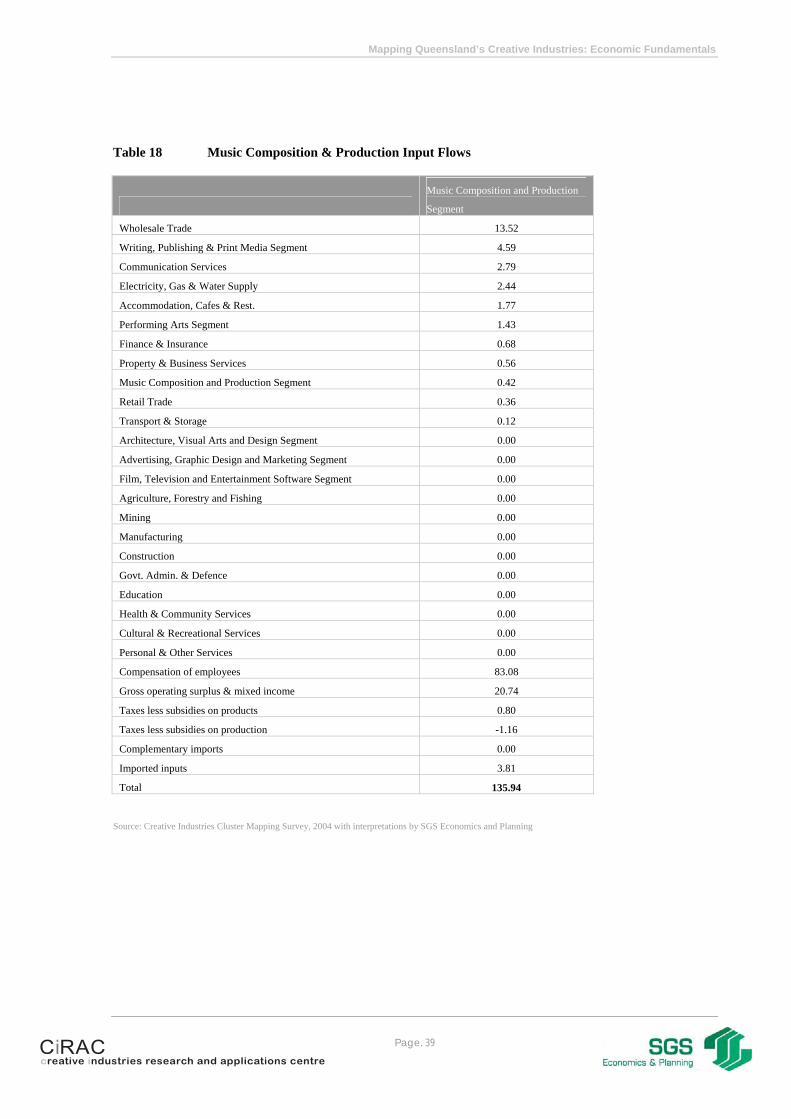
creative industries research and applications centreCiRAC
Mapping Queensland’s Creative Industries: Economic Fundamentals
Page. 39
Table 18 Music Composition & Production Input Flows
Music Composition and Production
Segment
Wholesale Trade 13.52
Writing, Publishing & Print Media Segment 4.59
Communication Services 2.79
Electricity, Gas & Water Supply 2.44
Accommodation, Cafes & Rest. 1.77
Performing Arts Segment 1.43
Finance & Insurance 0.68
Property & Business Services 0.56
Music Composition and Production Segment 0.42
Retail Trade 0.36
Transport & Storage 0.12
Architecture, Visual Arts and Design Segment 0.00
Advertising, Graphic Design and Marketing Segment 0.00
Film, Television and Entertainment Software Segment 0.00
Agriculture, Forestry and Fishing 0.00
Mining 0.00
Manufacturing 0.00
Construction 0.00
Govt. Admin. & Defence 0.00
Education 0.00
Health & Community Services 0.00
Cultural & Recreational Services 0.00
Personal & Other Services 0.00
Compensation of employees 83.08
Gross operating surplus & mixed income 20.74
Taxes less subsidies on products 0.80
Taxes less subsidies on production -1.16
Complementary imports 0.00
Imported inputs 3.81
Total 135.94
Source: Creative Industries Cluster Mapping Survey, 2004 with interpretations by SGS Economics and Planning

creative industries research and applications centreCiRAC
Mapping Queensland’s Creative Industries: Economic Fundamentals
Page. 40
Table 19 Music Composition & Production Output flows
Music Composition and Production
Segment
Accommodation, Cafes & Rest. 25.34
Writing, Publishing & Print Media Segment 1.04
Property & Business Services 0.64
Music Composition and Production Segment 0.42
Film, Television and Entertainment Software Segment 0.15
Architecture, Visual Arts and Design Segment 0.00
Advertising, Graphic Design and Marketing Segment 0.00
Performing Arts Segment 0.00
Agriculture, Forestry and Fishing 0.00
Mining 0.00
Manufacturing 0.00
Electricity, Gas & Water Supply 0.00
Construction 0.00
Wholesale Trade 0.00
Retail Trade 0.00
Transport & Storage 0.00
Communication Services 0.00
Finance & Insurance 0.00
Govt. Admin. & Defence 0.00
Education 0.00
Health & Community Services 0.00
Cultural & Recreational Services 0.00
Personal & Other Services 0.00
Household 12.74
Government 0.00
Private 2.90
Public Enterprise 0.03
General Government 0.03
Change in inventories 0.00
Exports 92.65
Total 135.94
Source: Creative Industries Cluster Mapping Survey, 2004 with interpretations by SGS Economics and Planning

creative industries research and applications centreCiRAC
Mapping Queensland’s Creative Industries: Economic Fundamentals
Page. 41
Figure 9 Sector Summary - Music Composition & Production
Source: Creative Industries Cluster Mapping Survey, 2004 with interpretations by SGS Economics and Planning
Table 20 identifies the key contributors to the relatively strong required response of the local economy to increasing outputs in the Music Composition & Production segment as being property and business services, retail trade and manufacturing sectors. The effects of an increase in demand for the outputs of the Music Composition & Production segment will eventually flow through to these sectors. The low forward multipliers indicate that demand for the supply generated by this segment will largely come from outside the local economy.

creative industries research and applications centreCiRAC
Mapping Queensland’s Creative Industries: Economic Fundamentals
Page. 42
Table 20 Music Composition & Production Demand Multipliers
Music Composition and Production
Segment
Music Composition and Production Segment 1.00
Property & Business Services 0.50
Retail Trade 0.25
Manufacturing 0.23
Wholesale Trade 0.19
Health & Community Services 0.13
Finance & Insurance 0.12
Accommodation, Cafes & Rest. 0.12
Transport & Storage 0.11
Communication Services 0.07
Electricity, Gas & Water Supply 0.07
Education 0.07
Personal & Other Services 0.06
Agriculture, Forestry and Fishing 0.05
Govt. Admin. & Defence 0.04
Cultural & Recreational Services 0.04
Writing, Publishing & Print Media Segment 0.04
Mining 0.04
Performing Arts Segment 0.01
Construction 0.01
Advertising, Graphic Design and Marketing Segment 0.01
Film, Television and Entertainment Software Segment 0.00
Architecture, Visual Arts and Design Segment 0.00
Total 3.17
Source: Creative Industries Cluster Mapping Survey, 2004 with interpretations by SGS Economics and Planning

creative industries research and applications centreCiRAC
Mapping Queensland’s Creative Industries: Economic Fundamentals
Page. 43
Table 21 Music Composition & Production Supply Multipliers
Music Composition and Production
Segment
Music Composition and Production Segment 1.00
Accommodation, Cafes & Rest. 0.22
Manufacturing 0.12
Property & Business Services 0.12
Retail Trade 0.07
Wholesale Trade 0.05
Health & Community Services 0.05
Construction 0.05
Transport & Storage 0.05
Education 0.04
Mining 0.04
Govt. Admin. & Defence 0.04
Finance & Insurance 0.03
Agriculture, Forestry and Fishing 0.02
Personal & Other Services 0.02
Communication Services 0.01
Writing, Publishing & Print Media Segment 0.01
Cultural & Recreational Services 0.01
Electricity, Gas & Water Supply 0.01
Film, Television and Entertainment Software Segment 0.00
Advertising, Graphic Design and Marketing Segment 0.00
Architecture, Visual Arts and Design Segment 0.00
Performing Arts Segment 0.00
Total 2.00
Source: Creative Industries Cluster Mapping Survey, 2004 with interpretations by SGS Economics and Planning

creative industries research and applications centreCiRAC
Mapping Queensland’s Creative Industries: Economic Fundamentals
Page. 44
2.4.4 Writing, Publishing & Print Media
Queensland’s Writing, Publishing & Print Media segment’s total output is $878 million, of which $479 million (over half the value of total industry output) is value added. The Writing, Publishing & Print Media segment depends mostly on property and business services, transport and storage, the wholesale trade sector and imports for its inputs. Together, these sectors account for 26% of the Writing, Publishing & Print Media segment’s total expenditure. The major local purchaser of the Writing, Publishing & Print Media segment’s outputs is, not surprisingly, the retail trade sector. Retailing consumes significantly higher amounts of the Writing, Publishing & Print Media segment’s outputs than any other sector. Other significant purchasers of the Writing, Publishing & Print Media segment’s outputs include the education sector, households (i.e. end consumers), the property & business services sector and the accommodation, cafes & restaurants sector.

creative industries research and applications centreCiRAC
Mapping Queensland’s Creative Industries: Economic Fundamentals
Page. 45
Table 22 Writing, Publishing & Print Media Input flows
Writing, Publishing & Print Media
Segment
Property & Business Services 90.61
Transport & Storage 87.10
Wholesale Trade 50.64
Accommodation, Cafes & Rest. 19.55
Communication Services 14.87
Education 8.71
Finance & Insurance 7.99
Writing, Publishing & Print Media Segment 7.48
Electricity, Gas & Water Supply 3.11
Retail Trade 2.78
Music Composition and Production Segment 1.04
Architecture, Visual Arts and Design Segment 0.53
Advertising, Graphic Design and Marketing Segment 0.49
Performing Arts Segment 0.19
Film, Television and Entertainment Software Segment 0.13
Agriculture, Forestry and Fishing 0.00
Mining 0.00
Manufacturing 0.00
Construction 0.00
Govt. Admin. & Defence 0.00
Health & Community Services 0.00
Cultural & Recreational Services 0.00
Personal & Other Services 0.00
Compensation of employees 320.59
Gross operating surplus & mixed income 158.28
Taxes less subsidies on products 7.59
Taxes less subsidies on production 15.45
Complementary imports 0.00
Imported inputs 81.14
Total 878.27
Source: Creative Industries Cluster Mapping Survey, 2004 with interpretations by SGS Economics and Planning

creative industries research and applications centreCiRAC
Mapping Queensland’s Creative Industries: Economic Fundamentals
Page. 46
Table 23 Writing, Publishing & Print Media Output flows
Writing, Publishing & Print Media
Segment
Retail Trade 144.98
Education 85.68
Property & Business Services 64.41
Accommodation, Cafes & Rest. 58.00
Manufacturing 23.56
Govt. Admin. & Defence 23.54
Wholesale Trade 10.63
Cultural & Recreational Services 9.02
Writing, Publishing & Print Media Segment 7.48
Music Composition and Production Segment 4.59
Construction 4.46
Film, Television and Entertainment Software Segment 1.80
Performing Arts Segment 1.62
Personal & Other Services 1.56
Health & Community Services 1.02
Finance & Insurance 0.87
Advertising, Graphic Design and Marketing Segment 0.64
Mining 0.42
Architecture, Visual Arts and Design Segment 0.00
Agriculture, Forestry and Fishing 0.00
Electricity, Gas & Water Supply 0.00
Transport & Storage 0.00
Communication Services 0.00
Household 68.77
Government 2.66
Private 37.85
Public Enterprise 26.77
General Government 13.05
Change in inventories 5.87
Exports 279.04
Total 878.27
Source: Creative Industries Cluster Mapping Survey, 2004 with interpretations by SGS Economics and Planning

creative industries research and applications centreCiRAC
Mapping Queensland’s Creative Industries: Economic Fundamentals
Page. 47
Figure 10 Sector Summary - Writing, Publishing & Print Media
Source: Creative Industries Cluster Mapping Survey, 2004 with interpretations by SGS Economics and Planning
Table 24 shows that the Writing, Publishing & Print Media segment has the second lowest demand multiplier across the creative industries in Queensland, which means that this segment relies more on imported inputs than other creative industries segment. The highest contributors to the segment’s demand multipliers are the property & business services sector followed by the transport & storage and the manufacturing industries. According to Table 25, demand for the Writing, Publishing & Print Media segment’s supply emanates largely from the retail trade, property & business services, manufacturing and education sectors.

creative industries research and applications centreCiRAC
Mapping Queensland’s Creative Industries: Economic Fundamentals
Page. 48
Table 24 Writing, Publishing & Print Media Demand Multipliers
Writing, Publishing & Print Media
Segment
Writing, Publishing & Print Media Segment 1.01
Property & Business Services 0.50
Transport & Storage 0.20
Manufacturing 0.20
Retail Trade 0.18
Wholesale Trade 0.13
Accommodation, Cafes & Rest. 0.10
Finance & Insurance 0.10
Health & Community Services 0.09
Communication Services 0.06
Education 0.06
Agriculture, Forestry and Fishing 0.04
Electricity, Gas & Water Supply 0.04
Personal & Other Services 0.04
Govt. Admin. & Defence 0.04
Cultural & Recreational Services 0.03
Mining 0.03
Construction 0.01
Advertising, Graphic Design and Marketing Segment 0.01
Architecture, Visual Arts and Design Segment 0.00
Film, Television and Entertainment Software Segment 0.00
Performing Arts Segment 0.00
Music Composition and Production Segment 0.00
Total 2.88
Source: Creative Industries Cluster Mapping Survey, 2004 with interpretations by SGS Economics and Planning
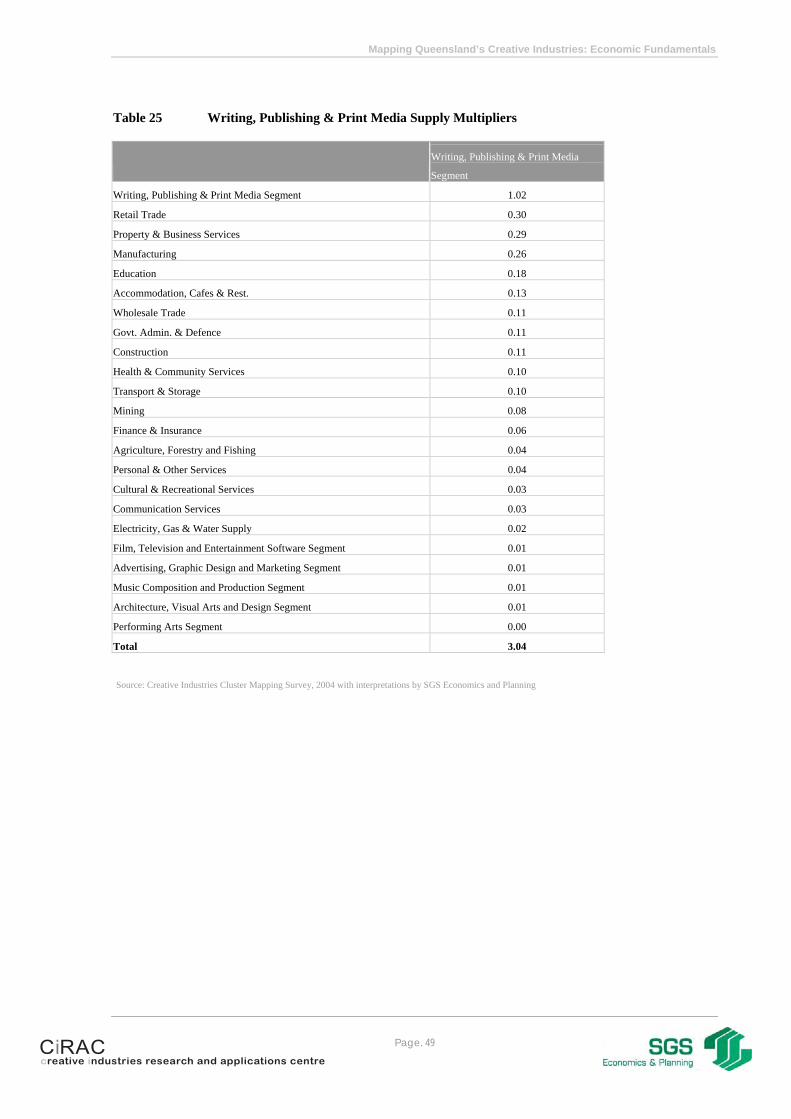
creative industries research and applications centreCiRAC
Mapping Queensland’s Creative Industries: Economic Fundamentals
Page. 49
Table 25 Writing, Publishing & Print Media Supply Multipliers
Writing, Publishing & Print Media
Segment
Writing, Publishing & Print Media Segment 1.02
Retail Trade 0.30
Property & Business Services 0.29
Manufacturing 0.26
Education 0.18
Accommodation, Cafes & Rest. 0.13
Wholesale Trade 0.11
Govt. Admin. & Defence 0.11
Construction 0.11
Health & Community Services 0.10
Transport & Storage 0.10
Mining 0.08
Finance & Insurance 0.06
Agriculture, Forestry and Fishing 0.04
Personal & Other Services 0.04
Cultural & Recreational Services 0.03
Communication Services 0.03
Electricity, Gas & Water Supply 0.02
Film, Television and Entertainment Software Segment 0.01
Advertising, Graphic Design and Marketing Segment 0.01
Music Composition and Production Segment 0.01
Architecture, Visual Arts and Design Segment 0.01
Performing Arts Segment 0.00
Total 3.04
Source: Creative Industries Cluster Mapping Survey, 2004 with interpretations by SGS Economics and Planning

creative industries research and applications centreCiRAC
Mapping Queensland’s Creative Industries: Economic Fundamentals
Page. 50
2.4.5 Film, Television & Entertainment Software
The Film, Television & Entertainment Software segment is the largest of the creative industries in Queensland with output worth $849 million. Of all the creative industries this segment also has the largest level of value added in absolute terms of $476 million. In terms of industry sectors, Table 26 shows that that the expenditure of the Film, Television & Entertainment Software segment flows primarily to the property & business services sector, which accounts for 11% of the segment’s total expenditure. The Film, Television & Entertainment Software segment has the largest proportion of imports across the creative industries at 12%. According to export figures shown in Table 27 and compared across the respective values for other creative sectors, the Film, Television & Entertainment Software segment is the second largest exporter across the creative industries. Approximately 51% of the segment’s supply is exported, worth approximately $431 million. The Film, Television & Entertainment Software segment’s major local customers are the industry sectors of property & business services, advertising and accommodation, cafes & restaurants. In proportional terms, Queensland’s Film, Television & Entertainment Software segment has the lowest expenditure on employee compensation (i.e. wages and salaries) compared to other creative industries.

creative industries research and applications centreCiRAC
Mapping Queensland’s Creative Industries: Economic Fundamentals
Page. 51
Table 26 Film, Television & Entertainment Software Input flows
Film, Television and Entertainment Software
Segment
Property & Business Services 93.71
Communication Services 43.42
Film, Television and Entertainment Software Segment 27.65
Wholesale Trade 24.41
Transport & Storage 20.42
Accommodation, Cafes & Rest. 15.24
Electricity, Gas & Water Supply 10.85
Finance & Insurance 6.23
Writing, Publishing & Print Media Segment 1.80
Performing Arts Segment 1.06
Architecture, Visual Arts and Design Segment 0.23
Music Composition and Production Segment 0.15
Advertising, Graphic Design and Marketing Segment 0.09
Retail Trade 0.04
Agriculture, Forestry and Fishing 0.00
Mining 0.00
Manufacturing 0.00
Construction 0.00
Govt. Admin. & Defence 0.00
Education 0.00
Health & Community Services 0.00
Cultural & Recreational Services 0.00
Personal & Other Services 0.00
Compensation of employees 289.10
Gross operating surplus & mixed income 186.71
Taxes less subsidies on products 10.80
Taxes less subsidies on production 11.71
Complementary imports 0.00
Imported inputs 105.02
Total 848.64
Source: Creative Industries Cluster Mapping Survey, 2004 with interpretations by SGS Economics and Planning

creative industries research and applications centreCiRAC
Mapping Queensland’s Creative Industries: Economic Fundamentals
Page. 52
Table 27 Film, Television & Entertainment Software Output flows
Film, Television and Entertainment Software
Segment
Property & Business Services 124.60
Advertising, Graphic Design and Marketing Segment 82.18
Accommodation, Cafes & Rest. 46.97
Film, Television and Entertainment Software Segment 27.65
Cultural & Recreational Services 12.97
Govt. Admin. & Defence 7.58
Communication Services 5.75
Architecture, Visual Arts and Design Segment 5.44
Finance & Insurance 1.69
Mining 0.84
Electricity, Gas & Water Supply 0.84
Retail Trade 0.84
Performing Arts Segment 0.83
Manufacturing 0.33
Education 0.33
Health & Community Services 0.33
Writing, Publishing & Print Media Segment 0.13
Music Composition and Production Segment 0.00
Agriculture, Forestry and Fishing 0.00
Construction 0.00
Wholesale Trade 0.00
Transport & Storage 0.00
Personal & Other Services 0.00
Household 10.02
Government 8.43
Private 33.46
Public Enterprise 0.13
General Government 46.42
Change in inventories 0.00
Exports 430.89
Total 848.64
Source: Creative Industries Cluster Mapping Survey, 2004 with interpretations by SGS Economics and Planning
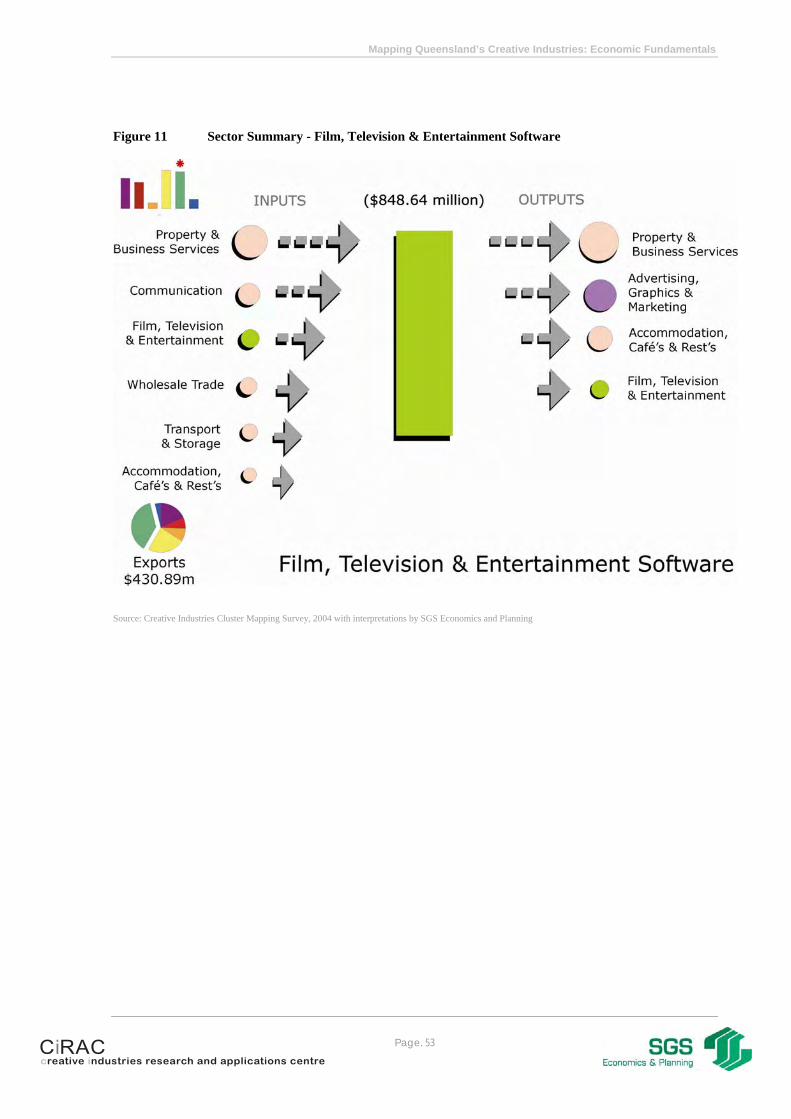
creative industries research and applications centreCiRAC
Mapping Queensland’s Creative Industries: Economic Fundamentals
Page. 53
Figure 11 Sector Summary - Film, Television & Entertainment Software
Source: Creative Industries Cluster Mapping Survey, 2004 with interpretations by SGS Economics and Planning

creative industries research and applications centreCiRAC
Mapping Queensland’s Creative Industries: Economic Fundamentals
Page. 54
The Film, Television & Entertainment Software segment has relatively low demand and supply side multipliers. This supports the results from the output flows table and can be interpreted to signify the export based nature of the segment’s output while also utilising a relatively high level of imported inputs. Changes in the segment’s outputs will impact the most on the property & business services, manufacturing and retail trade sectors. In other words, the Film, Television & Entertainment Software segment is predominantly supplied by these industries. Local demand is fuelled largely through the property & business services, manufacturing and retail trade sectors.
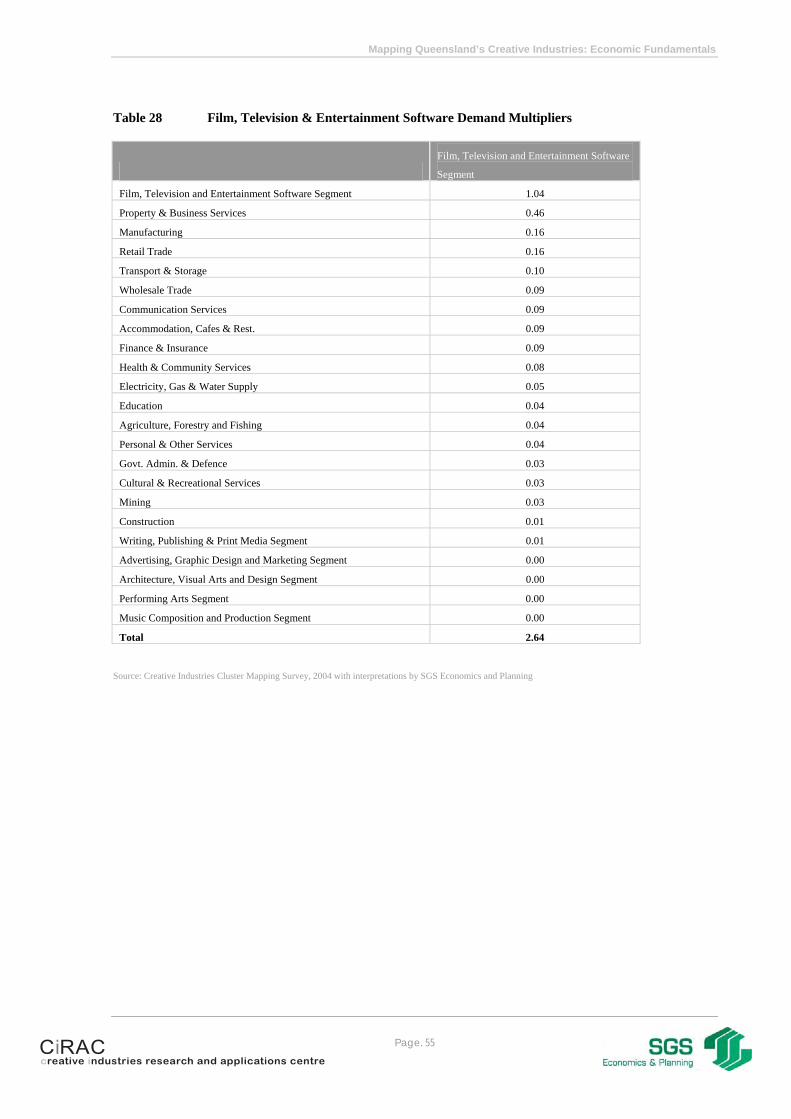
creative industries research and applications centreCiRAC
Mapping Queensland’s Creative Industries: Economic Fundamentals
Page. 55
Table 28 Film, Television & Entertainment Software Demand Multipliers
Film, Television and Entertainment Software
Segment
Film, Television and Entertainment Software Segment 1.04
Property & Business Services 0.46
Manufacturing 0.16
Retail Trade 0.16
Transport & Storage 0.10
Wholesale Trade 0.09
Communication Services 0.09
Accommodation, Cafes & Rest. 0.09
Finance & Insurance 0.09
Health & Community Services 0.08
Electricity, Gas & Water Supply 0.05
Education 0.04
Agriculture, Forestry and Fishing 0.04
Personal & Other Services 0.04
Govt. Admin. & Defence 0.03
Cultural & Recreational Services 0.03
Mining 0.03
Construction 0.01
Writing, Publishing & Print Media Segment 0.01
Advertising, Graphic Design and Marketing Segment 0.00
Architecture, Visual Arts and Design Segment 0.00
Performing Arts Segment 0.00
Music Composition and Production Segment 0.00
Total 2.64
Source: Creative Industries Cluster Mapping Survey, 2004 with interpretations by SGS Economics and Planning

creative industries research and applications centreCiRAC
Mapping Queensland’s Creative Industries: Economic Fundamentals
Page. 56
Table 29 Film, Television & Entertainment Software Supply Multipliers
Film, Television and Entertainment Software
Segment
Film, Television and Entertainment Software Segment 1.04
Property & Business Services 0.35
Manufacturing 0.14
Retail Trade 0.11
Advertising, Graphic Design and Marketing Segment 0.10
Accommodation, Cafes & Rest. 0.10
Wholesale Trade 0.07
Govt. Admin. & Defence 0.07
Construction 0.06
Transport & Storage 0.06
Health & Community Services 0.06
Mining 0.05
Education 0.05
Finance & Insurance 0.04
Cultural & Recreational Services 0.03
Agriculture, Forestry and Fishing 0.03
Communication Services 0.02
Personal & Other Services 0.02
Electricity, Gas & Water Supply 0.01
Architecture, Visual Arts and Design Segment 0.01
Writing, Publishing & Print Media Segment 0.00
Performing Arts Segment 0.00
Music Composition and Production Segment 0.00
Total 2.44
Source: Creative Industries Cluster Mapping Survey, 2004 with interpretations by SGS Economics and Planning

creative industries research and applications centreCiRAC
Mapping Queensland’s Creative Industries: Economic Fundamentals
Page. 57
2.4.6 Performing Arts
Queensland’s Performing Arts segment is worth $217 million. The expenditure of Queensland’s Performing Arts segment flows largely to the accommodation, cafes & restaurants, wholesale trade, performing arts and property & business services sectors. The Performing Arts segment has a relatively large proportion of compensation to employees (52% of total expenditure), and highlights the fact it relies largely on human capital. As shown in Table 31, $45 million of the segment’s $217 million in output (21%) is exported. The Performing Arts’ $148 million value added is a relatively large proportion of output (69%) when compared with the other creative industries. Locally, the Performing Arts segment’s outputs are predominantly purchased by households as final demand. The Performing Arts segment has a relatively large proportion of its outputs flowing to final demand, but in terms of supplying local sectors the property & business services sector is the largest purchaser of the Performing Arts segment’s goods and services.

creative industries research and applications centreCiRAC
Mapping Queensland’s Creative Industries: Economic Fundamentals
Page. 58
Table 30 Performing Arts Input Flows
Performing Arts Segment
Accommodation, Cafes & Rest. 11.52
Wholesale Trade 8.31
Performing Arts Segment 7.96
Property & Business Services 6.77
Transport & Storage 4.59
Finance & Insurance 4.30
Electricity, Gas & Water Supply 3.50
Communication Services 2.87
Advertising, Graphic Design and Marketing Segment 1.65
Writing, Publishing & Print Media Segment 1.62
Retail Trade 1.56
Film, Television and Entertainment Software Segment 0.83
Construction 0.48
Architecture, Visual Arts and Design Segment 0.23
Manufacturing 0.16
Music Composition and Production Segment 0.00
Agriculture, Forestry and Fishing 0.00
Mining 0.00
Govt. Admin. & Defence 0.00
Education 0.00
Health & Community Services 0.00
Cultural & Recreational Services 0.00
Personal & Other Services 0.00
Compensation of employees 112.63
Gross operating surplus & mixed income 35.64
Taxes less subsidies on products 1.37
Taxes less subsidies on production -2.00
Complementary imports 0.00
Imported inputs 12.71
Total 216.71
Source: Creative Industries Cluster Mapping Survey, 2004 with interpretations by SGS Economics and Planning

creative industries research and applications centreCiRAC
Mapping Queensland’s Creative Industries: Economic Fundamentals
Page. 59
Table 31 Performing Arts Output Flows
Performing Arts Segment
Property & Business Services 33.52
Govt. Admin. & Defence 15.45
Performing Arts Segment 7.96
Cultural & Recreational Services 6.68
Education 5.15
Accommodation, Cafes & Rest. 4.14
Music Composition and Production Segment 1.43
Film, Television and Entertainment Software Segment 1.06
Retail Trade 0.44
Architecture, Visual Arts and Design Segment 0.38
Advertising, Graphic Design and Marketing Segment 0.22
Writing, Publishing & Print Media Segment 0.19
Health & Community Services 0.17
Mining 0.02
Manufacturing 0.02
Electricity, Gas & Water Supply 0.02
Transport & Storage 0.02
Communication Services 0.02
Finance & Insurance 0.02
Agriculture, Forestry and Fishing 0.00
Construction 0.00
Wholesale Trade 0.00
Personal & Other Services 0.00
Household 89.69
Government 0.00
Private 4.58
Public Enterprise 0.05
General Government 0.05
Change in inventories 0.00
Exports 45.47
Total 216.71
Source: Creative Industries Cluster Mapping Survey, 2004 with interpretations by SGS Economics and Planning

creative industries research and applications centreCiRAC
Mapping Queensland’s Creative Industries: Economic Fundamentals
Page. 60
Figure 12 Sector Summary - Performing Arts Segment
Source: Creative Industries Cluster Mapping Survey, 2004 with interpretations by SGS Economics and Planning
The Performing Arts segment has an average demand multiplier and high supply multiplier. This, supported by the low proportion of imports (6%) and low proportion of exports (21%) reveals that Queensland’s Performing Arts segment is a local orientated industry in terms of its inputs and outputs. Locally, the Performing Arts demands outputs primarily from the property & business services, retail trade and manufacturing sectors. Local industries through which demand for the segment’s outputs flow the strongest are property & business services, manufacturing, retail trade and government administration & defence.

creative industries research and applications centreCiRAC
Mapping Queensland’s Creative Industries: Economic Fundamentals
Page. 61
Table 32 Performing Arts Demand Multipliers
Performing Arts Segment
Performing Arts Segment 1.04
Property & Business Services 0.48
Retail Trade 0.23
Manufacturing 0.22
Accommodation, Cafes & Rest. 0.15
Finance & Insurance 0.13
Wholesale Trade 0.12
Transport & Storage 0.12
Health & Community Services 0.12
Electricity, Gas & Water Supply 0.06
Communication Services 0.06
Education 0.06
Agriculture, Forestry and Fishing 0.05
Personal & Other Services 0.05
Govt. Admin. & Defence 0.04
Cultural & Recreational Services 0.04
Mining 0.04
Writing, Publishing & Print Media Segment 0.01
Advertising, Graphic Design and Marketing Segment 0.01
Construction 0.01
Film, Television and Entertainment Software Segment 0.01
Architecture, Visual Arts and Design Segment 0.00
Music Composition and Production Segment 0.00
Total 3.06
Source: Creative Industries Cluster Mapping Survey, 2004 with interpretations by SGS Economics and Planning

creative industries research and applications centreCiRAC
Mapping Queensland’s Creative Industries: Economic Fundamentals
Page. 62
Table 33 Performing Arts Supply Multipliers
Performing Arts Segment
Performing Arts Segment 1.04
Property & Business Services 0.49
Manufacturing 0.34
Retail Trade 0.21
Govt. Admin. & Defence 0.21
Education 0.15
Wholesale Trade 0.15
Health & Community Services 0.15
Construction 0.14
Transport & Storage 0.14
Mining 0.12
Accommodation, Cafes & Rest. 0.12
Finance & Insurance 0.09
Agriculture, Forestry and Fishing 0.06
Cultural & Recreational Services 0.06
Personal & Other Services 0.06
Communication Services 0.04
Electricity, Gas & Water Supply 0.03
Film, Television and Entertainment Software Segment 0.01
Advertising, Graphic Design and Marketing Segment 0.01
Writing, Publishing & Print Media Segment 0.01
Architecture, Visual Arts and Design Segment 0.01
Music Composition and Production Segment 0.01
Total 3.67
Source: Creative Industries Cluster Mapping Survey, 2004 with interpretations by SGS Economics and Planning

creative industries research and applications centreCiRAC
Mapping Queensland’s Creative Industries: Economic Fundamentals
Page. 63
3 Summary and Conclusions
Using the intelligence gathered through the Queensland Creative Industries Cluster mapping & Value Chain Analysis, the following points highlight key characteristics concerning the size, structure and dynamics of Queensland’s creative industries.
Size , Value and Contr ibut ion to the Queensland Economy
• Collectively, Queensland’s creative industries generate $3.4 billion in output, which is approximately 2% of the value of output across all industries in Queensland.
• In order of magnitude, creative industries output comprises:
o $878.3 million from the Writing, Publishing & Print Media segment; o $848.6 million from the Film, Television & Entertainment Software segment; o $700.1 million from the Advertising, Graphic Design & Marketing segment; o $604.8 million from the Architecture, Visual Arts & Design segment; o $216.2 million from the Performing Arts segment; and o $135.9 million from the Music Composition & Production segment.
• Value added is the equivalent of net output and refers to the value of goods and services produced in the Queensland
economy less imports. The total value added of all the creative industries in Queensland is $1.96 billion, which is equivalent to 58% of creative industries output. This is proportionally higher than the value added share of output of the non-creative industry sectors which have a value added of 45% of total output.
• The Writing, Publishing & Print Media and Film, Television & Entertainment Software segments both contribute equally
the largest share of value added to Queensland’s creative industries ($480 million or 24% of total creative industries value added). This is followed closely by Advertising, Graphic Design & Marketing ($430 million or 22%).
• The Performing Arts and Music Composition & Production segments are the smallest contributors to creative industries
value added in Queensland ($150 million and $100 million respectively). • Despite being the smallest segment, Music Composition & Production generates the highest proportional value added
(76% of total output) followed by the Performing Arts segment (68%).
creative industries research and applications centreCiRAC
Mapping Queensland’s Creative Industries: Economic Fundamentals
Page. 64
Employment – ‘Creat ives ’ and Non-creat ives’
• Queensland’s creative industries employ 67,000 people, which account for approximately 5% of total employment across all industries in Queensland. This includes ‘creatives’, that is, those workers whose intellectual property is the primary source of their industry’s output, and support staff, that is administrative and clerical staff or ‘non-creatives’. Of the 67,000 people employed in Queensland’s creative industries (as defined by the six segments), about 46% or just under 31,000 workers are classified as ‘creatives’. The remaining 54% are classified as non-creative’ workers. The split between creatives and non-creatives varies across the six creative industries segments. These figures do not include ‘creatives’ employed in other non-creative industry sectors.
• Of total creative industries employment, the Architecture, Visual Arts & Design segment employs the highest number at
approximately 22,100 or 33% of all creative industries employment in Queensland. It is important to note that not all of these workers can be classified as ‘creatives’. In fact, 58% of workers employed in the Architecture, Visual Arts & Design segment are administrative and support staff, or ‘non-creative’ workers.
• In employment terms, Queensland’s Film, Television & Entertainment Software segment is the second largest of the
creative industries segments. This segment employs approximately 17,300 people of whom around 7,560 or 44% are ‘creatives’ and 9,730 or 56% are ‘non-creative’ workers. The large number of non-creative workers in this segment can be attributed to the consulting engineering services and computer consultancy services sectors, both of which contain a large number of non-creative workers as well those ‘creatives’ working in sectors like software design and games development.
• Performing Arts has more ‘creatives’ as a proportion of its total workforce than any other creative industries segment in
Queensland. This is followed by the Writing, Publishing & Print Media segment. • The creative industries generally have a larger proportion of expenditure on their employees (45% across creative
sectors) when compared to other industry sectors (the average across all other sectors being 29%).
Exports
• Queensland’s creative industries generate a total of $1.1 billion in exports. • The proportion of creative industries output that is exported is generally higher than that of non-creative sectors (36% for
the creative industries compared to 14% for other industries generally). • Although a small segment by comparison with other creative industries, the Music Composition & Production segment
has the highest proportion of exports (68%) across all the creative industries in Queensland. • Exports account for only 13% of outputs in the Architecture, Visual Arts & Design segment, which is the lowest across
the creative industries in Queensland. However, anecdotal information suggests that this segment’s export contribution may be understated. Interviews with selected businesses in the Architecture, Visual Arts & Design segment revealed that some firms provide their services to brokers located in Queensland but whose end client or customer is actually from interstate or overseas.

creative industries research and applications centreCiRAC
Mapping Queensland’s Creative Industries: Economic Fundamentals
Page. 65
Industry F lows
• The Film, Television & Entertainment Software, Architecture Visual Arts & Design and Publishing, Writing & Print
Media segments all import a larger share of their inputs than the other creative industries segments. • Queensland’s Music Composition & Production segment imports fewer inputs than any other creative industries segment. • Queensland’s Advertising, Graphic Design & Marketing segment derives more of its inputs (both in dollar value and
proportionally) from within the creative industries than do any of the other creative industries segments. • Inputs for creative industries predominantly come from outside the creative industries sectors. • The majority of the creative industries outputs flow to non-creative industries (as opposed to other creative industries)
and to final demand (i.e. end consumers). • Queensland’s Film, Television & Entertainment Software segment has the largest proportion of outputs (14%) going into
other creative industries segments. • Perhaps not surprisingly, Queensland’s Music Composition & Production segment, the Film, Television & Entertainment
Software segment and the Performing Arts segment each have relatively higher proportions of their respective outputs going to final demand (i.e. household consumption) when compared against to other industries.

creative industries research and applications centreCiRAC
Mapping Queensland’s Creative Industries: Economic Fundamentals
References
Australian Bureau of Statistics (2001), Journey to Work Data, Unpublished Data, Canberra Australian Bureau of Statistics (2002), National Accounts 2001/02, Cat. No. 5220.0, Canberra Commonwealth Department of Communications and Information Technology and National Office of the Information Economy (2002), Creative Industries Cluster Study: Stage One and Two Reports, Canberra Howkins, John (2001), The Creative Economy: How people make money from ideas, Allen Lane, The Penguin Press Queensland Department of State Development (2004), Creativity is Big Business, A Framework for the Future, based on the unpublished document Queensland Creative Industries Strategy, prepared for the Department of State Development by ICF Consulting and SGS Economics and Planning, October 2003

Mapping Queensland’sCreative IndustriesA research report series
Creative Industries Research and Applications CentreQueensland University of Technology
creative industries research and applications centreCiRAC
a university for the
Conducted with the support of:
The reports in the Mapping Queensland’s Creative Industries series include:
Brisbane's Creative Industries (2003) http://eprints.qut.edu.au/archive/00002409/
Queensland Music Industry Value Web: From the Margins to the Mainstream (2004) http://eprints.qut.edu.au/archive/00002422/
Queensland Music Industry Basics: People, Businesses and Markets (2004) http://eprints.qut.edu.au/archive/00002412/
Queensland Music Industry Trends: Independence Day? (2004) http://eprints.qut.edu.au/archive/00002411/
Mapping Queensland’s Creative Industries: Economic Fundamentals (2005) http://eprints.qut.edu.au/archive/00002425/
The Ecology of Queensland Design (2005) http://eprints.qut.edu.au/archive/00002410/