A recession is born!
34
A recession is born! A tale of St. Cloud King Banaian St. Cloud State University Winter Institute, Feb 25 2009
description
A recession is born!. A tale of St. Cloud King Banaian St. Cloud State University Winter Institute, Feb 25 2009. Good advice for a forecaster. - PowerPoint PPT Presentation
Transcript of A recession is born!

A recession is born!
A tale of St. CloudKing BanaianSt. Cloud State UniversityWinter Institute, Feb 25 2009

Good advice for a forecaster
Tell me what you know. Tell me what you don't know. And then, based on what you really know and what you really don't know, tell me what you think is most likely to happen.
Gen. Colin Powell, 2004, to intelligence officers
• All forecasts should have three parts• What I know• What I don’t know• What I think

By now, you know the drill
• What did we say last year?
• Let’s look at a few slides from the end of last time…

St. Cloud Index of Leading Economic Indicators
9293949596979899
100101102103104105106
Jul-03 Jan-04 Jul-04 Jan-05 Jul-05 Jan-06 Jul-06 Jan-07 Jul-07
Is this another fake like 2006, or is this one real?
False signal
Turns out this one was VERY real!
So, do we say it this time?
• “Recent Federal Reserve actions indicate they will cut aggressively, but inflation a concern.
• “Next QBR out in March may have enough information from business leaders, but I still see reasons for disagreement.”
• I think we got this right.– Inflation stayed tame;
now our survey respondents are concerned of deflation.
– The recession in St. Cloud probably started later than March.

Numbers for next year
• We should not see growth here in the first half of 2008; a mild decline in employment is my best guess.– Credit-insensitive sectors should continue to grow. Will it
be enough to stay out of a recession?
• Nationally, manufacturers might be helped by lower exchange rates, but that doesn’t help much here.– So I will venture for all 2008 employment growth <1%.– Not enough to keep unemployment from growing.– It will feel like a recession, but is it?– I’ll let you know next year.
THIS IS LAST YEAR!

What do we know?

Unemployment rate highest Unemployment rate highest since ‘91since ‘91
Unemployment Rate, St. Cloud
33.5
44.5
55.5
66.5
77.5
Jan-
07
Mar
-07
May
-07
Jul-0
7
Sep-0
7
Nov-07
Jan-
08
Mar
-08
May
-08
Jul-0
8
Sep-0
8
Nov-08
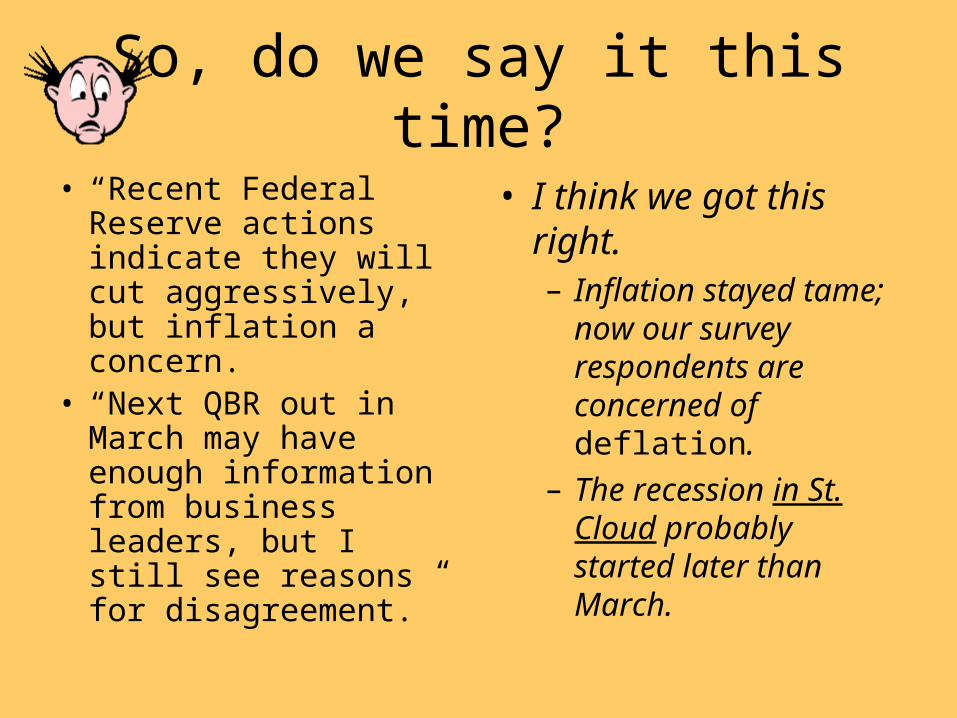
A recession that was not A recession that was not bothering us before, is the bothering us before, is the
worst right nowworst right nowEmployment after peaks, St. Cloud MSA,
Seasonally Adjusted
-2500.0-2000.0-1500.0-1000.0
-500.00.0
500.01000.01500.02000.02500.0
1 2 3 4 5 6 7 8 9 10 11 12
Employment
change from
peak
Oct-89
May-96
May-01
Dec-07

Worst ever?
• Only have data for local economy since 1989– Nationally, two eight-month
recessions, very mild during that time
– Data for the last two recessions before 1989 show much more severe drops
– “Worst in a quarter century” ducks the data

In terms of recessions, this one is worse than average, but not worst

We may reach the 1981 level, but the 1957 level is less likely

Minnesota went into Minnesota went into recession in February 2008recession in February 2008
Minnesota Coincident Indicator
135.00
140.00
145.00
150.00
155.00
160.00
165.00
170.00Ja
n-03
Jul-0
3
Jan-
04
Jul-0
4
Jan-
05
Jul-0
5
Jan-
06
Jul-0
6
Jan-
07
Jul-0
7
Jan-
08
Jul-0
8
Source: Federal Reserve Bank of Philadelphia

Real estate volumes have fallen 31% over the last two years
Home Sales Volume, St. Cloud Area Reators
$0
$100,000,000
$200,000,000
$300,000,000
$400,000,000
$500,000,000
$600,000,000
$700,000,000
2006 2007 2008
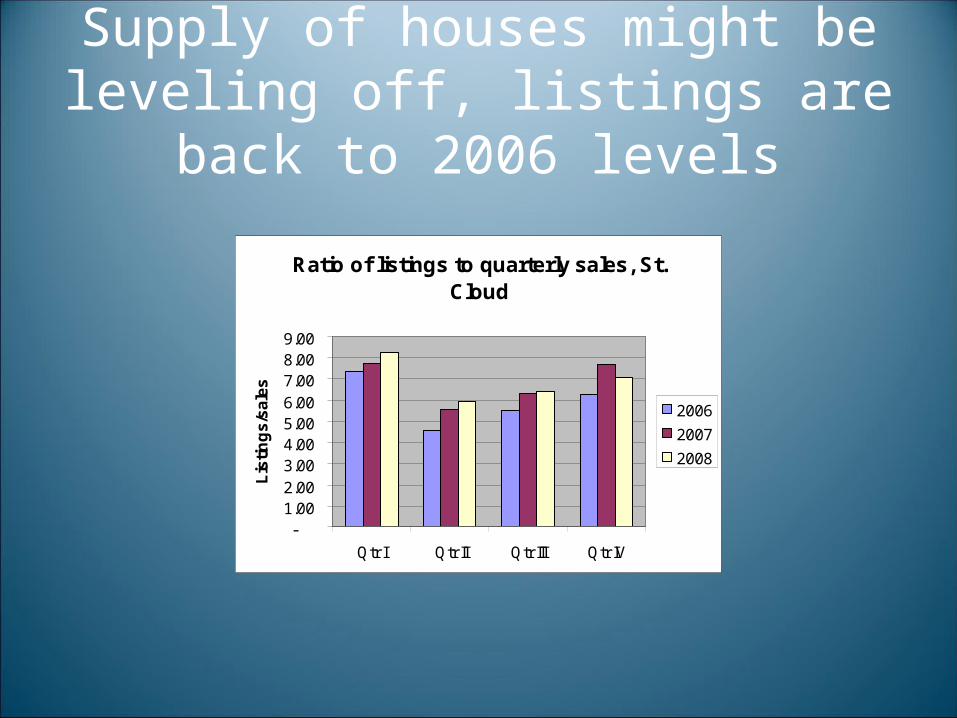
Supply of houses might be leveling off, listings are back to 2006 levels
Ratio of listings to quarterly sales, St. Cloud
-1.002.003.004.005.006.007.008.009.00
Qtr I Qtr II Qtr III Qtr IV
Lis
tin
gs
/sa
les
2006
2007
2008

Bank-owned real estate still a pressure, but not too many
Bank-owned real estate, St. Cloud banks
$-
$2
$4
$6
$8
$10
$12
$14
2005 2006 2007 2008
mill
ion
s
All data as of September 30

View of one realtor
• Claims to have 400 foreclosure properties available
• For 4th quarter 2008:– Bank owned homes made up 59% of all sales on
the St Cloud MLS under $150,000.– Bank owned homes made up 19% of all sales on
the St Cloud MLS over $150,000.
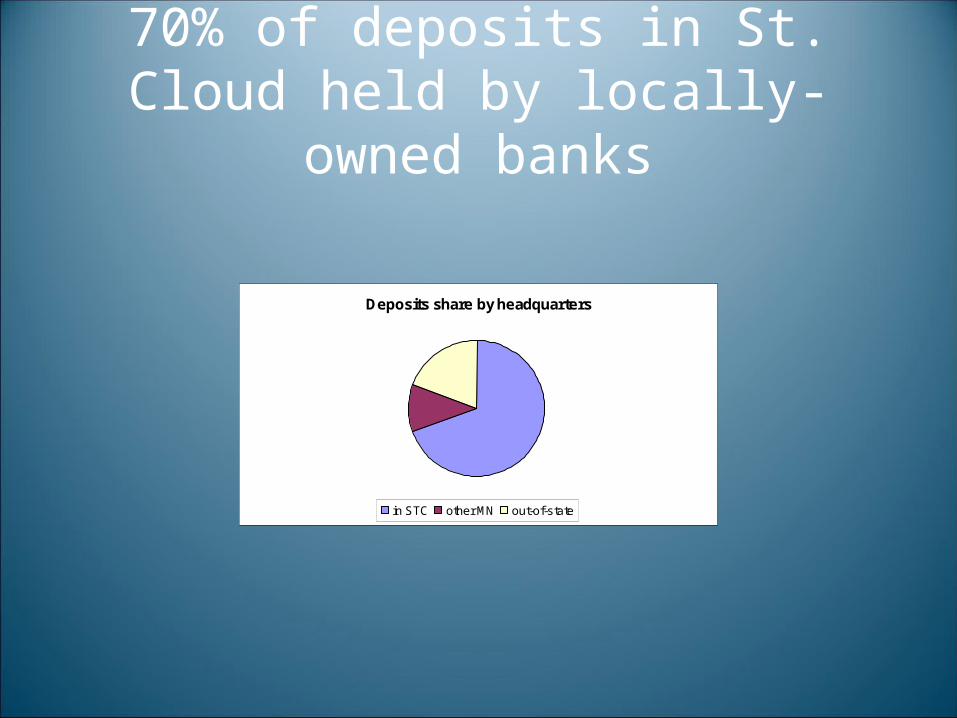
70% of deposits in St. Cloud held by locally-owned banks
Deposits share by headquarters
in STC other MN out-of-state

Local banks are losing profits as they write down loans
Net income and loan charge-offs
0.00%
0.50%
1.00%
1.50%
2.00%
2.50%
3.00%
2005 2006 2007 2008
Net income Charge-offs

Balance sheet data, 21 area banks
2008 2007 2006 2005Assets, o/w $3,184.1 $3,507.1 $3,270.8 $3,102.5
Cash 90.2 76.6 79.0 117.3 Securities 533.3 603.7 473.4 496.1
Loans, net 2,451.3 2,727.4 2,627.8 2,424.2 Liabilities, $2,770.8 $3,100.3 $2,905.0 $2,783.2
Deposits 2,437.2 2,665.5 2,531.0 2,380.6 Borrowings 309.1 405.4 349.6 379.6
Net worth 413.3 406.8 365.8 319.3 % of assets 12.1% 11.9% 11.3% 10.7%
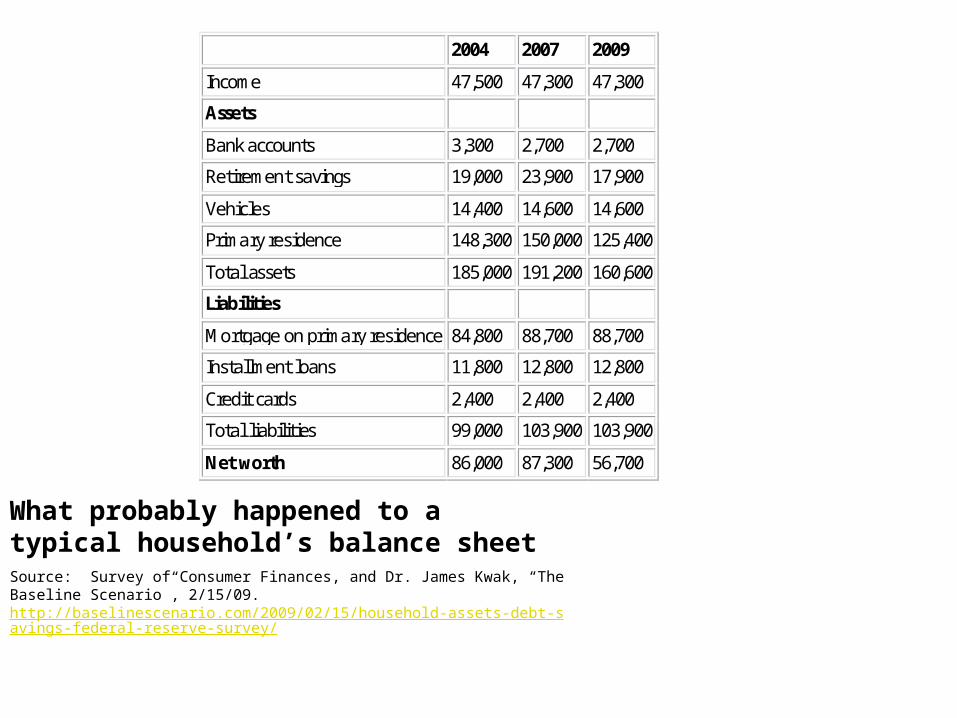
What probably happened to a typical household’s balance sheetSource: Survey of Consumer Finances, and Dr. James Kwak, “The Baseline Scenario”, 2/15/09. http://baselinescenario.com/2009/02/15/household-assets-debt-savings-federal-reserve-survey/
2004 2007 2009
Income 47,500 47,300 47,300
Assets
Bank accounts 3,300 2,700 2,700
Retirement savings 19,000 23,900 17,900
Vehicles 14,400 14,600 14,600
Primary residence 148,300 150,000 125,400
Total assets 185,000 191,200 160,600
Liabilities
Mortgage on primary residence 84,800 88,700 88,700
Installment loans 11,800 12,800 12,800
Credit cards 2,400 2,400 2,400
Total liabilities 99,000 103,900 103,900
Net worth 86,000 87,300 56,700
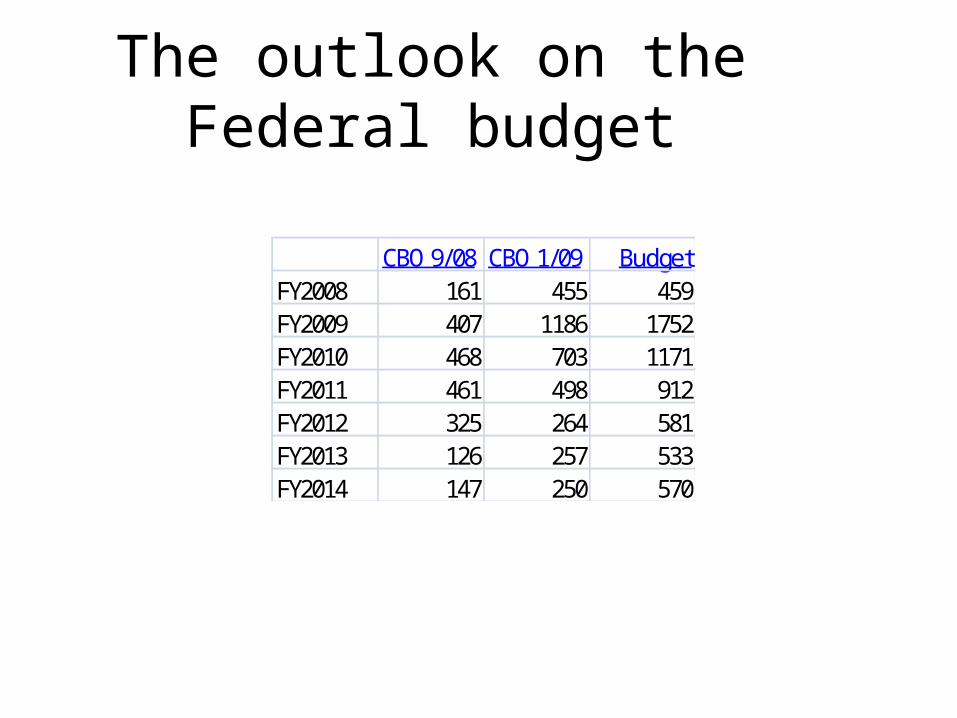
The outlook on the Federal budget
CBO 9/08 CBO 1/09 BudgetFY2008 161 455 459FY2009 407 1186 1752FY2010 468 703 1171FY2011 461 498 912FY2012 325 264 581FY2013 126 257 533FY2014 147 250 570
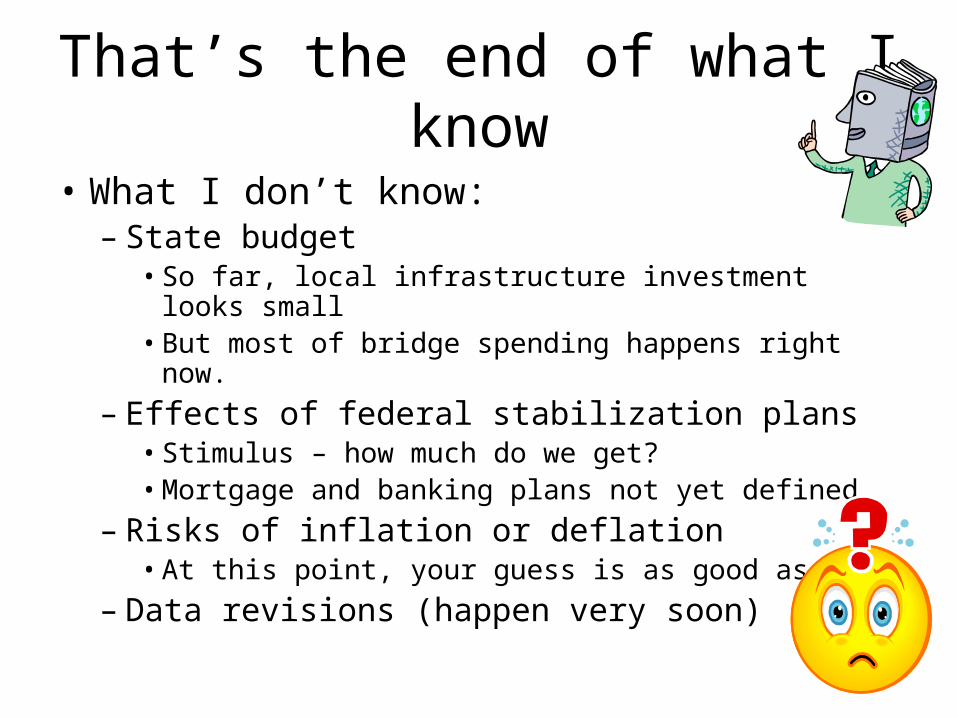
That’s the end of what I know
• What I don’t know:– State budget
• So far, local infrastructure investment looks small• But most of bridge spending happens right now.
– Effects of federal stabilization plans• Stimulus – how much do we get?• Mortgage and banking plans not yet defined
– Risks of inflation or deflation• At this point, your guess is as good as mine
– Data revisions (happen very soon)

So what do I think?
• Nothing indicates the recession ends this spring or summer.
• Maybe a late-2009 recovery.– I don’t believe this is
different in nature than other severe contractions.
• Old enough to remember the savings and loan scare

Updated LEI through January 2009

Probability of recession, 4-6 mos.
0.0
0.2
0.4
0.6
0.8
1.0
99 00 01 02 03 04 05 06 07 08 09
2nd recession begins 8/08 in St. Cloud (we think)
No end yet

Getting to the deflation story
Source: Casey Mulligan, 25.Feb.2009
The deflation of the Depression continued for four years and almost 50%
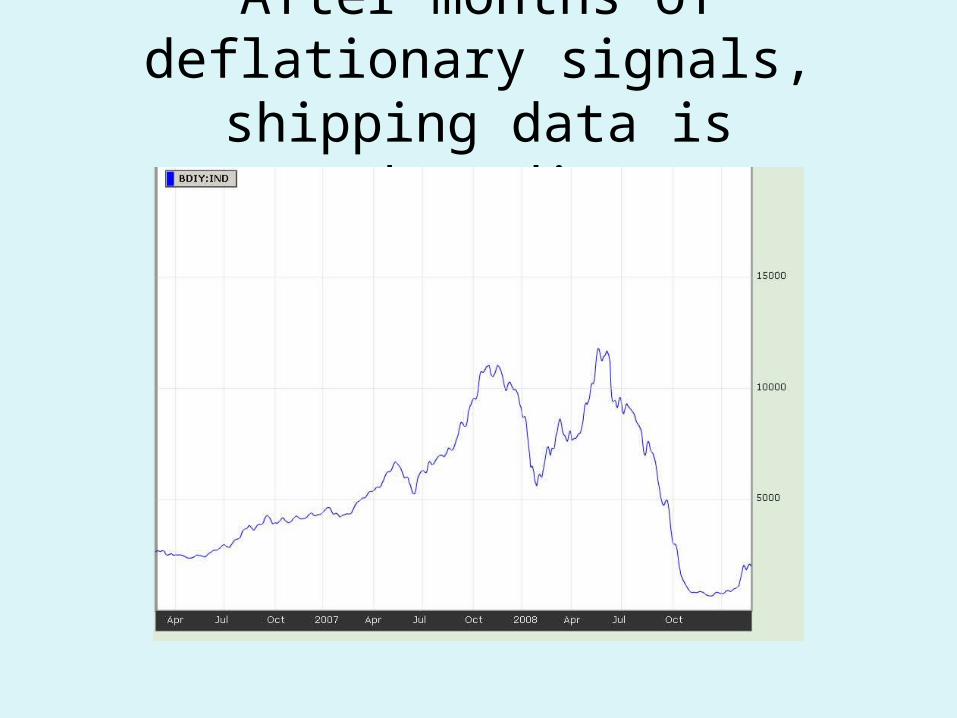
After months of deflationary signals, shipping data is rebounding

But no turn yet in CRB
Reuters/Jefferies-CRB® Index (1967=100)(monthly close) September 1956 - January 2009
50
100
150
200
250
300
350
400
450
500
1956 1960 1964 1968 1972 1976 1980 1984 1988 1992 1996 2000 2004 2008
© Thomson Reuters
Index Value

Credit markets calming, not yet calm
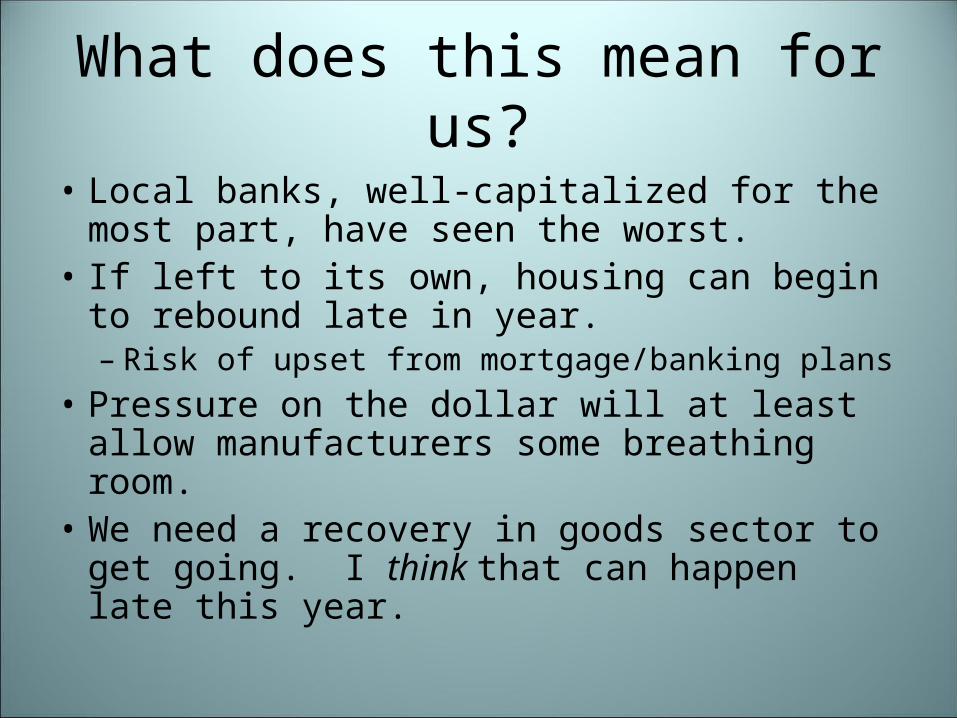
What does this mean for us?
• Local banks, well-capitalized for the most part, have seen the worst.
• If left to its own, housing can begin to rebound late in year.– Risk of upset from mortgage/banking plans
• Pressure on the dollar will at least allow manufacturers some breathing room.
• We need a recovery in goods sector to get going. I think that can happen late this year.
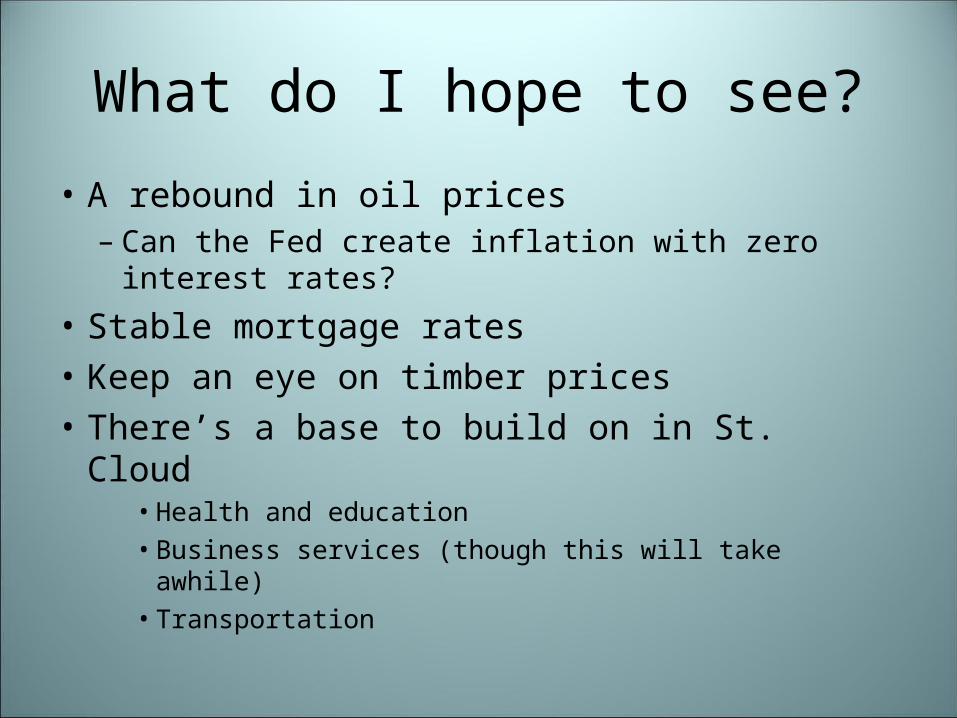
What do I hope to see?
• A rebound in oil prices– Can the Fed create inflation with zero interest
rates?
• Stable mortgage rates• Keep an eye on timber prices• There’s a base to build on in St. Cloud
• Health and education• Business services (though this will take awhile)• Transportation
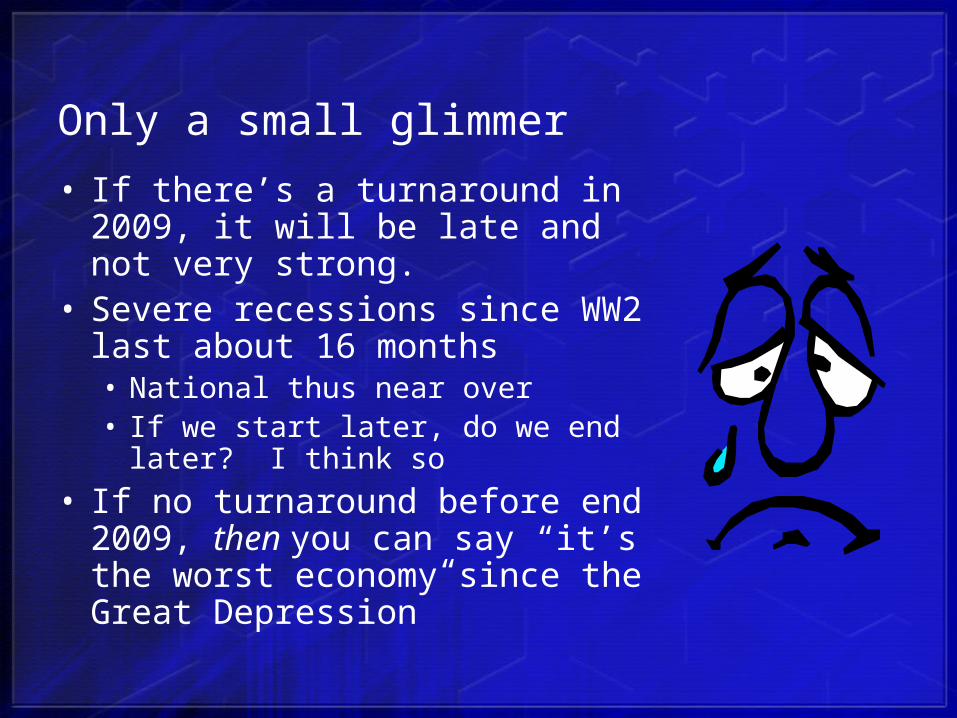
Only a small glimmer
• If there’s a turnaround in 2009, it will be late and not very strong.
• Severe recessions since WW2 last about 16 months• National thus near over• If we start later, do we end later? I
think so
• If no turnaround before end 2009, then you can say “it’s the worst economy since the Great Depression”

See you same time next year!