A real burden of diabetes today and tomorrow-cutting … · A real burden of diabetes today and...
51
A real burden of diabetes today and tomorrow- cutting costs or investing in a better treatment? Marcin Czech ISPOR Polish Chapter, Polish Pharmacoeconomic Society Institute of Organisation and Management Department of Pharmacoeconomics, Medical University of Warsaw Europe East Regional Office, Novo Nordisk 1st Congress of ISPOR Bosnia Chapter Sarajevo, 14-15.10.2011
Transcript of A real burden of diabetes today and tomorrow-cutting … · A real burden of diabetes today and...

A real burden of diabetes today and tomorrow- cutting costs or investing in a better treatment?
Marcin Czech
ISPOR Polish Chapter, Polish Pharmacoeconomic Society Institute of Organisation and Management
Department of Pharmacoeconomics, Medical University of WarsawEurope East Regional Office, Novo Nordisk
1st Congress of ISPOR Bosnia Chapter
Sarajevo, 14-15.10.2011

• Basics of health economic (HE) evaluation• Burden of diabetes mellitus (DM), global,
Central European and Polish perspectives• Modelling in search for a cost- effective
treatment• Long- term cost- effectiveness or short-
term cost of control?
Agenda2

Basics of Health EconomicsBasics of Health Economics• Demand for healthcare is infinite
– Increased expectations and technological change• Resources are scarce
– Doctors, nurses, drugs• Choices are necessary
– Do we increase hip replacements or renal transplantations?
• Prioritisation is required– On what basis?
• Costs and benefits must be compared– How do we measure benefits?

150 vaccinations for Measles,Mumps and Rubella
One-thousandth of a Challenger 2military tank
One-third of a cochlear implant
11cataract removals
1 heart bypass operation
One-third of a junior school teaching assistant for a year
2000 school dinners
The opportunity cost of one yearsThe opportunity cost of one years’’treatment for diabetestreatment for diabetes
Morris S, Devlin N, Parkin D Economic Analysis in Health Care John Willey & Sons Ltd. 2007

Why diabetes?
• UN focus on non- communicable diseases including DM
• EU expressing interest in DM, EU Forum on DM in 2012
• WHO and IDF working on directions of diabetes care in Europe
• National Diabetes Plans in the majority of European countries

Diabetes: the economic impact of a global pandemic
• Estimated global healthcare expenditures to treat and prevent diabetes and its complications are at least 376 billion USD in 2010
• By 2030, this number is projected to exceed some 490 billion USD
• An estimated average of 703 USD per personwas spent on diabetes in 2010 globally
The IDF Diabetes Atlas, Fourth Edition (2009)

Cost of complications
Antidiabetic drugs - 7%
Outpatient care - 18%
Other drugs - 20%
Hospitalisation - 55%
Antidiabetic drugs - 7%
Outpatient care - 18%
Other drugs - 20%
Hospitalisation - 55%
CODE-2 (Jönsson 2002) - Distribution of overall cost for individuals with type 2 diabetes in Sweden, Belgium, Germany, France, Holland, Spain and Italy
Diabetes costs are mainly due to late stage
complications and hospitalisation
**
Anti-diabetic drugs only account for 7%
Other
Healthcare costs related to DIABETES (10%)
Costs related to TREATMENTS (25%)
Costs related to complications
25%
OTHER DRUGS (20%)
HOSPITALISATION (55%)
ANTI-DIABETIC DRUGS (7%)
AMBULATORY (18%)
10%
25%7%
90%
75% 20%
55%18%
Jönsson, 2002
Costs related to:
Diabetes health care costs in Europe
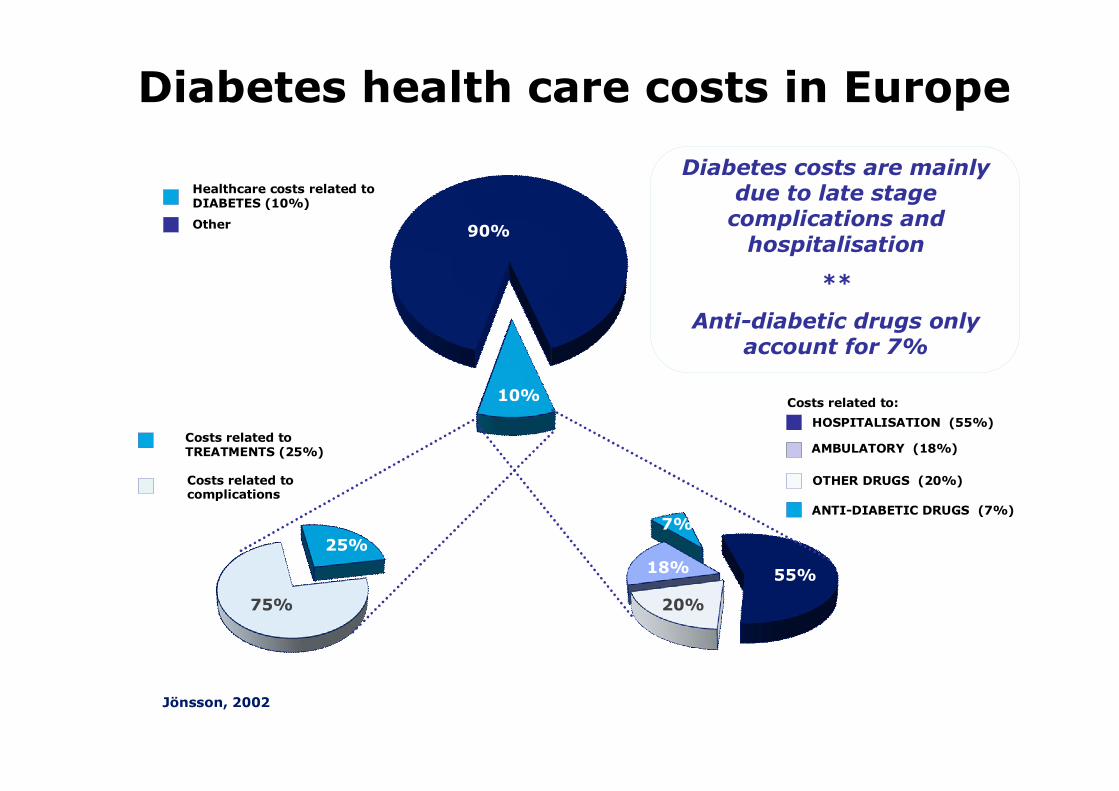
42%
26%
11% 2%
6%
13%
GASTRO-INTESTINAL (6%)
CARDIOVASCULAR + LIPID-LOWERING (42%)
INSULIN (11%)
ORAL ANTI-DIABETICS (13%)
ANTI-INFECTIOUS (2%)
OTHER DRUGS (26%)
Jönsson, 2002
Country specific data
(e.g. Spain)
24%
Cost of medicines in people with diabetes in Europe

Review of cost of diabetes studies in Central Europe
Objective: to review all studies concerning costs of diabetes type 1 and type 2 and its complications in Central and Eastern Europe, Western Europe, USA and Canada.
Czech M, Kawalec P – How much does diabetes cost in Central and Eastern Europe? – a systematic review of the literature comparing the situation to Western Europe, USA and Canada . Journal of Interdisciplinary Economics (in press)

Conclusions
1. 105 studies on cost of DM type 1 and type 2 and its complications were found
2. 14 studies concerned cost of DM in Central and Eastern European countries
3. 91 studies described cost of diabetes in Western Europe

Conclusions
1. Only one study concerning cost of diabetes was found for Serbia, Lithuania and Bulgaria7 studies were identified in Poland and 3 studies were carried out in Czech Republic
2. Results of this review reveal the necessity of carrying out more studies concerning cost of diabetes and its complications in Central and Eastern European countries.

Burden of DM in Poland• based on the National Insurance Fund and the Social
Insurance Institution data • estimated at 2,5 bil. EUR/ year for 38 m country, 2,7 m
diabetics• complications 5 times more costly than treatment• 50% indirect costs due to disability pensions and
absenteeism• cost increase 12% YtY• hospitalisations cost increase 100% between 2004 and
2009• reimbursement increase 26% between 2005 and 2009
Leśniowska J, Schubert A, Skrzekowska-Baran I Cost Of Diabetes And Its Complications In Poland. Preliminary Results ISPOR 2011
Rynek Zdrowia http://www.rynekzdrowia.pl/Uslugi-medyczne/Raport-powiklania-cukrzycy-5-razy-drozsze-niz-sama-choroba,112283,8.html accessed 20.09.2011

HTA of DM compounds in PolandMethods: • A search was conducted on the webpage of AOTM (http://www.aotm.gov.pl) for HTA
reports on the following products: Rosiglitazon, Pioglitazon, Sitagliptin, Vildagliptin, Saxagliptin, Exenatide, Liraglutide, Glargine, Detemir, Aspart, Glulisene and Lispro.
Results:• Of a total of 163 reports (published between 2007-2010), 8 reports in Polish language
on diabetes were identified and assessed. – Two reports can be viewed as secondary assessment of regulatory safety discussions. – The other six reports assessed the implementation of new diabetes compounds with
assessment of efficacy, safety and cost effectiveness of the drugs.– Two reports assessed safety concerns associated with the risk of cancer and concluded
based on EMA and FDA research that no increased risk was associated with these agents. – Rosiglitazone and Sitagliptin were not recommended for reimbursement due to availability of
other treatments with similar efficacy. – Saxagliptin, Exenatide and Liraglutide got the recommendation to be reimbursed due to
expected increase in QALYs. – Glulisene which got the recommendation to temporary reimburse (two years) provided that
data on hard endpoints (not specified in public report) and cost effectiveness should be delivered.
• The AOTM’s recommendation is obligatory for the Polish Ministry of Health.
Adalstein JE, Czech M, Skrzekowska- Baran I.Health Technology Assessment of diabetes compounds: The Polish perspective, Value in Health, ISPOR 2010

Where should we look for cost-effective treatment?
Prevention(early)
detection Better treatment

• disease computer simulation model developed to project the long-term health outcomes and economic consequences of interventions in type 1 and type 2 diabetes. • a non-product specific analysis tool • real-time simulations based on baseline patients characteristics and diabetes screening and treatment
CORE Diabetes Model16

• the model is based on a series of 15 independent Markov sub-models that simulate the progression of disease-related complications.
• each sub-model uses time, state, and diabetes type –dependent probabilities derived from published sources.
• health state utility values for disease and treatment-related outcomes are used to determine quality-adjusted life years (QALYs)
• extensively validated, published, used for decision making, easily adopted for local requirements
CORE Diabetes Model17

CORE Model flow diagram
-Aspirintreatment
Statintreatment
ACEItreatment
Overall annualsurvival
Time counteradvances
Update simulationdata
Stop
No
No
Yes
Yes
Cataract
Specificmortality
Specificmortality
Specificmortality
MI
Specificmortality
Angina CHF
Specificmortality
Stroke PVD Neuro-pathy
Foot ulcer,
amputationRetino-pathy
Specificmortality
Specificmortality
Macularedema
Lacticacidosis
Specificmortality
Non-spec.mortality
Nephro-pathy
Hypo-glycemia
-Ketoacidosis
LASERtreatment
Screening
User sets simulationconditions
Generate baselinepopulation
Time horizonReached?
Any patientsto run?

The break even time for investment in better quality of care is 6-8 years
Source: CORE/IMS based on newly diagnosed UKPDS cohort at age 52Note: “better treatment” simulation of patient population treated to target of HbA1c = 7.0
6-8 years
3000
3500
4000
4500
5000
5500
6000
6500
1 2 3 4 5 6 7 8 9 10 11 12 13 14 15 16 17 18 19 20
Baseline
Better treatment
Years
Direct healthcare costs for diabetes£ Millions
= Investment= Cost saving
Break even

John and Peter have just been diagnosed with diabetes – who will have the better life?
Johnage 52
Peterage 52
Poor control Good control
HbA1c 9,1% HbA1c 7,0%
Peter will have the better life
Peterwill live 20% longer
than John
Peterwill live 60% longer
without complications
Peterwill cost 20% less
than John

The economic estimates of well-timed diagnostics and early treatment of type 2
diabetes mellitus in Lithuania (Markov model)
Results of timely diagnostics and early initiation of treatment:
• Direct costs per one patient reduced:– by 1,736 Lt over 5 years – by 5,911 Lt over 10 years
• Indirect costs per one patient reduced:– by 2.418 Lt over 5 years– by 7,061 Lt over 10 years
• Health budget savings (if diagnostics and early treatment improved in at least 50% of cases):– by 34,7 milion Lt over 5 years– by 118,2 milion Lt over 10 years
• Prolonged life of patient by 2,67 months over 10 yearsLaiku diagnozuoto 2 tipo cukrinio diabeto ir anksti pradėto gydymo ekonominis įvertinimas Antanas Norkus, Rytas Ostrauskas, Rita Šulcaitė (Kauno medicinos universitetas Endokrinologijos institutas). Medicina (Kaunas) 2005; 41(10)

• LEAD trials – data on 6-12 month treatment
• Modelling of long term outcomes and economic implications
• UKPDS and DCCT provides solid evidence linking surrogate markers (such as HbA1c and systolic blood pressure) to the development of the long-term complications associated with diabetes.
Modelling22

• health care services payer’s perspective (only direct health care costs and benefits for healthcare included).
• additional analysis from social perspective performed (including direct and indirect costs).
Perspective23
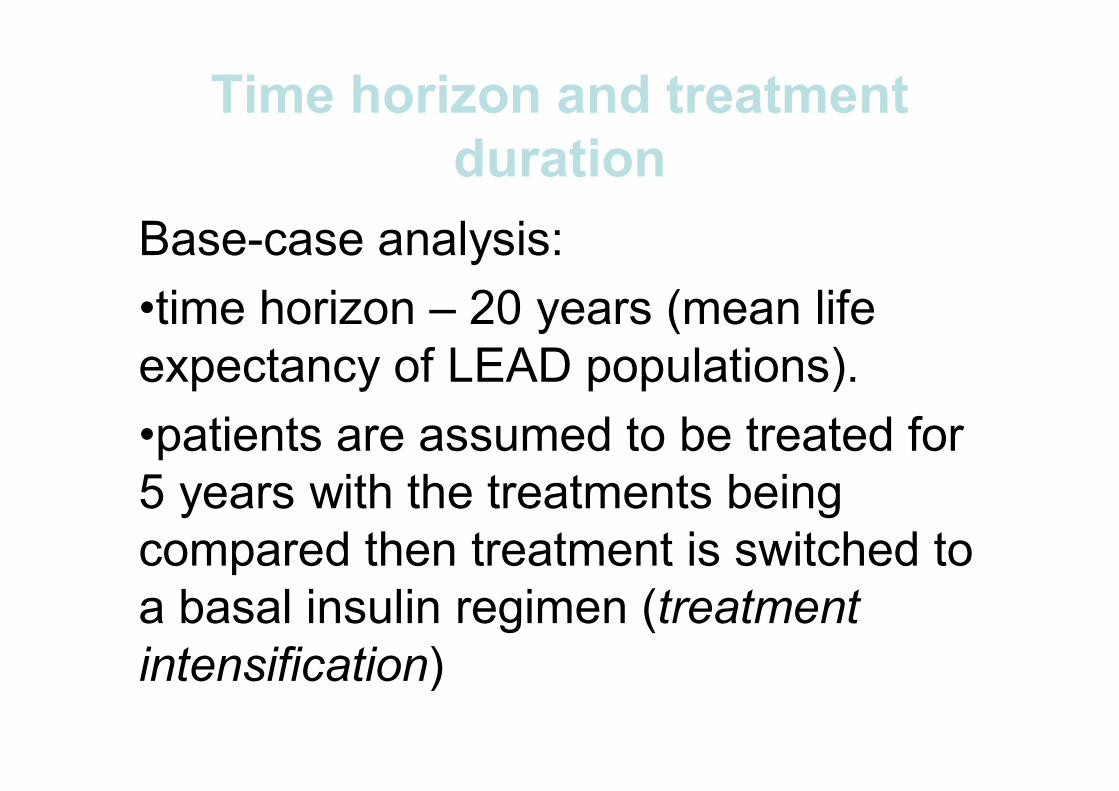
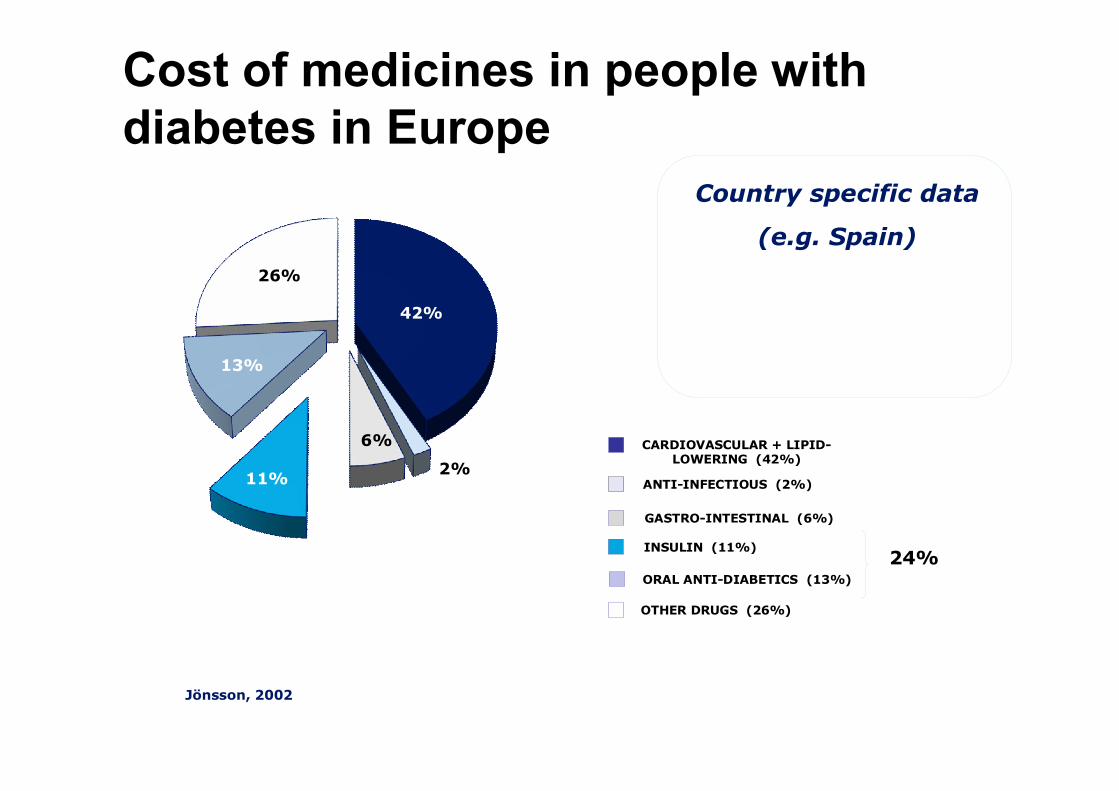
Base-case analysis:•time horizon – 20 years (mean life expectancy of LEAD populations). •patients are assumed to be treated for 5 years with the treatments being compared then treatment is switched to a basal insulin regimen (treatment intensification)
Time horizon and treatment duration24

• Local collection– Cost data: drugs, strips, needles, screening, CVD,
renal, eye and other microvascular complications, acute events
– Indirect costs: age, gender and disease specific– Clinical management patterns (i.e. concomitant
medications) and associated costs – Local experts involved
• Discounting:– local requirements/guidelines – base case: 5% for cost and effects– sensitivity analysis
Input data25

Liraglutide Effect and Action in Diabetes:• LEAD 1• LEAD 2• LEAD 5• LEAD 6
– 26-weeks randomised, double-blind, double-dummy, active control, multi-centre, multi-national trials.
LEAD PROGRAM OVERVIEW26

PICO – study design
Patients D2M treated with SU (glimepiride)
Intervention liraglutide 1,2 mg and 1,8 mg
Comparator Rosiglitazone 4 mg and placebo (glimepiride monotherapy)
Outcome HbA1c
LEAD 127
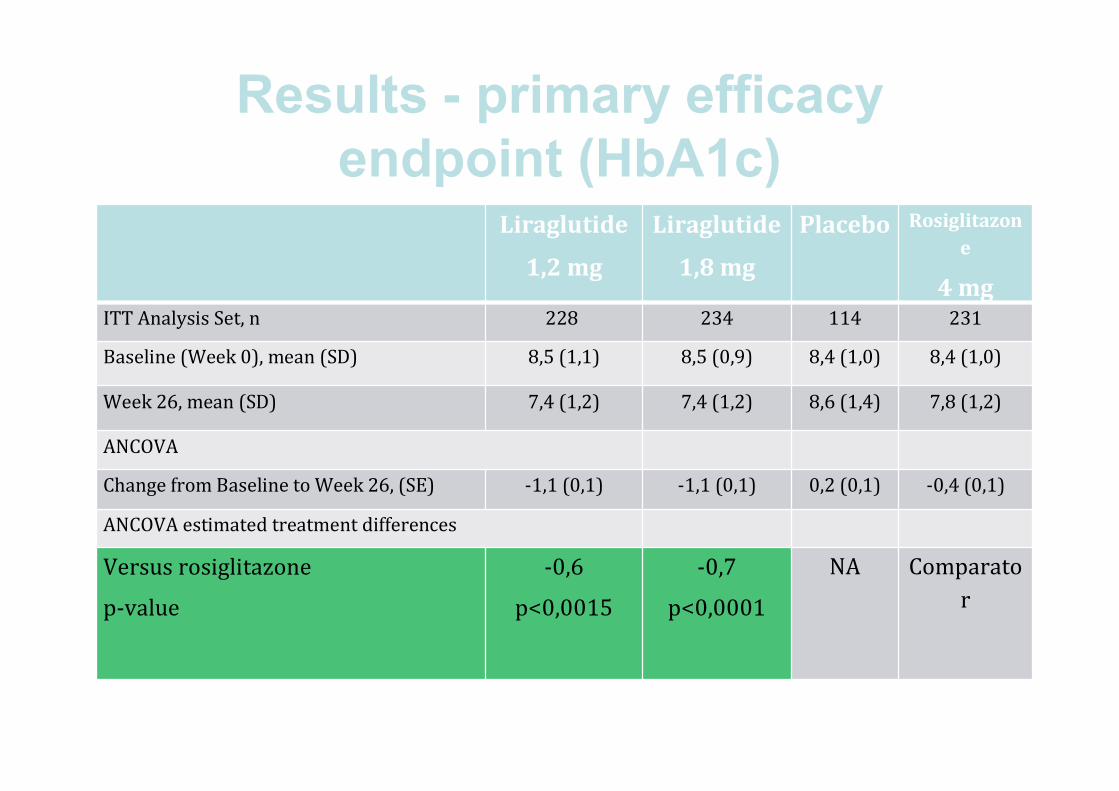
Results - primary efficacy endpoint (HbA1c)28
Liraglutide
1,2 mg
Liraglutide
1,8 mg
Placebo Rosiglitazone
4 mgITT Analysis Set, n 228 234 114 231
Baseline (Week 0), mean (SD) 8,5 (1,1) 8,5 (0,9) 8,4 (1,0) 8,4 (1,0)
Week 26, mean (SD) 7,4 (1,2) 7,4 (1,2) 8,6 (1,4) 7,8 (1,2)
ANCOVA
Change from Baseline to Week 26, (SE) -1,1 (0,1) -1,1 (0,1) 0,2 (0,1) -0,4 (0,1)
ANCOVA estimated treatment differences
Versus rosiglitazone
p-value
-0,6
p<0,0015
-0,7
p<0,0001
NA Comparator

Results - primary efficacy endpoint (model clinical input)29
Risk factor Liraglutide
1,2 mg (SD)
Liraglutide
1,8 mg (SD)
Rosiglitazone
4 mg (SD)Change in HbA1C (%) -1,08 (1,057) -1,13 (1,071) -0,44 (1,064)
Change in systolic blood pressure (mmHg) -2,56 (12,835) -2,81 (13,155) -0,93 (12,767)
Change in total cholesterol (mg/dL) -5,06 (37,9) -11,99 (38,549) +7,42 (38,149)
Change in LDL (mg/dL) -2,36 (29,746) -8,09 (30,441) +4,43 (29,941)
Change in HDL (mg/dL) -0,84 (7,399) -1,57 (7,649) +0,75 (7,447)
Change in triglycerides (mg/dL) -17,64 (132,273)
-14,74 (134,308)
+1,73 (134,052)
Change in BMI (kg/m2) +0,119 (0,901) -0,083 (0,862) +0,77 (0,858)
Major hypo event rate (per 100 patient years)
0 0,9 0
Minor hypo event rate (per 100 patient years)
50,5 47,2 12,4

Lithuania
Romania
Czech Republi
c
Slovakia
Hungary
LIRA TZD LIRA TZD LIRA TZD LIRA TZD LIRA TZD
QALY, years 6,632 6,430 6,632 6,430 7,391 7,155 6,675 6,472 6,668 6,288
Costs, Euro (ex. rate)
15733 12 186 20 637 17 372 25572 23745 10807 8246 20233 9688
Cost/QALY, Euro
17603 16 209 7739 12615 27752
Threshold 1-3 GDP per capita,
10000-30000
8500-25000
14000-42000
11000-33000
13300-40000
Summary results of base-case analysis (LEAD 1, liraglutide 1,2
mg)30

Sensitivity analysis - Scatter plot (LEAD 1, liraglutide 1,2 mg; cost/QALY)
31Lithuania Romania
Czech Republic Slovakia

PICO – study designPatients D2M treated with MET and/or SU
Intervention liraglutide 1,8 mg
Comparator Exenatide 10 ug twice daily
Outcome HbA1cSafety profile
CEA input data LEAD 632

Results - primary efficacy endpoint (HbA1c)33
Liraglutide
1,8 mg
Exenatide
ITT Analysis Set, n 233 231 Baseline (Week 0), mean (SD) 8,2 (1,0) 8,1 (1,0) Week 26, mean (SD) 7,0 (0,9) 7,2 (1,0) ANCOVAChange from Baseline to Week 26,(SE) -1,1 (0,1) -0,8 (0,1) ANCOVA estimated treatment differencesVersus exenatide, non-inferiority
p-value
-0,3
P<0,0001*
Comparator
Versus exenatide, superiority
p-value
-0,3
p=0,0015*
Comparator

Results - primary efficacy endpoint (model clinical input)34
Risk factor Liraglutide
1,8 mg (SD)
Exenatide 10 µg b.i.d. (SD)
Change in HbA1C (%) -1,12 (1,221) -0,79 (1,216)
Change in systolic blood pressure (mmHg) -2,51 (17,554) -2,00 (17,934)Change in total cholesterol (mg/dL) -7,69 (39,39) -3,54 (39,16)Change in LDL (mg/dL) -17,13 (32,56) -15,53 (32,25)Change in HDL (mg/dL) -1,37 (9,02) -1,74 (8,89)Change in triglycerides (mg/dL) -36,42 (132,60) -20,16 (131,12)
Change in BMI (kg/m2) -1,145 (1,353) -1,015 (1,466)Major hypo event rate (per 100 patient years) 0 2Minor hypo event rate (per 100 patient years) 193,2 260,0

Lithuania Romania Czech Republic Slovakia Poland
LIRA EXE LIRA EXE LIRA EXE LIRA EXE LIRA EXE
QALY, years 6,465 6,340 6,465 6,340 7,191 7,046 6,486 6,374 7,162 7,012
Costs, Euro (ex. rate)
17313 15565 21464 19566 26227 24816 12797 10102 12543 11124
Cost/QALY, Euro
13925 15123 9693 24013 9441
Threshold 1-3 GDP per capita, PPP’Euro
10000-30000
8500-25000
14000-42000
11000-33000
9300-28000
Summary results of base-case analysis (LEAD 6)35
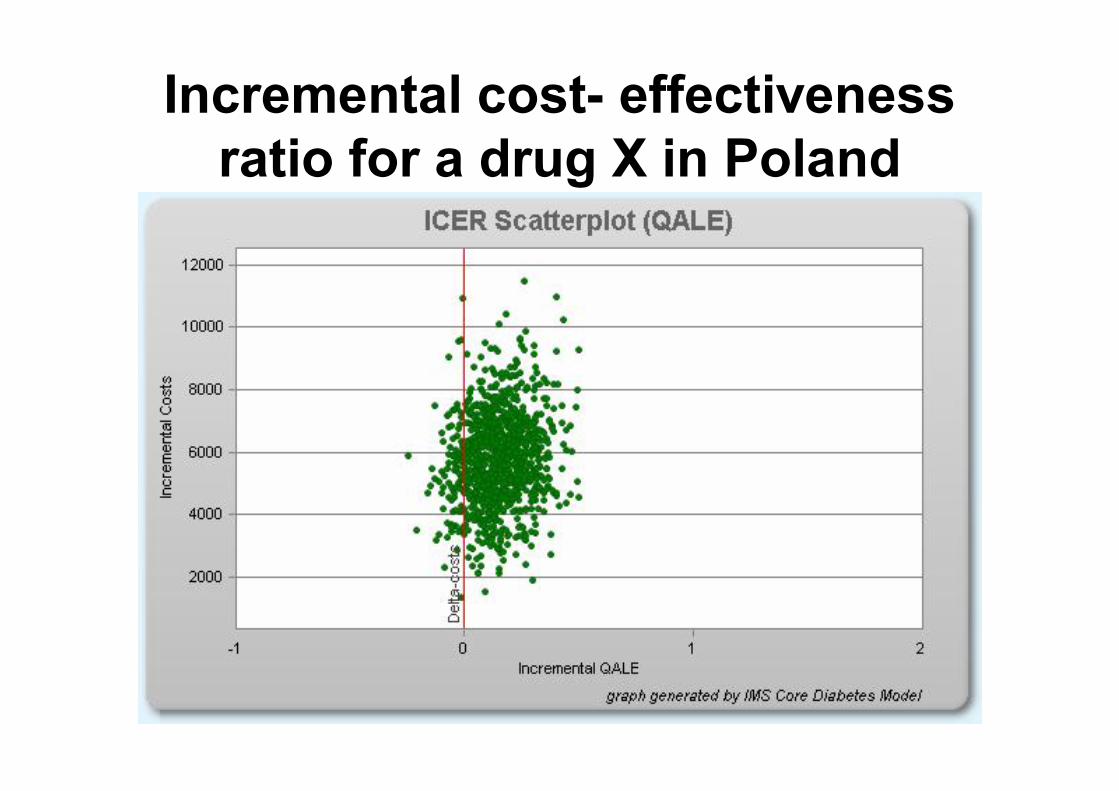
Incremental cost- effectiveness ratio for a drug X in Poland

Cost- effectiveness acceptability curve for a drug X in Poland
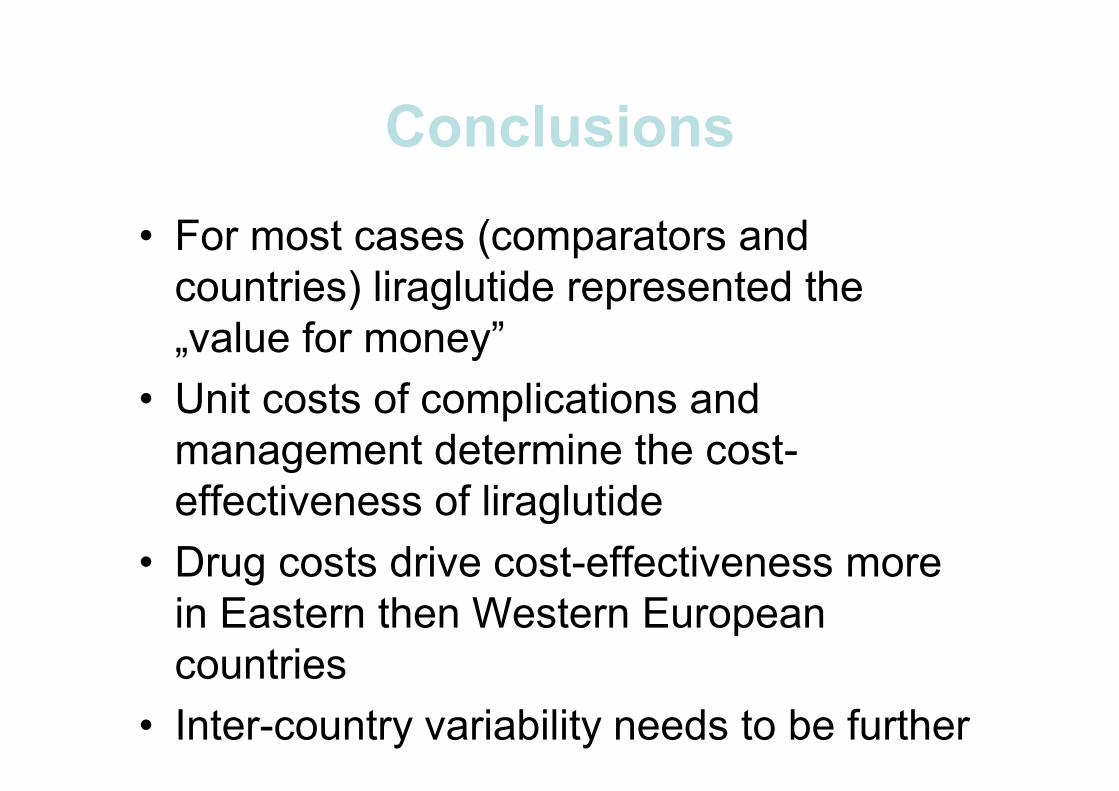
Conclusions
• For most cases (comparators and countries) liraglutide represented the „value for money”
• Unit costs of complications and management determine the cost-effectiveness of liraglutide
• Drug costs drive cost-effectiveness more in Eastern then Western European countries
• Inter-country variability needs to be further investigated
38

Cost of reaching treatment results
To demonstrate the multiple clinical and economic benefits by using a
composite clinical endpoint
Major guidelines:
• American Diabetes Association (ADA)
• Japanese Diabetes Society (JDS)
• European Association for the Study of Diabetes (EASD)

Overview of treatment targetsIndicator ADA (US) EASD (Europe) JDS (Japan)HbA1c <7.0% ≤6.5% <6.5%Blood pressure (mmHg)
<130/80 <130/80In case of renal impairment: <125/75
<130/80
Weight Weight loss is recommended for all overweight or obese individuals who have, or are at risk for, diabetes
Weight controlBMI (kg/m2) <25In case of overweight: weight reduction: 10%
Achieve a BMI=22The immediate objective in obese individuals (BMI>25) is to reduce current weight by 5%
Lipids LDL <2.6 mmol/L TC <4.5 mmol/LLDL ≤1.8 mmol/LHDL (men) >1.0 mmol/LHDL (women) >1.2 mmol/LTG <1.7 mmol/LTC/HDL <3
TC <200 mg/dL (if CAD, <180 mg/dL)LDL <120 mg/dL (if CAD, <100 mg/dL)HDL ≥40 mg/dLTG <150 mg/dL
BMI, body mass index; TC, total cholesterol; LDL, low-density lipoprotein; HDL, high-density lipoprotein; TG, triglycerides; CAD, coronary artery disease; ESC, European Society of Cardiology

Definition of two composite endpoints
Composite endpoint 1: – HbA1c<7.0% + – no weight gain + – no confirmed hypoglycaemia (minor or major)
Composite endpoint 2: – HbA1c<7.0% +– no weight gain + – SBP<130 mmHg
Includes three goals set by ADA 2009 Standards of Care
Of clinical and patient interest
SBP, systolic blood pressure

Liraglutide vs. other therapies: odds ratio of obtaining
composite endpointComparison
Odds ratio favouring liraglutideLiraglutide 1.8 mg vs.
TZD 10.3***
Liraglutide 1.8 mg vs. exenatide 2.0**
Liraglutide 1.8 mg vs. SU 7.3***
Liraglutide 1.8 mg vs. glargine 3.7***
**p<0.01; ***p<0.001 in favour of liraglutide 1.8 mgBased on meta-analysis of LEAD 1–6. Adjusted for previous treatment, baseline values and randomisation LOCF, ITT
HbA1c<7.0%, no weight gain and no minor or major hypoglycaemia

Liraglutide vs. other therapies: odds ratio of obtaining
composite endpointComparison
Odds ratio favouring liraglutideLiraglutide 1.2 mg vs.
TZD 7.5***
Liraglutide 1.2 mg vs. SU 5.3***
Liraglutide 1.2 mg vs. placebo 5.3***
**p<0.01; ***p<0.001 in favour of liraglutide 1.2 mgBased on meta-analysis of LEAD 1–6. Adjusted for previous treatment, baseline values and randomisation LOCF, ITT
HbA1c<7.0%, no weight gain and no minor or major hypoglycaemia

From cost to value of treatment• Why is it relevant for physicians and budget holders to consider the
value of drugs?
– Comparing drugs on price alone is like comparing apples and
oranges – treatment effect must be taken into account
– Many prescribers feel a push to prescribe the cheapest drug,
but the cheapest drug might not be the best
• The composite treatment success results can be expressed in
economic terms by comparing the cost of two treatments with the
outcomes

Drug costs
• The following costs are included in the
cost of treatment:– Active drug (liraglutide or comparator) based on end-of-trial dose
– Combination drugs based on end-of-trial dose
– Metformin and SU prices based on generic drugs
– SMBG costs (normal use by patient type based on Roper Starch 2007
data). Use in liraglutide is per label (no additional SMBG needed)
– Cost of needles, where relevant
– Drug prices for Germany
SMBG,

Euro spent to bring patients to target of HbA1c <7.0% with no hypoglycaemia and
no weight gain
Drug A Drug B Drug C Drug D Drug X
Euro spent on comparators to bring patients to target for every Euro spent on a drug X
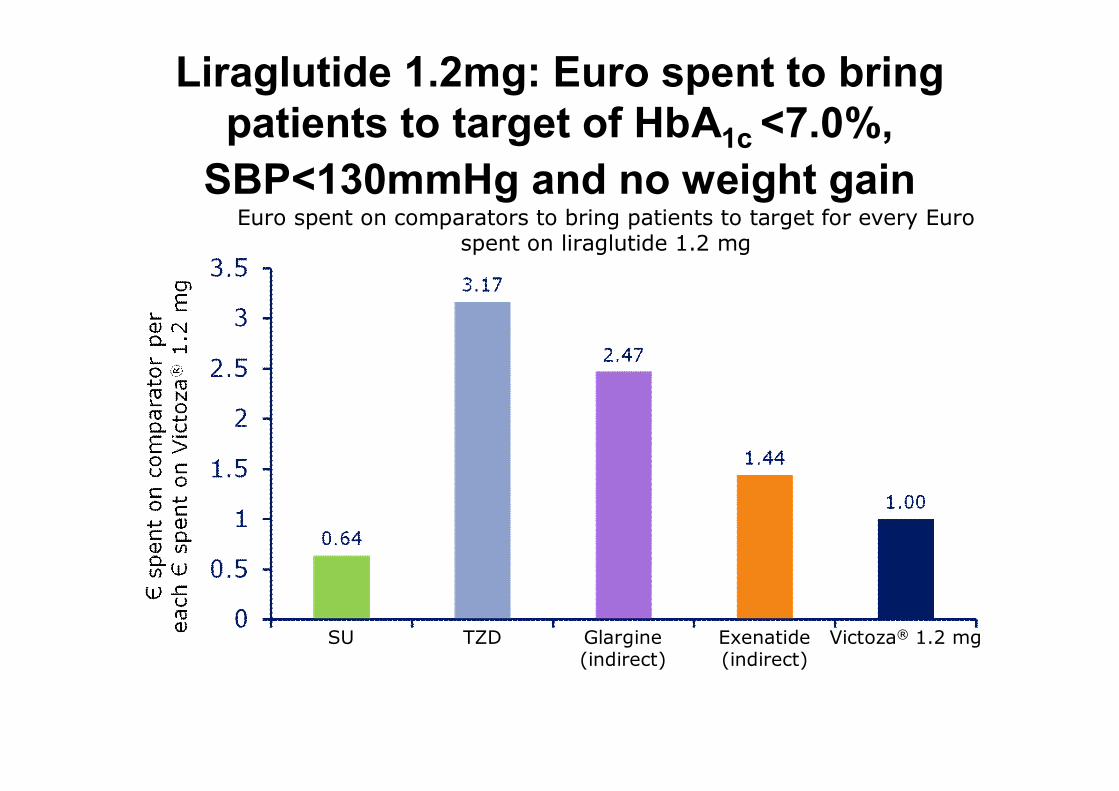
Liraglutide 1.2mg: Euro spent to bring patients to target of HbA1c <7.0%,
SBP<130mmHg and no weight gain
SU TZD Glargine(indirect)
Exenatide(indirect)
Victoza® 1.2 mg
Euro spent on comparators to bring patients to target for every Euro spent on liraglutide 1.2 mg
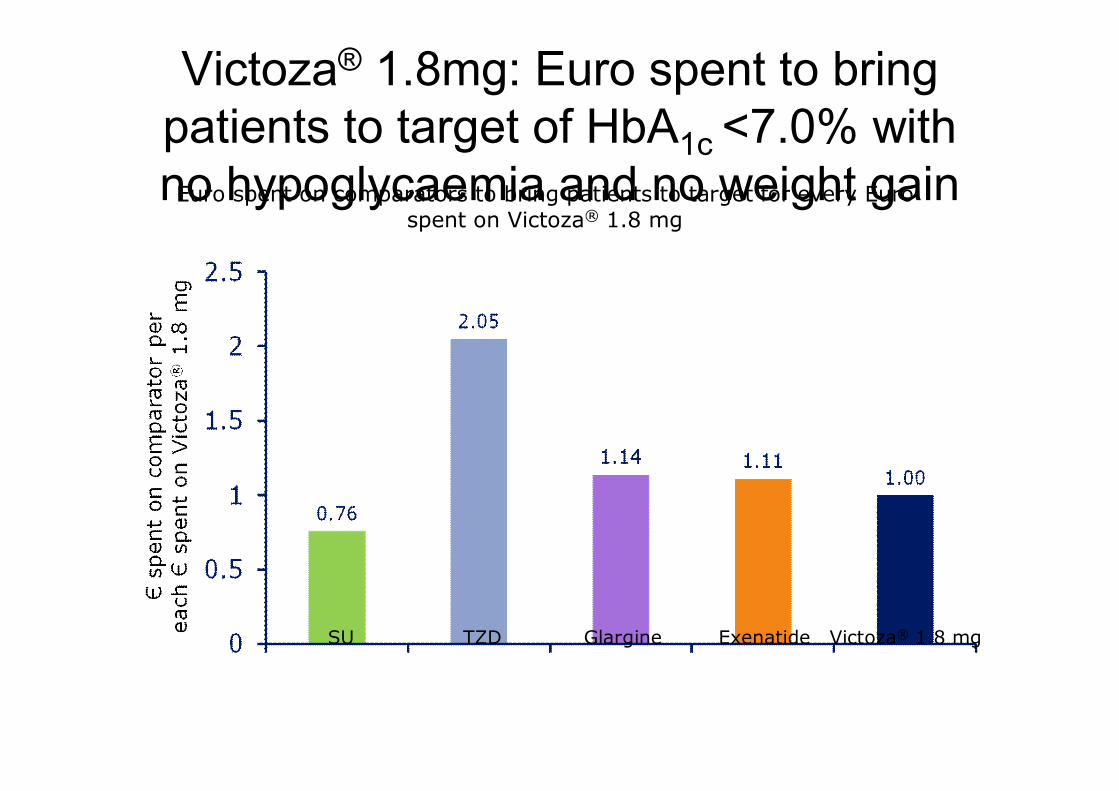
Victoza® 1.8mg: Euro spent to bring patients to target of HbA1c <7.0% with no hypoglycaemia and no weight gain
SU TZD Glargine Exenatide Victoza® 1.8 mg
Euro spent on comparators to bring patients to target for every Euro spent on Victoza® 1.8 mg
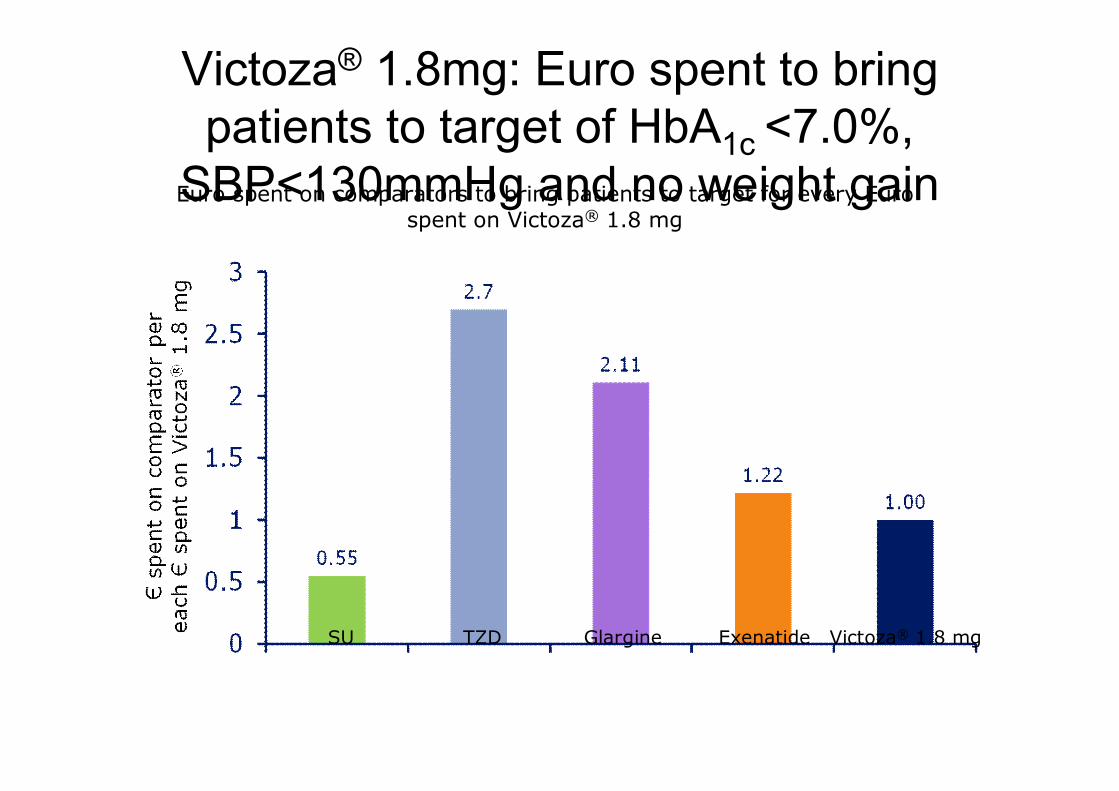
Victoza® 1.8mg: Euro spent to bring patients to target of HbA1c <7.0%,
SBP<130mmHg and no weight gain
SU TZD Glargine Exenatide Victoza® 1.8 mg
Euro spent on comparators to bring patients to target for every Euro spent on Victoza® 1.8 mg

Conclusion: Cost of Diabetes Control
• Liraglutide is clinically superior and brings more patients’
diabetes under control at a lower combined cost than
exenatide, rosiglitazone and insulin glargine (and
sitagliptin)
• Sulphonylureas bring more patients in control at lower
cost. The main driver of this is the low cost of generic
SU, not treatment success (less than 1 in 10 patients get
in control)

26 November, 2009 Thank you for your attentionThank you for your attention
Is it enough to marry a soldier to be effectively protected from diabetes mellitus and its complications?