A quiver full of growth catalysts - Edelweiss · A quiver full of growth catalysts ......
24
1 GWM Edelweiss Investment Research Trading BUY: Deepak Nitrite Ltd. A quiver full of growth catalysts New acetone-phenol plant set to revitalise business dynamics FY20 onwards To take advantage of the demand–supply gap, DEN has initiated an INR 1,400 crore acetone-phenol project in FY17. With trial runs due in Q4FY18 and seed marketing on, we anticipate commercial production to commence from Q1FY19 with nearly 65% utilisation levels during the first year of operations. While we do not expect DEN to enjoy major pricing differential or quality advantage over imports, lower logistics cost and better inventory management (leading to improvement in working capital cycle) will be sufficient incentives for import substitution. We estimate the company to generate cash flows from FY20 from this 16% EBITA business. Overall, we expect this project to revitalise DEN’s business dynamics with robust RoCE and margin accretion. Improving product mix, efficiency to drive performance products business DEN, market leader in the INR 500 crore domestic optical brightening agents (OBA) market, has also expanded its footprint internationally by entering US, Latin America, South East and Far-East Asia. Its OBA plant achieved EBITDA breakeven in Q2FY18. At peak utilisation, while OBA has the potential to generate INR 550 crore sales with 12-13% EBITDA margin, Di-amino Stilbene Di-sulphuric acid (DASDA) can generate sales of INR 130 crore with a steady state EBITDA margin of 8-9%. Moreover, development of new high-margin chemicals has spearheaded surge in DEN’s fine and specialty chemicals business. The company is focused on expanding its footprint in high-value intermediates, especially for the pharma API and personal care industry and also pursue contract manufacturing opportunities for agrochemical majors. This significantly burnishes growth prospects. Outlook and valuations: Low valuations for a strong cash flow generating business With commencement of the acetone-phenol project, DEN’s revenue is estimated to double and margins quadruple, leading to a complete change in business dynamics. Although the company’s debt-equity levels are expected to soar 2x, we estimate RoCE to expand from current 7% to 17% by FY20. This, coupled with annual cash flow of more than INR 200 crore from FY20, leaves ample scope for forward integration as well. Our earnings estimates per share for FY18/FY19/FY20 are INR 3.5/14.6/18.0, respectively. We value the company at 20x FY20E EPS of INR18 and initiate with ‘BUY’ recommendation and target price of INR360/share. Year to March FY16 FY17 FY18E FY19E FY20E Revenues (INR Cr) 1,373 1,360 1,541 3,092 3,534 Rev growth (%) 3.4 (0.9) 51.2 100.7 14.3 EBITDA (INR Cr) 164 137 151 438 517 Net Profit (INR Cr) 60 94 48 201 248 P/E (x) 54.4 39.0 81.0 19.2 15.6 EV/EBITDA (x) 23.1 32.1 34.4 12.1 9.2 RoACE (%) 12.5 7.3 5.3 14.6 17.1 RoAE (%) 14.6 15.8 6.5 24.1 24.6 CMP INR: 280 Rating: BUY Target Price INR: 360 Upside: 29% Neha Agarwal Research Analyst [email protected] Jigar Jani Research Analyst [email protected] Bloomberg: DN:IN 52-week range (INR): 286.00 / 96.90 Share in issue (cr): 14 M cap (INR cr): 3,051 Avg. Daily Vol. BSE/NSE :(‘000): 504 Promoter Holding (%) 46.59 Date: 08 th January 2017
Transcript of A quiver full of growth catalysts - Edelweiss · A quiver full of growth catalysts ......

1 GWM
Edelweiss Investment Research
Trading BUY: Deepak Nitrite Ltd.
A quiver full of growth catalysts
New acetone-phenol plant set to revitalise business dynamics FY20 onwards
To take advantage of the demand–supply gap, DEN has initiated an INR 1,400 crore
acetone-phenol project in FY17. With trial runs due in Q4FY18 and seed marketing
on, we anticipate commercial production to commence from Q1FY19 with nearly
65% utilisation levels during the first year of operations. While we do not expect DEN
to enjoy major pricing differential or quality advantage over imports, lower logistics
cost and better inventory management (leading to improvement in working capital
cycle) will be sufficient incentives for import substitution. We estimate the company
to generate cash flows from FY20 from this 16% EBITA business. Overall, we expect
this project to revitalise DEN’s business dynamics with robust RoCE and margin
accretion.
Improving product mix, efficiency to drive performance products business
DEN, market leader in the INR 500 crore domestic optical brightening agents (OBA)
market, has also expanded its footprint internationally by entering US, Latin America,
South East and Far-East Asia. Its OBA plant achieved EBITDA breakeven in Q2FY18.
At peak utilisation, while OBA has the potential to generate INR 550 crore sales with
12-13% EBITDA margin, Di-amino Stilbene Di-sulphuric acid (DASDA) can generate
sales of INR 130 crore with a steady state EBITDA margin of 8-9%. Moreover,
development of new high-margin chemicals has spearheaded surge in DEN’s fine
and specialty chemicals business. The company is focused on expanding its
footprint in high-value intermediates, especially for the pharma API and personal
care industry and also pursue contract manufacturing opportunities for
agrochemical majors. This significantly burnishes growth prospects.
Outlook and valuations: Low valuations for a strong cash flow generating business
With commencement of the acetone-phenol project, DEN’s revenue is estimated
to double and margins quadruple, leading to a complete change in business
dynamics. Although the company’s debt-equity levels are expected to soar 2x, we
estimate RoCE to expand from current 7% to 17% by FY20. This, coupled with annual
cash flow of more than INR 200 crore from FY20, leaves ample scope for forward
integration as well. Our earnings estimates per share for FY18/FY19/FY20 are INR
3.5/14.6/18.0, respectively. We value the company at 20x FY20E EPS of INR18 and
initiate with ‘BUY’ recommendation and target price of INR360/share.
Year to March FY16 FY17 FY18E FY19E FY20E
Revenues (INR Cr) 1,373 1,360 1,541 3,092 3,534
Rev growth (%) 3.4 (0.9) 51.2 100.7 14.3
EBITDA (INR Cr) 164 137 151 438 517
Net Profit (INR Cr) 60 94 48 201 248
P/E (x) 54.4 39.0 81.0 19.2 15.6
EV/EBITDA (x) 23.1 32.1 34.4 12.1 9.2
RoACE (%) 12.5 7.3 5.3 14.6 17.1
RoAE (%) 14.6 15.8 6.5 24.1 24.6
CMP INR: 280
Rating: BUY
Target Price INR: 360
Upside: 29%
Neha Agarwal
Research Analyst
Jigar Jani
Research Analyst
Bloomberg: DN:IN
52-week
range (INR): 286.00 / 96.90
Share in issue (cr): 14
M cap (INR cr): 3,051
Avg. Daily Vol.
BSE/NSE :(‘000): 504
Promoter
Holding (%) 46.59
Date: 08th January 2017

2 GWM
Deepak Nitrite is expected to have a strong start of its acetone-phenol project in FY19 with nearly 65% utilisation on the back of strong seed
marketing initiatives taken by the company during FY18 and competitive pricing to imports. Additionally, the fine and specialty chemicals and
OBA businesses are also expected to contribute substantially to the incremental profitability owing to improving product-mix towards high margin
products. At an inexpensive valuation of 13.5x FY20 earnings estimates with augmenting ROCE (expected to expand from 7% in FY17 to 17% in
FY20), DEN provides high margin of safety to investors.
Acetone-phenol project to
expand the base revenues
and profitability by multiple
times
Debt funded capex to
generate healthy returns
Free cash flows from FY20
with scope for forward
integration
FY16 FY17 FY18E FY19E FY20E
Revenue 1373 1360 1541 3092 3534
EBITDA 164 137 151 438 517
EBITDA Margin (%) 12 10 10 14 15
PAT margin (%) 4 7 3 6 7
Entry = INR 280
Free cash flow
generation to lead to
an exit multiple of
FY20E 20x
Upside of 28%
PAT CAGR of 38%
over FY17-20E
FY16 FY17 FY18E FY19E FY20E
ROACE (%) 12.5 7.3 5.3 14.6 17.1
Debt to
equity ratio 1.1 1.0 1.8 1.6 1.3
Multiple Price Target
BAL
16x 288
20x 360
3 GWM
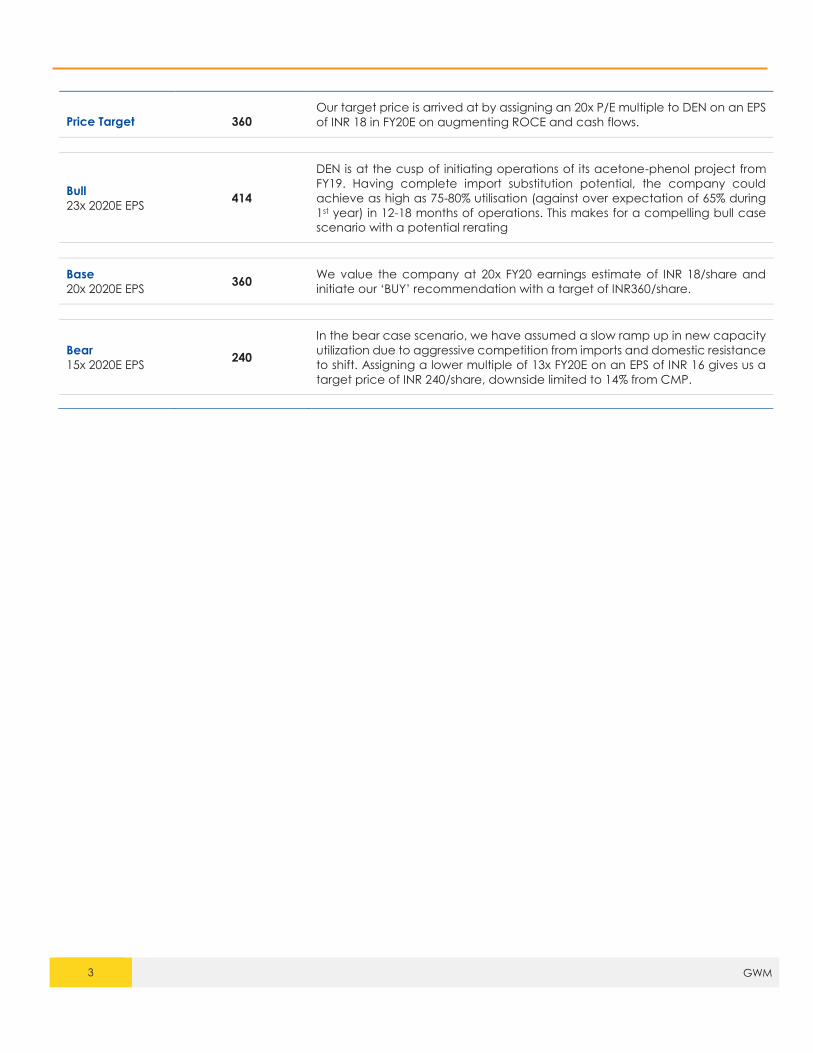
Price Target 360 Our target price is arrived at by assigning an 20x P/E multiple to DEN on an EPS
of INR 18 in FY20E on augmenting ROCE and cash flows.
Bull
23x 2020E EPS 414
DEN is at the cusp of initiating operations of its acetone-phenol project from
FY19. Having complete import substitution potential, the company could
achieve as high as 75-80% utilisation (against over expectation of 65% during
1st year) in 12-18 months of operations. This makes for a compelling bull case
scenario with a potential rerating
Base
20x 2020E EPS 360
We value the company at 20x FY20 earnings estimate of INR 18/share and
initiate our ‘BUY’ recommendation with a target of INR360/share.
Bear
15x 2020E EPS 240
In the bear case scenario, we have assumed a slow ramp up in new capacity
utilization due to aggressive competition from imports and domestic resistance
to shift. Assigning a lower multiple of 13x FY20E on an EPS of INR 16 gives us a
target price of INR 240/share, downside limited to 14% from CMP.

4 GWM
Average Daily Turnover (INR cr) Stock Price (CAGR) Relative to Sensex, CAGR (%)
3 months 6 months 1 year 1 year 3 years 5 years 10 years 1 year 3 years 5 years 10 years
10 8 5.7 79% 51% 55% 45% 64% 45% 42% 30%
Bu
sin
ess
Va
lue
Driv
ers
Nature of Industry
While the basic chemicals industry is highly commoditised with realisations and overall demand linked
to crude, among other raw materials, the specialty chemicals industry has low volume customised
production. DEN is also a prominent player in OBA (optical brightening agents) industry, which entails
highly customised demand and customer stickiness.
Opportunity Size
Opportunity size of the base business is expanding given DEN’s multi-product facilities. The company
can customise production to withstand any sub-sector headwinds. Going forward, the acetone-
phenol project that the company is venturing in to offers an INR 2,300 crore opportunity with potential
for 100% import substitution.
Capital Allocation DEN has completed INR1,400 crore green field capex for acetone phenol project with 60% debt
funding and balance via QIPs and internal accruals.
Predictability Regulatory hindrances and limited information from secondary markets preclude predictability.
Sustainability Difficult to dislodge clients due to high switching costs (quality checks and approvals required for
specialty chemicals and performance products); scope to expand globally will ensure sustainability.
Disproportionate
Future Addition of acetone-phenol to the base chemicals business will ensure future performance in terms of
return ratios will be better than the past as asset turnover and margins will improve steadily.
Business Strategy &
Planned Initiatives Current focus is on ramping up existing capacities and recent expansion.
Near-Term Visibility Strong visibility for 38% CAGR bottom line growth along with 457 bps improvement in operating
margin over FY17-20E
Long-Term Visibility To become one of the largest domestic chemicals players with market dominance in select products.

5 GWM
Focus Charts – Story in a nutshell
Successful funding of acetone-phenol project with 60% debt Commercial production to be successful with margin of
safety in product spreads
Steady ramp-up in global markets for OBA owing to
customised requirements While its basic chemicals business has nearly matured,
DEN has more to extract from the other two segments....
60% debt funded acetone-phenol project changed the
debt/equity dynamics of DEN Yet, quick ramp-up to ensure strong cash flows FY20
onwards
Source: Edelweiss Investment Research
8%
6%
6%
60%
11%
9%
Internal accurals
QIP @ INR 70.9 with 10%
dilution
Land Sale
Term debt for 13 years @
10.75% with 4.5 years
moratorium periodQIP @ INR 104 with 12%
dilution
Remaining
0
10
20
30
40
50
60
70
01
-03
-20
13
01
-09
-20
13
01
-03
-20
14
01
-09
-20
14
01
-03
-20
15
01
-09
-20
15
01
-03
-20
16
01
-09
-20
16
01
-03
-20
17
01
-09
-20
17
Spread (in INR/kg)
Feasible level for project
Linear (Spread (in INR/kg))
-1%
-3%
-6%
-2%
2%
4%
-8%
-6%
-4%
-2%
0%
2%
4%
6%
0
50
100
150
200
250
300
350
400
FY2014 FY2015 FY2016 FY2017 FY2018E FY2019E FY2020E
in IN
R c
rore
Performance Products (FWA) EBITDA margin (RHS)
OBA plant
commissio
n at Dahej
in
Q4FY2014
DASDA facility shut
down owing to
complaince issues
raised by Telangana
State Pollution Board
Lower DASDA
revenue despite
record volumes
due to globally
subduesd prices
750675 666
326 393 364
266 274 253
0
500
1000
1500
FY15 FY16 FY17
In IN
R c
ore
r
Performance Products (FWA)
Fine & Specialty Chemicals
(FSC)
Basic Chemicals (BCC)
Revenue
83 8091
64
97 85
1
-9 -14
-50
0
50
100
150
200
FY15 FY16 FY17
Profitability/EBIT
0.4 0.4
0.2
0.7
1.2
1.61.6
1.11.0
1.8
0.0
0.2
0.4
0.6
0.8
1.0
1.2
1.4
1.6
1.8
2.0
0
200
400
600
800
1000
1200
1400
1600
FY09 FY10 FY11 FY12 FY13 FY14 FY15 FY16 FY17 FY18E
(IN
R C
r)
Total Debt Net Debt Net Debt/Equity (RHS)
66
29 33 27 25
-45
70
107
42
107
-30
261
-100
-50
0
50
100
150
200
250
300
FY
09
FY
10
FY
11
FY
12
FY
13
FY
14
FY
15
FY
16
FY
17
FY
18
E
FY
19
E
FY
20
E
in IN
R c
rore
CFO

6 GWM
I. Phenol-acetone: DEN’s new plant to bridge demand-supply gap
Phenol and acetone are organic compounds derived from benzene and propylene (crude
derivatives). Both compounds are versatile in nature and used as intermediates for diverse
applications. While phenol finds application in laminates, paints, automotive lining, rubber
adhesives, pesticides, mouldings, among others, acetone is used in healthcare, paints, thinners,
inks, acrylic sheets, etc. The market for phenol and acetone is estimated to clock 8.5% and 6.0%
CAGR over FY17-20, respectively, riding robust demand from end-user industries.
Source: Edelweiss Investment Research
Globally, about 47% of phenol is used for Bisphenol-A, which is subsequently used in plastic
products. However, domestic demand is majorly concentrated in phenolic resins used as an
adhesive and binding agent in various industries. Nearly 32% of global demand for acetone
emanates for solvents which are used as thinners across industries. However, domestic demand is
spearheaded by pharmaceuticals industry, followed by paints and thinners.
Benzene
Cumene
Propylene
Phenol (100%)
Cumene Hydro Peroxide
Acetone
Phenolic Resin(74-78%)
Alkyl phenol (5-6*)
Drugs & Dyes (8-10%)
Agro-chemicals(3-5%)
Direct use
Aldol Chemicals
MMA
Laminates (30-35%)
Foundry/Mould
(28-33%)
Automobile lining
(5-6%)
Paints & Vanishes
(2-3%)
Rubber adhesives
(2-3%)
Others
(2-4%)
Surfactants & Rubber
(2-3%)
Rubber & Sulpha drugs
Pesticides
Pharma (67-70%)
Paints, Adhesives &
Thinners (8-10%)
Others (5-10%)
Paints, printing ink etc.
(2-3%)
Acrylic sheets
7.50%
9%
Past 5 year CAGR Next 5 years CAGR
7% 7%
Past 5 year CAGR Next 5 years CAGR
5% 3.50%
Past 5 year CAGR Next 5 years CAGR
9% 7.50%
Past 5 year CAGR Next 5 years CAGR
7.0% 7%
Past 5 year CAGR Next 5 years CAGR
1.5% 5%
Past 5 year CAGR Next 5 years CAGR
1.5% 0.50%
Past 5 year CAGR Next 5 years CAGR
2.5% 2%
Past 5 year CAGR Next 5 years CAGR
4.0% 2.50%
Past 5 year CAGR Next 5 years CAGR
Past 5 year CAGR Next 5 years CAGR
1.0unit
0.612unit
0.47unit
1.31unit
0.87unit

7 GWM
a. While phenol and acetone consumption has posted 7-year CAGR of 9% and 3%,
respectively, domestic supply has been declining consistently
Source: Edelweiss Investment Research
Currently, India imports phenol and acetone—over 80% requirement imported. Taiwan, Korea,
Thailand, Singapore and the US comprise major exporting countries with Asian countries
contributing lion’s share due to significant capacity additions. There are only two entities
manufacturing these products in India—Hindustan Organics (HOCL) and SI Group (erstwhile
Schenectady Herdiliia). Technology obsolescence, working capital constraints and low
capacities have rendered it uneconomical for domestic players to match import landed costs.
This has led to significant gap between domestic and landed costs, resulting in utilisation levels of
domestic players like SI Group and HOCL plummeting from 70-75% in FY09 to nearly 50% in FY17.
b. DEN to bridge domestic supply gap; to generate 23% project RoCE with economies of scale
To take advantage of this demand-supply gap, DEN is setting up an acetone-phenol plant in India
with 200,000 MTPA phenol and 120,000 MTPA acetone capacities under its wholly-owned
subsidiary Deepak Phenolics in PCPIR (Petroleum, Chemicals and Petrochemicals Investment
Region), Dahej. The company is anticipated to plug domestic players’ efficiency gaps via
economies of scale. Presence in PCPIR will further enhance operational efficiencies of the project
due to waste treatment, transportation and power support.
While we do not expect DEN to enjoy major pricing differential or quality advantage over imports,
lower logistics cost and better inventory management (leading to improvement in working capital
cycle) will be sufficient incentives for import substitution.
Anti-dumping duty on phenol to augment phenol project’s IRR
Year Event
March, 2012 Anti-dumping from USA, Taiwan and Korea revoked
August, 2014 Gol imposed duty on Korea and USA again
July, 2015 Anti-dumping duty imposed on South Africa
93 80 123 147 173 214 200249 282 294
0
50
100
150
200
250
300
350
FY
09
FY
10
FY
11
FY
12
FY
13
FY
14
FY
15
FY
16
FY
17
FY
18
E
in '000 M
T/a
nn
um
Phenol
Domestic Imports
68 80 78 10196
117 127138 136
157
0
20
40
60
80
100
120
140
160
180
FY09 FY10 FY11 FY12 FY13 FY14 FY15 FY16 FY17 FY18E
in '000 M
T/a
nn
um
Acetone
Domestic Imports

8 GWM
c. With its project nearing completion and funding requirements met up to 90% of estimations;
DNL is all set to take the plunge
DEN is spending an estimated INR 1,400 crore for the acetone-phenol project funded via a blend
of debt, equity and internal accruals. Post sourcing nearly INR 1,250 crore funds in the past 2 years
from multiple channels, the company will require nearly INR 150 crore of additional funding for
project completion. We expect the same to be sourced through another round of Qualified
Institutional Placement (QIP).
Source: Edelweiss Investment Research
Easy feedstock availability from domestic sourcing…. ….with spreads at significantly above feasibility levels
Source: Edelweiss Investment Research
DEN’s feedstock requirement can be met locally or through imports from China, US or Western
Europe. Further, the input-output cost and conversion ratios give a 5-year average spread of INR
42/kg or USD 650/MT. Post consideration of the cost dynamics disclosed by the company, we
estimate the project to be feasible up to a spread of INR 18/kg or USD 275/MT entailing overall low
risk profile of the project.
8%
6%
6%
60%
11%
9%Internal accurals
QIP @ INR 70.9 with 10% dilution
Land Sale
Term debt for 13 years @ 10.75% with
4.5 years moratorium period
QIP @ INR 104 with 12% dilution
Remaining
0
1000
2000
3000
4000
5000
Benzene Propylene
in '000 M
TPA
Reliance IOCL Haldia Petrochem BPCL
Required by DNL at peak
16% 2%
0
10
20
30
40
50
60
70
01
-03
-20
13
01
-09
-20
13
01
-03
-20
14
01
-09
-20
14
01
-03
-20
15
01
-09
-20
15
01
-03
-20
16
01
-09
-20
16
01
-03
-20
17
01
-09
-20
17
Spread (in INR/kg) Feasible level for project
Linear (Spread (in INR/kg))

9 GWM
d. Imports spread across countries to reduce risk of aggressive price competition
Top 5 countries form 80% of phenol imports…. ……export to India is significant only for China and Thailand
Source: Edelweiss Investment Research
Top 4 countries form 90% of acetone imports….. ……with export to India being significant for only Thailand
Source: Edelweiss Investment Research
Exports to India are highly significant for China and Thailand, constituting over 90% and 50% of
their respective total acetone-phenol exports volumes. However, import prices have remained at
par with global prices despite the countries having surplus capacities.
Going forward, with DEN putting up capacities equivalent to 80-90% of acetone-phenol imports,
imports from these countries are likely to face a threat, triggering a temporary price war in the
domestic market. However, we estimate the same to stabilise over 12-18 months with overall
domestic demand also expanding by ~7% annually.
Rep. of
Korea
21%
China
20%
USA
17%
Thailand
15%
Singapore
8%
South
Africa
7%
Other
Asia, nes
6%
Brazil
4%
Others
2%
- 50,000 1,00,000 1,50,000 2,00,000 2,50,000 3,00,000 3,50,000 4,00,000 4,50,000
China
Rep. of Korea
Singapore
Thailand
USA
India ROW
Thailand
30%
Other
Asia, nes
28%
Rep. of
Korea
23%
Singapore
8%
Russian
Federation
6%
China
5%
0 50000 100000 150000 200000 250000 300000
Rep. of Korea
Other Asia, nes
Russian Federation
Singapore
Thailand
India ROW

10 GWM
Excerpts from channel checks
‘Can buy phenol from DEN, but not fully as supply concentration could be risky.’; very large
domestic importer/supplier
‘We have been approached by DEN and have given our consent to participate.’; very large
domestic importer/supplier
‘DEN has strong brand name and it will not be surprising if they replace up to 80% of imports’;
one of the prominent domestic distributor s
‘DEN has strong brand recognition and it is win-win deal for traders as well considering their
working capital will reduce. 60-70% of importers/traders can be expected to come on board’;
one of the prominent domestic distributor s
Project financial estimates
(in INR crore) FY19 FY20 FY21
Phenol Capacity (MT) 200000 200000 200000
Utilization Rate (%) 65% 80% 90%
Phenol Produced (MT) 1,30,000 1,60,000 1,80,000
Acetone Produced (MT) 79,560 97,920 1,10,160
Sales 1452 1787 2010
RM Costs 908 1117 1257
Power cost 155 191 215
as % 11% 11% 11%
Fuel Cost 29 36 40
as % 2% 2% 2%
Gross Profit 359 442 498
Gross Margin (%) 24.80% 24.80% 24.80%
Other Expenses 123 145 160
Other Expenses (%) 8% 8% 8%
EBITDA 236 297 337
EBITDA margins 16.30% 16.60% 16.80%
Depreciation 50 50 50
EBIT 186 247 287
Interest 100
Interest Rate 11%
PBT 186 247 187
Source: Edelweiss Investment Research

11 GWM
II. Base business: Changing product mix to gain stability and growth
a. Performance products: Taking the front seat in optical brightening agents
DEN’s performance products (PP) division majorly consists of two products, viz., optical brightening
agents (OBA) and Di-amino Stilbene Di-sulphuric acid (DASDA). The company is the only fully
integrated manufacturer of OBA in the world with vertical integration from toluene to para nitro
toluene (PNT) and further into DASDA and OBA.
OBA Manufacturing Value Chain
DASDA: In 2007, DEN acquired Hyderabad-based Vasant Chemicals’ DASDA division for INR 50
crore. DASDA is the basic raw material used for manufacturing OBA. Currently, DEN sources its
entire DASDA requirement for its OBA plant in Dahej from the Hyderabad unit. After meeting its
captive requirements, the balance is sold commercially in domestic and international markets,
thereby enhancing cost economics of its OBA plant.
OBA: In Q4FY14, DEN commissioned the OBA plant at Dahej (Gujarat) by investing INR 280 crore,
marking the company's entry in the performance chemicals segment. OBA is a brightener
commonly used in industries like paper (65%), detergent (20%) and textiles (15%). Depending on
the customer's need, the active chemical of OBA is blended with other formulations, either in liquid
or solid form. In the OBA space, DEN faces competition from Archroma and BASF in the domestic
market and TFM, Transfar, Archroma & 3V in global markets.
Robust growth potential with backward integration-led cost advantage
Complete backward integration renders DEN immune to the price volatility in intermediates like
PNT and DASDA. Additionally, it enables the company to customise raw materials at each stage
as per customer requirements (liquid, solid or powdered state). Entire requirement of DASDA to
manufacture OBA is met internally, while the balance output is sold in the open market to other
OBA manufacturers. The company plans its DASDA output based on internal needs and external
demand.
Domestic market leader expanding global footprint
DEN is already a market leader in the INR 500 crore domestic OBA market with nearly 75% share.
The company has also expanded its footprint internationally by entering US, Latin America, South
East and Far-East Asia. By FY17, it has 100 plus customers (domestic and internationally) spread
equally across paper, detergents and textile segments.
Nandesari
Nitrotoluene
Nandesari
PNT
Hyderabad
DASDA
Dahej
OBA
12 GWM
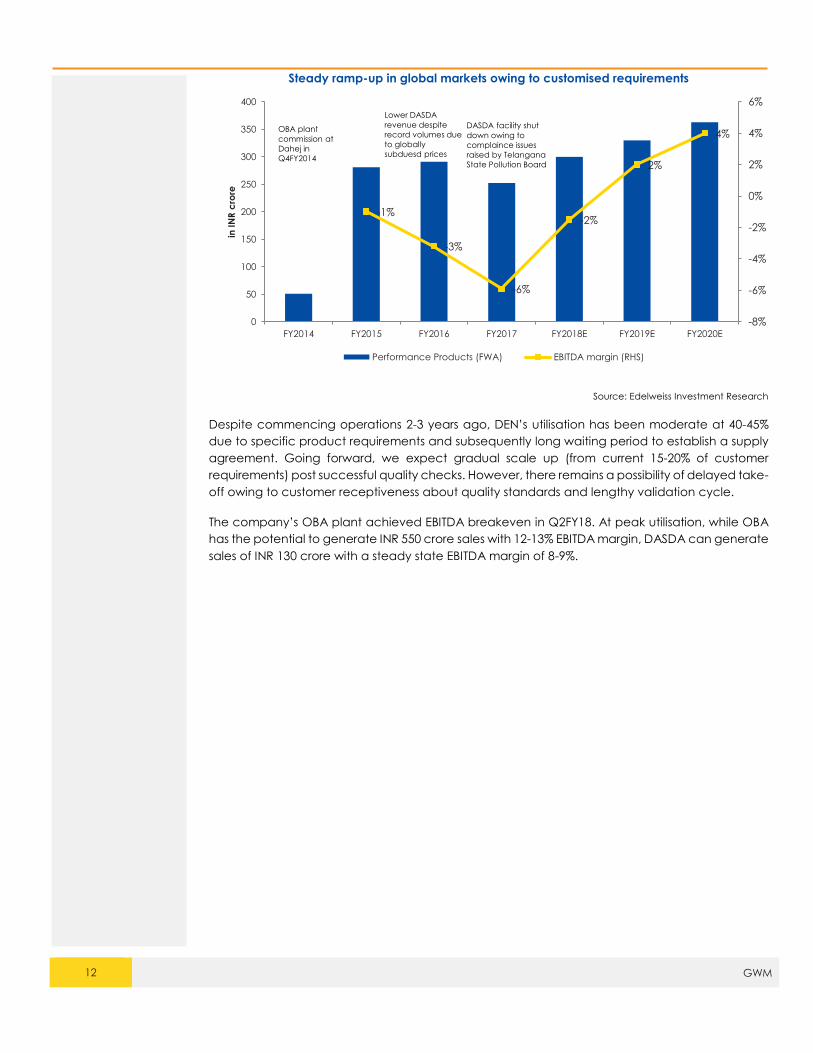
Steady ramp-up in global markets owing to customised requirements
Source: Edelweiss Investment Research
Despite commencing operations 2-3 years ago, DEN’s utilisation has been moderate at 40-45%
due to specific product requirements and subsequently long waiting period to establish a supply
agreement. Going forward, we expect gradual scale up (from current 15-20% of customer
requirements) post successful quality checks. However, there remains a possibility of delayed take-
off owing to customer receptiveness about quality standards and lengthy validation cycle.
The company’s OBA plant achieved EBITDA breakeven in Q2FY18. At peak utilisation, while OBA
has the potential to generate INR 550 crore sales with 12-13% EBITDA margin, DASDA can generate
sales of INR 130 crore with a steady state EBITDA margin of 8-9%.
-1%
-3%
-6%
-2%
2%
4%
-8%
-6%
-4%
-2%
0%
2%
4%
6%
0
50
100
150
200
250
300
350
400
FY2014 FY2015 FY2016 FY2017 FY2018E FY2019E FY2020E
in IN
R c
rore
Performance Products (FWA) EBITDA margin (RHS)
OBA plant
commission at
Dahej in
Q4FY2014
DASDA facility shut
down owing to
complaince issues
raised by Telangana
State Pollution Board
Lower DASDA
revenue despite
record volumes due
to globally
subduesd prices

13 GWM
b. FSC segment eyeing pharma intermediates entry
The fine and speciality chemicals segment includes niche products manufactured at relatively
lower volumes and are customised to specific customer requirements. The segment produces
xylidines, cumidines, oximes, nitro oxylene, etc., which find application as ingredients in
colourants, pigments, pharmaceutical intermediaries and agrochemicals.
Development of new high-margin chemicals led to strong surge in the company’s fine and
specialty chemicals business. Further, DEN is focused on expanding its footprint in high-value
intermediates, especially for the pharma API and personal care industry and also pursue
contract manufacturing opportunities for agrochemical majors.
Source: Edelweiss Investment Research
0%
5%
10%
15%
20%
25%
30%
0
100
200
300
400
500
600
FY12 FY13 FY14 FY15 FY16 FY17 FY18E FY19E FY20E
in IN
R c
rore
Revenues EBIT Margin
Supply disruption due to fire
accident at Roha facility in

14 GWM
c. Basic chemicals to sustain moderate growth rate
DEN’s basic chemicals division is characterised by high volume and moderate margin products
across organic and inorganic chemicals.
Organic chemicals produced include nitro toluene and ortho toluene which are used to
manufacture intermediates for colourants, rubber production, pharmaceuticals, explosives,
dyes & agrochemicals and fuel additives used in refineries.
Inorganic chemicals produced include sodium nitrites & sodium nitrates with sodium nitrite
used in colourants, pharma, electroplating & rubber chemicals and sodium nitrate used in
industrial explosives, glass industry & heat-treating chemicals.
Brownfield expansion, multi-product capacity buoy margin despite down cycles
The basic chemicals segment not only entails limited margin, but is also exposed to crude price
volatility, leading to unpredictable revenue. Margins are lower as chemicals are made to
standard specifications and not unique as per customer preferences. Segment sales have
remained range-bound since FY13, while EBIT has expanded 67% post brown field expansion in its
Nandesari plant in FY14. With 90% utilisation levels, future growth in basic chemicals is expected to
be led by improving product-mix and efficiency.
Source: Edelweiss Investment Research
0%
5%
10%
15%
20%
400
500
600
700
800
900
FY13 FY14 FY15 FY16 FY17 FY18E FY19E FY20E
in IN
R c
rore
Revenues EBIT Margin (RHS)
Expansion at Nandesari plant

15 GWM
III. Financial Analysis
a. While its basic chemicals business has nearly matured, DEN has more to extract from the
other two segments....
Source: Edelweiss Investment Research
...Fine & specialty chemicals and performance products bsuinesses have room for growth at
current asset base
Source: Edelweiss Investment Research
750675 666
326 393364
266 274253
0
200
400
600
800
1000
1200
1400
1600
FY15 FY16 FY17
In IN
R c
ore
r
Basic Chemicals (BCC) Fine & Specialty Chemicals (FSC)
Performance Products (FWA)
Segmental revenues
83 80
91
64
97 85
1
-9-14
-50
0
50
100
150
200
FY15 FY16 FY17
Segmental profitability/EBIT
0.0
0.5
1.0
1.5
2.0
2.5
0
200
400
600
800
1000
1200
FY13 FY14 FY15 FY16 FY17
Ass
et
turn
ove
r
Gro
ss A
sse
ts (
in IN
R c
r)
Basic Chemicals Fine & Specialty Chemicals (FSC)
Performance Products (FWA) Basic Chemicals
Fine & Specialty Chemicals (FSC) Performance Products (FWA)

16 GWM
b. 60% debt funded acetone-phenol project changed the debt/equity dynamics of DEN
Source: Edelweiss Investment Research
DEN has raised INR 840 crore via debt to fund its INR 1,400 crore acetone-phenol project in FY18.
As a result, the company’s net debt-equity ratio jumped to 1.8x with repayment expected to
commence from FY20 on generation of surplus cash flows.
Source: Edelweiss Investment Research
0.4 0.4
0.2
0.7
1.2
1.61.6
1.11.0
1.8
0.0
0.2
0.4
0.6
0.8
1.0
1.2
1.4
1.6
1.8
2.0
0
200
400
600
800
1000
1200
1400
1600
FY09 FY10 FY11 FY12 FY13 FY14 FY15 FY16 FY17 FY18E
(IN
R C
r)
Total Debt Net Debt Net Debt/Equity (RHS)
66
29 33 27 25
-45
70
107
42
107
-30
261
-100
-50
0
50
100
150
200
250
300
FY09 FY10 FY11 FY12 FY13 FY14 FY15 FY16 FY17 FY18E FY19E FY20E
in IN
R c
rore
CFO

17 GWM
c. Working capital cycle to strech with the start of acetone-phenol project in FY19
Source: Edelweiss Investment Research
While FY17 debtor days worsened on account of higher credit extended in the base business, it
was offset by larger working-capital borrowing from banks. Going forward, we expect the working
capital cycle to remain streched on account of the acetone-phenol project.
d. Increasing contribution of profitability to ROE
Source: Edelweiss Investment Research
With changing product-mix in favour of high-margin products, there has been higher contribution
of profitability to RoE. Acetone-phenol, being a margin accretive business right from
commencement of operations, is expected to add to the phenomenon.
-100
-80
-60
-40
-20
0
20
40
60
80
100
120
FY09 FY10 FY11 FY12 FY13 FY14 FY15 FY16 FY17 FY18E FY19E FY20E
Debtor Days Inventory Days Payable Days Cash Conversion Cycle
0%
10%
20%
30%
40%
50%
60%
70%
80%
90%
100%
FY09 FY10 FY11 FY12 FY13 FY14 FY15 FY16 FY17 FY18E FY19E FY20E
Sales/Assets Asset/Equity Net Profit Margin

18 GWM
IV. Valuations
In our view, DEN is set to reap benefits of capacities in the acetone-phenol project as well as
performance products business. Ergo, we estimate spectacular revenue and margin spurt with
higher utilisation levels and business expansion.
Our earnings estimates per share for FY18/FY19/FY20 are INR 3.5/14.6/18.0, respectively. We value
the company at 20x FY20E earnings of INR18/share and initiate with ‘BUY’ recommendation and
target price of INR360/share.
Source: Edelweiss Investment Research
0
50
100
150
200
250
Mar-06 Mar-07 Mar-08 Mar-09 Mar-10 Mar-11 Mar-12 Mar-13 Mar-14 Mar-15 Mar-16 Mar-17
P/E
mu
ltip
leSteep rise in trailing P/E as acetone-phenol project comes near completion
5x 8x 10x 13x 15x Deepak Nitrite

19 GWM
Risks and concerns
Acetone-phenol spread volatility: The profitability in the acetone-phenol business is closely
linked to the spread between global prices of acetone-phenol and benzene propylene.
Hence, any major fluctuation in the spreads may impact our estimates from the business.
Additionally, this is spot business with negligible contract-based hedge.
Delay in base-business take off: We expect the base business of DEN to be also contributing
positively to incremental profitability. However, various factors such as order book flow and
improving product mix are key drivers here. Any delay in order flow or slower ramp-up in new
product-mix xould be detrimental to growth.
Import competition: Acetone-phenol project, being driven by import substiution demand, may
face price competition from major exporting countries such as China and Thailand. Any
aggressive competition can temporarily impact our near-term estimates.

20 GWM
Details of subsidiaries and associates
Deepak Phenolics Ltd.
● 100% subsidiary
● Dedicated to acetone-phenol
project
● Commercial production to
commence from FY19
Deepak Nitrite Corporation, Inc.
● 100% subsidiary
● Caters to the marketing
requirements in the US and looks out
for expansion potential
Deepak Gulf LLC
● 49% shareholding
● No commercial operations
undertaken yet

21 GWM
Financials
Income statement (Consolidated) (INR crs)
Year to March FY16 FY17 FY18E FY19E FY20E
Income from operations 1,373 1,360 1541 3092 3534
Direct costs 944 948 1094 2236 2558
Employee costs 119 126 142 167 178
Other expenses 266 275 296 418 459
Total operating expenses 1,209 1,224 1390 2654 3017
EBITDA 164 137 151 438 517
Depreciation and amortisation 40 43 48 96 97
EBIT 124 94 102 341 419
Interest expenses 40 37 42 64 64
Profit before tax 86 133 71 299 370
Provision for tax 26 39 23 99 122
Core profit 60 94 48 201 248
Extraordinary items 0 0 0 0 0
Profit after tax 60 94 48 201 248
Adjusted net profit 60 94 48 201 248
Equity shares outstanding (mn) 11.6 13.1 14 14 14
EPS (INR) basic 5.2 7.2 3 15 18
Diluted shares (Cr) 11.6 13.1 14 14 14
EPS (INR) fully diluted 5.2 7.2 3 15 18
Div idend per share 1.2 0.0 1 3 4
Div idend payout (%) 23.3 0.0 22 22 22
Common size metrics- as % of net revenues (INR crs)
Year to March FY16 FY17 FY18E FY19E FY20E
Operating expenses 88.1 90.0 90.2 85.8 85.4
Depreciation 2.9 3.1 3.1 3.1 2.8
Interest expenditure 2.9 2.7 2.7 2.1 1.8
EBITDA margins 11.9 10.0 9.8 14.2 14.6
Net profit margins 4.4 6.9 3.09 6.49 7.01
Growth metrics (%)
Year to March FY16 FY17 FY18E FY19E FY20E
Revenues 3.4 (0.9) 51.2 100.7 14.3
EBITDA 19.4 (16.6) 108.6 190.7 18.0
PBT 31.9 54.2 35.3 321.1 23.5
Net profit 17.5 56.8 26.0 321.1 23.5
EPS 5.6 39.5 (4.5) 321.1 23.5
Ratios
Year to March FY16 FY17 FY18E FY19E FY20E
ROAE (%) 14.6 15.8 6.5 24.1 24.6
ROACE (%) 12.5 7.3 5.3 14.6 17.1
Debtors (days) 83 97 95 100 100
Current ratio 2.2 2.2 2.6 2.2 2.9
Debt/Equity 1.1 1.0 2.0 1.6 1.3
Inventory (days) 33 37 38 40 40
Payable (days) 55 71 70 70 70
Cash conversion cycle (days) 61 63 63 70 70
Debt/EBITDA 3.2 5.4 9.9 3.4 2.9
Adjusted debt/Equity 1.1 1.0 1.8 1.6 0.8
Valuation parameters
Year to March FY16 FY17 FY18E FY19E FY20E
Diluted EPS (INR) 5.2 7.2 3.5 14.6 18.0
Y-o-Y growth (%) 5.6 39.5 (4.5) 321.1 23.5
CEPS (INR) 9 10 7 22 25
Diluted P/E (x) 54.4 39.0 81.0 19.2 15.6
Price/BV(x) 6.9 5.1 5.1 4.2 3.5
EV/Sales (x) 2.8 3.2 3.4 1.7 1.4
EV/EBITDA (x) 23.1 32.1 34.4 12.1 9.2
Diluted shares O/S 11.6 13.1 13.8 13.8 13.8
Basic EPS 5.2 7.2 3.5 14.6 18.0
Basic PE (x) 54.4 39.0 81.0 19.2 15.6
Div idend yield (%) 0.4 0.0 0.3 1.2 1.5
Balance sheet (INR cr)
As on 31st March FY16 FY17 FY18E FY19E FY20E
Equity share capital 23 26 28 28 28
Preference Share Capital 0 0 0 0 0
Reserves & surplus 450 691 728 884 1,077
Shareholders funds 473 717 756 912 1,105
Secured loans 465 654 1,305 1,305 1,305
Unsecured loans 64 89 178 178 178
Borrowings 529 744 1,484 1,484 1,484
Minority interest 0 0 0 0 0
Sources of funds 1,002 1,461 2,239 2,396 2,589
Gross block 899 918 1,918 1,938 1,958
Depreciation 301 328 376 472 570
Net block 598 591 1,542 1,466 1,388
Capital work in progress 36 353 0 0 0
Total fixed assets 634 944 1,542 1,466 1,388
Unrealised profit 0 0 0 0 0
Investments 87 117 117 117 117
Inventories 123 138 160 339 387
Sundry debtors 313 360 401 847 968
Cash and equivalents 6 14 159 65 570
Loans and advances 57 68 68 68 68
Other current assets 0 0 0 0 0
Total current assets 499 580 788 1,319 1,993
Sundry creditors and others 208 264 296 593 678
Provisions 22 6 6 6 7
Total CL & provisions 230 269 302 599 684
Net current assets 269 311 487 719 1,309
Net Deferred tax -57 -66 -66 -66 -66
Misc expenditure 73 159 159 159 159
Uses of funds 1,006 1,465 2,239 2,396 2,907
Book value per share (INR) 41 55 55 66 80
Cash flow statement (INR cr)
Year to March FY16 FY17 FY18E FY19E FY20E
Net profit 60 94 48 201 248
Add: Depreciation 40 43 48 96 97
Add: Misc expenses written off -27 -87 0 0 0
Add: Deferred tax 10 9 42 0 0
Gross cash flow 83 59 138 297 345
Less: Changes in W. C. -23 17 31 327 84
Operating cash flow 107 42 107 -30 261
Less: Capex 76 353 651 20 20
Free cash flow 30 -311 -544 -50 241

22 GWM
Edelweiss Broking Limited, 1st Floor, Tower 3, Wing B, Kohinoor City Mall, Kohinoor City, Kirol Road, Kurla(W)
Board: (91-22) 4272 2200
Vinay Khattar
Head Research
Rating Expected to
Buy appreciate more than 15% over a 12-month period
Hold appreciate between 5-15% over a 12-month period
Reduce Return below 5% over a 12-month period
0
100
200
300
400
500
600
700
800
900
Ja
n-1
4
Ap
r-14
Ju
l-14
Oc
t-14
Ja
n-1
5
Ap
r-15
Ju
l-15
Oc
t-15
Ja
n-1
6
Ap
r-16
Ju
l-16
Oc
t-16
Ja
n-1
7
Ap
r-17
Ju
l-17
Oc
t-17
Ja
n-1
8
(In
de
xe
d)
Deepak Nitrate Sensex

Disclaimer
23 GWM
Edelweiss Broking Limited (“EBL” or “Research Entity”) is regulated by the Securities and Exchange Board of India (“SEBI”) and is licensed to carry on the business of broking, depository
services and related activities. The business of EBL and its Associates (list available on www.edelweissfin.com) are organized around five broad business groups – Credit including Housing
and SME Finance, Commodities, Financial Markets, Asset Management and Life Insurance.
Broking services offered by Edelweiss Broking Limited under SEBI Registration No.: INZ000005231; Name of the Compliance Officer: Mr. Brijmohan Bohra, Email ID:
[email protected] Corporate Office: Edelweiss House, Off CST Road, Kalina, Mumbai - 400098; Tel. 18001023335/022-42722200/022-40094279
This Report has been prepared by Edelweiss Broking Limited in the capacity of a Research Analyst having SEBI Registration No.INH000000172 and distributed as per SEBI (Research Analysts)
Regulations 2014. This report does not constitute an offer or solicitation for the purchase or sale of any financial instrument or as an official confirmation of any transaction. The information
contained herein is from publicly available data or other sources believed to be reliable. This report is provided for assistance only and is not intended to be and must not alone be taken
as the basis for an investment decision. The user assumes the entire risk of any use made of this information. Each recipient of this report should make such investigation as it deems necessary
to arrive at an independent evaluation of an investment in the securities of companies referred to in this document (including the merits and risks involved), and should consult his own
advisors to determine the merits and risks of such investment. The investment discussed or views expressed may not be suitable for all investors.
This information is strictly confidential and is being furnished to you solely for your information. This information should not be reproduced or redistributed or passed on directly or indirectly
in any form to any other person or published, copied, in whole or in part, for any purpose. This report is not directed or intended for distribution to, or use by, any person or entity who is a
citizen or resident of or located in any locality, state, country or other jurisdiction, where such distribution, publication, availability or use would be contrary to law, regulation or which would
subject EBL and associates / group companies to any registration or licensing requirements within such jurisdiction. The distribution of this report in certain jurisdictions may be restricted by
law, and persons in whose possession this report comes, should observe, any such restrictions. The information given in this report is as of the date of this report and there can be no
assurance that future results or events will be consistent with this information. This information is subject to change without any prior notice. EBL reserves the right to make modifications and
alterations to this statement as may be required from time to time. EBL or any of its associates / group companies shall not be in any way responsible for any loss or damage that may arise
to any person from any inadvertent error in the information contained in this report. EBL is committed to providing independent and transparent recommendation to its clients. Neither EBL
nor any of its associates, group companies, directors, employees, agents or representatives shall be liable for any damages whether direct, indirect, special or consequential including loss
of revenue or lost profits that may arise from or in connection with the use of the information. Our proprietary trading and investment businesses may make investment decisions that are
inconsistent with the recommendations expressed herein. Past performance is not necessarily a guide to future performance .The disclosures of interest statements incorporated in this
report are provided solely to enhance the transparency and should not be treated as endorsement of the views expressed in the report. The information provided in these reports remains,
unless otherwise stated, the copyright of EBL. All layout, design, original artwork, concepts and other Intellectual Properties, remains the property and copyright of EBL and may not be
used in any form or for any purpose whatsoever by any party without the express written permission of the copyright holders.
EBL shall not be liable for any delay or any other interruption which may occur in presenting the data due to any reason including network (Internet) reasons or snags in the system, break
down of the system or any other equipment, server breakdown, maintenance shutdown, breakdown of communication services or inability of the EBL to present the data. In no event shall
EBL be liable for any damages, including without limitation direct or indirect, special, incidental, or consequential damages, losses or expenses arising in connection with the data presented
by the EBL through this report.
We offer our research services to clients as well as our prospects. Though this report is disseminated to all the customers simultaneously, not all customers may receive this report at the
same time. We will not treat recipients as customers by virtue of their receiving this report.
EBL and its associates, officer, directors, and employees, research analyst (including relatives) worldwide may: (a) from time to time, have long or short positions in, and buy or sell the
securities thereof, of company(ies), mentioned herein or (b) be engaged in any other transaction involving such securities and earn brokerage or other compensation or act as a market
maker in the financial instruments of the subject company/company(ies) discussed herein or act as advisor or lender/borrower to such company(ies) or have other potential/material
conflict of interest with respect to any recommendation and related information and opinions at the time of publication of research report or at the time of public appearance. EBL may
have proprietary long/short position in the above mentioned scrip(s) and therefore should be considered as interested. The views provided herein are general in nature and do not consider
risk appetite or investment objective of any particular investor; readers are requested to take independent professional advice before investing. This should not be construed as invitation
or solicitation to do business with EBL.
EBL or its associates may have received compensation from the subject company in the past 12 months. EBL or its associates may have managed or co-managed public offering of
securities for the subject company in the past 12 months. EBL or its associates may have received compensation for investment banking or merchant banking or brokerage services from
the subject company in the past 12 months. EBL or its associates may have received any compensation for products or services other than investment banking or merchant banking or
brokerage services from the subject company in the past 12 months. EBL or its associates have not received any compensation or other benefits from the Subject Company or third party
in connection with the research report. Research analyst or his/her relative or EBL’s associates may have financial interest in the subject company. EBL, its associates, research analyst and
his/her relative may have other potential/material conflict of interest with respect to any recommendation and related information and opinions at the time of publication of research
report or at the time of public appearance.
Participants in foreign exchange transactions may incur risks arising from several factors, including the following: ( i) exchange rates can be volatile and are subject to large fluctuations; (
ii) the value of currencies may be affected by numerous market factors, including world and national economic, political and regulatory events, events in equity and debt markets and
changes in interest rates; and (iii) currencies may be subject to devaluation or government imposed exchange controls which could affect the value of the currency. Investors in securities
such as ADRs and Currency Derivatives, whose values are affected by the currency of an underlying security, effectively assume currency risk.
Research analyst has served as an officer, director or employee of subject Company: No
EBL has financial interest in the subject companies: No
EBL’s Associates may have actual / beneficial ownership of 1% or more securities of the subject company at the end of the month immediately preceding the date of publication of
research report.
Research analyst or his/her relative has actual/beneficial ownership of 1% or more securities of the subject company at the end of the month immediately preceding the date of publication
of research report: No
EBL has actual/beneficial ownership of 1% or more securities of the subject company at the end of the month immediately preceding the date of publication of research report: No
Subject company may have been client during twelve months preceding the date of distribution of the research report.
There were no instances of non-compliance by EBL on any matter related to the capital markets, resulting in significant and material disciplinary action during the last three years.
A graph of daily closing prices of the securities is also available at www.nseindia.com
Analyst Certification:
The analyst for this report certifies that all of the views expressed in this report accurately reflect his or her personal views about the subject company or companies and its or their securities,
and no part of his or her compensation was, is or will be, directly or indirectly related to specific recommendations or views expressed in this report.
Additional Disclaimer for U.S. Persons
Edelweiss is not a registered broker – dealer under the U.S. Securities Exchange Act of 1934, as amended (the“1934 act”) and under applicable state laws in the United States. In addition
Edelweiss is not a registered investment adviser under the U.S. Investment Advisers Act of 1940, as amended (the "Advisers Act" and together with the 1934 Act, the "Acts), and under

Disclaimer
24 GWM
applicable state laws in the United States. Accordingly, in the absence of specific exemption under the Acts, any brokerage and investment services provided by Edelweiss, including the
products and services described herein are not available to or intended for U.S. persons.
This report does not constitute an offer or invitation to purchase or subscribe for any securities or solicitation of any investments or investment services and/or shall not be considered as an
advertisement tool. "U.S. Persons" are generally defined as a natural person, residing in the United States or any entity organized or incorporated under the laws of the United States. US
Citizens living abroad may also be deemed "US Persons" under certain rules.
Transactions in securities discussed in this research report should be effected through Edelweiss Financial Services Inc.
Additional Disclaimer for U.K. Persons
The contents of this research report have not been approved by an authorised person within the meaning of the Financial Services and Markets Act 2000 ("FSMA").
In the United Kingdom, this research report is being distributed only to and is directed only at (a) persons who have professional experience in matters relating to investments falling within
Article 19(5) of the FSMA (Financial Promotion) Order 2005 (the “Order”); (b) persons falling within Article 49(2)(a) to (d) of the Order (including high net worth companies and
unincorporated associations); and (c) any other persons to whom it may otherwise lawfully be communicated (all such persons together being referred to as “relevant persons”).
This research report must not be acted on or relied on by persons who are not relevant persons. Any investment or investment activity to which this research report relates is available only
to relevant persons and will be engaged in only with relevant persons. Any person who is not a relevant person should not act or rely on this research report or any of its contents. This
research report must not be distributed, published, reproduced or disclosed (in whole or in part) by recipients to any other person.
Additional Disclaimer for Canadian Persons
Edelweiss is not a registered adviser or dealer under applicable Canadian securities laws nor has it obtained an exemption from the adviser and/or dealer registration requirements under
such law. Accordingly, any brokerage and investment services provided by Edelweiss, including the products and services described herein, are not available to or intended for Canadian
persons.
This research report and its respective contents do not constitute an offer or invitation to purchase or subscribe for any securities or solicitation of any investments or investment services.
Disclosures under the provisions of SEBI (Research Analysts) Regulations 2014 (Regulations)
Edelweiss Broking Limited ("EBL" or "Research Entity") is regulated by the Securities and Exchange Board of India ("SEBI") and is licensed to carry on the business of broking, depository services
and related activities. The business of EBL and its associates are organized around five broad business groups – Credit including Housing and SME Finance, Commodities, Financial Markets,
Asset Management and Life Insurance. There were no instances of non-compliance by EBL on any matter related to the capital markets, resulting in significant and material disciplinary
action during the last three years. This research report has been prepared and distributed by Edelweiss Broking Limited ("Edelweiss") in the capacity of a Research Analyst as per Regulation
22(1) of SEBI (Research Analysts) Regulations 2014 having SEBI Registration No.INH000000172.