
A Quest for the Perfect Mixing Diagnostic
32
A Quest for the Perfect Mixing Diagnostic Lynn Melton University of Texas at Dallas Chuck Lipp, Kouchen Tsai, and Paul W. Gillis Dow Chemical Company Mixing XVIII June 24-29, 2001
Transcript of A Quest for the Perfect Mixing Diagnostic

A Quest for the Perfect MixingDiagnostic
Lynn MeltonUniversity of Texas at Dallas
Chuck Lipp, Kouchen Tsai, and Paul W. Gillis Dow Chemical Company
Mixing XVIII June 24-29, 2001

Advisory Message■ This presentation has been
approved by Dave Dickey for post-banquet presentation.
■ It does not contain partialderivatives, Rushton turbines, CFDvalidation plots, or Re to afractional power.
■ It has lots of PICTURES!

There is no“perfect diagnostic”
■ What do you want to know?

There is no“perfect diagnostic”
■ What do you want to know?◆ Everything

There is no“perfect diagnostic”
■ What do you want to know?◆ Nearly everything, but definitely
reaction-based, as a function ofspace and time
There is no“perfect diagnostic”
■ What do you want to know?◆ Nearly everything, but definitely
reaction-based, as a function ofspace and time
■ What do you really want?◆ engineering insight, or
◆ quantitative tests of modeling andCFD

Diagnostics forengineering insightshould be ...
■ incisive but not necessarilyquantitative
■ simple to use for iterative runs
■ cheap, “simple” chemistry
■ colorimetric
■ captured on videotape
Diagnostics forengineering insightexamples...
■ DISMT (dual indicator system formixing time)◆ red/yellow/blue-green;
acid/base reactions
■ FOB (formation of byproduct)◆ clear, green, blue, purple, red;
complexation reactions
DISMTDual Indicator System for Mixing Time
•Colors can provide quantitative information.
•Mix red liquid with blue liquid•Obtain yellow liquid only when mixture is within ±±±±5%of ideal mixing•Acid-base reaction with two indicators (methyl red andthymol blue)•Must adjust initial pH’s carefully
•MIXING TIME = time for entire solution to turnyellow

Jet mixing
(1) Jet of base (blue)from lower right intoacid (red)
Base accumulates atlower left
Where will yellowfirst appear?

Jet mixing
(2) Acid core (red);base circulatesclockwise
Yellow firstappears at topright.
Jet mixing
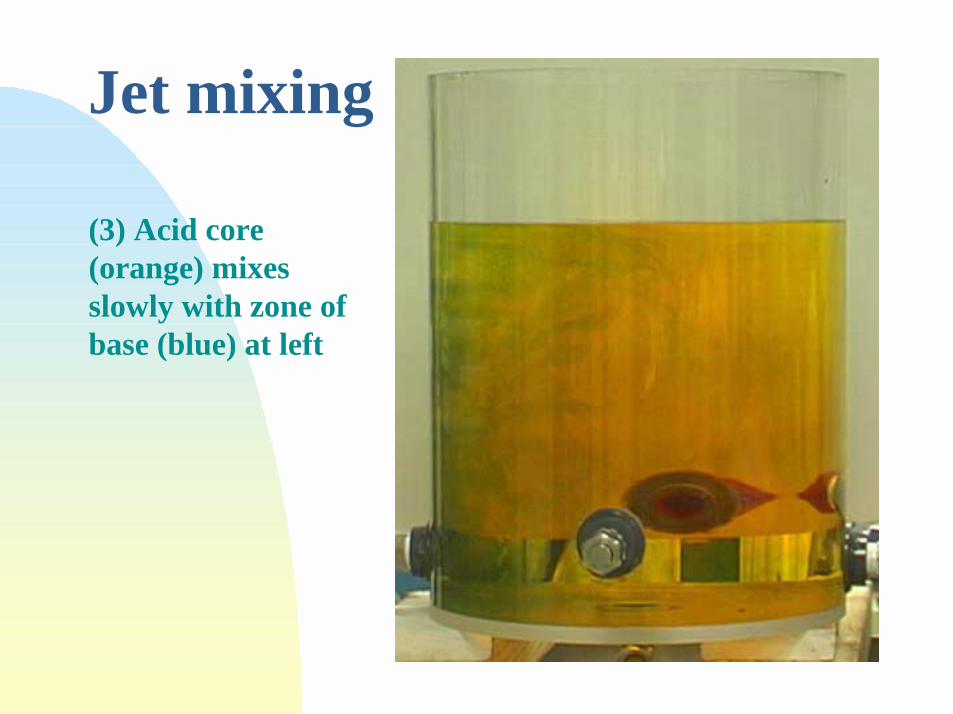
(3) Acid core(orange) mixesslowly with zone ofbase (blue) at left

Jet mixing
(4) After externalmixing, solution isuniformly yellow.
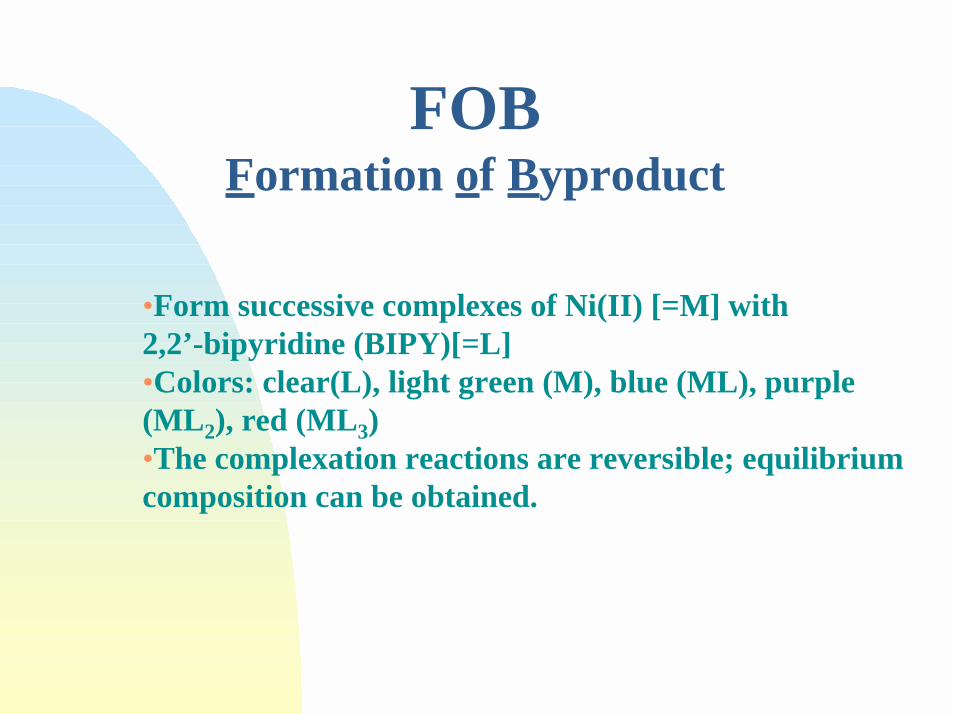
FOBFormation of Byproduct
•Form successive complexes of Ni(II) [=M] with 2,2’-bipyridine (BIPY)[=L]•Colors: clear(L), light green (M), blue (ML), purple(ML2), red (ML3)•The complexation reactions are reversible; equilibriumcomposition can be obtained.
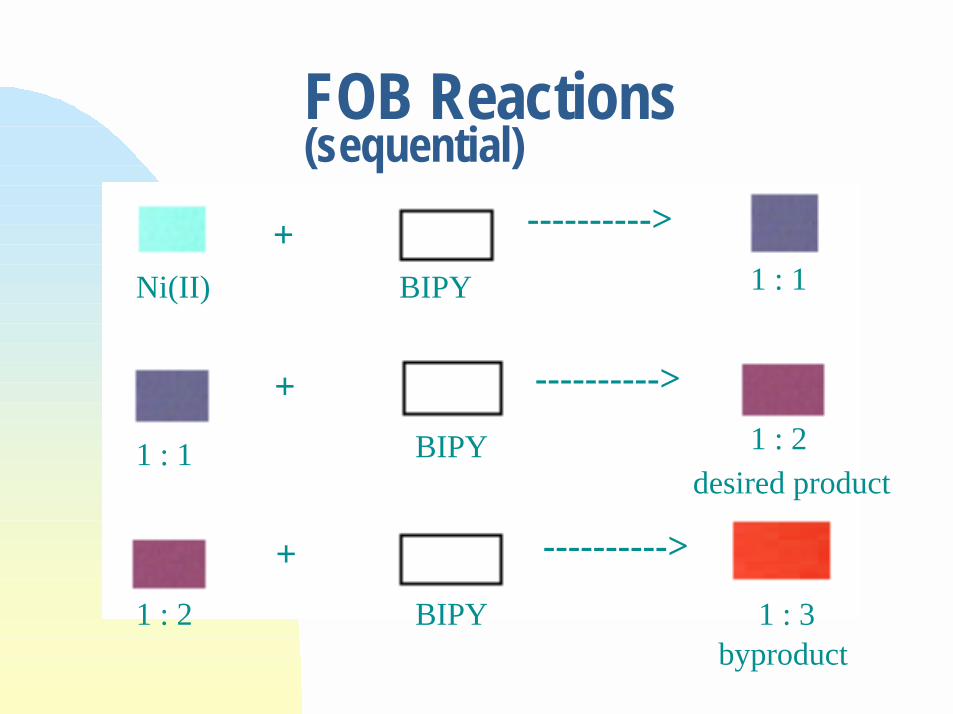
FOB Reactions(sequential)
+ ---------->
+
+
---------->
---------->
Ni(II) BIPY 1 : 1
1 : 1 BIPY
BIPY
1 : 2
1 : 2 1 : 3
desired product
byproduct
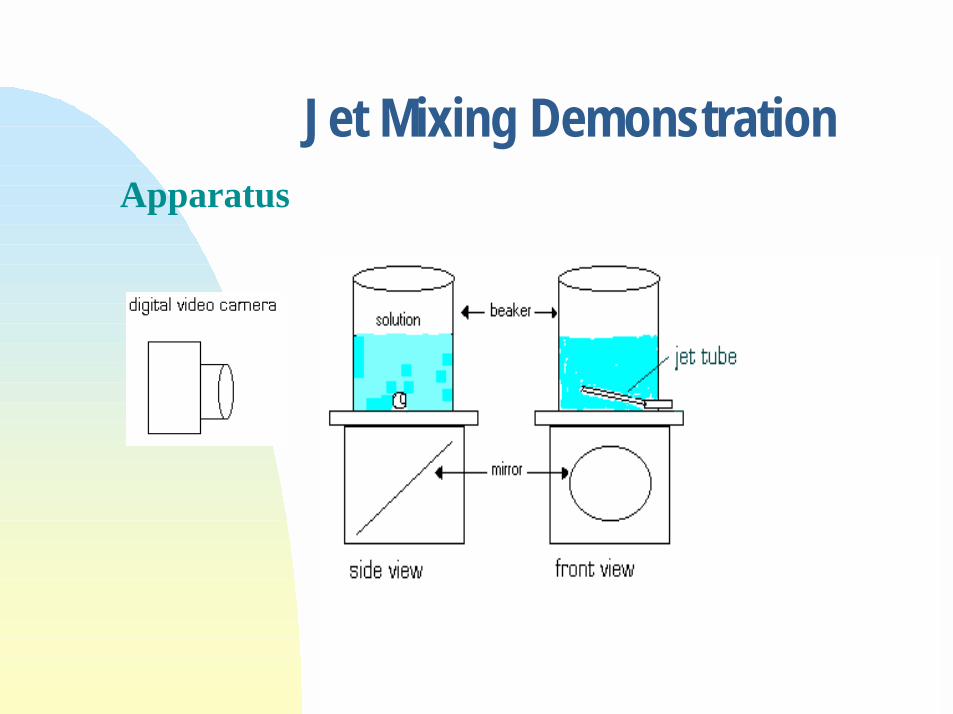
Jet Mixing DemonstrationApparatus

Jet Mixing Demonstration
Ni(II)
1 : 2 1 : 2poor mixing complete mixing
byproduct product
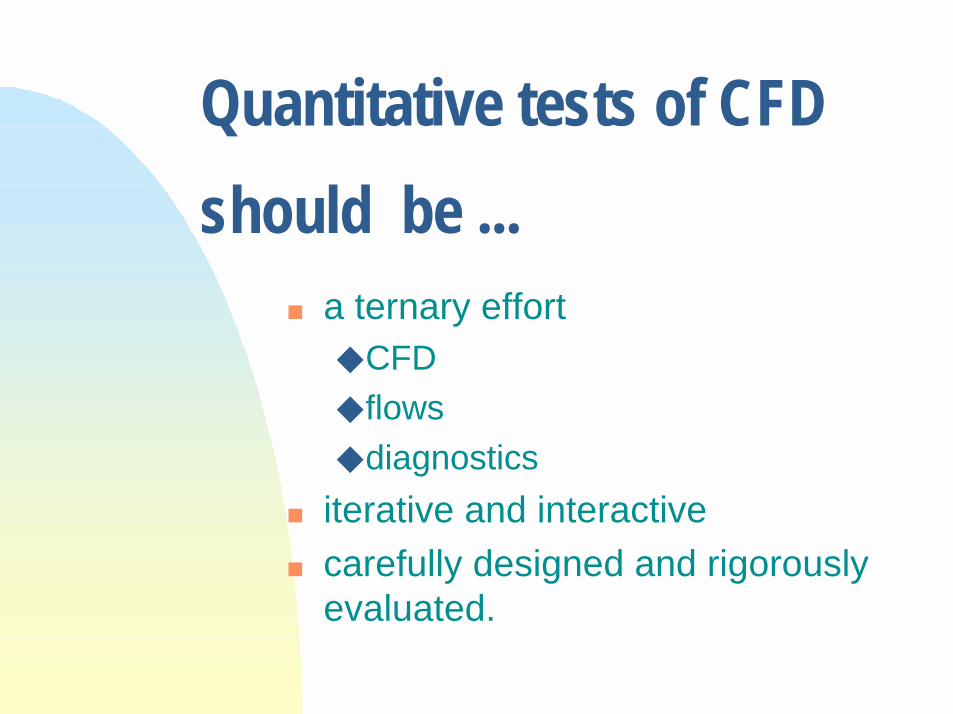
Quantitative tests of CFDshould be ...
■ a ternary effort◆ CFD
◆ flows
◆ diagnostics
■ iterative and interactive
■ carefully designed and rigorouslyevaluated.

Diagnostics forquantitative tests of CFDshould be ...■ quantitative (what level??)
■ simultaneous PIV/PLIF (correlatedvelocity and concentration fields)
■ known, tunable reaction rates
■ high spatial resolution
■ captured on digital cameras
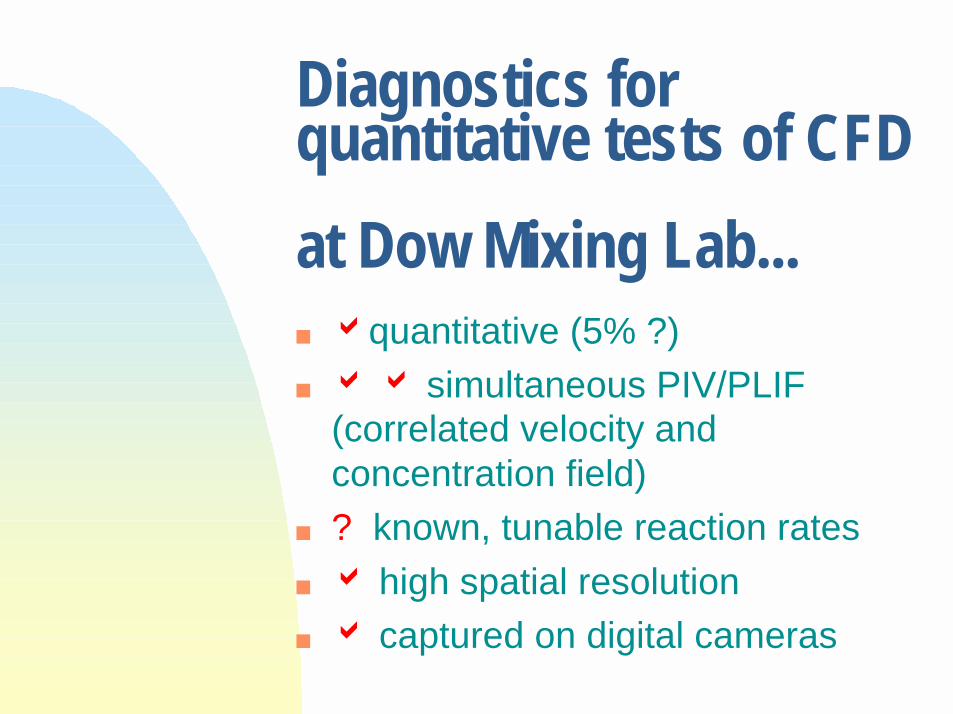
Diagnostics forquantitative tests of CFDat Dow Mixing Lab...■ aquantitative (5% ?)
■ a a simultaneous PIV/PLIF(correlated velocity andconcentration field)
■ ? known, tunable reaction rates
■ a high spatial resolution
■ a captured on digital cameras
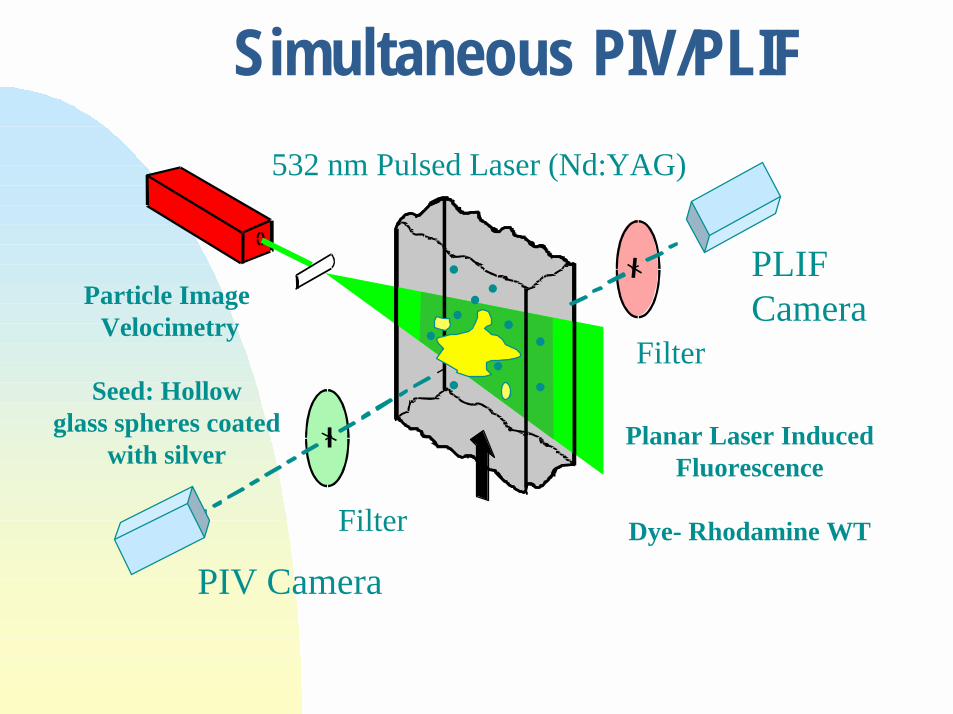
Simultaneous PIV/PLIF
PIV Camera
532 nm Pulsed Laser (Nd:YAG)
PLIFCamera
Filter
Filter
Particle Image Velocimetry
Seed: Hollowglass spheres coated
with silverPlanar Laser Induced
Fluorescence
Dye- Rhodamine WT

PLIF Advice■ ALWAYS run “optically thin” so that
the laser intensity is not attenuatedby absorption in the flow.
■ A = ε c l < 0.04 yields less than10% change in laser intensityacross the flow.
■ Many non-idealities eitherdisappear or can be ratioed out.

Rhodamine-WT■ Strong absorption at 532 nm
■ Fluorescence maximum at 590 nm
■ High quantum yield
■ Cheap
■ Very low toxicity (much lower than Rh-B)
■ Fluorescence has weak dependence onpH.
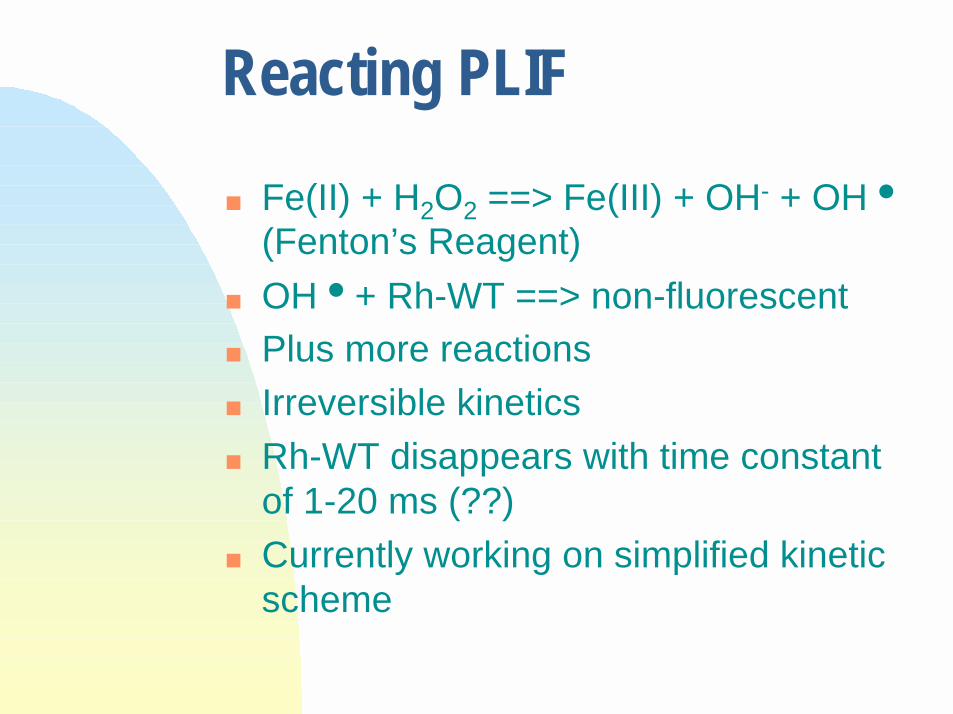
Reacting PLIF
■ Fe(II) + H2O2 ==> Fe(III) + OH- + OHi(Fenton’s Reagent)
■ OHi+ Rh-WT ==> non-fluorescent
■ Plus more reactions
■ Irreversible kinetics
■ Rh-WT disappears with time constantof 1-20 ms (??)
■ Currently working on simplified kineticscheme
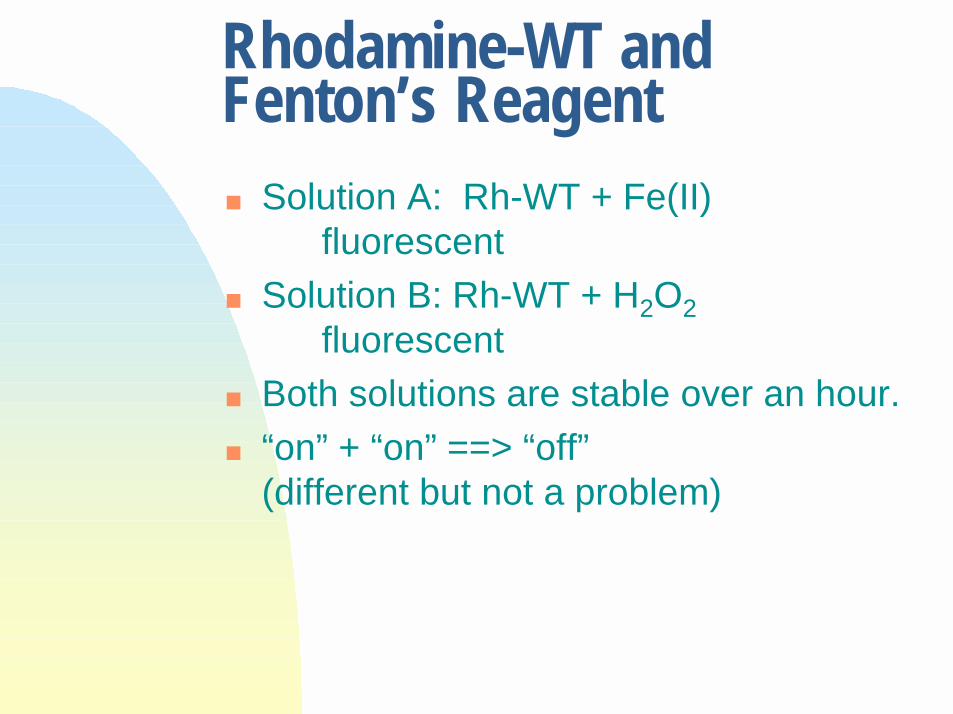
Rhodamine-WT andFenton’s Reagent■ Solution A: Rh-WT + Fe(II)
fluorescent
■ Solution B: Rh-WT + H2O2
fluorescent
■ Both solutions are stable over an hour.
■ “on” + “on” ==> “off” (different but not a problem)

Pulsed PLIF images of Fe(II)/H2O2
reaction zone. Lightest contourcorresponds to 10% reaction;darkest to 80%.
Reaction time constant is 10-20 ms;flow time through cell is 200 ms.
Reactive PLIFmeasurementsin shear flow

ZOMM zone of molecular mixing
■ “off - on - off” with a tunable “timeon” of 2-20 ms (pulse in pH)
■ fluorescence image shows wheremixing/reaction is taking place
■ modest kinetic scheme
■ might be ready in Fall 2001
Formation of Byproduct■ Capture PLIF images of byproduct
formation (and also primaryproduct ?)
■ Would like to have tunable ratio ofbyproduct rate to primary rate
■ At least a year away
Reaction rate■ Make fluorescence intensity at
particular wavelength proportionalto overall reaction rate
■ Currently in the concept stage

Back to the Quest...
■ Do not limit yourself by asking“What has been used previously?”
■ Instead, ask “For my work, whatreaction/concentration quantitywould provide the most incisivetest?
■ I love to collaborate.
…for the perfect diagnostic■ PIV and reactive PLIF-FOB with
◆ tunable, simple kinetics
◆ detection of both the primaryproduct and the byproduct
◆ variable viscosities
■ CFD would be tested against theflow pattern and two reactions.
Acknowledgements
■ Min Zhan (FOB), Vern Porter, BobSpradling, Rob Larkins
■ Dow Chemical Company
■ Texas Higher Education CoordinatingBoard -Advanced Technology Program