A QUANTITATIVE RISK ASSESSMENT MODEL FOR...
116
A QUANTITATIVE RISK ASSESSMENT MODEL FOR THE MANAGEMENT OF INVASIVE YELLOW PERCH IN SHUSWAP LAKE, BRITISH COLUMBIA by Erica Elizabeth Johnson B.Sc. (Hons.), Queen’s University, 2005 RESEARCH PROJECT SUBMITTED IN PARTIAL FULFILLMENT OF THE REQUIREMENTS FOR THE DEGREE OF MASTER OF RESOURCE MANAGEMENT In the School of Resource and Environmental Management Project No. 475 © Erica Elizabeth Johnson 2009 SIMON FRASER UNIVERSITY Summer 2009 All rights reserved. This work may not be reproduced in whole or in part, by photocopy or other means, without permission of the author.
Transcript of A QUANTITATIVE RISK ASSESSMENT MODEL FOR...

A QUANTITATIVE RISK ASSESSMENT MODEL FOR
THE MANAGEMENT OF INVASIVE YELLOW PERCH IN
SHUSWAP LAKE, BRITISH COLUMBIA by
Erica Elizabeth Johnson B.Sc. (Hons.), Queen’s University, 2005
RESEARCH PROJECT SUBMITTED IN PARTIAL FULFILLMENT OF THE REQUIREMENTS FOR THE DEGREE OF
MASTER OF RESOURCE MANAGEMENT
In the School of Resource and Environmental Management
Project No. 475
© Erica Elizabeth Johnson 2009
SIMON FRASER UNIVERSITY
Summer 2009
All rights reserved. This work may not be reproduced in whole or in part, by photocopy
or other means, without permission of the author.

ii
Approval
Name: Erica Elizabeth Johnson
Degree: Master of Resource Management
Project Number: 475
Title of Thesis: A quantitative risk assessment model for the management of invasive yellow perch in Shuswap Lake, British Columbia
Supervisory Committee:
________________________________________
Dr. Randall M. Peterman Senior Supervisor Professor School of Resource and Environmental Management Simon Fraser University
________________________________________
Dr. Sean P. Cox Committee Member Assistant Professor School of Resource and Environmental Management Simon Fraser University
________________________________________
Dr. Michael J. Bradford Committee Member Adjunct Professor Fisheries and Oceans Canada
Date Approved: ________________________________________

iii
Abstract
I developed a quantitative risk assessment model in a Bayesian decision analysis
framework to evaluate management options for the potential invasion of non-native
yellow perch (Perca flavescens) in Shuswap Lake, British Columbia. Probability
distributions of key model parameters were determined by eliciting expert opinion during
a workshop and by a mail-out survey. The model produced distributions of weighted
average probabilities of abundance and spatial distribution of yellow perch in the lake 10
years after introduction. I found that impacts of a yellow perch invasion on sockeye
salmon would be best mitigated by undertaking a combination of actions including
education, enforcement, rotenone, and physical removal. The rank order of management
options was not sensitive to assumed carrying capacity or rate of spread. Based on my
results, I recommend that sampling efforts continue in Adams and Shuswap Lakes to
monitor whether yellow perch spread and quantify how they interact with sockeye
salmon.
Keywords
risk assessment, aquatic invasive species, Bayesian decision analysis, expert opinion,
fisheries management

iv
Dedication
To all those who have inspired me
to make the world a better place

v
Acknowledgements
I thank Randall Peterman for his expertise, guidance, and encouragement
throughout this project. I am continually amazed by his dedication to education and
research, as well as his commitment to his students. Special thanks to my other
committee members, Sean Cox and Mike Bradford, for their contributions to this work.
Thanks to the fisheries research group, especially the “next generation” of fish
chicks, for their friendship and support over the last few years.
For participating in my workshop, I thank Steve Maricle, Lynda Ritchie, and
Andrew Klassen from British Columbia’s Ministry of the Environment, and Timber
Whitehouse, Michael Bradford, and Jeremy Hume from Fisheries and Oceans Canada.
For taking the time to participate in my survey, I thank Tim Johnson, Andy Cook,
and Steven J. Kerr from the Ontario Ministry of Natural Resources, Michael Jones and
Brian Irwin from Michigan State University, Kevin Kayle from the Ohio Department of
Natural Resources, Terry Shrader from the Oregon Department of Fish and Wildlife,
Gordon E. Morgan from Laurentian University, and Thomas Therriault, Tom G. Brown,
and Charles K. Minns from Fisheries and Oceans Canada.
Thanks to my family and friends for their support and encouragement throughout
the years, particularly while I have been so far from home. Profound thanks to my
husband, Shane Gero, for his love and support during the completion of this project.
This research was funded by an NSERC research grant (via Randall Peterman)
and a grant from the Pacific Salmon Commission’s Southern Boundary Restoration and
Enhancement Fund.

vi
Table of Contents
Approval ............................................................................................................................. ii
Abstract .............................................................................................................................. iii
Dedication .......................................................................................................................... iv
Acknowledgements............................................................................................................. v
Table of Contents............................................................................................................... vi
List of Tables ................................................................................................................... viii
List of Figures ..................................................................................................................... x
Introduction......................................................................................................................... 1
Methods............................................................................................................................. 10
Management Objectives................................................................................................ 10
Management Actions .................................................................................................... 10
Uncertain States of Nature ............................................................................................ 11
Elicitation of Expert Opinion........................................................................................ 13 Workshop .................................................................................................................. 13 Survey........................................................................................................................ 13
Model for Predicting Outcomes.................................................................................... 15 Overview ................................................................................................................... 15 Growth model............................................................................................................ 16 Spread model ............................................................................................................ 17 Photosynthetic Rate Model ....................................................................................... 19
Performance Measures.................................................................................................. 22
Sensitivity Analyses...................................................................................................... 23
Results............................................................................................................................... 23
Expert Elicitation .......................................................................................................... 23 Workshop .................................................................................................................. 23 Survey........................................................................................................................ 24
Risk Assessment Model................................................................................................ 26 Median Probability of Ecological Consequences from Yellow Perch Abundance... 26 Median Probability of Yellow Perch Spatial Distribution........................................ 28
Management Costs........................................................................................................ 29

vii
Sensitivity Analysis ...................................................................................................... 31 Median Probability of Ecological Consequences from Yellow Perch Abundance... 31 Median Probability of Yellow Perch Spatial Distribution........................................ 32
Discussion ......................................................................................................................... 33
Overview of Results...................................................................................................... 33
Expert Elicitation .......................................................................................................... 35
Invasive Species Management...................................................................................... 38
Update ........................................................................................................................... 41
Recommendations for Future Action and Future Research.......................................... 42
Tables................................................................................................................................ 47
Figures............................................................................................................................... 56
Reference List ................................................................................................................... 66
Appendices........................................................................................................................ 76
Appendix A. Yellow Perch Risk Assessment Survey Part 1 ........................................ 77 Questions................................................................................................................... 77
Appendix B. Yellow Perch Risk Assessment Survey Part 1 ........................................ 91 Response Template Sheet 1: Probability of Arrival.................................................. 91 Response Template Sheet 2: Rate of Increase .......................................................... 92 Response Template Sheet 3: Rate of Spread............................................................. 93
Appendix C. Yellow Perch Risk Assessment Survey Part 1 ........................................ 94 Responses .................................................................................................................. 94
Appendix D. Yellow Perch Risk Assessment Survey Part 2 ........................................ 99 Questions................................................................................................................... 99

viii
List of Tables
Table 1. Descriptions of management actions included in this analysis and stages of invasion they are intended to control............................................................ 48
Table 2. The abundance (measured in number of fish) of yellow perch in Shuswap Lake 10 years after arrival that, in the model, led to high, moderate, and low ecological consequences as defined by the impact on adult sockeye salmon produced by the lake. The impact on sockeye salmon is measured as the proportional reduction in the abundance (measured in number of fish) of adult sockeye salmon produced by Shuswap Lake. These impact categories were defined by workshop participants, and the abundance of yellow perch leading to each category of ecological consequence was determined using the PR model of Hume et al. (1996) (see Methods).................................................................................................... 49
Table 3. A summary of key results from Part 2 of the Yellow Perch Risk Assessment Survey. Population type refers to the type of yellow perch population, native or non-native, that experts were most familiar with. Estimates of N0 (the starting value for the logistic growth model measured in number of fish) indicate the minimum number of yellow perch required to create an established population in Shuswap Lake. Minimum and maximum estimates of K (the carrying capacity for yellow perch in Shuswap Lake measured in number of fish) were used to inform sensitivity analyses, as were the minimum and maximum estimates of lag-density (the abundance of yellow perch required before spread begins in Shuswap Lake, again in number of fish). The estimates of K from Part 2 of the survey represent experts’ opinion and are independent of the estimated K value calculated using the PR model. Expert opinion on whether or not yellow perch will utilize the littoral and/or pelagic zones of Shuswap Lake is also shown, as is the depth at which experts believe yellow perch will likely be found in the lake................ 50
Table 4. The starting values (N0) used in the logistic growth model for a given expert. These values represent the minimum number of yellow perch required to arrive in Shuswap Lake in order to create an established population and were derived from expert responses to Part 2 of the survey (Table 4). The N0 values of 30 and 75 represent the median value in the ranges (10 to 50, and 50 to 100, respectively) provided by experts. The N0 value of 150 was used in place of one expert’s estimate of > 100, while the N0 value of 10 was used in place of another’s estimate of < 10........ 52
Table 5. The surface area of Shuswap Lake inhabited by yellow perch 10 years after arrival that would lead to localized, moderate, and widespread spatial distribution as defined by the proportion of suitable habitat (per cent of the total surface area of Shuswap Lake) inhabited by yellow perch 10 years after arrival. These categories of spatial distribution were defined by workshop participants, as were the most likely points of

ix
introduction (Figure 1). The spread distance for each distribution category is the linear distance from the point of introduction (Point A, B, or C) that yellow perch will have spread 10 years after arrival as calculated by the spread model. ........................................................................ 53
Table 6. The median probability (across all experts) of high, moderate, and low ecological consequences resulting from a yellow perch invasion in Shuswap Lake under different management actions and the associated management costs and duration of each action as identified by experts at the workshop. The median probability of no impact on sockeye salmon is also included. Detailed descriptions of these management actions can be found in Appendix A.................................................................................... 54
Table 7. Rank order of management actions, by case, based on results shown in Figures 3 through 7. Management actions are ranked (1 is best; 7 is worst) according to probability of high ecological consequences and widespread spatial distribution, i.e., the action ranked 1 has the lowest probability of high ecological consequences and widespread distribution, whereas the action ranked 7 has the highest probability of high ecological consequences and widespread distribution. Note: all cases are the same as the baseline parameter values and assumptions except for the item noted. Identical rankings and decimals in a column indicate ties, and ranks are averaged. ............................................................... 55

x
List of Figures
Figure 1. Map of Shuswap Lake, B.C., showing the most likely points of introduction for yellow perch as identified by participants at a workshop described in the Methods section. Point A represents the outlet of the Adams River in Main Arm, Point B represents the outlet of the Salmon River in Salmon Arm, and Point C represents the outlet of Eagle River and Mara Lake in Salmon Arm. Point A was used as the initial point of yellow perch introduction in the spread model, while Points B and C were used to conduct sensitivity analyses......................................................... 57
Figure 2. Decision tree illustrating the conceptual framework of this analysis. Branches radiating from the square node represent different management actions that could be taken to control the invasion of yellow perch in Shuswap Lake, whereas branches radiating from round nodes represent uncertain states of nature. For each management action, there is an uncertainty node that has a branch for every possible state of nature (combination of uncertain parameters of the growth and spread models). States of nature include arrival via human introduction (AH), arrival via natural dispersal (AN), the intrinsic rate of increase (r), and the rate of spread (C). The relative weighting (or probability, Prn) on each uncertain state of nature is the experts’ degree of belief in the true value of the uncertain parameters. Outcomes are weighted-average probabilities for abundance (N) and spatial distribution (D) of yellow perch in Shuswap Lake 10 years after introduction. The figure only shows a subset of management scenarios included in this analysis (Table 1), No Action (Na), Education (Ed), and 4 Mgmt Actions (4M). .................... 59
Figure 3. Results for the baseline parameter values of the model of median probability (across all experts) of no impact, low, moderate, and high ecological consequences based on abundance of yellow perch in
Shuswap Lake 10 years after arrival. Error bars represent ±±±± one standard deviation............................................................................................................ 61
Figure 4. Results for the baseline parameter values of the model of median probability (across all experts) of no spread, localized, moderate, and widespread spatial distribution of yellow perch in Shuswap Lake 10 years after arrival resulting from the spread of yellow perch from their initial point on introduction, in this case Point A (Figure 1). Error bars
represent ±±±± one standard deviation. .................................................................. 62
Figure 5. The median probability (across all experts) of high, moderate, low, and no ecological consequences based on abundance of yellow perch in Shuswap Lake 10 years after arrival. Unlike Figure 3, which was based on the baseline value of the carrying capacity (K) of 1,380,000 yellow perch, here I used 775,000 (A) or 3,100,000 (B) fish for K in the logistic
growth model. Error bars represent ±±±± one standard deviation. ......................... 63

xi
Figure 6. Results for the baseline parameter values of the model. The median probability (across all experts) of widespread, moderate, and localized spatial distribution of yellow perch in Shuswap Lake 10 years after arrival resulting from the spread of yellow perch from their initial point on introduction, in this case Point B (A) and Point C (B). Error bars
represent ±±±± one standard deviation. .................................................................. 64
Figure 7. The median probability (across all experts) of widespread, moderate, and localized spatial distribution of yellow perch in Shuswap Lake 10 years after arrival resulting from the spread of yellow perch from their initial point of introduction, in this case Point A (Figure 1). Unlike Figure 4, which was based on the baseline value of the lag-density of 5,000 yellow perch, here I used 2,500 (A) and 10,000 (B) fish for the lag-
density in the spread model. Error bars represent ±±±± one standard deviation............................................................................................................ 65

1
Introduction
Ecosystems are composed of intricate networks of relationships among living
organisms and the environment in which they live. Changes to these networks through
habitat destruction, pollution, climate change, or introduction of new species can have
devastating effects. In particular, invasion of non-indigenous species (NIS) is recognized
by ecologists as a leading threat to global biodiversity and ecosystem functioning
(Vitousek et al. 1996; Sala et al. 2000; Rosenzweig 2001; Rahel et al. 2008). Non-
indigenous species include any organism introduced beyond their historic or native range,
and are often referred to as “alien” or “exotic” species (Mack et al. 2000; Lodge and
Shrader-Frechette 2003; Colautti and MacIsaac 2004). Not all NIS introduced into new
habitat ranges will become invasive. Only those that spread and cause ecological and
economic harm are classified as invasive (Williamson 1999; Colautti and MacIsaac
2004). Through competition, predation, hybridization, or introduction of new pathogens,
invasive species can permanently alter natural ecosystems and dramatically reduce
abundance and diversity of native species (Taylor et al. 1984; Mack et al. 2000; Cambray
2003). Aquatic invasive species (AIS) are NIS species that invade marine and freshwater
environments. In Canada, AIS are the second leading cause for putting freshwater species
at risk and represent one of the greatest threats to success of fish conservation efforts
(Miller et al. 1989; Dextrase and Mandrak 2006; Rahel et al. 2008).
Invasive species may also have large economic consequences, not only because of
their impacts on industries such as agriculture, aquaculture, and forestry, but also because
billions of dollars are spent on efforts to control and eradicate invasive species every year
(Pimentel et al. 2000; Colautti et al. 2006a). It is estimated that the total damage and

2
control costs of invasive species in Canada is between $13.3 and $34.5 billion CDN per
year, with damages caused by AIS costing nearly $750 million CDN per year (Colautti et
al. 2006a). In the United States, it is estimated that the total damage and control costs of
invasive species is $137 billion USD per year (Pimentel et al. 2000). Worldwide the
impact of AIS is estimated to cost more than $314 billion USD per year in damage and
control costs (Pimentel et al. 2005). None of theses cost estimates include the value of
losses in biodiversity or ecosystem services.
In this paper, I develop a quantitative risk assessment model for an invasive fish
species, yellow perch (Perca flavescens), in British Columbia, Canada. This species has
the potential to drastically affect one of the most lucrative sockeye salmon
(Oncorhynchus nerka) populations in Canada. I use the risk assessment model to evaluate
management options for controlling yellow perch and to determine which one best
mitigates the impacts on sockeye salmon.
For a NIS to become an invasive species, it must successfully pass through all
three stages of the invasion process: arrival, establishment (survival and reproduction),
and spread (Brown 1993; Kolar and Lodge 2001, 2002; Hulme 2006). The arrival, or
introduction stage, requires NIS to survive transport through a natural- or human-
mediated pathway and be released into a new environment. The frequency and number of
intentional and accidental introductions of NIS in North America can be directly linked to
globalisation and increases in human activities such as transport and trade (Mack et al.
2000; Meyerson and Mooney 2007). Although public awareness on this issue is growing,
the number of NIS in North America continues to increase. The most common pathways
for AIS in Canada include fish stocking programs, private aquaculture, bait industry,

3
aquarium industry, live food fish industry, recreational boating, canals and diversions,
and commercial shipping (Kerr et al. 2005; Johnson et al. 2006; Gertzen et al. 2008).
Establishment of an introduced NIS depends on its ability to survive and
successfully reproduce in its new environment. Survival and reproduction depend on a
variety of factors including habitat suitability, food availability and abundance, as well as
predator abundance and vulnerability of introduced species to these predators (Brown
1993; Lewis and Kareiva 1993; Bartell and Nair 2003). Establishment of NIS may also
be affected by the number and frequency with which individuals are introduced into the
new environment (i.e., propagule pressure) and by reproductive success at extremely low
densities (i.e., Allee effects) (Lewis and Kareiva 1993; Drake 2004; Leung et al. 2004;
Colautti et al. 2006b; Drake and Lodge 2006; Duggan et al. 2006; Copp et al. 2007). If a
NIS becomes established, it may proceed to the final stage of the invasion process,
spread.
Biological invasions are often characterized by a lag phase while the population
grows to fill the habitat at the introduction site, followed by a rapid expansion after the
initial range is filled (Frappier et al. 2003; Rilov et al. 2004). Once a NIS has become
widespread, it is often difficult to eradicate. However, populations of invasive species can
still be managed, through biological, chemical, and/or physical control and containment
methods, to reduce their impacts on native species and ecosystems (Wittenberg and Cock
2005; Hulme 2006; Genovesi 2007). While eradication is the complete and permanent
removal of a NIS species from a defined area, control is the reduction of population
density and abundance in order to keep damages at an acceptable level. Containment is
aimed at limiting the spread of a NIS and containing its presence within defined

4
geographical boundaries. Starting eradications at the earliest possible stage of invasion
increases the chances of successfully removing an unwanted and potentially harmful NIS
(Wittenberg and Cock 2005; Genovesi 2007).
The application of toxic chemicals is the most successful method for eradicating
AIS in freshwater habitats once they become widespread (Barrows 1939; Courtenay
1997; Britton and Brazier 2006). In the case of invasive fish, a piscicide is most often
used to eliminate the unwanted species. Unfortunately, many piscicides (e.g., rotenone)
are not species-specific, and will eliminate non-target species along with target species
(Cailteux et al. 2001; Ling 2003; Schreier et al. 2008). In some cases this may be
considered acceptable, and non-target species are simply re-stocked in the water body
following chemical treatment. In other cases, where the application of piscicides would
harm commercially valuable or endangered native species, a physical method of removal
(e.g., trapping or electrofishing) is an effective alternative. Unfortunately, physical
removal methods are generally not successful at complete eradication of AIS, but have
been used to control and contain populations of freshwater invaders (Schleen et al. 2003;
Neilson et al. 2004).
Therefore, the most effective method for mitigating the environmental and
economic impacts of AIS is the prevention of new introductions (Kolar 2004; Wittenberg
and Cock 2005; Finnoff et al. 2007; Genovesi 2007). The threat of current and potential
AIS must be assessed to develop policy, legislation, or management plans to prevent
harmful introductions and protect ecosystems from the impacts of AIS, as well as to set
priorities for using limited funds. Threats can be estimated using ecological risk
assessment, which evaluates the level of risk associated with the introduction of NIS by

5
assessing (1) the probability that a species will be both introduced and become
established in a new environment, and (2) the ecological consequences of that
establishment (Kolar and Lodge 2002; Andersen et al. 2004; Mandrak and Cudmore
2004). By predicting the identity, range, and impact of potential aquatic invaders, the risk
assessment process can also help inform management decisions and aid in allocating
resources to prevent new invasions or deal with ongoing ones (Kolar and Lodge 2002;
Andersen et al. 2004; Kolar 2004).
Until very recently, Canada’s only risk assessment process for AIS was the
National Code for Introductions and Transfers of Aquatic Species (TGIT 2003).
Unfortunately, this code applies to the intentional introduction and transfers of aquatic
organisms, but not to the unintentional ones, and therefore cannot be used to assess the
risk of potential AIS, either those not yet in Canada, or those with the potential to spread
within Canada. In 2006, the Centre of Expertise for Aquatic Risk Assessment (CEARA)
developed the National Guidelines for Assessing the Biological Risk of Aquatic Invasive
Species in Canada (Mandrak and Cudmore 2006), with the intention of providing risk
assessors with guidance to conduct risk assessments for the unintentional introductions of
potentially harmful aquatic species using a standardized approach.
In 2008, Fisheries and Oceans Canada (DFO) conducted a qualitative risk
assessment for non-native yellow perch in British Columbia (B.C.) following CEARA’s
guidelines (Bradford et al. 2008). DFO found that yellow perch are a significant risk to
aquatic communities in B.C. and the overall risk rating (a combination of probability of
widespread establishment and magnitude of ecological consequences) for yellow perch in
B.C. ranged from moderate to high, depending on the region (Bradford et al. 2008).

6
Yellow perch is a freshwater fish indigenous to North America. Although it was
originally restricted to areas east of the Continental Divide, yellow perch have been
introduced into British Columbia, California, Oregon, Idaho, and Washington (Scott and
Crossman 1973; Wydoski and Whitney 2003; McPhail 2007). The range expansion of
yellow perch in North America is primarily the result of deliberate transplantations,
including authorized and unauthorized introductions (McPhail 2007; Runciman and Leaf
2008). Yellow perch are prolific, relatively easy to catch by recreational anglers, and are
considered good to eat. For these reasons they are highly favoured by anglers, and are
often introduced by anglers wishing to create new fishing opportunities. In B.C., yellow
perch are present in 78 lakes and rivers, most of which are geographically, physically,
and/or hydraulically isolated, which suggests unauthorized introductions by anglers as the
most likely source of yellow perch in these waterbodies (Runciman and Leaf 2008).
Yellow perch were first observed in B.C. in the 1950s in trans-boundary waterways and
are believed to be the result of upstream movements of fish introduced into Washington
State lakes and reservoirs (Scott and Crossman 1973; McPhail 2007; Runciman and Leaf
2008). Although little is known about the biology and habitat use of yellow perch in B.C.
and other parts of its introduced range, the life history of yellow perch in its native range
has been extensively studied, both in Canada (Fraser 1978; Ney 1978; Post and Cucin
1984; Post and McQueen 1988; Post et al. 1997; Chu et al. 2005; Kovecses et al. 2005;
Purchase et al. 2005) and the United States (Clady 1977, 1978; Costa 1979; Cobb and
Watzin 1998; Fullerton et al. 1998; Hrabik et al. 2001; Olson et al. 2001; Wilberg et al.
2005; Fullerton and Lamberti 2006; Headley and Lauer 2008). In addition, Thorpe

7
(1977), Craig (1987), and Brown et al. (2009) provide excellent reviews of yellow perch
biology.
The yellow perch risk assessment conducted by DFO was carried out across a
relatively broad spatial scale and was not intended to provide detailed information or
management advice for specific waterbodies or on impacts to individual populations or
species (Bradford et al. 2008). My study was designed to complement work being done
by both federal and provincial agencies on AIS in B.C. My objective was to provide more
detailed, quantitative information for a specific water body (Shuswap Lake, near Salmon
Arm, B.C.) and the potential impacts on a particular species (Pacific sockeye salmon).
In the absence of natural predators, yellow perch have been known to out-breed
and out-compete native fish species, including salmonids, and can dominate smaller lake
systems in just a few years (Scott and Crossman 1973; Clady 1978; Fraser 1978; Shrader
2000; Bonar et al. 2005). The concern in B.C. is with potential impacts on Pacific
salmon, particularly sockeye salmon, if yellow perch are introduced into nursery lakes,
such as Shuswap Lake. Shuswap Lake is a large (surface area 310 km2) relatively shallow
(mean depth 61.5 m) multi-basin lake located in the southern interior of B.C. (Figure 1).
Shuswap Lake is a very valuable salmon-producing lake and there could be serious
ecological, economic, and social consequences if yellow perch invade this lake. In
particular, Shuswap Lake is the nursery lake for juveniles of the most abundant sockeye
salmon population in B.C., Adams River, which has in the past supported large
commercial fisheries often worth hundreds of millions of dollars. Yellow perch could
compete with and also prey upon salmon juveniles and fry, particularly if there is
significant habitat overlap between yellow perch and salmon. Juvenile sockeye salmon
8
generally utilize the pelagic zone of Shuswap Lake and impacts of a yellow perch
invasion would likely be greater if yellow perch also inhabit pelagic regions of the lake.
Shuswap Lake is also an important source of chinook (Oncorhynchus tschawytscha) and
coho (Oncorhynchus kisutch) salmon, which could also be at risk if yellow perch are
introduced into the lake.
In the Thompson region of B.C., yellow perch have already been confirmed in 13
water bodies (Runciman and Leaf 2008). The first recorded occurrence of yellow perch in
this region was in Skmana Lake in 1996, and except for a few incidents of localized
dispersal, yellow perch populations in this region have originated exclusively through
unauthorized introductions (Runciman and Leaf 2008). In the Thompson Region, eight
water bodies containing yellow perch are connected to downstream salmon populations
(Runciman and Leaf 2008). At least four lakes (Forest, Skmana, Gardom, and Adams)
that contain yellow perch have downstream outlets that flow into Shuswap Lake, making
the natural dispersal of yellow perch into Shuswap Lake a real possibility.
To help estimate risks to sockeye salmon populations in Shuswap Lake associated
with invasion of yellow perch, I developed a quantitative risk assessment model to
evaluate various management actions that could be taken at different stages of a yellow
perch invasion and estimated how well those options might work at curtailing the
ecological impacts of yellow perch, while keeping management costs to a minimum. For
each management action, a stochastic model took into account several uncertainties and
simulated the potential dynamics of a yellow perch introduction in Shuswap Lake. As
well, the analysis considered some broad, qualitative indicators of the ecological
consequences of a potential invasion.

9
I used decision analysis, which is a formal method for explicitly and
quantitatively taking uncertainties into account when evaluating management options
(Walters 1986; Morgan and Henrion 1990; Peterman and Anderson 1999), as a
framework for my risk assessment model. Decision analysis has been applied in fisheries
management (Walters 1986; Punt and Hilborn 1997; Peters and Marmorek 2001;
Peterson and Evans 2003; Patrick and Damon-Randall 2008), endangered species
management (Maguire 1986; Drechsler 2000; VanderWerf et al. 2006; Pestes et al. 2008;
Gregory and Long 2009), and more recently the management of invasive species
(Maguire 2004, Haeseker et al. 2007).
I had two research objectives. The first was to quantify expert knowledge about
(i) critical population dynamics parameters of non-native yellow perch in Shuswap Lake,
(ii) ecological impacts of a potential yellow perch invasion on sockeye salmon, and (iii)
management costs associated with different eradication and control actions. The second
objective was to quantitatively evaluate the effectiveness at reducing ecological
consequences (i.e., impact on sockeye salmon) of management actions related to
controlling yellow perch at different stages of invasion. Information resulting from this
risk assessment will assist with allocation of limited funds and help provincial fisheries
managers choose the most appropriate control method to deal with threat of invasive
yellow perch. This model could be adapted as a management tool for other freshwater
systems where native fish are at risk from AIS.
10
Methods
This risk assessment model (decision analysis) for the management of invasive
yellow perch in Shuswap Lake had eight components, as detailed in the next sections: (1)
management objectives, (2) alternative management actions (3) uncertain states of nature,
(4) probabilities of each uncertain state of nature, (5) models for predicting the outcome
of each combination of management action and uncertain state of nature, (6) ranking of
management actions, and (7) sensitivity analyses (Peterman and Anderson 1999). The
eighth component, a decision tree, illustrates connections among these components
(Figure 2).
Management Objectives
I used the following two management objectives to guide my decision analysis:
(1) minimize the probability of large ecological consequences (defined below) resulting
from the abundance of yellow perch in Shuswap Lake 10 years after arrival, and (2)
minimize the probability of widespread spatial distribution of yellow perch in Shuswap
Lake 10 years after arrival.
Management Actions
I included five alternative management actions representing a range of possible
control methods for reducing the ecological impacts of invasive yellow perch in Shuswap
Lake in this model. These actions were “No Action”, “Education”, “Enforcement”,
“Rotenone”, and “Physical Removal”. Descriptions of these management actions can be
found in Table 1. Each action was intended to control a different stage of the invasion
process. For example, “Education” was intended to prevent the arrival of yellow perch in

11
Shuswap Lake, whereas “Physical Removal” was intended to control the establishment
and spread of yellow perch after they have arrived in Shuswap Lake. By combining
multiple actions, managers could attempt to control all three invasion stages in a single
management option. I ranked management actions (and their combinations) to determine
which one best satisfied the stated management objectives, while keeping management
costs to a minimum. Estimated costs of each management action were included in the
analysis to illustrate to managers trade-offs between expenditures on yellow perch control
actions and probability for each of several magnitudes of ecological consequences.
Uncertain States of Nature
The uncertain states of nature included in my risk assessment model were related
to the three stages of invasion: (1) arrival, (2) establishment (survival and reproduction),
and (3) spread (Hengeveld 1989; Andow et al. 1990; Kolar and Lodge 2002; Mandrak
and Cudmore 2006). Because data regarding invasive yellow perch in B.C. were quite
limited, the input data for my risk assessment model were generated by eliciting the
expert opinions of fisheries scientists and managers. For each management action,
experts were asked to provide a probability distribution for each uncertain state of nature
described below. The definitions of these uncertain parameters were developed in
accordance with the “clarity test” (Morgan and Henrion 1990), which dictates that an
uncertain quantity must be well-specified for a meaningful probability distribution to be
quantified.
The first stage of the invasion process, arrival, was represented in the model by
the “probability of arrival”. This uncertain parameter was defined as the probability that a
sufficient number of yellow perch (i.e., the minimum number required to create an
12
established population) will arrive in Shuswap Lake in the next 5 years. That minimum
number was unknown and was therefore based on expert opinion (see below). The
probability of arrival was further divided into “probability of arrival via human
introduction” and “probability of arrival via natural dispersal”; a separate probability
distribution for each of these parameters was elicited via a standardized questioning
procedure that is described below.
The establishment stage was represented in the model by a population growth
parameter, the “intrinsic rate of natural increase” or “intrinsic rate of population growth”
(r). This rate may be thought of as the per-capita reproductive rate minus the per-capita
death rate (or the net gain per year in number of fish divided by the number of adult fish
in the previous year). In this case, I was interested in the intrinsic rate of population
growth of yellow perch once they have arrived in Shuswap Lake.
The final stage of the invasion process, spread, was represented in the model by
the “rate of spread”. This uncertain parameter was defined as the rate (kilometres per
year) at which yellow perch spread throughout Shuswap Lake from their point of
introduction (Figure 1), once a minimum density of yellow perch is attained. The rate of
spread did not include spread via larval drift, but only the spread of adult yellow perch.
The spread of larval yellow perch due to lake currents has been identified as a major
dispersal vector for yellow perch in their native range (Beletsky et al. 2007), however, in
this case too little was known about the specific conditions in Shuswap Lake for experts
to have included this transport process in their estimates of the spread rate.

13
Elicitation of Expert Opinion
Workshop
In July 2008, I held a workshop in Kamloops, B.C., involving federal and
provincial fisheries scientists and managers who work on management of sockeye salmon
and/or invasive yellow perch in the Thompson region, B.C. The primary objective of the
workshop was to conduct a trial run of my expert elicitation procedure (see Part 1 of the
survey described below), so that adjustments could be made before distributing the
survey via e-mail to yellow perch experts in Canada and the United States. I also asked
workshop participants to define the ecological impact categories of a yellow perch
invasion in Shuswap Lake, i.e., what percent reduction in adult sockeye salmon would be
considered by managers to be a low, moderate, or high impact. Finally, I asked
participants to estimate the costs of alternative management actions included in my
analysis.
Survey
In addition to obtaining information at the workshop, I developed a two-part
written “Yellow Perch Risk Assessment Survey” that was sent out in August 2008 to 35
federal, provincial, and state fisheries scientists and managers, as well as university
fisheries scientists, who have experience with yellow perch in their native or introduced
ranges. These experts had previously been contacted and agreed to take part in the
survey. Experts were asked to extrapolate their experiences with yellow perch in other
study areas to this case study for Shuswap Lake. To assist experts in completing the
survey, it was accompanied by a lengthy background document containing the following
information: details about the design of the risk assessment model, expert elicitation

14
procedures and potential biases, current distribution of yellow perch in B.C., as well as
physical and biological characteristics of Shuswap Lake (because most survey
participants were not familiar with the lake).
The first part of the survey was designed to elicit probability distributions for each
uncertain parameter under each management action. A Bayesian view of probability was
used in which the probability of some parameter value was defined as the degree of belief
that a person has that the value is the true one in nature, given all the relevant information
currently known to that person (Morgan and Henrion 1990). Using the fixed probability
or fractile method (Morgan and Henrion 1990; Keeney and von Winterfeldt 1991;
DeWispelare et al. 1995), I elicited cumulative probability distributions (or cumulative
distribution functions (CDFs)) of the uncertain parameters, because this has been shown
to provide more consistent results than eliciting probability density functions (PDFs)
directly (Morgan and Henrion 1990; DeWispelare et al. 1995). I then converted these
CDFs into PDFs in order to input them into my risk assessment model. The fractile
method constructs CDFs by first eliciting the lower and upper bounds of the distribution.
Next I elicited the median of the CDF, which was the point of the uncertain quantity such
that the expert thinks that there is an equal chance (50/50) that the true quantity is above
or below that value. Once the median had been elicited, experts provided tails of the
distribution, the 0.01, 0.99, 0.05 and 0.95 fractiles. Two final fractiles, 0.25 and 0.75
(also known as quartiles), were elicited to improve the smoothness and shape of the
CDFs. Questions from Part 1 of the Yellow Perch Risk Assessment Survey can be found
in Appendix A, and an example of the Microsoft Office Excel spreadsheet template that I

15
provided for experts to work through the questions and record their responses can be
found in Appendix B.
The second part of the survey consisted of a brief on-line questionnaire designed
to elicit a variety of qualitative and quantitative information regarding the potential
behaviour of yellow perch once they arrived in Shuswap Lake. This information was used
primarily to inform my sensitivity analysis. For example, I asked experts to describe what
factors they believed could lead yellow perch to utilize the pelagic zone of Shuswap Lake
rather than the littoral zone. This question was important because it could help predict
what habitat yellow perch would utilize in the lake, and thus the potential impacts on
sockeye salmon as a result of competition/predation due to habitat overlap. I used a web-
based survey host called Survey Monkey to administer Part 2 of the survey. Questions
from Part 2 of the Yellow Perch Risk Assessment Survey can be found in Appendix D.
Model for Predicting Outcomes
Overview
This risk assessment model calculated probability distributions for the abundance
and spatial distribution of yellow perch in Shuswap Lake 10 years after arrival for each
expert under each alternative management action (Figure 2). Abundance was predicted by
simulating the dynamics of introduced yellow perch using the logistic growth model
(described below) and the intrinsic rate of increase values elicited from experts. Spatial
distribution was predicted by simulating the spread dynamics of introduced yellow perch
using an advancing-wave model (described below) and spread rates elicited from experts.
For each expert, nine points were selected from the elicited probability distributions for
the uncertain states of nature and used as input to the risk assessment model. The model

16
calculated the expected (weighted average) probability of yellow perch abundance and
spatial distribution by weighting results of the growth and spread models by the
probabilities (i.e., experts’ degree of belief) associated with each uncertain state of nature.
Probabilities of uncertain states of nature were multiplied through each branch of the
expanding decision tree (Figure 2) to determine the probability associated with
abundance values calculated using the growth model and spatial distribution values
calculated using the spread model. Due to the expanding decision tree, there were
thousands of outcomes for both abundance and spatial distribution for each expert under
each management action. The risk assessment model was run once for each expert under
each management action and probabilities of abundance and spatial distribution output by
the model were then grouped according to the impact categories described below. The
median probability across all experts of high ecological consequences and widespread
distribution were used to rank the management actions.
Growth model
Probability distributions for the intrinsic rate of increase (r) that were elicited in
Part 1 of the survey were used in my risk assessment model to simulate population
growth of yellow perch to determine the probability that yellow perch will achieve
particular abundance levels in Shuswap Lake 10 years after their arrival in the lake. Nine
values of r were selected from each experts’ elicited probability distribution for this
parameter (Figure C3 Appendix C) and were used as input to the growth model. Elicited
values were not aggregated or averaged when input into the model. Although invasive
species often display exponential population growth when they first enter a new habitat
(Stauffer 1984; Hengeveld 1989; Brown 1993), it was unrealistic to assume that there

17
would not be an environmental limit to yellow perch population growth in Shuswap Lake
and I therefore used a simple logistic growth model:
(1) Nt+1 = Nt + rNt(1-Nt/K) ,
where N0 was the initial number of yellow perch introduced into Shuswap Lake, r
was the intrinsic rate of population growth, and K was the environmental carrying
capacity of Shuswap Lake for yellow perch. Values for N0 and K were elicited from
experts in Part 2 of the survey; however, these elicited values for K were used to inform
sensitivity analyses only. The K value used in my main baseline analysis was estimated
using the photosynthetic rate (PR) model of lake productivity (Hume et al. 1996) (see PR
model details described below).
Spread model
The probability distributions for rate of spread elicited in Part 1 of the survey
were used in the risk assessment model to determine the probability that yellow perch
will achieve particular spatial distribution levels in Shuswap Lake 10 years after their
arrival, given that they establish in the lake. Nine values of rate of spread were selected
from each experts’ elicited probability distribution of this parameter (Figure C4
Appendix C) and were used as input to the spread model. Elicited values were not
aggregated or averaged so as to input them into this model. First, I calculated the distance
the yellow perch population spread from the initial point of introduction using the
following equation:
(2) D(t) = Ct ,
where D was the spread distance measured in kilometres, C was the rate of spread
measured in kilometres per year, and t was the number of years the population spread, in

18
this case 10 years. Because spread often begins only after the habitat occupied by the
initial invading population becomes filled (Hengeveld 1989; Crooks and Soule 1999), I
incorporated a lag-time into my spread model:
(3) D = C(t-tlag) ,
where tlag was the number of years it took the introduced yellow perch population to
reach a certain threshold density, or lag-density. This lag-density represented the level of
abundance yellow perch had to achieve in Shuswap Lake before they could begin to
spread throughout the lake. Lag-density was measured as the number of yellow perch per
square kilometre at the initial point of introduction. The time required for the introduced
yellow perch population to reach the lag-density was calculated using the logistic growth
model (described in the previous section) and thus depended primarily on the r values
elicited from experts. Higher estimates of r would lead to faster growth, and thus shorter
lag-times, whereas lower estimates of r would lead to slower growth and longer lag-
times. Values for lag-density were elicited from experts in Part 2 of the survey, and were
used to inform my sensitivity analyses.
By using ArcGIS along with the likely points of yellow perch introduction in
Shuswap Lake identified by workshop participants (Figure 1), I converted the linear
spread distance (D) output from my spread model into a two-dimensional measure of
spatial distribution. I defined spatial distribution as the proportion of suitable habitat in
Shuswap Lake inhabited by yellow perch following their establishment. Given that the
impacts on sockeye salmon would be potentially much greater if yellow perch utilize the
pelagic zone in addition to the littoral zone, I focused on the possibility of yellow perch
inhabiting both the littoral and pelagic zones of Shuswap Lake, and defined suitable

19
habitat as the entire surface area of the lake (i.e., 310 km2; the littoral zone accounts for
less than 12 % of the total surface area). I modelled this scenario only, and I did not
model a scenario in which yellow perch restricted themselves to the littoral zone. For this
reason, I converted the linear spread distance of yellow perch into the surface area
(measured in kilometres squared) inhabited by yellow perch 10 years after arrival.
Modelling spread in this way assumed that the range expansion of introduced
yellow perch was asymmetric from the point of introduction and that the population front
advanced at a constant velocity for the sake of simplicity (Hengeveld 1989; Shigesada
and Kawasaki 1997). This type of dispersal is known as the advancing-wave model of
spread, and has been observed in muskrats (Skellam 1951; Andow et al. 1990), sea otters
(Lubina and Levin 1988), and rabies (Murray et al. 1986). Usually this type of spread is
radially symmetric from the point of origin, however, if spread is impeded in some
directions by geographic barriers, it can become asymmetric (Andow et al. 1993). In my
case, the spread of yellow perch was confined within the relatively narrow lake basins
that obstructed radial spread. This situation led to an asymmetric spread that was
effectively linear along an arm of Shuswap Lake (Lubina and Levin 1988).
Photosynthetic Rate Model
I used the photosynthetic rate (PR) model as described in Hume et al. (1996) to
estimate the carrying capacity of yellow perch in Shuswap Lake and the abundance of
adult yellow perch that would lead to low, medium, and high impacts on adult sockeye
salmon as defined by workshop participants. Because of the lack of information about
interactions among yellow perch and sockeye salmon, I made the assumption that yellow
perch would consume the same amount of prey per unit biomass as the equivalent

20
biomass of juvenile sockeye salmon. Thus, the biomass of yellow perch that could be
supported by Shuswap Lake could be the same as the total biomass of juvenile sockeye
salmon produced by the lake if there were no sockeye. Note that this also assumes that
the yellow perch population will rely solely on the pelagic productivity of Shuswap Lake.
Based on Shuswap Lake’s productivity, as estimated by Shortreed et al. (2001), the PR
model can estimate the biomass of juvenile sockeye salmon (smolts) that the lake can
sustain. The first step was to estimate the maximum number of sockeye smolts produced
by Shuswap Lake each year:
(4) SNMAX = PRunits (SDMAX) ,
where SNMAX is the maximum annual smolt capacity for Shuswap Lake measured in
number of fish, PRunits is the number of PR units in Shuswap Lake, and SDMAX is
maximum density of smolts measured in number of fish per PR unit. There are 4098 PR
units in Shuswap Lake (Hume et al. 1996) and SDMAX has been observed to be 23,000
smolts per PR unit (Koenings and Burkett 1987). The next step was to convert maximum
smolt capacity into maximum smolt biomass:
(5) SBMAX = SNMAX(WMAX) ,
where SBMAX is the maximum annual smolt biomass measured in grams per year, and
WMAX is the average weight per smolt in Shuswap Lake measured in grams. For this
model, I used an average smolt weight of 2.4 g (Hume et al. 1996). In this way, I was
able to estimate the maximum perch abundance that could be supported by Shuswap
Lake:
(6) K = SBMAX/WAVG ,

21
where K is the carrying capacity of yellow perch in Shuswap Lake measured in number
of fish, and WAVG is the weighted average of yellow perch weight measured in grams.
For this model, I used a weighted average weight of yellow perch of 164 g, which was
calculated using age structure (Paukert and Willis 2001) and mean weight-at-age values
(Thorpe 1977) for yellow perch in their native range.
I was also able to use the PR model to predict what abundance of adult yellow
perch would reduce the adult sockeye salmon population produced by Shuswap Lake to
the levels defined by the low, moderate, and high impact categories. The first step was to
estimate adult sockeye salmon escapement:
(7) SMAX = PRunits(EDMAX) ,
where SMAX is the predicted optimum total adult escapement in Shuswap Lake measured
in number of fish, and EDMAX is the maximum escapement density measured in fish per
PR unit. EDMAX has been observed to be 475 spawners per PR unit (Koenings and
Burkett 1987). Note that this method also implicitly assumes that there is no density-
dependent survival of sockeye salmon between the juvenile stage in the lake and the time
when mature adults return to coastal fishing areas, an assumption supported by another
Fraser River sockeye population, Chilko Lake, for which the decades of data on smolt-to-
adult survival rates show no density dependence (Hume et al. 1996). Then I estimated the
percentage reduction in adult sockeye salmon resulting from various abundances of
yellow perch using the following two equations:
(8) SR = (SMAX/SNMAX)((SBMAX – (KACT/WAVG))/WMAX) ,
(9) P = SR/SMAX ,
22
where SR is the number of adult sockeye salmon population produced by Shuswap Lake
when the abundance of yellow perch in the lake is equal to KACT, measured in number of
fish. P is the percent reduction in the adult sockeye salmon population as a result of
specific yellow perch abundance (KACT) in Shuswap Lake. It was not necessary to include
uncertainty in these PR model calculations because any uncertainty in the predicted
baseline K value would not have influenced results of this analysis (see results of
sensitivity analysis below).
Performance Measures
The overall impact of an invasive species is related to its abundance as well as its
total area occupied (Parker et al. 1999). In my case, the impact or “ecological
consequences” of a yellow perch invasion in Shuswap Lake was based solely on the
abundance of yellow perch in the lake. Ecological consequences were measured in terms
of the proportional reduction in adult sockeye salmon produced by Shuswap Lake as a
result of yellow perch abundance. There were four possible categories of ecological
consequences, as defined by workshop participants: high, moderate, low, and no impact.
The corresponding abundances of yellow perch that would result in these impact
categories were determined using the PR model (described above). Yellow perch
abundance was used as the sole indicator of ecological consequences, while spatial
distribution was used only as a qualitative indicator of “potential impacts” on sockeye
salmon because no direct relationship could be drawn between spatial distribution and the
reduction of adult sockeye salmon. The spatial distribution of yellow perch was
categorized as widespread, moderate spread, localized spread, and no spread. These
categories were defined using expert opinion and implicitly assumed that the greater the
23
spatial distribution of yellow perch, the greater the potential impacts on sockeye salmon.
More detailed measures of ecological consequences were not easily quantifiable at this
stage due to the complex ecological interactions about which little is known. I therefore
limited by analysis to these two measures of impact.
Sensitivity Analyses
I undertook sensitivity analyses to look at the effects of various uncertain
parameters in the growth and spread models on the rank order of management actions.
First, in addition to using the baseline K value estimated by the PR model, I ran
simulations with a range of K values, as well as various lag-densities elicited from
experts. Sensitivity analyses illustrate for fisheries managers how changes in these
assumed parameters affect magnitudes of tradeoffs between expenditures on yellow-
perch control actions and probability for each of several magnitudes of ecological
consequences and potential impacts.
Results
Expert Elicitation
Workshop
At the workshop, the six participants defined ecological consequences of a yellow
perch invasion in Shuswap Lake in terms of the proportional reduction in abundance of
adult sockeye salmon. Participants defined a low impact as a less than 1 percent decrease
in adult sockeye salmon abundance, a moderate impact to be between 1 and 5 percent
reduction, and a high impact to be anything greater than a 5 percent reduction in adult
sockeye abundance (Table 2). These relatively small percentage reductions are important

24
because they actually represent a large number of adult sockeye salmon and thus
potentially large economic and ecological losses. For example, a 5 percent reduction in
abundance would represent 500,000 adult sockeye in years when Fraser River sockeye
returns are 10 million. The workshop participants also provided feedback on Part 1 of the
survey (Appendix A), and identified a number of questions that were subsequently
inserted into Part 2 of the survey (Appendix D). The locations representing the most
likely points for the introduction of yellow perch in Shuswap Lake were identified as
follows: (A) the outlet of the Adams River in the Main Arm, (B) the outlet of the Salmon
River in Salmon Arm, and (C) the outlet of the Eagle River and Mara Lake in Salmon
Arm (Figure 1). Point A was used as the primary (baseline) point of introduction for the
spread model because yellow perch have been observed upstream in Adams Lake,
whereas Points B and C were used as alternative points of introduction in my sensitivity
analysis.
Survey
I also received eight written responses to Part 1 of the survey, all of which were
from fisheries scientists and managers who were not at the workshop but who are also
familiar with native yellow perch populations, primarily in Ontario, Ohio, and Michigan.
Probability distributions for the uncertain parameters elicited in Part 1 are summarized in
Figures C1, C2, C3, and C4 in Appendix C. The wide range of probability distributions
elicited from experts indicates how much uncertainty there is regarding the invasion of
yellow perch in Shuswap Lake, particularly regarding the probability of arrival (Figures
C1 and C2).

25
I received eleven written responses to Part 2 of the survey, only two of which
were from fisheries scientists and managers familiar with non-native yellow perch
populations in their introduced range; the rest of the respondents work in the native
range. Key results from Part 2 are summarized in Table 3. In Part 2 of the survey, experts
provided estimates of the initial number of yellow perch (N0) they believed would be
necessary for perch to successfully reproduce and establish in Shuswap Lake. Recall that
the probability of arrival was defined as the probability that a sufficient number (i.e., N0)
of yellow perch will arrive in Shuswap Lake in the next 5 years. Two experts believed it
would take less than 10 yellow perch to establish a reproducing population, while one
expert believed it would take more than 100. The other eight experts were split; five
experts believed it would take between 10 and 50 individuals, while the other three
believed it would take between 50 and 100 yellow perch to successfully establish a
population in Shuswap Lake. The N0 values used as the initial starting values for the
logistic growth model for the experts are shown in Table 4.
Experts also provided minimum and maximum estimates of carrying capacity (K)
of yellow perch in Shuswap Lake in Part 2. Their responses were quite varied, with
minimum estimates ranging from 31,000 to 3,100,000 fish, and maximum estimates
ranging from 155,000 to 15,500,000 fish (Table 3). I drew upon this range of estimates to
inform my sensitivity analysis. In addition to carrying capacity estimates, experts
provided estimates of lag-density (i.e., the abundance of yellow perch required before the
population begins to spread) of yellow perch in Shuswap Lake. Once again the responses
were varied, with minimum estimates ranging from 500 to 12,500 fish, and maximum

26
estimates ranging from 10,000 to 22,000 fish (Table 3). I again drew upon this range of
estimates to inform my sensitivity analysis.
Survey participants were split on their views regarding whether yellow perch
would inhabit the littoral and/or pelagic zone of Shuswap Lake. Four out of eleven
experts believed that adult yellow perch would inhabit both littoral and pelagic zones,
while the other seven experts believed adult yellow perch would be limited to the littoral
zone of Shuswap Lake. If yellow perch do utilize the pelagic zone in Shuswap Lake, six
experts believed they would most likely to be found at depths between 5 and 10 meters,
while three experts believed they would occupy depths greater than 10 meters (Table 3).
Risk Assessment Model
Median Probability of Ecological Consequences from Yellow Perch Abundance
Based on the photosynthetic rate (PR) model (Hume et al. 1996) I calculated the
carrying capacity (K) of yellow perch in Shuswap Lake to be approximately 1,380,000
yellow perch, which I used as the baseline value used in the logistic growth model
(equation 1), along with experts’ r values, to calculate the abundance of yellow perch in
Shuswap Lake 10 years after arrival. I also used the PR model, along with definitions of
high, moderate, and low impacts on adult sockeye salmon abundance defined by
workshop participants, to determine that an abundance of less than 20,000 yellow perch
would lead to a low impact on adult sockeye salmon abundance, an abundance between
20,000 and 75,000 would lead to a moderate impact, and a yellow perch population
greater than 75,000 would lead to a high impact on sockeye salmon (Table 2). Recall that
I made the assumption that the biomass of juvenile sockeye salmon produced by
Shuswap Lake could equal the total biomass of yellow perch that could be supported by

27
the lake if there were no sockeye. In this way, I was able to use the PR model to predict
what abundance of adult yellow perch would reduce the adult sockeye salmon population
produced by Shuswap to the levels defined by the low, moderate, and high impact
categories.
Results of the risk assessment (decision analysis) model indicate that the “No
Action” management option has the highest median probability (0.59, as calculated
across all experts) that a yellow perch invasion will have high ecological consequences,
while the “Four Management Actions” option has the lowest median probability (0.14) of
those consequences (Figure 3). The “No Action” option also has the lowest median
probability (0.15) that yellow perch will have no impact on sockeye salmon, while the
“Four Management Actions” option has the highest median probability (0.44) of no
impact (Figure 3). No impact means the abundance of yellow perch was zero 10 years
after arrival, and represents both the probability that yellow perch do not arrive in
Shuswap Lake and the probability that the population of yellow perch in Shuswap Lake
collapses as a result of density-dependent effects. Although the “Three Management
Actions” option performs nearly as well as the “Four Management Actions” option, the
median probability (0.42) of high ecological consequences under this option is still
relatively high and much higher than that for the “Four Management Actions” case.
The “Education” and “Enforcement” management actions appear to perform
similarly, and are only slightly better than the “No Action” option at reducing the
probability of high ecological consequences (Figure 3). The “Rotenone” and “Physical
Removal” actions perform better than “Education” and “Enforcement”, but it is
ultimately the combination of all four management actions, the “Four Management

28
Actions” option, that best achieves the reduction of ecological consequences resulting
from a yellow perch invasion in Shuswap Lake (Figure 3). Therefore, the “Four
Management Actions” option best satisfies the management objective of minimizing the
abundance of yellow perch in Shuswap Lake 10 years after arrival.
Median Probability of Yellow Perch Spatial Distribution
The logistic growth model and a lag-density of 5,000 fish were used to determine
the lag-time (tlag) input into the spread model (equation 3) to calculate the spatial
distribution of yellow perch in Shuswap Lake 10 years after arrival; that distribution was
also categorized according to potential impact on sockeye salmon. Expert opinions
obtained from the on-line survey indicated that a spatial distribution of yellow perch less
than 25 per cent of the surface area of Shuswap Lake would be considered localized
spread, while a spatial distribution between 25 and 50 per cent would be moderate spread,
and a yellow perch distribution of greater than 50 per cent of the surface area of Shuswap
Lake would be considered widespread (Table 5).
Results of the risk assessment model indicate that the “No Action” management
option has the highest median probability (0.44, as calculated across experts), that a
yellow perch invasion will have widespread distribution, while the “Four Management
Actions” option has the lowest median probability (0.24) of a widespread invasion
(Figure 4). The “No Action” option also has the lowest median probability (0.25) that
yellow perch will not spread from their point of introduction, while the “Four
Management Actions” option has the highest (0.62) for the no-spread outcome (Figure 4).
No spread means the spatial distribution of yellow perch was zero 10 years after arrival,
and represents both the probability that yellow perch do not arrive in Shuswap Lake and

29
the probability that they do not spread from their point of introduction (either because
they do not surpass the lag-density or because they have a spread rate of zero).
The “Education” and “Enforcement” management actions appear to perform
nearly equally, and are only slightly better than the “No Action” option at reducing the
probability of widespread distribution and increasing the probability of no spread (Figure
4). The “Rotenone” and “Physical Removal” actions once again perform better than
“Education” and “Enforcement”, but it is ultimately the combination of all four
management actions, the “Four Management Actions” option, that best satisfies the
management objective of minimizing the spatial distribution of yellow perch in Shuswap
Lake 10 years after arrival (Figure 4).
Management Costs
The costs of dealing with invasive yellow perch in B.C. would be incurred
primarily by the provincial government, more specifically the Ministry of the
Environment (MOE), which is charged with managing inland fisheries in the province.
However, there is the possibility that the federal government could be involved in sharing
some costs because DFO is responsible for salmon management in B.C. Some
management costs have already been incurred by MOE (Table 6).
Costs included in this analysis were estimated by workshop participants and are
all given in Canadian dollars. The “Education” and “Enforcement” management actions
had the lowest annual costs, estimated at $50,000 per year and $250,000 per year,
respectively (Table 6). The annual cost of “Education” included the cost of educational
materials (i.e., posters, brochures, key chains and signs), the cost of the “Report All
Poachers and Polluters (RAPP)” information van attending 12 community events, as well

30
as the labour costs involved in preparing documents and presentations, and attending
public meetings. In addition to the yearly cost of the “Education” action, there would also
be a one-time cost of $20,000 for the development of an education program for schools.
The implementation costs of this program were unknown.
The annual cost of “Enforcement” included the salary of one additional
conservation officer and their transportation costs (i.e., truck, boat, and gasoline). If two
additional conservation officers were hired, then the annual costs of the “Enforcement”
action would double. Also included in this management option was the possibility of
paying out a $20,000 reward for information leading to the conviction of someone
transporting and dumping non-native fish species (Table 6).
The “Rotenone” management action was estimated to cost $380,000 per year over
4 years in order to treat all the lakes in the Thompson region that contain yellow perch
and have potential downstream connections to Shuswap Lake (Table 6). This included
Skmana Lake ($200,000), Forest Lake ($250,000), Nellies Lake ($30,000), and Gardom
Lake ($550,000), as well as Phillips, Fleming, Skimikin, and Miller Lakes ($500,000).
The cost of the “Rotenone” action included not only the cost of the chemical itself, but
also the cost of all the necessary equipment (e.g., boats, trucks, and sprayers), fuel, food,
and water for citizens residing on the lake.
The “Physical Removal” management action was estimated to cost between
$250,000 and $500,000 per year (Table 6). The cost of this action would depend heavily
on the specific removal method used to catch yellow perch in Shuswap Lake (i.e.,
gillnetting, trapping etc.) and the effort necessary to remove a sufficient number of
yellow perch (i.e., enough yellow perch to reduce population growth and limit spread).

31
The two combinations of management actions that were explored had higher
financial costs than the previously described options (Table 6). The combination of
“Education”, “Enforcement”, and “Rotenone” was estimated to cost between $680,000
and $930,000 per year for the first 4 years, after which time, the cost would decrease to
between $300,000 and $550,000 per year. The final management action, a combination of
“Education”, “Enforcement”, “Rotenone”, and “Physical Removal”, was the most costly
option, estimated at $930,000 to $1,430,000 per year for the first 4 years, after which
time the cost would decrease to between $550,000 and $1,050,000 per year.
Sensitivity Analysis
Median Probability of Ecological Consequences from Yellow Perch Abundance
I conducted several sensitivity analyses to investigate the impact of certain model
parameters on the results of the risk assessment model. I investigated a range of possible
carrying capacity (K) values for yellow perch in Shuswap Lake, including 31,000,
155,000, 775,000, 3,100,000, and 7,750,000, in addition to the baseline K value
(1,380,000) that I calculated from the PR model. Results of this analysis indicate that the
K value used in the logistic growth model does not alter the outcome of the risk
assessment model and in terms of the rank order of management actions (Table 7). When
the carrying capacity of yellow perch was 775,000 (Figure 5A), approximately half the
baseline K value, the median probability across all experts of high, moderate, low, and no
impact is nearly identical to that calculated using K equal to 1,380,000 (Figure 3) and the
rank order of actions is identical to the baseline case (Table 7). When the carrying
capacity of yellow perch increased to 3,100,000 (Figure 5B), approximately double the

32
baseline K value, the results are again quantitatively similar to the original analysis, and
the rank order of actions is identical to the baseline case (Table 7).
Median Probability of Yellow Perch Spatial Distribution
I investigated the spatial distribution of yellow perch in Shuswap Lake using two
alternative points of introduction (Points B and C), in addition to the baseline point of
introduction (Point A) identified by workshop participants (Figure 1). Results indicate
that the point of introduction used in the spread model does not alter the outcome of the
risk assessment model and does not alter the rank order of management actions (Table 7).
The median probability across all experts of widespread, moderate, localized, and no
spread spatial distributions resulting from spread originating at Point B (Figure 6A) is
almost identical to that calculated in the baseline case (Figure 4). Although spread
originating at Point C (Figure 6B) has an increased probability of widespread distribution
under each management action compared to spread originating from Points A and B, the
rank order of actions does not change from the baseline case and the “Four Management
Actions” option continues to perform best (Table 7).
I also investigated a range of possible lag-density values for yellow perch in
Shuswap Lake, including 500, 2,500, 10,000, and 15,000 fish, in addition to the baseline
value (5,000) calculated using the PR model. Results indicate that the lag-density (and
thus corresponding lag-time value used in the spread model) only barely alters the
outcome of the risk assessment model and does not substantially change the rank order of
management actions from the baseline case (Table 7). For instance, when the lag-density
of yellow perch was 2,500 fish (Figure 7A) the median probability across all experts of
widespread distribution is only slightly higher than that calculated using a lag-density of
33
5,000 (Figure 4), while the median probability of widespread distribution calculated
using a lag-density of 10,000 (Figure 7B) is slightly lower. Despite these changes in the
probability of different spatial distributions, the changes were small and the rank order of
management actions is about identical to the baseline analysis (Table 7).
Discussion
Overview of Results
Results from this quantitative risk assessment indicate that the consequences of a
yellow perch invasion in Shuswap Lake would be best mitigated by undertaking a
combination of “Education”, “Enforcement”, “Rotenone”, and “Physical Removal”, i.e.,
the “Four Management Actions” option. This management action performs best in terms
of meeting the management objectives of minimizing the abundance and spatial
distribution of yellow perch in Shuswap Lake 10 years after introduction because it
addresses all three stages of the invasion process. While this action has the highest
implementation costs of all the management actions, it reduces (compared to the “No
Action” option) the median probability across all experts of high ecological consequences
nearly three times as much as the “Three Management Actions” and the “Rotenone”
actions. At the same time, this “Four Management Actions” option increases the median
probability of no impact to nearly triple the value of the “No Action” option. The “Four
Management Actions” option also reduces the median probability of widespread
distribution of yellow perch in Shuswap Lake to nearly half that of the “No Action”
option, although this reduction is about equal to that achieved by the “Three Management
Actions” and the “Rotenone” actions. The “Four Management Actions” option also

34
increases the median probability of no spread to over twice that of the “No Action”
option.
The poor performance of the “Education” and “Enforcement” management
actions indicates that experts believe that either these actions would be ineffective at
reducing the human introduction of yellow perch into Shuswap Lake or that the human
introduction of yellow perch does not represent a significant threat and thus preventing it
would not change the probability of ecological consequences. This belief is embedded in
the experts’ survey responses and thus reflected in the model results. The slightly better
performance of the “Rotenone” action (which successfully increased the probability of no
impact and reduced the probability of high impact) indicates that experts believe that
either the “Rotenone” action is very effective at reducing the natural dispersal of yellow
perch into Shuswap Lake or that the natural dispersal of yellow perch does in fact
represent a significant threat and thus preventing it would actually reduce the probability
of ecological consequences. Once again this belief is embedded in the experts’ survey
responses and thus is reflected in the model results. The combination of “Education”,
“Enforcement”, and “Rotenone”, i.e., the “Three Management Actions” option,
outperforms each of these individual actions because it reduces both the human and
natural introduction of yellow perch into Shuswap Lake.
Results of this analysis are predicated on the assumption that yellow perch will
inhabit the pelagic zone of Shuswap Lake, and thus impact sockeye salmon directly
through competition for limited resources. Expert opinion indicates that there is
considerable uncertainty regarding the pelagic life history of yellow perch, however, this
was uncertainty was not quantitatively taken into account in this analysis. Based on

35
survey responses (where 7 out 11 experts believe yellow perch will be limited to the
littoral regions of Shuswap Lake) there is actually a higher probability that yellow perch
will not utilize the pelagic zone of Shuswap Lake, and thus the results of this analysis
indicate a worst-case scenario in terms of the impacts on sockeye salmon. That is, if
yellow perch do not inhabit the pelagic zone, as was assumed in this analysis, then the
impacts on sockeye salmon could be potentially less than predicted by this study.
However, there could still be impacts on other salmon species such as chinook and coho,
which utilize the littoral regions of Shuswap Lake more extensively than sockeye.
Results indicate that ranking of management actions is not sensitive to carrying
capacity or lag-density. This is likely because of the relatively short time horizon (10
years) of the logistic growth model. If I simulated yellow perch population growth over
20 or 30 years, the carrying capacity would likely have more of an effect on the outcome
of the model, particularly with lower values for the intrinsic rate of increase.
Expert Elicitation
These clear results emerged despite the wide range of expert opinions about the
probabilities of arrival via natural or human introductions, the intrinsic rate of population
growth of yellow perch, and the rate of spread of yellow perch. The wide range of expert
opinion shows either (a) that the survey questions were unclear, or (b) more likely, that
there is simply too little concrete evidence for experts to draw upon, i.e., not enough is
known about the specific situation in Shuswap Lake. The latter is not entirely
unexpected, because yellow perch have highly variable life history traits and population
growth rates are very dependent on the specific environment (Thorpe 1977; Craig 1987).
Without adequate knowledge of the Shuswap Lake system, it is possible that even

36
fisheries scientists and managers with extensive knowledge of yellow perch would still be
very uncertain as to how yellow perch would behave when introduced into this B.C. lake.
From a methodological perspective, the wide range of responses could also
signify the presence of bias, either cognitive or motivational. When conducting expert
elicitation, it is important to be aware of potential biases because they can degrade the
quality of data collected and may affect the credibility of the project (Cooke 1991; Meyer
and Booker 1991). In order to minimize bias, experts were informed via my written
background document about the most likely cognitive and motivational biases they would
encounter when taking part in the survey so that they could take necessary steps to
overcome these biases. In particular, they were told that the most likely cognitive biases
encountered by experts in a survey can arise from inconsistency, availability (knowledge
of the situation), anchoring (providing answers close to the surveyor’s initial example),
and underestimation of uncertainty (Cooke 1991; Meyer and Booker 1991). In contrast,
the most likely motivational biases encountered by experts are wishful thinking (experts’
hopes or involvement in the area on which they are being questioned influence their
responses), impression management (experts’ imagination of how those not physically
present, such as supervisors, might view their responses) and misinterpretation (Cooke
1991; Meyer and Booker 1991). Unfortunately, there is no way to know for sure whether
these biases affected the probability distributions elicited here. Thus, the possibility that
they did must be acknowledged and taken into consideration when interpreting the results
of this study. It should also be noted that these results are based on a relatively small
sample size for studies of this type, but it still represents the most detailed risk assessment
for invasive yellow perch in Canada.

37
Experts were divided in their belief about whether yellow perch would inhabit the
pelagic zone of Shuswap Lake. According to the experts, the most likely factors that
would lead yellow perch to become pelagic are higher prey abundances and fewer
predators in the pelagic zone, as well as high temperatures in the littoral zone. Experts
also believe that yellow perch may become pelagic as a result of high population density;
one expert even described the abundance of yellow perch in the pelagic zone as an
“increasing linear function of the overall population density”. In contrast, other experts
cite the deep oligotrophic offshore waters and the presence of large predators in pelagic
zone (e.g., lake trout) as the primary reasons they believe yellow perch will restrict
themselves to the littoral regions of Shuswap Lake. High summer temperatures in the
littoral zones of Shuswap Lake could lead yellow perch to utilize the pelagic zone leading
to overlap in habitat with sockeye, chinook, and coho salmon. Despite these conflicting
opinions, for the purposes of this model, it was assumed that yellow perch will utilize
both the littoral and pelagic zones of Shuswap Lake, and thus overlap habitat with
sockeye salmon in the lake. Although sockeye juveniles spend some time in the littoral
areas of Shuswap Lake, they usually move offshore into the pelagic zone to feed and
avoid high summer temperatures (Russell et al. 1980; Williams et al. 1989). Chinook and
coho salmon generally use the littoral areas of Shuswap Lake more extensively than
sockeye, but also move into pelagic areas to avoid high summer temperatures (Graham
and Russell 1979; Russell et al. 1980).
One non-biological lesson learned from this research is that expert elicitation of
complex quantitative information is very difficult to obtain via a mail-out survey. While I
received positive feedback from participants regarding the clarity and detail of the

38
background information and the survey instructions and questions, many experts thought
that there was an overwhelming time commitment expected to complete Part 1 of the
survey. In the future, I believe this form of complex information would be best elicited in
person, either in a one-on-one or group setting such as the successful workshop in
Kamloops. This would alleviate any confusion caused by lengthy written instructions,
and would make it easier for experts to ask questions and have them answered
immediately. If funds had permitted, it would have been best to gather all the experts
from Canada and the United States for a one-day workshop, but the limited project
budget precluded this step.
Invasive Species Management
The results of the risk assessment model strongly support the actions currently
being taken by MOE to inhibit the introduction of yellow perch into Shuswap Lake.
However, if yellow perch do make their way into the lake, managers will have to make
the trade-off between the cost of controlling invasive yellow perch via “Physical
Removal”, one of the most costly single management actions, and the economic and
ecological costs of lower abundance of adult sockeye salmon populations produced by
Shuswap Lake. Although the “Physical Removal” option has the same probability of no
impact as the “No Action” option (because no action would be taken to prevent the
arrival of yellow perch), the “Physical Removal” option has a much higher probability of
low impact and a much lower probability of high impact than the “No Action” option.
This indicates that experts believe if yellow perch are introduced into Shuswap Lake,
their population growth could be controlled by physical means in order to reduce the
negative impacts on sockeye salmon.

39
Model results also indicate that once yellow perch arrive in Shuswap Lake,
preventing them from spreading throughout the lake might be somewhat difficult. This is
indicated by the very low probabilities of localized and moderate spread compared to the
much higher probabilities of widespread spatial distribution across all management
actions. It appears that management actions such as the “Four Management Actions”
option, increase the probability that yellow perch will not spread throughout the lake,
presumably by controlling their abundance to the point that the population is unable to
surpass the lag-density within the 10 year time period. However, if yellow perch do
surpass the lag-density and begin to disperse, it is more probable that they will become
widespread throughout the lake than remain localized. This is due to the rather high rates
of spread elicited from experts, and the belief that “Physical Removal” will not
necessarily be successful at containing a yellow perch population in Shuswap Lake.
Although piscicides such as rotenone are the most successful means of eradicating
invasive freshwater fishes, if applied to Shuswap Lake, rotenone would have devastating
impacts on important native fish species including sockeye salmon, because it is not a
species-specific toxin. Therefore, if prevention fails and yellow perch are introduced into
Shuswap Lake, physical removal methods are the only feasible options for eradication
and control. Such methods for invasive fish generally include gillnetting, purse seining,
trapping, and electrofishing. Often the combination of different methods is an effective
strategy and should be considered when planning eradication and control efforts. The
effectiveness of physical removal methods is also important, particularly when the
density of the target species is at (or decreases down to) very low levels. Predicting the
effort required to achieve eradication can be difficult because the removal of the very last

40
individual can require significant efforts and resources. Larger water bodies with more
widespread distribution of invasive fish will require more effort for eradication than a
smaller lake with more localized distribution of invasive fish. Regardless of the size of
the water body, eradication efforts will be most successful if they are started in the early
stages of invasion, when the population is smaller and more localized. When control
activities are delayed, eradication often becomes infeasible, if not impossible. If
eradication is not feasible, management of the AIS by controlling its population and
attempting to slow or halt its geographic spread may be the only other option. Thus,
based on the results of this analysis, complete eradication of yellow perch from Shuswap
Lake does not appear likely, but physical removal efforts to control and contain yellow
perch may be effective at reducing the ecological consequences of invasion. Physical
removal efforts do have the potential to affect non-target species, and thus careful
consideration should be given to the potential “by-catch” of different removal methods
when planning eradication of yellow perch in Shuswap Lake.
Eradications are often viewed as extremely costly endeavours, and indeed many
such campaigns have required huge monetary resources, e.g., Lake Davis, California
(Julie Cunningham, California Department of Fish and Game, Portola, California,
personal communication). One of the problems in assessing how much eradications will
cost is that the available literature often does not report such data, and results of removal
projects carried out in the early stages of invasions are often not published at all. Trade-
offs exist between costs of eradication and control, and the costs of impacts and damages
caused by invasive species. In order to justify the costs of eradication and control of
invasive species, the benefits also need to be considered, and balanced against the cost of

41
eradications. This is the reason I have included estimates for the cost of each
management action in this analysis, to help managers make decisions about which actions
to take, and when to start. By comparing the costs of management actions and their
effectiveness at reducing high ecological consequences of yellow perch invasion,
managers should be better prepared to make decision about what action to take. It is
estimated that the “Physical Removal” action could cost between $250,000 and $500,000
CDN every year until yellow perch are eradicated from the Shuswap Lake. If eradication
of yellow perch is not possible, these efforts might need to continue indefinitely to
control the abundance and spread of yellow perch, or at least as long as those efforts are
effective at mitigating the impacts of invasive yellow perch on sockeye salmon. The
highest ranked management scenario, the “Four Management Actions” option, which
includes “Physical Removal”, is estimated to cost between $925,000 and $1,425,000
CDN per year, but is significantly better at reducing the median probability of high
ecological consequences.
Update
When the survey was distributed in August 2008, the populations of yellow perch
most closely connected to Shuswap Lake were in Hiuihill and Sinmax Creeks (Runciman
and Leaf 2008). In early September 2008, MOE confirmed the presence of yellow perch
in Adams Lake, a major sockeye salmon producing lake directly connected to Shuswap
Lake via the Adams River. Six yellow perch were caught in Adams Lake in 2008 and
five more perch have been caught in the lake as of July 2009. All yellow perch were
found approximately 10 km south of Squaam Bay/outlet of Sinmax Creek. Although I
can only speculate how this information may have changed the survey responses, it is

42
very possible that experts would have had a higher degree of belief in higher estimates
for the probability of arrival via natural dispersal of yellow perch, which in turn would
have increased the probability of ecological consequences for sockeye salmon.
Recommendations for Future Action and Future Research
The uncertainties about inputs to this risk assessment model strongly suggest
some recommendations for top research priorities for future data collection. Based on the
results of this analysis and the uncertainty regarding the impacts that yellow perch will
have on sockeye salmon if they establish in Shuswap Lake, I recommend the following
research priorities:
1) Long-term sampling in Adams Lake to monitor the abundance of yellow
perch in the lake and rate of spread
2) MOE should take steps to prevent the spread of yellow perch from Adams
Lake to Shuswap Lake
3) Long-term sampling in Shuswap Lake to monitor the presence/absence of
yellow perch in the lake
Sampling in Adams, Shuswap, and Mara Lakes by the Secwepemc Fisheries
Commission and DFO began in 2007. The results of my analysis encourage continued
sampling in Adams Lake to estimate from field observations some of the key parameters
of this model (i.e., intrinsic rate of increase (r) and rate of spread). It has been shown that
the establishment of NIS is less likely if the intrinsic rate of increase (r) of that species is
small (Lawton and Brown 1986), making the intrinsic rate of increase perhaps the most
critical parameter in this risk assessment model. The range of r values elicited from
experts shows that there is uncertainty as to what the value of this parameter will be in

43
Shuswap Lake. Thus, a good estimate of this parameter by undertaking sampling would
provide managers with more accurate predictions of yellow perch abundance if they
arrive in Shuswap Lake, and thus more accurate predictions of the potential impacts on
sockeye salmon even if uncertainty about this parameter did not affect the rank order of
management options.
Data collected from Adams Lake is being used to estimate the age structure of an
invasive yellow perch population, which will also help estimate the intrinsic rate of
increase if the number of new recruits to the yellow perch population could be
determined each year. Recruitment in yellow perch is known to be quite variable and
understanding recruitment of yellow perch in B.C. lakes could also help to more
accurately model the population growth of yellow perch in Shuswap Lake. Sampling in
Adams Lake should also be carried out to determine whether yellow perch inhabit the
littoral and/or pelagic zones of the lake, because the results of the survey indicate that
experts are split over whether adult yellow perch will become pelagic in Shuswap Lake
or remain only in the littoral zone. This is important because it would help determine
whether yellow perch would have a direct habitat overlap and competition for food with
sockeye salmon juveniles in Shuswap Lake, as I assumed in this model.
The presence of yellow perch in Adams Lake no doubt poses a threat to Shuswap
Lake because the probability that yellow perch will be introduced into Shuswap Lake is
probably even greater than that estimated by experts in my study as a result of the
increased proximity of yellow perch to that lake. In turn, the probability of ecological
consequences could be higher than determined by this analysis. Given this information,
MOE will likely want to take urgent steps to prevent the natural spread of yellow perch

44
from Adams Lake into Shuswap Lake. Due to the presence of juvenile sockeye salmon in
Adams Lake, rotenone is not a realistic method to employ in this situation, and the
physical removal of yellow perch is likely the only feasible methods for control and
containment in this situation. This scenario was not included in my analysis because at
the time there were no yellow perch populations upstream from Shuswap Lake that could
not feasibly be eradicated using rotenone. In this analysis, physical removal was only
considered as a management action to deal with yellow perch once they arrived in
Shuswap Lake, not to prevent their arrival in Shuswap Lake.
Sampling in Adams Lake will also provide fisheries managers with the
opportunity to track the rate of spread of yellow perch and experiment with different
methods to physically remove yellow perch. Experimental control and containment
activities aimed at preventing a yellow perch population explosion in Adams Lake would
indicate the most effective physical removal methods and what amount of effort and
financial support would be needed to eradicate yellow perch, or at a minimum keep
population levels low. This information would be very useful if and when yellow perch
make their way into Shuswap Lake, and control and containment activities become
necessary. Long-term sampling in Adams Lake will also provide an index of abundance
and measure the relative effectiveness of proposed control and containment efforts. These
experimental removals would also allow MOE to employ an adaptive approach to
invasive yellow perch that is responsive to changes, new information, and new
approaches. Different physical removal methods that MOE could experiment with
include encircling nets (drag nets and purse seines), fyke nets, and gill nets, as well as
electrofishing to herd yellow perch towards nets. Various combinations of these actions

45
should also be investigated. Finally, my analysis encourages continued sampling in
Shuswap Lake to monitor the presence of yellow perch, so that physical removal efforts
can begin immediately upon their discovery in the lake.
Although including the cost of various management actions in this analysis is one
step in the right direction, a more comprehensive economic assessment of this situation
would, in particular, assess the cost of reduced salmon populations. This step would also
assist managers in making decisions about what action to take, and when to begin. This
type of economic information would be beneficial in order to put an economic value on
the different impact categories. For example, if the cost of a 5% proportional reduction in
the abundance of adult sockeye salmon produced by Shuswap Lake could be defined, it
could be compared to the cost of the various management actions. The probability of
each management action reducing high impacts could also be considered, and managers
would thereby be better prepared/have more information to use when making decisions
about which action to take. They would also be able to better determine whether the
additional cost of one action over another is worthwhile in terms of the additional
reduction in the impact on sockeye salmon.
Future research should also focus on modelling the complex interactions between
yellow perch and salmon through food web, bioenergetics, and/or predator-prey models.
Ecological niche modelling at the lake level could also give more predictive information
about habitat use of yellow perch in Shuswap Lake, as would a spread model based on
habitat characteristics.
In conclusion, this research project illustrates the value of structuring complex
problems, such as the risk assessment of yellow perch invading Shuswap Lake, in terms

46
of a quantitative framework like decision analysis. There are several uncertainties, yet
ranking of management options is still possible. Equally important is the ability of
decision analysis to stimulate discussion and clarify thinking about all components of the
system, ranging from clear articulation of management objectives that have measurable
indicators, to identification of system components about which little is known but which
are critically important (such as the probability that the yellow perch will be pelagic and
thereby compete with juvenile sockeye salmon, as opposed to occupying the littoral zone,
where they will not be competitors with sockeye). Much work needs to be done to
improve assumptions and estimates of quantities that were used as inputs to this model,
and it is hoped that this initial model structure will provide a framework for guiding
future research, as well as developing an improved model.

47
Tables

48
Table 1. Descriptions of managem
ent actions included in this analysis and stages of invasion they are intended to control.
Action taken to control:
Managem
ent
actions
Arrival in
Shusw
ap Lake
Abundance
(survival and
reproduction)
Spatial
distribution
(spread)
Description
No Action
In this option, no action would be taken by provincial fisheries managers to
prevent the arrival, establishment, and spread of yellow perch in Shusw
ap Lake.
This m
anagem
ent scenario is the baseline case for a yellow perch invasion, where
the invasion is allowed to take its course without any intervention.
Education
X
In this action, provincial fisheries managers would undertake public aw
areness
and education programs in an attem
pt to prevent human introduction of yellow
perch into Shusw
ap Lake. If yellow perch do m
ake their way into Shusw
ap Lake,
no action would be taken to control their abundance or their spatial distribution
throughout the lake.
Enforcem
ent
X
In this action, enforcem
ent of fish introduction and transfer regulations by
provincial conservation and fishery officers would be increased in an attem
pt to
prevent human introduction of yellow perch into Shusw
ap Lake. If yellow perch
do m
ake their way into the lake, no action would be taken to control their
abundance or their spatial distribution throughout the lake.
Rotenone
X
In this action, provincial fisheries managers would apply Rotenone to all lakes in
the Thompson region containing established yellow perch populations in an
attempt to prevent the natural dispersion of yellow perch into Shusw
ap Lake. If
yellow perch do m
ake their way into the lake, no action would be taken to control
their abundance or their spatial distribution throughout the lake.
Physical Rem
oval
X
X
In this option, no action would be taken by provincial fisheries managers to
prevent yellow perch from entering Shusw
ap Lake. However, if yellow perch do
make their way into the lake, fisheries managers would physically rem
ove perch
from the lake using m
echanical m
ethods in an attem
pt to eradicate and/or control
yellow perch populations.
Three
Managem
ent
Actions
X
A combination of Education, Enforcem
ent, and Rotenone actions as described
above.
Four Managem
ent
Actions
X
X
X
A combination of Education, Enforcem
ent, Rotenone, and Physical Rem
oval
actions as described above.

49
Table 2. The abundance (measured in number of fish) of yellow perch in Shuswap Lake
10 years after arrival that, in the model, led to high, moderate, and low ecological
consequences as defined by the impact on adult sockeye salmon produced by the lake.
The impact on sockeye salmon is measured as the proportional reduction in the
abundance (measured in number of fish) of adult sockeye salmon produced by Shuswap
Lake. These impact categories were defined by workshop participants, and the abundance
of yellow perch leading to each category of ecological consequence was determined
using the PR model of Hume et al. (1996) (see Methods).
Ecological consequences
Abundance of yellow perch
Impact on salmon
No impact
0 0
Low
< 20,000 < 1 %
Moderate
20,000 – 75,000 1 – 5 %
High > 75,000 > 5 %

50
Table 3. A summary of key results from Part 2 of the Yellow Perch Risk Assessm
ent Survey. Population type refers to the type of
yellow perch population, native or non-native, that experts were most fam
iliar with. Estim
ates of N
0 (the starting value for the logistic
growth m
odel m
easured in number of fish) indicate the minim
um number of yellow perch required to create an established population
in Shusw
ap Lake. M
inim
um and m
axim
um estim
ates of K (the carrying capacity for yellow perch in Shusw
ap Lake measured in
number of fish) were used to inform
sensitivity analyses, as were the minim
um and m
axim
um estim
ates of lag-density (the abundance
of yellow perch required before spread begins in Shusw
ap Lake, again in number of fish). The estimates of K from Part 2 of the
survey represent experts’ opinion and are independent of the estimated K value calculated using the PR m
odel. Expert opinion on
whether or not yellow perch will utilize the littoral and/or pelagic zones of Shusw
ap Lake is also shown, as is the depth at which
experts believe yellow perch will likely be found in the lake.

51
K
Lag-density
Expert
Population
type
N0
Min
Max
Min
Max
Littoral
(L) and/or
pelagic
(P)
Depth (m)
1
native
> 100
31,000
620,000
500
10,000
L and P
20-40
2
native
50-100
L
5-10
3
native
50-100
775,000
3,100,000
L
5-10
4
native
10-50
L and P
5-10
5
native
10-50
L and P
5-10
6
native
50-100
744,000
7,440,000
17,000
22,000
L
5-10
7
native
10-50
62,000
155,000
12,500
19,500
L
5-10
8
native
< 10
3,100,000
15,500,000
L
10-20
9
native
10-50
L and P
< 5
10
non-native
10-50
L
10-20
11
non-native
< 10
L
< 5

52
Table 4. The starting values (N0) used in the logistic growth model for a given expert.
These values represent the minimum number of yellow perch required to arrive in
Shuswap Lake in order to create an established population and were derived from expert
responses to Part 2 of the survey (Table 4). The N0 values of 30 and 75 represent the
median value in the ranges (10 to 50, and 50 to 100, respectively) provided by experts.
The N0 value of 150 was used in place of one expert’s estimate of > 100, while the N0
value of 10 was used in place of another’s estimate of < 10.
Expert
N0
1 150 2 75 3 75 4 30 5 30 6 75 7 30 8 10

53
Table 5. The surface area of Shuswap Lake inhabited by yellow perch 10 years after
arrival that would lead to localized, moderate, and widespread spatial distribution as
defined by the proportion of suitable habitat (per cent of the total surface area of Shuswap
Lake) inhabited by yellow perch 10 years after arrival. These categories of spatial
distribution were defined by workshop participants, as were the most likely points of
introduction (Figure 1). The spread distance for each distribution category is the linear
distance from the point of introduction (Point A, B, or C) that yellow perch will have
spread 10 years after arrival as calculated by the spread model.
Category of spatial
distribution
Surface area (km2)
Percentage of suitable habitat
Point of introduction (Figure 1)
Spread distance (km)
No spread 0 0 A B C
0 0 0
Localized spread < 78 < 25 % A B C
< 27 < 30 < 19
Moderate spread 78 – 155 25 – 50 % A B C
27-50 30-54 19-31
Widespread > 155 > 50 % A B C
> 50 > 54 > 31

54
Table 6. The median probability (across all experts) of high, moderate, and low ecological consequences resulting from a yellow
perch invasion in Shusw
ap Lake under different managem
ent actions and the associated m
anagem
ent costs and duration of each action
as identified by experts at the workshop. The median probability of no impact on sockeye salm
on is also included. Detailed
descriptions of these managem
ent actions can be found in Appendix A.
Probability of ecological consequences
Managem
ent actions
No
impact
Low
Moderate
High
Managem
ent costs
(CDN/year)
Duration
(years)
No Action
0.15
0.04
0.17
0.59
$0
0
Education
0.19
0.04
0.15
0.54
$50,000
+ $20,000 one time cost
Every year or until yellow perch no
longer a threat (already incurred)
Enforcem
ent
0.18
0.04
0.14
0.47
$250,000-$500,000
+ $20,000 one time cost
Every year or until yellow perch no
longer a threat (not yet incurred)
Rotenone
0.40
0.07
0.12
0.43
$380,000
4 years (already incurred)
Physical Rem
oval
0.15
0.33
0.19
0.21
$250,000-$500,000
Every year or until yellow perch
eradicated from Shusw
ap Lake (not
yet incurred)
Three Mgmt Actions
0.44
0.04
0.10
0.42
$680,000-$930,000
4 years, then $300,000-
$550,000/year, every year or until
yellow perch no longer a threat
Four Mgmt Actions
0.44
0.18
0.11
0.14
$930,000-$1,430,000
4 years, then $550,000-
$1,050,000/year, every year or until
yellow perch no longer a threat

55
Table 7. Rank order of managem
ent actions, by case, based on results shown in Figures 3 through 7. Managem
ent actions are ranked
(1 is best; 7 is worst) according to probability of high ecological consequences and widespread spatial distribution, i.e., the action
ranked 1 has the lowest probability of high ecological consequences and widespread distribution, whereas the action ranked 7 has the
highest probability of high ecological consequences and widespread distribution. Note: all cases are the same as the baseline
param
eter values and assumptions except for the item
noted. Identical rankings and decim
als in a column indicate ties, and ranks are
averaged.
Ranking criterion:
Ecological consequences
Spatial distribution
Case:
Mgmt
actions:
Baseline
K =
1,380,000
K =
775,000
K =
3,100,000
Baseline
Point A
Point B
Point C
Lag-density
= 2,500
Lag-density
= 10,000
No Action
7
7
6
7
6.5
6.5
7
7
Education
6
6
6
5
5
5
5
5
Enforcem
ent
5
5
6
6
6.5
6.5
6
6
Rotenone
4
4
4
3
3
3
3
3.5
Physical Rem
oval
2
2
2
4
4
4
4
3.5
Three Mgmt Actions
3
3
3
2
2
2
2
2
Four Mgmt Actions
1
1
1
1
1
1
1
1
See Figure:
3
5A
5B
4
6A
6B
7A
7B

56
Figures

57
Figure 1. Map of Shuswap Lake, B.C., showing the most likely points of introduction for
yellow perch as identified by participants at a workshop described in the Methods
section. Point A represents the outlet of the Adams River in Main Arm, Point B
represents the outlet of the Salmon River in Salmon Arm, and Point C represents the
outlet of Eagle River and Mara Lake in Salmon Arm. Point A was used as the initial point
of yellow perch introduction in the spread model, while Points B and C were used to
conduct sensitivity analyses.

58
C
A
B

59
Figure 2. Decision tree illustrating the conceptual framework of this analysis. Branches
radiating from the square node represent different management actions that could be
taken to control the invasion of yellow perch in Shuswap Lake, whereas branches
radiating from round nodes represent uncertain states of nature. For each management
action, there is an uncertainty node that has a branch for every possible state of nature
(combination of uncertain parameters of the growth and spread models). States of nature
include arrival via human introduction (AH), arrival via natural dispersal (AN), the
intrinsic rate of increase (r), and the rate of spread (C). The relative weighting (or
probability, Prn) on each uncertain state of nature is the experts’ degree of belief in the
true value of the uncertain parameters. Outcomes are weighted-average probabilities for
abundance (N) and spatial distribution (D) of yellow perch in Shuswap Lake 10 years
after introduction. The figure only shows a subset of management scenarios included in
this analysis (Table 1), No Action (Na), Education (Ed), and 4 Mgmt Actions (4M).

60
Arr
ival
No action
Education
Management Actions
Control options
Uncertain States of Nature
Stages of invasion
4 M
gmt actions
Esta
blishm
ent
Spre
ad
Outcomes
Ecological
. . .
spatial dis
trib
ution
Abundance &
consequences
Growth and spread models
Human
. . .
. . .
. . .
. . .
. . .
. . .
. . .
. . .
. . .
. . .
. . .
. . .
. . .
. . .
. . .
. . .
. . .
. . .Pr C
1
Pr C
2
Pr C
3
Pr C
4
Pr C
9
Pr r1
Pr r2
Pr r3
Pr r4
Pr r9
AH1
AN1
r 1 r 2 r 3 r 4 r 9
C1
C2
C3
C4
C9
AH2
AH3
AH4
AH9
AN2
AN3
AN4
AN9
introduction
Natural
dispersal
. . .
Pr(N1) E
dPr(D1) E
d
Pr(Nx)
EdPr(Dy) E
d
Pr(N1) N
a Pr(D1) N
a
Pr(Nx)
NaPr(Dy) N
a
. . . . . .
Pr(N1) 4M Pr(D1) 4M
Pr(Nx)
4M Pr(Dy) 4M
Pr A
H1
Pr A
H2
Pr A
H3
Pr A
H4
Pr A
H9
Pr A
N1
Pr A
N2
Pr A
N3
Pr A
N4
Pr A
N9

61
0.0
0.2
0.4
0.6
0.8
1.0
No Action
Education
Enforcement
Rotenone
Physical Removal
Three Mgmt Actions
Four Mgmt Actions
Management action
Pro
bability o
f ecolo
gic
al consequences
No impact Low Moderate High
Figure 3. Results for the baseline parameter values of the model of median probability
(across all experts) of no impact, low, moderate, and high ecological consequences based
on abundance of yellow perch in Shuswap Lake 10 years after arrival. Error bars
represent ± one standard deviation.

62
0.0
0.2
0.4
0.6
0.8
1.0
No Action
Education
Enforcement
Rotenone
Physical Removal
Three Mgmt Actions
Four Mgmt Actions
Management action
Pro
bability o
f spatial dis
trib
ution
No spread Localized Moderate Widespread
Figure 4. Results for the baseline parameter values of the model of median probability
(across all experts) of no spread, localized, moderate, and widespread spatial distribution
of yellow perch in Shuswap Lake 10 years after arrival resulting from the spread of
yellow perch from their initial point on introduction, in this case Point A (Figure 1). Error
bars represent ± one standard deviation.

63
Figure 5. The median probability (across all experts) of high, moderate, low, and no ecological consequences based on abundance of
yellow perch in Shusw
ap Lake 10 years after arrival. Unlike Figure 3, which was based on the baseline value of the carrying capacity
(K) of 1,380,000 yellow perch, here I used 775,000 (A) or 3,100,000 (B) fish for K in the logistic growth m
odel. Error bars represent ±
one standard deviation.
0.0
0.2
0.4
0.6
0.8
1.0
No
Actio
n
Educ
atio
n
Enfo
rcem
ent
Rot
enon
e Phys
ical
Rem
oval Th
ree
Mgm
t Act
ions Fo
ur M
gmt A
ctio
ns
Managem
ent action
Probability of ecological consequences
No im
pact
Low
Moderate
High
0.0
0.2
0.4
0.6
0.8
1.0
No
Actio
n
Educ
atio
n
Enfo
rcem
ent
Rot
enon
e Phys
ical
Rem
oval Th
ree
Mgm
t Act
ions Fo
ur M
gmt A
ctio
ns
Managem
ent action
Probability of ecological consequences
No im
pact
Low
Moderate
High
A
B

64
Figure 6. Results for the baseline param
eter values of the model. The median probability (across all experts) of widespread, moderate,
and localized spatial distribution of yellow perch in Shusw
ap Lake 10 years after arrival resulting from the spread of yellow perch
from their initial point on introduction, in this case Point B (A) and Point C (B). Error bars represent ± one standard deviation.
0.0
0.2
0.4
0.6
0.8
1.0
No
Actio
n
Educ
atio
n
Enfo
rcem
ent
Rot
enon
e Phys
ical
Rem
oval Th
ree
Mgm
t Act
ions Fo
ur M
gmt A
ctio
ns
Managem
ent action
Probability of spatial distribution
No spread
Localized
Moderate
Widespread
0.0
0.2
0.4
0.6
0.8
1.0
No
Actio
n
Educ
atio
n
Enfo
rcem
ent
Rot
enon
e Phys
ical
Rem
oval Th
ree
Mgm
t Act
ions Fo
ur M
gmt A
ctio
ns
Managem
ent action
Probability of spatial distribution
No spread
Localized
Moderate
Widespread
A
B

65
Figure 7. The median probability (across all experts) of widespread, moderate, and localized spatial distribution of yellow perch in
Shusw
ap Lake 10 years after arrival resulting from the spread of yellow perch from their initial point of introduction, in this case Point
A (Figure 1). Unlike Figure 4, which was based on the baseline value of the lag-density of 5,000 yellow perch, here I used 2,500 (A)
and 10,000 (B) fish for the lag-density in the spread m
odel. Error bars represent ± one standard deviation.
0.0
0.2
0.4
0.6
0.8
1.0
No
Actio
n
Educ
atio
n
Enfo
rcem
ent
Rot
enon
e Phys
ical
Rem
oval Th
ree
Mgm
t Act
ions Fo
ur M
gmt A
ctio
ns
Managem
ent action
Probability of spatial distribution
No spread
Localized
Moderate
Widespread
0.0
0.2
0.4
0.6
0.8
1.0
No
Actio
n
Educ
atio
n
Enfo
rcem
ent
Rot
enon
e Phys
ical
Rem
oval Th
ree
Mgm
t Act
ions Fo
ur M
gmt A
ctio
ns
Managem
ent action
Probability of spatial distribution
No Spread
Localized
Moderate
Widespread
A
B

66
Reference List
Andersen, M. C., Adams, H., Hope, B., and Powell, M. 2004. Risk assessment for invasive species. Risk Analysis 24: 787-793.
Andow, D. A., Kareiva, P. M., Levin, S. A., and Okubo, A. 1990. Spread of invading organisms. Landscape Ecology 4: 177-188.
Andow, D. A., Kareiva, P. M., Levin, S. A., and Okubo, A. 1993. Spread of invading organisms: patterns of spread. in K.C. Kim and B.A. McPheron, editors. Evolution of insect pests: patterns of variation. Wiley, New York.
Barrows, M. B. 1939. Elimination of yellow perch from a lake by use of derris root. The Journal of Wildlife Management 3: 131-133.
Bartell, S. M., and Nair, S. K. 2003. Establishment risks for invasive species. Risk Analysis 24: 833-845.
Beletsky, D., Mason, D. M., Schwab, D. J., Rutherford, E. S., Janssen, J., Clapp, D. F., and Dettmers, J. M. 2007. Biophysical model of larval yellow perch advection and settlement in Lake Michigan. Journal of Great Lakes Research 33: 842-866.
Bonar, S. A., Bolding, B. D., Divens, M., and Meyer, W. 2005. Effects of introduced fishes on wild juvenile coho salmon in three shallow Pacific northwest lakes. Transactions of the American Fisheries Society 134: 641-652.
Bradford, M. J., Tovey, C. P., and Herborg, L-M. 2008. Biological risk assessment for yellow perch (Perca flavescens) in British Columbia. Fisheries and Oceans Canada, Canadian Science Advisory Secretariat Research Document 2008/073.
Britton, J. R., and Brazier, M. 2006. Eradicating the invasive topmouth gudgeon,Pseudorasbora parva, from a recreational fishery in northern England. Fisheries Management and Ecology 13: 329-335.
Brown, M. W. 1993. Population dynamics of invading pests: factors governing success. in K.C. Kim and B.A. McPheron, editors. Evolution of insect pests: patterns of variation. Wiley, New York.
Brown, T. G., Runciman, B., Bradford, M. J. and Pollard, S. 2009. A biological synopsis of yellow perch (Perca flavescens). Fisheries and Oceans Canada, Canadian Manuscript Report of Fisheries and Aquatic Sciences 2883.
Cailteux, R. L., DeMong, L., Finlayson, B. J., Horton, W., McClay, W., Schnick, R. A., and Thompson, C. 2001. Rotenone in fisheries: are the rewards worth the risks? American Fisheries Society, Bethesda, Maryland.
67
Cambray, J. A. 2003. Impact on indigenous species biodiversity caused by the globalisation of alien recreational freshwater fisheries. Hydrobiologia 500: 217-230.
Chu, C., Moore, J. E., Bakelaar, C. N., Doka, S. E., and Minns, C. K. 2005. Supporting data for the habitat-based population models developed for nothern pike, smallmouth bass, largemouth bass and yellow perch. Fisheries and Oceans Canada, Canadian Data Report of Fisheries and Aquatic Sciences 1160.
Clady, M. D. 1977. Abundance and production of young largemouth bass, smallmouth bass, and yellow perch in two infertile Michigan lakes. Transactions of the American Fisheries Society 106: 57-63.
Clady, M. D. 1978. Structure of fish communities in lakes that contain yellow perch, sauger, and walleye populations. American Fisheries Society Special Publication 11: 100-108.
Cobb, S. E., and Watzin, M. C. 1998. Trophic interactions between yellow perch (Perca flavescens) and their benthic prey in a littoral zone community. Canadian Journal of Fisheries and Aquatic Sciences 55: 28-36.
Colautti, R. I., Bailey, S. A., van Overdijk, C. D. A., Amundsen, K., and MacIsaac, H. J. 2006a. Characterised and projected costs of nonindigenous species in Canada. Biological Invasions 8: 45-59.
Colautti, R. I., Grigorovich, I. A., and MacIsaac, H. J. 2006b. Propagule pressure: a null model for biological invasions. Biological Invasions 8: 1023-1037.
Colautti, R. I., and MacIsaac, H. J. 2004. A neutral terminology to define 'invasive' species. Diversity and Distributions 10: 135-141.
Cooke, R. M. 1991. Experts in uncertainty: opinion and subjective probability in science. Oxford University Press, New York.
Copp, G. H., Templeton, M., and Gozlan, R. E. 2007. Propagule pressure and the invasion risks of non-native freshwater fishes: a case study in England. Journal of Fish Biology 71: 148-159.
Costa, H. H. 1979. The food and feeding chronology of yellow perch (Perca flavescens) in Lake Washington. Hydrobiologie 65: 783-793.
Courtenay, W. R. 1997. Nonindigenous fishes. in D. Simberloff, D.C. Schmitz and T.C. Brown, editors. Strangers in paradise. Island Press, Washington, DC.
Craig, J. 1987. The biology of perch and related fish. Timber Press, Portland, OR.
Crooks, J. A., and Soule, M. E. 1999. Lag times in population explosions of invasive species: causes and implications. in O.T. Sandlund, P.J. Schei and A. Viken,

68
editors. Invasive species and biodiversity management. Kluwer Academic Publishers, Dordrecht, Netherlands.
DeWispelare, A. R., Herren, L. T., and Clemen, R. T. 1995. The use of probability elicitation in the high-level nuclear waste regulation program. International Journal of Forecasting 11: 5-24.
Dextrase, A. J., and Mandrak, N. E. 2006. Impacts of alien invasive species on freshwater fauna at risk in Canada. Biological Invasions 8: 13-24.
Drake, J. M. 2004. Allee effects and the risk of biological invasion. Risk Analysis 24: 795-802.
Drake, J. M., and Lodge, D. M. 2006. Allee effects, propagule pressure and the probability of establishment: risk analysis for biological invasions. Biological Invasions 8: 365-375.
Drechsler, M. 2000. A model-based decision aid for species protection under uncertainty. Biological Conservation 94: 23-30.
Duggan, I. C., Rixon, C. A. M., and MacIsaac, H. J. 2006. Popularity and propagule pressure: determinants of introduction and establishment of aquarium fish. Biological Invasions 8: 377-382.
Finnoff, D., Shogren, J. F., Leung, B., and Lodge, D. M. 2007. Take a risk: preferring prevention over control of biological invaders. Ecological Economics 62: 216-222.
Frappier, B., Lee, T. D., Olson, K. F., and Eckert, R. T. 2003. Small-scale invasion pattern, spread rate, and lag-phase behavior of Rhamnus frangula L. Forest Ecology and Management 186: 1-6.
Fraser, J. M. 1978. The effect of competition with yellow perch on the survival and growth of planted brook trout, splake, and rainbow trout in a small Ontario lake. Transactions of the American Fisheries Society 107: 505-517.
Fullerton, A. H., and Lamberti, G. A. 2006. A comparison of habitat use and habitat-specific feeding efficiency by eurasian ruffe (Gymnocephalus cernuus) and yellow perch (Perca flavescens). Ecology of Freshwater Fish 15: 1-9.
Fullerton, A. H., Lamberti, G. A., Lodge, D. M., and Berg, M. B. 1998. Prey preferences of eurasian ruffe and yellow perch: comparison of laboratory results with composition of great lakes benthos. Journal of Great Lakes Research 24: 319-328.
Genovesi, P. 2007. Limits and potentialities of eradication as a tool for addressing biological invasions. in W. Nentwig, editor. Biological invasions. Springer, New York.

69
Gertzen, E., Familiar, O., and Leung, B. 2008. Quantifying invasion pathways: Fish introductions from the aquarium trade. Canadian Journal of Fisheries and Aquatic Sciences 65: 1265-1273.
Graham, C. C., and Russell, L. R. 1979. An investigation of juvenile salmonid utilization of the delta-lakefront area of the Adams River, Shuswap Lake. Fisheries and Oceans Canada, Fisheries and Marine Service Manuscript Report 1508.
Gregory, R., and Long, G. 2009. Using structured decision making to help implement a precautionary approach to endangered species management. Risk Analysis 29: 518-532.
Haeseker, S. L., Jones, M. L., Peterman, R. M., Bence, J. R., Dai, W., and Christie, G. C. 2007. Explicit consideration of uncertainty in Great Lakes fisheries management: Decision analysis of sea lamprey (Petromyzon marinus) control in the St. Marys River. Canadian Journal of Fisheries and Aquatic Sciences 64: 1456-1468.
Headley, H. C., and Lauer, T. E. 2008. Density-dependent growth of yellow perch in southern Lake Michigan, 1984-2004. North American Journal of Fisheries Management 28: 57-69.
Hengeveld, R. 1989. Dynamics of biological invasions. Chapman and Hall Ltd., London.
Hrabik, T. R., Carey, M. P., and Webster, M. S. 2001. Interactions between young-of-the-year exotic rainbow smelt and native yellow perch in a northern temperate lake. Transactions of the American Fisheries Society 130: 568-582.
Hulme, P. E. 2006. Beyond control: wider implications for the management of biological invasions. Journal of Applied Ecology 43: 835-847.
Hume, J. M. B., Shortreed, K. S., and Morton, K. F. 1996. Juvenile sockeye rearing capacity of three lakes in the Fraser River system. Canadian Journal of Fisheries and Aquatic Sciences 53: 719-733.
Johnson, L. E., Bossenbroek, J. M., and Kraft, C. E. 2006. Patterns and pathways in the post-establishment spread of non-indigenous aquatic species: the slowing invasion of North American inland lakes by the zebra mussel. Biological Invasions 8: 475-489.
Keeney, R. L., and von Winterfeldt, D. 1991. Eliciting probabilities from experts in complex technical problems. IEEE Transactions on Engineering Management 38: 191-201.
Kerr, S. J., Brousseau, C. S., and Muschett, M. 2005. Invasive aquatic species in Ontario: a review and analysis of potential pathways for introduction. Fisheries 30: 21-30.
Koenings, J. P., and Burkett, R. D. 1987. Population characteristics of sockeye salmon (Oncorhynchus nerka) smolts relative to temperature regimes, euphotic volume, fry

70
density and forage base within Alaskan lakes. in H.D. Smith, L. Margolis and C.C. Wood, editors. Sockeye salmon (Oncorhynchus nerka) population biology and future management. Canadian Special Publication of Fisheries and Aquatic Science 96.
Kolar, C. S. 2004. Risk assessment and screening for potentially invasive fishes. New Zealand Journal of Marine and Freshwater Research 38: 391-397.
Kolar, C. S., and Lodge, D. M. 2001. Progress in invasion biology: predicting invaders. Trends in Ecology and Evolution 16: 199-204.
Kolar, C. S., and Lodge, D. M. 2002. Ecological predictions and risk assessment for alien fishes in North America. Science 298: 1233-1236.
Kovecses, J., Sherwood, G. D., and Rasmussen, J. B. 2005. Impacts of altered benthic invertebrate communities on the feeding ecology of yellow perch (Perca flavescens) in metal-contaminated lakes. Canadian Journal of Fisheries and Aquatic Sciences 62: 153-162.
Lawton, J. H., and Brown, K. C. 1986. The population and community ecology of invading insects. Philosophical Transactions of the Royal Society of London, Series B, Biological Sciences 314: 607-617.
Leung, B., Drake, J. M., and Lodge, D. M. 2004. Predicting invasions: propagule pressure and the gravity of allee effects. Ecology 85: 1651-1660.
Lewis, M. A., and Kareiva, P. M. 1993. Allee dynamics and the spread of invading organisms. Theoretical Population Biology 43: 141-158.
Ling, N. 2003. Rotenone - a review of its toxicity and use for fisheries management. New Zealand Department of Conservation, Science for Conservation Report 211.
Lodge, D. M., and Shrader-Frechette, K. 2003. Nonindigenous species: ecological explanation, environmental ethics, and public policy. Conservation Biology 17: 31-37.
Lubina, J. A., and Levin, S. A. 1988. The spread of a reinvading species: range expansion in the California sea otter. The American Naturalist 131: 526-543.
Mack, R. N., Simberloff, D., Lonsdale, W. M., Evans, H., Clout, M., and Bazzaz, F. A. 2000. Biotic invasions: causes, epidemiology, global consequences, and control. Ecological Applications 10: 689-710.
Maguire, L. A. 1986. Using decision analysis to manage endangered species populations. Journal of Environmental Management 22: 345-360.
Maguire, L. A. 2004. What can decision analysis do for invasive species management? Risk Analysis 24: 859-868.

71
Mandrak, N. E., and Cudmore, B. 2004. Risk assessment of asian carps in Canada. Fisheries and Oceans Canada, Canadian Science Advisory Secretariat Research Document 2004/103.
Mandrak, N. E., and Cudmore, B. 2006. National guidelines for assessing the biological risk of aquatic invasive species in Canada. Fisheries and Oceans Canada, Centre of Expertise for Aquatic Risk Assessment.
McPhail, J. D. 2007. The freshwater fishes of British Columbia. The University of Alberta Press, Edmonton.
Meyer, M. A., and Booker, J. M. 1991. Eliciting and analyzing expert judgement: a practical guide Academic Press, London.
Meyerson, L. A., and Mooney, H. A. 2007. Invasive alien species in an era of globalization. Frontiers in Ecology and the Environment 5: 199-208.
Miller, R. R., Williams, J. D., and Williams, J. E. 1989. Extinctions of North-American fishes during the past century. Fisheries 14: 22-38.
Morgan, M. G., and Henrion, M. 1990. Uncertainty: a guide to dealing with uncertainty in quantitative risk assessment and policy analysis. Cambridge University Press, New York.
Murray, J. D., Stanley, E. A., and Brown, D. L. 1986. On the spatial spread of rabies among foxes. Proceedings of the Royal Society of London B-Biological Sciences 229: 111-150.
Neilson, K., Kelleher, R., Barnes, G., Speirs, D., and Kelly, J. 2004. Use of fine-mesh monofilament gill nets for the removal of rudd (Scardinius erythrophthalmus) from a small lake complex in Waikato, New Zealand. New Zealand Journal of Marine and Freshwater Research 38: 525-539.
Ney, J. J. 1978. A synoptic review of yellow perch and walleye biology. American Fisheries Society Special Publication 11: 1-12.
Olson, M. H., Green, D. M., and Rudstam, L. G. 2001. Changes in yellow perch (Perca flavescens) growth associated with the establishment of a walleye (Stizostedion vitreum) population in Canadarago Lake, New York (USA). Ecology of Freshwater Fish 10: 11-20.
Parker, I. M., Simberloff, D., Lonsdale, W. M., Goodell, K., Wonham, M., Kareiva, P. M., Williamson, M. H., Von Holle, B., Moyle, P. B., Byers, J. E., and Goldwasser, L. 1999. Impact: toward a framework for understanding the ecological effects of invaders. Biological Invasions 1: 3-19.

72
Patrick, W. S., and Damon-Randall, K. 2008. Using a five-factored structured decision analysis to evaluate the extinction risk of Atlantic sturgeon (Acipenser oxyrinchus oxyrinchus). Biological Conservation 141: 2906-2911.
Paukert, C. P., and Willis, D. W. 2001. Comparison of exploited and unexploited yellow perch Perca flavescens (Mitchill) populations in Nebraska sandhill lakes. Fisheries Management and Ecology 8: 533-542.
Pestes, L., Peterman, R. M., Bradford, M. J., and Wood, C. C. 2008. Bayesian decision analysis for evaluating management options to promote recovery of a depleted salmon population. Conservation Biology 22: 351-361.
Peterman, R. M., and Anderson, J. L. 1999. Decision analysis: a method for taking uncertainties into account in risk-based decision making. Human and Ecological Risk Assessment 5: 231-244.
Peters, C. N., and Marmorek, D. R. 2001. Application of decision analysis to evaluate recovery actions for threatened Snake River spring and summer chinook salmon (Oncorhynchus tshawytscha). Canadian Journal of Fisheries and Aquatic Sciences 58: 2431-2446.
Peterson, J., and Evans, J. 2003. Quantitative decision analysis for sport fisheries management. Fisheries 28: 10-21.
Pimentel, D., Lach, L., Zuniga, R., and Morrison, D. 2000. Environmental and economic costs of nonindigenous species in the United States. BioScience 50: 53-65.
Pimentel, D., Zuniga, R., and Morrison, D. 2005. Update on the environmental and economic costs associated with alien-invasive species in the United States. Ecological Economics 52: 273-288.
Post, J. R., and Cucin, D. 1984. Changes in the benthic community of a small precambrian lake following the introduction of yellow perch, Perca falvescens. Canadian Journal of Fisheries and Aquatic Sciences 41: 1496-1501.
Post, J. R., Johannes, M. R. S., and McQueen, D. J. 1997. Evidence of density-dependent cohort splitting in age-0 yellow perch (Perca flavescens): Potential behavioural mechanisms and population-level consequences. Canadian Journal of Fisheries and Aquatic Sciences 54: 867-875.
Post, J. R., and McQueen, D. J. 1988. Ontogenetic changes in the distribution of larval and juvenile yellow perch (Perca flavescens): a response to prey or predators? Canadian Journal of Fisheries and Aquatic Sciences 45: 1820-1826.
Punt, A. E., and Hilborn, R. 1997. Fisheries stock assessment and decision analysis: The Bayesian approach. Reviews in Fish Biology and Fisheries 7: 35-63.

73
Purchase, C. F., Collins, N. C., Morgan, G. E., and Shuter, B. J. 2005. Predicting life history traits of yellow perch from environmental characteristics of lakes. Transactions of the American Fisheries Society 134: 1369-1381.
Rahel, F. J., Bierwagen, B. G., and Taniguchi, Y. 2008. Managing aquatic species of conservation concern in the face of climate change and invasive species. Conservation Biology 22: 551-561.
Rilov, G., Benayahu, Y., and Gasith, A. 2004. Prolonged lag in population outbreak of an invasive mussel: a shifting-habitat model. Biological Invasions 6: 347-364.
Rosenzweig, M. L. 2001. The four questions: what does the introduction of exotic species do to diversity? Evolutionary Ecology Research 3: 361-367.
Runciman, J. B., and Leaf, B. R. 2008. A review of yellow perch, smallmouth bass, largemouth bass, pumpkinseed, walleye and northern pike distribution in British Columbia. Fisheries and Oceans Canada.
Russell, L. R., Graham, C. C., Sewid, A. G., and Archibald, D. M. 1980. Distribution of juvenile chinook, coho and sockeye salmon in Shuswap Lake -1978-1979; biophysical inventory of littoral areas of Shuswap Lake, 1979. Fisheries and Oceans Canada, Fisheries and Marine Service Manuscript Report 1479.
Sala, O. E., Chapin, F. S., Armesto, J. J., Berlow, E., Bloomfield, J., Dirzo, R., Huber-Sanwald, E., Huenneke, L. F., Jackson, R. B., Kinzig, A., Leemans, R., Lodge, D. M., Mooney, H. A., Oesterheld, M., Poff, N. L., Sykes, M. T., Walker, B. H., Walker, M., and Wall, D. H. 2000. Global biodiversity scenarios for the year 2100. Science 287: 1770-1774.
Schleen, L. P., Christie, G. C., Heinrich, J. W., Bergstedt, R. A., Young, R. J., Morse, T. J., Lavis, D. S., Bills, T. D., Johnson, J. E., and Ebener, M. P. 2003. Development and implementation of an integrated program for control of sea lampreys in the St. Mary's River. Journal of Great Lakes Research 29: 677-693.
Schreier, T. M., Dawson, V. K., and Larson, W. 2008. Effectiveness of piscicides for controlling round gobies (Neogobius melanostomus). Journal of Great Lakes Research 34: 253-264.
Scott, W. B., and Crossman, E. J. 1973. Freshwater fishes of Canada. Bulletin of the Fisheries Research Board of Canada 184.
Shigesada, N., and Kawasaki, K. 1997. Biological invasions: theory and practice. Oxford Unviverstiy Press, Oxford.
Shortreed, K. S., Morton, K. F., Malange, K., and Hume, J. M. B. 2001. Factors limiting juvenile sockeye production and enhancement potential for selected B.C. Nursery lakes. Fisheries and Oceans Canada, Canadian Science Advisory Secretariat Research Document 2001/098.
74
Shrader, T. 2000. Effects of invasive yellow perch on gamefish and zooplankton populations of Phillips Reservoir. Oregon Department of Fish and Wildlife, Information Report 2000-03.
Skellam, J. G. 1951. Random dispersal in theoretical populations. Biometrika 38: 196-218.
Stauffer, J. R. 1984. Colonization theory relative to introduced populations. in W.R. Courtenay and J.R. Stauffer, editors. Distribution, biology, and management of exotic fishes. The Johns Hopkins University Press, Baltimore.
Taylor, J. N., Courtenay, W. R., and McCann, J. A. 1984. Known impacts of exotic fishes in the continental United States. in W.R. Courtenay and J.R. Stauffer, editors. Distribution, biology, and management of exotic fishes. The Johns Hopkins University Press, Baltimore.
Thorpe, J. 1977. Synopsis of biological data on the perch: Perca fluviatilis Linnaeus, 1758 and Perca flavescens Mitchill, 1814. Food and Agriculture Organization of the United Nations, Rome.
TGIT (Task Group on Introductions and Transfers). 2003. National code on introductions and transfers of aquatic organisms.
VanderWerf, E. A., Groombridge, J. J., Fretz, J. S., and Swinnerton, K. J. 2006. Decision analysis to guide recovery of the po'ouli, a critically endangered Hawaiian honeycreeper. Biological Conservation 129: 383-392.
Vitousek, P. M., D'Antonio, C. M., Loope, L. L., and Westbrooks, R. 1996. Biological invasions as global environmental change. American Scientist 84: 468-478.
Walters, C. J. 1986. Adaptive management of renewable resources. MacMillan Publishing, New York.
Wilberg, M. J., Bence, J. R., Eggold, B. T., Makauskas, D., and Clapp, D. F. 2005. Yellow perch dynamics in southwestern Lake Michigan during 1986-2002. North American Journal of Fisheries Management 25: 1130-1152.
Williams, I. V., Gilhousen, P., Saito, W., Gjernes, T. W., Morton, K. F., Johnson, R., and Brock, D. 1989. Studies of the lacustrine biology of the sockeye salmon (Oncorhynchus nerka) in the Shuswap system. International Pacific Salmon Fisheries Commission, Bulletin XXIV, Vancouver.
Williamson, M. 1999. Invasions. Ecography 22: 5-12.
Wittenberg, R., and Cock, M. J. W. 2005. Best practices for the prevention and management of invasive alien species. in H.A. Mooney, R.N. Mack, J. McNeely, L. Neville and P. Schei, editors. Invasive alien species: a new synthesis. Island Press, Washington, DC.

75
Wydoski, R. S., and Whitney, R. R. 2003. Inland fishes of Washington, 2nd edition. American Fisheries Society, Bethesda, Maryland.

76
Appendices

77
Appendix A. Yellow Perch Risk Assessment Survey Part 1
Questions
Step 1: Please read the background information document, "A quantitative risk-assessment model for invasive yellow perch and Shuswap Lake, British Columbia"
Step 2: Once you have read the background document, open the Excel file named
“Yellow Perch Risk Assessment Survey Part 1” and save the file with your last name listed at the beginning of the filename.
Step 3: Fill in the worksheet labelled “Participant Info”. Then click on the tab for the
worksheet labelled “No Action”. There is one tab for each management action, and we are asking you to work through one tab at a time.
No Action Scenario:
In this scenario, no action would be taken by provincial fisheries managers to prevent yellow perch from entering Shuswap Lake (arrival). If yellow perch do make their way into Shuswap Lake (by natural dispersion or human introduction), no action would be taken by fisheries managers to control their abundance (survival and reproduction) or their distribution throughout the lake (spread). You can think of this management scenario as a baseline case for a yellow perch invasion, where the invasion is allowed to take its course without any intervention by fisheries managers. In this management scenario, the enforcement of fish introduction and transfer regulations by provincial conservation and fishery officers would continue as usual, but would not be increased. In practice, this means that there are still many possibilities for human to purposefully and illegally introduce yellow perch to various lakes. Step 4: Begin filling in the “No Action” worksheet by answering the questions below for
the “probability of arrival via human introduction” (row 11). On this worksheet you will answer all questions as if the “no action” scenario described above was implemented. Each question is posed in two different ways (A and B). Please feel free to choose the questioning format you are most comfortable with and use only that one; they will both lead you to the same answer. Please note that the values you enter for the “probability of arrival via human introduction” must be between 0 and 1. It is very important that you only enter values in yellow coloured cells. Questions 1 and 2 will elicit the end-points of your distribution, and question 3 will elicit the median. These three points form the “backbone” of your distribution, and the rest of the questions elicit points that will provide the remaining shape of your distribution. The probability graphs for each parameter will fill in as you enter your answers, which will allow you to see the shape of the curves and make adjustments to your answers if necessary. If you wish to comment on the reasoning for your answers, space is provided to the right of the probability graphs (yellow cells R15-X26). Feel free to use more space if desired.

78
EXAMPLE - No Action Scenario (values provided in this example are hypothetical)
In step 4 you are asked to answer questions 1 through 9 for the “probability of arrival via human introduction”. Begin with question 1. If you believe there is no way (0 probability) that the probability of arrival via human introduction of yellow perch in Shuswap Lake in the next 5 years could be less than 20%, then enter a value of 0.2 in cell D11. Move on to question 2. If you believe there is no way (0 probability) that the probability of arrival via human introduction could be greater than 90%, then enter a value of 0.9 in cell L11. These two questions delimit the ends of the distribution. Now, move on to question 3 which asks you for the median. If you believe there is an equal chance (probability of 0.5) that the probability of arrival via human introduction could be either above or below 60%, then enter a value of 0.6 in cell H11. Continue answering questions 4-9 in this way.
In step 5 you are asked to answer questions 1 through 9 for the “probability of arrival via natural dispersal”. Begin with question 1. If you believe there is no way (0 probability) that the probability of arrival via natural dispersal of yellow perch in Shuswap Lake could be less than 10%, then enter a value of 0.1 in cell D13. Move on to question 2. If you believe there is no way (0 probabiltiy) that the probability of arrival via natural dispersal could be greater than 80%, then enter a value of 0.8 in cell L13. Move on to question 3. If you believe there is an equal chance (probability of 0.5) that the value for the probability of arrival via natural dispersal could be either above or below 60%, then enter a value of 0.6 in cell H13. Continue answering questions 4-9 in this way.
In step 6 you are asked to answer questions 1 through 9 for the “intrinsic rate of increase”. Begin with question 1. If you believe there is no way (0 probability) that the value for the intrinsic rate of increase for yellow perch in Shuswap Lake could be less than 1, enter 1 into cell D47. Move on to question 2. If you believe there is no way (0 probability) that the value for the intrinsic rate of increase could be greater than 4, enter 4 into cell L47. Move on to question 3. If you believe there is an equal chance (probability of 0.5) that the value for the intrinsic rate of increase for yellow perch in Shuswap Lake could be either above or below 2.5, then enter 2.5 in cell H47. Continue answering questions 4-9 in this way. If you would like to estimate the “intrinsic rate of increase” for a population of yellow perch you have observed use the work area provided in the spreadsheet. If you first observed a population of 50 fish in 1985, enter 1985 in cell U65 and 50 in cell U66. If you then observed the same population in 1995, and there were 200,000 fish, enter 1995 in cell U68 and 200000 in cell U69. The r value (in this case 1.3) will then appear in cell X69.
In step 7 you are asked to answer questions 1 through 9 for the “rate of spread”. Begin with question 1. If you believe there is no chance (0 probability) that the value for the rate of spread of yellow perch throughout Shuswap Lake could be less than 10 km/year, then enter 10 in cell D83. Move on to question 2. If you believe there in no chance (0 probability) that the rate of spread is greater than 100 km/year, then enter 100 in cell L83. Move on to question 3. If you believe there is an equal chance (0.5 probability) that the rate of spread of yellow perch throughout Shuswap Lake is above or below 35 km/year, then enter 35 in cell H83. Continue answering questions 4-9 in this way.
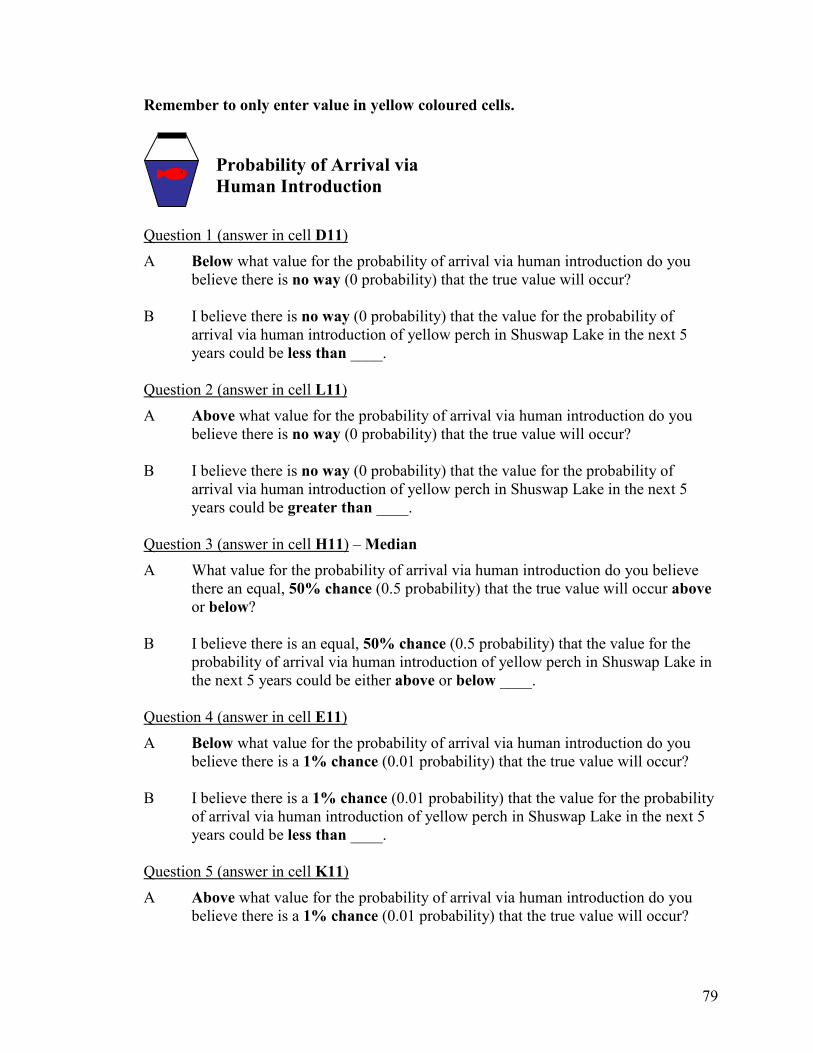
79
Remember to only enter value in yellow coloured cells.
Probability of Arrival via
Human Introduction
Question 1 (answer in cell D11)
A Below what value for the probability of arrival via human introduction do you believe there is no way (0 probability) that the true value will occur?
B I believe there is no way (0 probability) that the value for the probability of
arrival via human introduction of yellow perch in Shuswap Lake in the next 5 years could be less than ____.
Question 2 (answer in cell L11)
A Above what value for the probability of arrival via human introduction do you believe there is no way (0 probability) that the true value will occur?
B I believe there is no way (0 probability) that the value for the probability of
arrival via human introduction of yellow perch in Shuswap Lake in the next 5 years could be greater than ____.
Question 3 (answer in cell H11) – Median
A What value for the probability of arrival via human introduction do you believe there an equal, 50% chance (0.5 probability) that the true value will occur above or below?
B I believe there is an equal, 50% chance (0.5 probability) that the value for the
probability of arrival via human introduction of yellow perch in Shuswap Lake in the next 5 years could be either above or below ____.
Question 4 (answer in cell E11)
A Below what value for the probability of arrival via human introduction do you believe there is a 1% chance (0.01 probability) that the true value will occur?
B I believe there is a 1% chance (0.01 probability) that the value for the probability
of arrival via human introduction of yellow perch in Shuswap Lake in the next 5 years could be less than ____.
Question 5 (answer in cell K11)
A Above what value for the probability of arrival via human introduction do you believe there is a 1% chance (0.01 probability) that the true value will occur?

80
B I believe there is a 1% chance (0.01 probability) that the value for the probability of arrival via human introduction of yellow perch in Shuswap lake in the next 5 years could be greater than ____.
Question 6 (answer in cell F11)
A Below what value for the probability of arrival via human introduction do you believe there is a 5% chance (0.05 probability) that the true value will occur?
B I believe that there is a 5% chance (0.05 probability) that the value for the
probability of arrival via human introduction of yellow perch in Shuswap Lake in the next 5 years could be less than ____.
Question 7 (answer in cell J11)
A Above what value for the probability of arrival via human introduction do you believe there is a 5% chance (0.05 probability) that the true value will occur?
B I believe that there is a 5% chance (0.05 probability) that the value for the
probability of arrival via human introduction of yellow perch in Shuswap Lake in the next 5 years could be greater than ____.
Question 8 (answer in cell G11)
A Below what value for the probability of arrival via human introduction do you believe there is a 25% chance (0.25 probability) that the true value will occur?
B I believe that there is a 25% chance (0.25 probability) that the value for the
probability of arrival via human introduction of yellow perch in Shuswap Lake in the next 5 years could be less than ____.
Question 9 (answer in cell I11)
A Above what value for the probability of arrival via human introduction do you believe there is a 25% chance (0.25 probability) that the true value will occur?
B I believe that there is a 25% chance (0.25 probability) that the value for the
probability of arrival via human introduction of yellow perch in Shuswap Lake in the next 5 years could be greater than ____.
Step 5: Continue filling in the “No Action” worksheet by answering the questions below
for the “probability of arrival via natural dispersal” under the “no action” management scenario. Please note that the values you enter for the “probability of arrival via natural dispersal” must be between 0 and 1. Comment space is provided to the right of the probability graphs (cells R15-X26). Feel free to use more space if desired.

81
Remember to only enter values in yellow coloured cells.
Probability of Arrival via
Natural Dispersal Question 1 (answer in cell D13)
A Below what value for the probability of arrival via natural dispersal do you believe there is no way (0 probability) that the true value will occur?
B I believe there is no way (0 probability) that the value for the probability of
arrival via natural dispersal of yellow perch in Shuswap Lake in the next 5 years could be less than ____.
Question 2 (answer in cell L13)
A Above what value for the probability of arrival via natural dispersal do you believe there is no way (0 probability) that the true value will occur?
B I believe there is no way (0 probability) that the value for the probability of
arrival via natural dispersal of yellow perch in Shuswap Lake in the next 5 years could be greater than ____.
Question 3 (answer in cell H13) – Median
A What value for the probability of arrival via natural dispersal do you believe there an equal, 50% chance (0.5 probability) that the true value will occur above or below?
B I believe there is an equal, 50% chance (0.5 probability) that the value for the
probability of arrival via natural dispersal of yellow perch in Shuswap Lake in the next 5 years could be either above or below ____.
Question 4 (answer in cell E13)
A Below what value for the probability of arrival via natural dispersal do you believe there is a 1% chance (0.01 probability) that the true value will occur?
B I believe there is a 1% chance (0.01 probability) that the value for the probability
of arrival via natural dispersal of yellow perch in Shuswap Lake in the next 5 years could be less than ____.
Question 5 (answer in cell K13)
A Above what value for the probability of arrival via natural dispersal do you believe there is a 1% chance (0.01 probability) that the true value will occur?

82
B I believe there is a 1% chance (0.01 probability) that the value for the probability of arrival via natural dispersal of yellow perch in Shuswap lake in the next 5 years could be greater than ____.
Question 6 (answer in cell F13)
A Below what value for the probability of arrival via natural dispersal do you believe there is a 5% chance (0.05 probability) that the true value will occur?
B I believe that there is a 5% chance (0.05 probability) that the value for the
probability of arrival via natural dispersal of yellow perch in Shuswap Lake in the next 5 years could be less than ____.
Question 7 (answer in cell J13)
A Above what value for the probability of arrival via natural dispersal do you believe there is a 5% chance (0.05 probability) that the true value will occur?
B I believe that there is a 5% chance (0.05 probability) that the value for the
probability of arrival via natural dispersal of yellow perch in Shuswap Lake in the next 5 years could be greater than ____.
Question 8 (answer in cell G13)
A Below what value for the probability of arrival via natural dispersal do you believe there is a 25% chance (0.25 probability) that the true value will occur?
B I believe that there is a 25% chance (0.25 probability) that the value for the
probability of arrival via natural dispersal of yellow perch in Shuswap Lake in the next 5 years could be less than ____.
Question 9 (answer in cell I13)
A Above what value for the probability of arrival via natural dispersal do you believe there is a 25% chance (0.25 probability) that the true value will occur?
B I believe that there is a 25% chance (0.25 probability) that the value for the
probability of arrival via natural dispersal of yellow perch in Shuswap Lake in the next 5 years could be greater than ____.
Step 6: Continue filling in the “No Action” worksheet by answering the questions below
for the “intrinsic rate of increase” under the “no action” management scenario. Comment space is provided to the right of the probability graphs (cells R51-62). If you would like to estimate the “intrinsic rate of increase” for a population of yellow perch you have observed increasing over time, use cells U65-U69 and the r value will be returned to you in cell X69. Use can use either abundance or density of fish as the index of population size to calculate r.
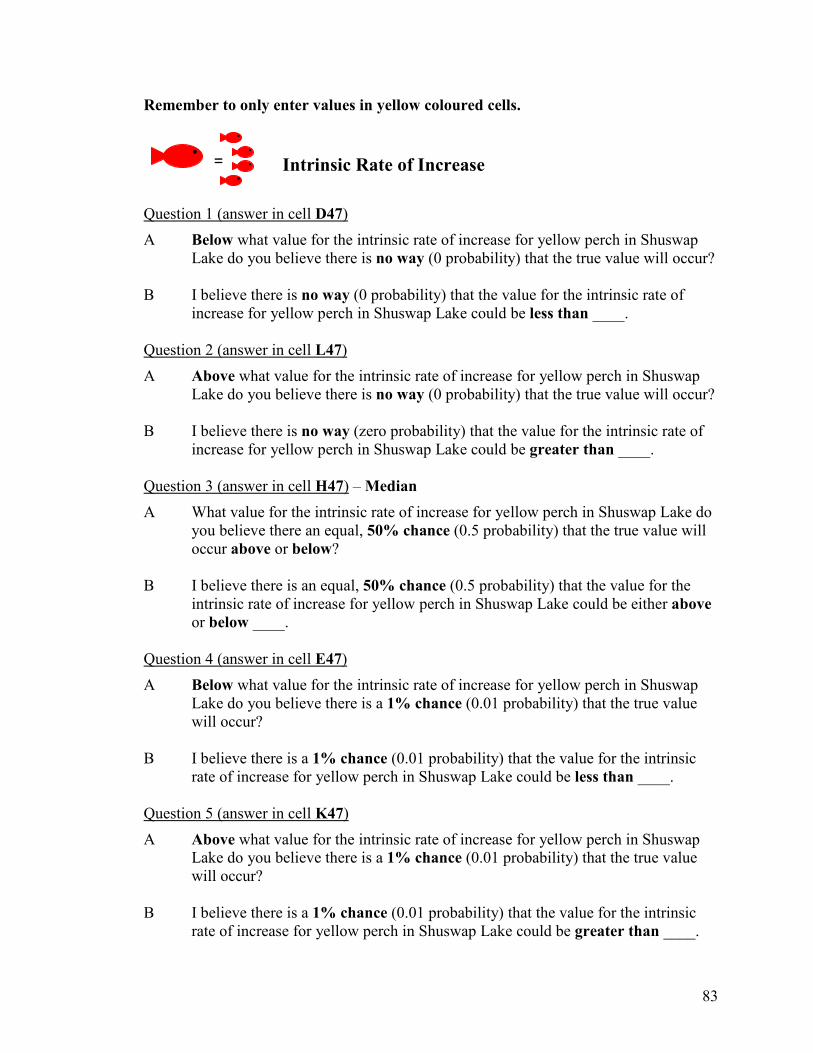
83
Remember to only enter values in yellow coloured cells.
Intrinsic Rate of Increase
Question 1 (answer in cell D47)
A Below what value for the intrinsic rate of increase for yellow perch in Shuswap Lake do you believe there is no way (0 probability) that the true value will occur?
B I believe there is no way (0 probability) that the value for the intrinsic rate of
increase for yellow perch in Shuswap Lake could be less than ____. Question 2 (answer in cell L47)
A Above what value for the intrinsic rate of increase for yellow perch in Shuswap Lake do you believe there is no way (0 probability) that the true value will occur?
B I believe there is no way (zero probability) that the value for the intrinsic rate of
increase for yellow perch in Shuswap Lake could be greater than ____. Question 3 (answer in cell H47) – Median
A What value for the intrinsic rate of increase for yellow perch in Shuswap Lake do you believe there an equal, 50% chance (0.5 probability) that the true value will occur above or below?
B I believe there is an equal, 50% chance (0.5 probability) that the value for the
intrinsic rate of increase for yellow perch in Shuswap Lake could be either above or below ____.
Question 4 (answer in cell E47)
A Below what value for the intrinsic rate of increase for yellow perch in Shuswap Lake do you believe there is a 1% chance (0.01 probability) that the true value will occur?
B I believe there is a 1% chance (0.01 probability) that the value for the intrinsic
rate of increase for yellow perch in Shuswap Lake could be less than ____. Question 5 (answer in cell K47)
A Above what value for the intrinsic rate of increase for yellow perch in Shuswap Lake do you believe there is a 1% chance (0.01 probability) that the true value will occur?
B I believe there is a 1% chance (0.01 probability) that the value for the intrinsic
rate of increase for yellow perch in Shuswap Lake could be greater than ____.
=

84
Question 6 (answer in cell F47)
A Below what value for the intrinsic rate of increase for yellow perch in Shuswap Lake do you believe there is a 5% chance (0.05 probability) that the true value will occur?
B I believe that there is a 5% chance (0.05 probability) that the value for the
intrinsic rate of increase for of yellow perch in Shuswap Lake could be less than ____.
Question 7 (answer in cell J47)
A Above what value for the intrinsic rate of increase for yellow perch in Shuswap Lake do you believe there is a 5% chance (0.05 probability) that the true value will occur?
B I believe that there is a 5% chance (0.05 probability) that the value for the
intrinsic rate of increase for yellow perch in Shuswap Lake could be greater than ____.
Question 8 (answer in cell G47)
A Below what value for the intrinsic rate of increase for yellow perch in Shuswap Lake do you believe there is a 25% chance (0.25 probability) that the true value will occur?
B I believe that there is a 25% chance (0.25 probability) that the value for the
intrinsic rate of increase for yellow perch in Shuswap Lake could be less than ____.
Question 9 (answer in cell I47)
A Above what value for the intrinsic rate of increase for yellow perch in Shuswap Lake do you believe there is a 25% chance (0.25 probability) that the true value will occur?
B I believe that there is a 25% chance (0.25 probability) that the value for the
intrinsic rate of increase for yellow perch in Shuswap Lake could be greater than ____.
Step 7: Continue filling in the “No Action” worksheet by answering the questions below
for the “rate of spread” for the “no action” management scenario. Please note that the values you enter for the “rate of spread” should be kilometers per year through yellow perch habitat. Comment space is provided to the right of the probability graphs (cells R87-X98).

85
Remember to only enter values in yellow coloured cells.
Rate of Spread
Question 1 (answer in cell D83)
A Below what value for the rate of spread do you believe there is no way (0 probability) that the true value will occur?
B I believe there is no way (0 probability) that the value for the rate of spread of
yellow perch throughout Shuswap Lake could be less than ____. Question 2 (answer in cell L83)
A Above what value for rate of spread do you believe there is no way (0 probability) that the true value will occur?
B I believe there is no way (0 probability) that the value for the rate of spread of
yellow perch throughout Shuswap Lake could be greater than ____. Question 3 (answer in cell H83) – Median
A What value for the rate of spread do you believe there an equal, 50% chance (0.5 probability) that the true value will occur above or below?
B I believe there is an equal, 50% chance (0.5 probability) that the value for the
rate of spread of yellow perch throughout Shuswap Lake could be either above or below ____.
Question 4 (answer in cell E83)
A Below what value for the rate of spread do you believe there is a 1% chance (0.01 probability) that the true value will occur?
B I believe there is a 1% chance (0.01 probability) that the value for the rate of
spread of yellow perch throughout Shuswap Lake in the next 5 years could be less than ____.
Question 5 (answer in cell K83)
A Above what value for the rate of spread do you believe there is a 1% chance (0.01 probability) that the true value will occur?
B I believe there is a 1% chance (0.01 probability) that the value for the rate of
spread of yellow perch throughout Shuswap Lake could be greater than ____.

86
Question 6 (answer in cell F83)
A Below what value for the rate of spread do you believe there is a 5% chance (0.05 probability) that the true value will occur?
B I believe that there is a 5% chance (0.05 probability) that the value for the rate of
spread of yellow perch throughout Shuswap Lake in the next 5 years could be less than ____.
Question 7 (answer in cell J83)
A Above what value for the rate of spread do you believe there is a 5% chance (0.05 probability) that the true value will occur?
B I believe that there is a 5% chance (0.05 probability) that the value for the rate of
spread of yellow perch throughout Shuswap Lake could be greater than ____. Question 8 (answer in cell G83)
A Below what value for the rate of spread do you believe there is a 25% chance (0.25 probability) that the true value will occur?
B I believe that there is a 25% chance (0.25 probability) that the value for the rate
of spread of yellow perch throughout Shuswap Lake could be less than ____. Question 9 (answer in cell I83)
A Above what value for the rate of spread do you believe there is a 25% chance (0.25 probability) that the true value will occur?
B I believe that there is a 25% chance (0.25 probability) that the value for the rate
of spread of yellow perch throughout Shuswap Lake could be greater than ____.
You have now completed all the questions related to the “No Action” management
scenario. Next you will answer the SAME questions for the “Education” scenario
(described below). Steps 8-13 will be much faster and easier than steps 4-7 for the
“No Action” case because you will essentially be asking yourself, “How different will
my answers be if I consider taking action X?”
Education Scenario:
In this scenario, provincial fisheries managers would undertake a public awareness and education program in an attempt to prevent the human introduction of yellow perch into Shuswap Lake (arrival). Fisheries managers would explain the consequences of invasive species introductions, and the impacts that a yellow perch invasion could have on the biological resources of Shuswap Lake. This education program would attempt to reach as many members of the public as possible, while focusing its efforts on those most likely to accidentally or intentionally introduce yellow perch into Shuswap Lake (e.g. recreational anglers). Education and awareness could include such things as town meetings, school

87
programs and presentations, posters, pamphlets, a website, newspaper articles and television news reports. Under this scenario, if yellow perch do make their way into Shuswap Lake (by natural dispersion or human introduction), no action would be taken by fisheries managers to control their abundance (survival and reproduction) or their distribution throughout the lake (spread). In this management scenario, the enforcement of fish introduction and transfer regulations by provincial conservation and fishery officers would continue as usual, but would not be increased. Step 8: Don’t forget to save your file periodically. Now move on to the next management
scenario by clicking on the tab labelled “Education”. Fill in the worksheet by answering the questions listed above in Steps 4, 5, 6, and 7. On this worksheet you will answer all questions as if the “Education” scenario described above was implemented. You will notice that the probability distributions you specified for the “No Action” scenario will appear on the probability graphs for each parameter (and the numerical values will appear below your yellow answer cells). These “No Action” data points are provided as a reference so you can think about how education may change your numerical answers compared to the baseline “No Action” case. Since the “Education” scenario is aimed at decreasing the arrival of yellow perch in Shuswap Lake via human introductions, it is likely that your answers for the other parameters, i.e. the “probability of arrival via natural dispersal”, the “intrinsic rate of increase”, and the “rate of spread”, will not change from the “No Action” scenario. Once again, the probability graphs for each parameter will fill in as you enter your answers, which will allow you to see the shape of the curves and make adjustments to your answers if necessary. You are now done with the “Education” scenario.
Enforcement Scenario:
In this scenario, the enforcement of fish introduction and transfer regulations by provincial conservation and fishery officers would be increased in an attempt to prevent the human introduction of yellow perch into Shuswap Lake (arrival). Increased enforcement could be achieved by encouraging the public to report illegal introductions of yellow perch (which could include a reward for reporting) and by facilitating the reporting process through the creation of an anonymous telephone hotline. Closing lakes in the Thompson Region with confirmed yellow perch populations could also be used as a disincentive for further human introductions. An increase in enforcement could also be accomplished by increasing the number of conservation and fishery officers patrolling Thompson region lakes and by implementing more severe consequences (e.g. higher fines) for violations of fish introduction and transfer regulations. Under this scenario, if yellow perch do make their way into Shuswap Lake (by natural dispersion or human introduction), no action would be taken by fisheries managers to control their abundance (survival and reproduction) or their distribution throughout the lake (spread). Step 9: Now move on to the next management scenario by clicking on the tab labelled
“Enforcement”. Fill in the worksheet by answering the questions listed above in Steps 4, 5, 6, and 7. On this worksheet you will answer all questions as if the “Enforcement” scenario described above was implemented. You will notice that

88
the probability distributions you specified for the “No Action” scenario will appear on the probability graphs for each parameter (and the numerical values will appear below your yellow answer cells). These points are provided as a reference so you can think about how enforcement may change your numerical answers compared to the baseline “No Action” case. Since the “Enforcement” scenario is aimed at decreasing the arrival of yellow perch in Shuswap Lake via human introductions, it is likely that your answers for the other parameters, i.e. the “probability of arrival via natural dispersal”, the “intrinsic rate of increase”, and the “rate of spread”, will not change from the “No Action” scenario. Once again, the probability graphs for each parameter will fill in as you enter your answers, which will allow you to see the shape of the curves and make adjustments to your answers if necessary. You are now done with the “Enforcement” scenario.
Rotenone Scenario:
In this scenario, provincial fisheries managers would apply Rotenone to all lakes in the Thompson region containing established yellow perch populations in an attempt to prevent the natural dispersion of yellow perch into Shuswap Lake (arrival). Not all lakes would be treated in the same year, but a management plan would be set up to ensure that all lakes receive a Rotenone application in a timely manner (e.g. 1 or 2 lakes per year over 2 or 3 years). Under this scenario, if yellow perch do make their way into Shuswap Lake (by natural dispersion or human introduction), no action would be taken by fisheries managers to control their abundance (survival and reproduction) or their distribution throughout the lake (spread). In this management scenario, the enforcement of fish introduction and transfer regulations by provincial conservation and fishery officers would continue as usual, but would not be increased.
Step 10: Now move on to the next management scenario by clicking on the tab labelled “Rotenone”. Fill in the worksheet by answering the questions listed above in Steps 4, 5, 6, and 7. On this worksheet you will answer all questions as if the “Rotenone” scenario described above was implemented. You will notice that the probability distributions you specified for the “No Action” scenario will appear on the probability graphs for each parameter (and the numerical values will appear below your yellow answer cells). These points are provided as a reference so you can think about how rotenone may change your numerical answer compared to the baseline “No Action” case. Since the “Rotenone” scenario is aimed at decreasing the arrival of yellow perch in Shuswap Lake via natural dispersal, it is likely that your answers for the other parameters, i.e. the “probability of arrival via human introduction”, the “intrinsic rate of increase”, and the “rate of spread”, will not change from the “No Action” scenario. Once again the probability graphs for each parameter will fill in as you enter your answers, which will allow you to see the shape of the curves and make adjustments to your answers if necessary. You are now done with the “Rotenone” scenario.

89
Physical Removal:
In this scenario, no action would be taken by provincial fisheries managers to prevent yellow perch from entering Shuswap Lake (arrival). If yellow perch do make their way into Shuswap Lake (by natural dispersion or human introduction) fisheries managers would physically remove perch from the lake using gillnets (or other mechanical methods such as purse seines or traps). Physical removal is unlikely to eradicate yellow perch from Shuswap Lake, even if efforts begin as soon as yellow perch are first observed in the lake. Thus, physical removal will simply attempt to control the abundance (survival and reproduction) and distribution (spread) of yellow perch in Shuswap Lake. Physical removal would take place annually, preferably before yellow perch spawn in the spring. In this management scenario, the enforcement of fish introduction and transfer regulations by provincial conservation and fishery officers would continue as usual, but would not be increased. Step 11: Now move on to the next management scenario by clicking on the tab labelled
“Physical Removal”. Fill in the worksheet by answering the questions listed above in Steps 4, 5, 6, and 7. On this worksheet you will answer all questions as if the “Physical Removal” scenario described above was implemented. You will notice that the probability distributions you specified for the “No Action” scenario will appear on the probability graphs for each parameter (and your numerical values will appear in the cells below your yellow answer cells). These points are provided as a reference so you can think about how physical removal may change your numerical answers compared to the baseline “No Action” case. Since the “Physical Removal” scenario is aimed at decreasing the establishment and spread of yellow perch after they arrive in Shuswap Lake, it is likely that your answers for the “probability of arrival via human introduction” and the “probability of arrival via natural dispersal” will not change from the “No Action” scenario. Once again the probability graphs for each parameter will fill in as you enter your answers, which will allow you to see the shape of the curves and make adjustments to your answers if necessary. You are now done with the “Physical Removal” scenario.
Step 12: Now move on to the next management scenario by clicking on the tab labelled
“Three Mgmt Actions”. Fill in the worksheet by answering the questions listed above in Steps 4, 5, 6, and 7. This scenario is a combination of the education, enforcement, and rotenone scenarios (see descriptions above). On this worksheet you will answer the questions as if the education, enforcement, and rotenone management scenarios were all implemented. You will notice that the probability distributions you previously specified for the “probability of arrival via human introduction” from the “Education” and the “Enforcement” scenarios are provided as a reference, along with the probability distribution you specified for the “probability of arrival via natural dispersal” from the “Rotenone” scenario. Since both education and enforcement are aimed at decreasing the arrival of yellow perch in Shuswap Lake via human introductions, it is possible that your answers for the “probability of arrival via human introduction” in this current

90
“Three Mgmt Actions” case will be a combination of your previous answers from the “Education” and “Enforcement” scenarios. Because rotenone is the only action aimed at decreasing the arrival of yellow perch in Shuswap Lake via natural dispersal, it is likely that your answers for the “probability of arrival via natural dispersal” will not change from the “Rotenone” scenario. You will also notice that the probability distributions you previously specified for the “intrinsic rate of increase” and the “rate of spread” from the “No Action” scenario are provided as a reference because there is no management action in this current “Three Mgmt Actions” scenario aimed at decreasing the establishment and spread of yellow perch after they arrive in Shuswap Lake. It is therefore likely that your answers for the “intrinsic rate of increase” and the “rate of spread” will not change from the “No Action” scenario. Once again, the probability graphs will fill in as you enter your answers, which will allow you to see the shape of the curves and make adjustments to your answers if necessary.
Step 13: Now move on to the next management by clicking on the tab labelled “Four Mgmt Actions”. Fill in the worksheet by answering the questions listed above in Steps 4, 5, 6, and 7. This scenario is a combination of the education, enforcement, rotenone, and physical removal scenarios (see descriptions above). On this worksheet you will answer the questions as if the education, enforcement, rotenone, and physical removal management scenarios were all implemented. You will notice that the probability distributions specified for the “probability of arrival via human introductions” and the “probability of arrival via natural dispersal” from the “Three Mgmt Actions” scenario are provided as a reference. However, since there is no additional action being taken in the “Four Mgmt Actions” scenario to decrease the arrival of yellow perch in Shuswap Lake, it is likely your answers will not change for these parameters. You will also notice that the probability distributions specified for the “intrinsic rate of increase” and the “rate of spread” from the “Physical Removal” scenario are provided as a reference. However, since that action is the same as the one taken in the current “Four Mgmt Actions” scenario to decrease the establishment and spread of yellow perch after they arrive in Shuswap Lake, it is likely your answers will not change for these parameters. Once again, the probability graphs will fill in as you enter your answers, which will allow you to see the shape of the curves and make adjustments to your answers if necessary.
Step 14: Once you have completed all of the worksheets, review your answers and e-mail the Excel file to Erica Johnson at [email protected]
Thank you very much for participating!
We now ask you to complete a much briefer portion of our survey by following the
web link for the “Yellow Perch Risk Assessment Survey Part 2”, which was sent to
you in an email.
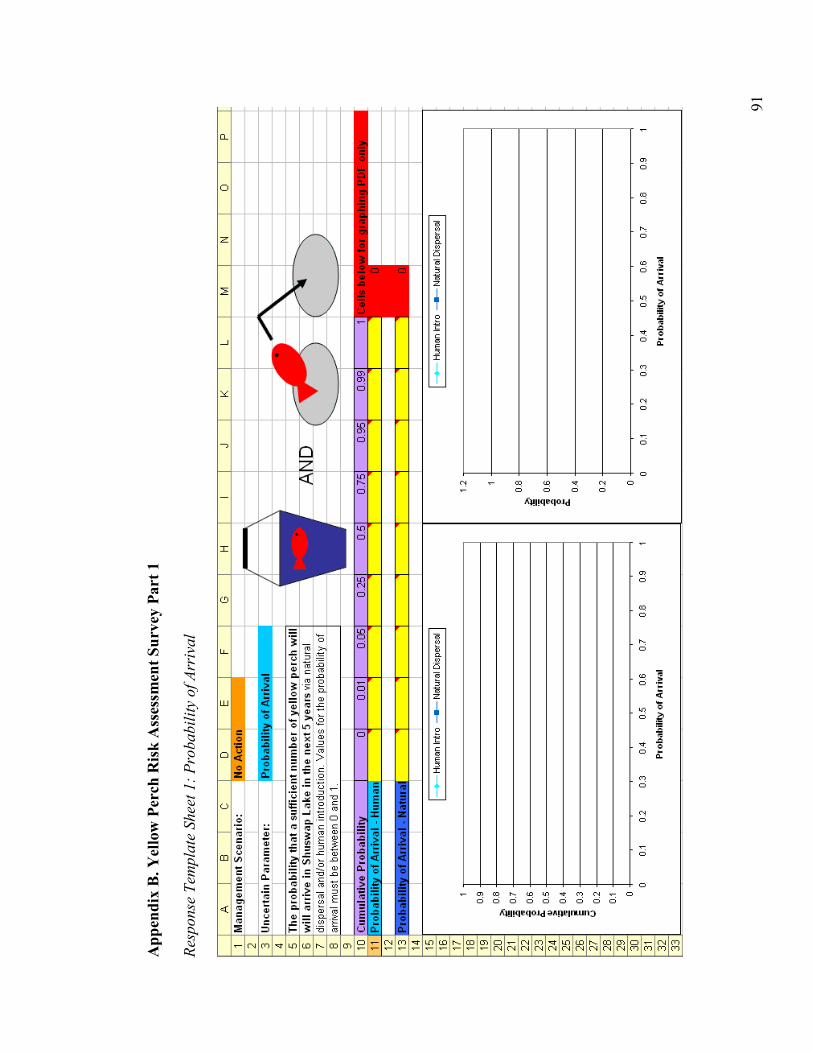
91
Appendix B. Yellow Perch Risk Assessment Survey Part 1
Response Tem
plate Sheet 1: Probability of Arrival

92
Response Tem
plate Sheet 2: Rate of Increase

93
Response Tem
plate Sheet 3: Rate of Spread

94
Appendix C. Yellow Perch Risk Assessment Survey Part 1
Responses

95
No
Actio
n
0
0.050.1
0.150.2
0.250.3
00.2
0.4
0.6
0.8
1
Pro
bability
of arr
ival (h
um
an)
Degree of belief
Expert 1
Expert 2
Expert 3
Expert 4
Expert 5
Expert 6
Expert 7
Expert 8
Edu
catio
n
0
0.050.1
0.150.2
0.250.3
00.2
0.4
0.6
0.8
1
Pro
bability
of arr
ival (h
um
an)
Degree of belief
Expe
rt 1
Expe
rt 2
Expe
rt 3
Expe
rt 4
Expe
rt 5
Expe
rt 6
Expe
rt 7
Expe
rt 8
Enf
orce
men
t
0
0.050.1
0.150.2
0.250.3
00.2
0.4
0.6
0.8
1
Pro
bability
of arr
ival (h
um
an)
Degree of belief
Expert 1
Expert 2
Expert 3
Expert 4
Expert 5
Expert 6
Expert 7
Expert 8
Rot
enon
e
0
0.050.1
0.150.2
0.250.3
00.2
0.4
0.6
0.8
1
Pro
bability
of arr
ival (h
um
an)
Degree of belief
Expert 1
Expert 2
Expert 3
Expert 4
Expert 5
Expert 6
Expert 7
Expert 8
Phys
ical
Rem
oval
0
0.050.1
0.150.2
0.250.3
00.2
0.4
0.6
0.8
1
Pro
bability
of arr
ival (h
um
an)
Degree of belief
Expert 1
Expert 2
Expert 3
Expert 4
Expert 5
Expert 6
Expert 7
Expert 8
Thre
e M
anag
em
ent Act
ions
0
0.050.1
0.150.2
0.250.3
00.2
0.4
0.6
0.8
1
Pro
bability
of arr
ival (h
um
an)
Degree of belief
Expert 1
Expert 2
Expert 3
Expert 4
Expert 5
Expert 6
Expert 7
Expert 8
Four
Man
agem
ent
Act
ions
0
0.050.1
0.150.2
0.250.3
00.2
0.4
0.6
0.8
1
Pro
bability
of arr
ival (h
um
an)
Degree of belief
Expert 1
Expert 2
Expert 3
Expert 4
Expert 5
Expert 6
Expert 7
Expert 8
Figure C1. Probability density functions (PDFs) describing each of the
eight external experts’ degree of belief in the uncertain param
eter, the
probability of arrival via human introduction of yellow perch in Shusw
ap
Lake in the next 5 years, for each m
anagem
ent scenario shown in the title of
each panel.

96
No
Act
ion
0
0.050.1
0.150.2
0.250.3
00.2
0.4
0.6
0.8
1
Pro
bability
of arr
ival (n
atu
ral)
Degree of belief
Expert 1
Expert 2
Expert 3
Expert 4
Expert 5
Expert 6
Expert 7
Expert 8
Educa
tion
0
0.050.1
0.150.2
0.250.3
00.2
0.4
0.6
0.8
1
Pro
bability
of arr
ival (n
atu
ral)
Degree of belief
Expert 1
Expert 2
Expert 3
Expert 4
Expert 5
Expert 6
Expert 7
Expert 8
Enfo
rcem
ent
0
0.050.1
0.150.2
0.250.3
00.2
0.4
0.6
0.8
1
Pro
bability
of arr
ival (n
atu
ral)
Degree of belief
Expert 1
Expert 2
Expert 3
Expert 4
Expert 5
Expert 6
Expert 7
Expert 8
Rote
none
0
0.050.1
0.150.2
0.250.3
00.2
0.4
0.6
0.8
1
Pro
bability
of arr
ival (n
atu
ral)
Degree of belief
Expert 1
Expert 2
Expert 3
Expert 4
Expert 5
Expert 6
Expert 7
Expert 8
Phys
ical
Rem
oval
0
0.050.1
0.150.2
0.250.3
00.2
0.4
0.6
0.8
1
Pro
bability
of arr
ival (n
atu
ral)
Degree of belief
Expert 1
Expert 2
Expert 3
Expert 4
Expert 5
Expert 6
Expert 7
Expert 8
Thre
e M
anag
em
ent Act
ions
0
0.050.1
0.150.2
0.250.3
00.2
0.4
0.6
0.8
1
Pro
bability
of arr
ival (n
atu
ral)
Degree of belief
Expert 1
Expert 2
Expert 3
Expert 4
Expert 5
Expert 6
Expert 7
Expert 8
Four
Man
agem
ent Ac
tion
s
0
0.050.1
0.150.2
0.250.3
00.2
0.4
0.6
0.8
1
Pro
bability
of arr
ival (n
atu
ral)
Degree of belief
Expert 1
Expert 2
Expert 3
Expert 4
Expert 5
Expert 6
Expert 7
Expert 8
Figure C2. Probability density functions (PDFs) describing each of the
eight external experts’ degree of belief in the uncertain param
eter, the
probability of arrival via natural dispersal of yellow perch in Shusw
ap Lake
in the next 5 years, for each m
anagem
ent scenario shown in the title of each
panel.

97
No
Actio
n
0
0.050.1
0.150.2
0.250.3
-10
12
34
Intr
insi
c ra
te o
f in
crease
(r)
Degree of belief
Expert 1
Expert 2
Expert 3
Expert 4
Expert 5
Expert 6
Expert 7
Expert 8
Edu
catio
n
0
0.050.1
0.150.2
0.250.3
-10
12
34
Intr
insi
c ra
te o
f in
crea
se (r)
Degree of belief
Expert 1
Expert 2
Expert 3
Expert 4
Expert 5
Expert 6
Expert 7
Expert 8
Enfo
rcem
ent
0
0.050.1
0.150.2
0.250.3
-10
12
34
Intr
insi
c ra
te o
f in
crease
(r)
Degree of belief
Expert 1
Expert 2
Expert 3
Expert 4
Expert 5
Expert 6
Expert 7
Expert 8
Rote
none
0
0.050.1
0.150.2
0.250.3
-10
12
34
Intr
insi
c ra
te o
f in
rease
(r)
Degree of belief
Expert 1
Expert 2
Expert 3
Expert 4
Expert 5
Expert 6
Expert 7
Expert 8
Phy
sica
l Rem
ova
l
0
0.050.1
0.150.2
0.250.3
-10
12
34
Intr
insi
c ra
te o
f in
crease
(r)
Degree of belief
Expert 1
Expert 2
Expert 3
Expert 4
Expert 5
Expert 6
Expert 7
Expert 8
Thre
e M
anag
em
ent Act
ions
0
0.050.1
0.150.2
0.250.3
-10
12
34
Intr
insi
c ra
te o
f in
crease
(r)
Degree of belief
Expert 1
Expert 2
Expert 3
Expert 4
Expert 5
Expert 6
Expert 7
Expert 8
Four
Man
agem
ent A
ctio
ns
0
0.050.1
0.150.2
0.250.3
-10
12
34
Intr
insi
c ra
te o
f in
crease
(r)
Degree of belief
Expert 1
Expert 2
Expert 3
Expert 4
Expert 5
Expert 6
Expert 7
Expert 8
Figure C3. Probability density functions (PDFs) describing each of eight
external experts’ degree of belief in the uncertain param
eter, the intrinsic
rate of increase of yellow perch in Shusw
ap Lake, for each m
anagem
ent
scenario shown in the title of each panel.

98
No
Actio
n
0
0.050.1
0.150.2
0.250.3
0100
200
300
400
500
Rate
of sp
read (km
/year)
Degree of belief
Expert 1
Expert 2
Expert 3
Expert 4
Expert 5
Expert 6
Expert 7
Expert 8
Edu
catio
n
0
0.050.1
0.150.2
0.250.3
0100
200
300
400
500
Rate
of sp
read (km
/year)
Degree of belief
Expert 1
Expert 2
Expert 3
Expert 4
Expert 5
Expert 6
Expert 7
Expert 8
Enfo
rcem
ent
0
0.050.1
0.150.2
0.250.3
0100
200
300
400
500
Rate
of sp
read (km
/year)
Degree of belief
Expert 1
Expert 2
Expert 3
Expert 4
Expert 5
Expert 6
Expert 7
Expert 8
Rote
none
0
0.050.1
0.150.2
0.250.3
0100
200
300
400
500
Rate
of sp
read (km
/year)
Degree of belief
Expert 1
Expert 2
Expert 3
Expert 4
Expert 5
Expert 6
Expert 7
Expert 8
Phys
ical
Rem
oval
0
0.050.1
0.150.2
0.250.3
0100
200
300
400
500
Rate
of sp
read (km
/year)
Degree of belief
Expert 1
Expert 2
Expert 3
Expert 4
Expert 5
Expert 6
Expert 7
Expert 8
Thre
e M
anag
em
ent Act
ions
0
0.050.1
0.150.2
0.250.3
0100
200
300
400
500
Rate
of sp
read (km
/year)
Degree of belief
Expert 1
Expert 2
Expert 3
Expert 4
Expert 5
Expert 6
Expert 7
Expert 8
Four M
anag
em
ent Act
ions
0
0.050.1
0.150.2
0.250.3
0100
200
300
400
500
Rate
of sp
read (km
/year)
Degree of belief
Expert 1
Expert 2
Expert 3
Expert 4
Expert 5
Expert 6
Expert 7
Expert 8
Figure C4. Probability density functions (PDFs) describing each of eight
external experts’ degree of belief in the uncertain param
eter, the rate of
spread of yellow perch in Shusw
ap Lake, for each m
anagem
ent scenario
shown in the title of each panel.

99
Appendix D. Yellow Perch Risk Assessment Survey Part 2
Questions
1. What type of yellow perch population are you MOST familiar with?
a. Native b. Non-Native
2. How many yellow perch do you think need to arrive in Shuswap Lake in order to successfully reproduce and establish (i.e. what is the minimum number of yellow perch required to create an established population in Shuswap Lake?)
a. <10 b. 10-50 c. 50-100 d. >100
3. Please list water bodies containing NATIVE yellow perch populations that you
are familiar with.
a. Small lakes b. Large lakes c. Reservoirs d. Rivers
4. In your experience, what region(s) of the lake to adult yellow perch inhabit?
a. Littoral zone b. Pelagic zone c. Both d. Other, please specify
5. If you answered B or C in questions 4, what factors do you believe lead adult
yellow perch to become pelagic rather than littoral? Multiple answers possible.
a. Lake size (large) b. Lake depth (deep) c. Size of littoral zone (small) d. Low prey abundance in littoral zone e. High predator abundance in littoral zone f. Low abundance of vegetation in littoral zone g. High abundance of vegetation in littoral zone h. High temperature in littoral zone i. None of the above j. Other, please specify
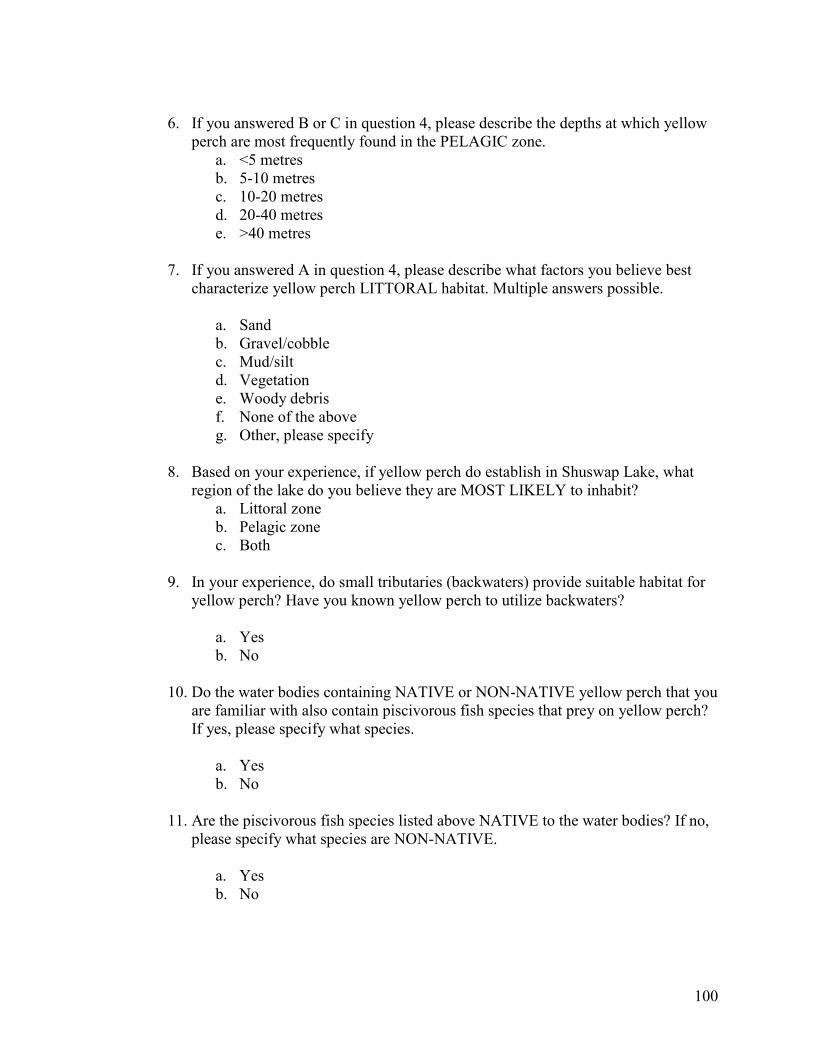
100
6. If you answered B or C in question 4, please describe the depths at which yellow
perch are most frequently found in the PELAGIC zone. a. <5 metres b. 5-10 metres c. 10-20 metres d. 20-40 metres e. >40 metres
7. If you answered A in question 4, please describe what factors you believe best
characterize yellow perch LITTORAL habitat. Multiple answers possible.
a. Sand b. Gravel/cobble c. Mud/silt d. Vegetation e. Woody debris f. None of the above g. Other, please specify
8. Based on your experience, if yellow perch do establish in Shuswap Lake, what
region of the lake do you believe they are MOST LIKELY to inhabit? a. Littoral zone b. Pelagic zone c. Both
9. In your experience, do small tributaries (backwaters) provide suitable habitat for
yellow perch? Have you known yellow perch to utilize backwaters?
a. Yes b. No
10. Do the water bodies containing NATIVE or NON-NATIVE yellow perch that you
are familiar with also contain piscivorous fish species that prey on yellow perch? If yes, please specify what species.
a. Yes b. No
11. Are the piscivorous fish species listed above NATIVE to the water bodies? If no,
please specify what species are NON-NATIVE.
a. Yes b. No

101
12. At what densities (fish/ha) are adult yellow perch typically found in the water bodies you are familiar with? Based on your experience, please provide estimates of:
a. Minimum density b. Maximum density
13. At what densities (fish/ha) do yellow perch population show signs of stunting?
Based on your experience, please provide estimates of:
a. Minimum density b. Maximum density
14. Based on your experience, if yellow perch do establish in Shuswap Lake, what do
you believe would be the carrying capacity (fish/ha) for yellow perch? Please provide estimates of:
a. Minimum density b. Maximum density
15. At what densities (fish/ha) are yellow perch populations forced to spread out and
establish in new areas of the lake in search of food or better habitat? Based on your experience, please provide estimates of:
a. Minimum density b. Maximum density
16. In your experience, do yellow perch move through less suitable habitat and/or
pelagic habitat in search of food of better habitat? If no, please explain.
a. Yes b. No
17. In the water bodies containing NON-NATIVE yellow perch that you are familiar
with, have yellow perch displaced or reduced the abundance of other fish species? If yes, please specify what species.
a. Yes b. No
18. Are the displaced fish species listed above NATIVE or NON-NATIVE?
a. Native b. Non-native c. Both d. Other, please specify

102
19. By what means did yellow perch displace the fish species listed above? Multiple
answered possible.
a. Competition for food b. Competition for habitat c. Predation d. None of the above e. Other, please specify
20. In your experience, what control measures have been used by fisheries managers
to eradicate or control invasive fish species?
21. Have any of the control measures listed above been used to eradicate or control NON-NATIVE yellow perch populations in the water bodies you are familiar with? If yes, please specify which control measures have been used.
a. Yes b. No
22. Have any of the control measures listed above been successful at eradicating or
controlling NON-NATIVE yellow perch populations? If yes, please specify which control measures have been used.
a. Yes b. No
23. In your experience, how much management actions aimed at eradicating or
controlling invasive fish species cost? Please provide cost estimates of the following management actions that we defined in Part 1 of the survey:
a. Education b. Enforcement c. Rotenone d. Physical Removal (please specify what method)
24. In your experience, what abundance of yellow perch in Shuswap Lake do you
believe would lead to LOW ecological consequences as defined above?
a. <10 fish/ha b. <20 fish/ha c. <30 fish/ha d. <40 fish/ha e. <50 fish/ha f. <100 fish/ha g. <500 fish/ha

103
25. In your experience, what abundance of yellow perch in Shuswap Lake do you
believe would lead to MODERATE ecological consequences as defined above?
a. 10-20 fish/ha b. 20-30 fish/ha c. 30-40 fish/ha d. 40-50 fish/ha e. 50-100 fish/ha f. 100-500 fish/ha g. 500-1000 fish/ha
26. In your experience, what abundance of yellow perch in Shuswap Lake do you
believe would lead to HIGH ecological consequences as defined above?
a. >50 fish/ha b. >100 fish/ha c. >250 fish/ha d. >500 fish/ha e. >750 fish/ha f. >1000 fish/ha g. >5000 fish/ha
27. If spatial distribution is measured as the proportion of LITTORAL habitat
occupied by yellow perch, what spatial distribution of yellow perch in the do you believe would lead to LOW ecological consequences as defined above?
a. <10% b. 10-15% c. 15-20% d. 20-25% e. 25-35% f. 35-50% g. 50-60% h. 60-75% i. 75-80% j. >80%
28. If spatial distribution is measured as the proportion of LITTORAL habitat
occupied by yellow perch, what spatial distribution of yellow perch in the do you believe would lead to MODERATE ecological consequences as defined above?
a. <10% b. 10-15% c. 15-20% d. 20-25%

104
e. 25-35% f. 35-50% g. 50-60% h. 60-75% i. 75-80% j. >80%
29. If spatial distribution is measured as the proportion of LITTORAL habitat occupied by yellow perch, what spatial distribution of yellow perch in the do you believe would lead to HIGH ecological consequences as defined above?
a. <10% b. 10-15% c. 15-20% d. 20-25% e. 25-35% f. 35-50% g. 50-60% h. 60-75% i. 75-80% j. >80%
30. If spatial distribution is measured as the proportion of PELAGIC habitat occupied
by yellow perch, what spatial distribution of yellow perch in the do you believe would lead to LOW ecological consequences as defined above?
a. <10% b. 10-15% c. 15-20% d. 20-25% e. 25-35% f. 35-50% g. 50-60% h. 60-75% i. 75-80% j. >80%
31. If spatial distribution is measured as the proportion of PELAGIC habitat occupied by yellow perch, what spatial distribution of yellow perch in the do you believe would lead to MODERATE ecological consequences as defined above?
a. <10% b. 10-15% c. 15-20% d. 20-25% e. 25-35%

105
f. 35-50% g. 50-60% h. 60-75% i. 75-80% j. >80%
32. If spatial distribution is measured as the proportion of PELAGIC habitat occupied
by yellow perch, what spatial distribution of yellow perch in the do you believe would lead to HIGH ecological consequences as defined above?
a. <10% b. 10-15% c. 15-20% d. 20-25% e. 25-35% f. 35-50% g. 50-60% h. 60-75% i. 75-80% j. >80%