quantitative exposure assessment for pathogens in cooked meat and ready-to-eat snack foods

The University of Manchester Research
A Quantitative General Population Job Exposure Matrix forOccupational Noise ExposureDOI:10.1093/annweh/wxaa034
Document VersionAccepted author manuscript
Link to publication record in Manchester Research Explorer
Citation for published version (APA):Stokholm, Z. A., Erlandsen, M., Schlünssen, V., Basinas, I., Bonde, J. P., Peters, S., Brandt, J., Vestergaard, J.M., & Kolstad, H. A. (2020). A Quantitative General Population Job Exposure Matrix for Occupational NoiseExposure. Annals of Work Exposures and health. https://doi.org/10.1093/annweh/wxaa034
Published in:Annals of Work Exposures and health
Citing this paperPlease note that where the full-text provided on Manchester Research Explorer is the Author Accepted Manuscriptor Proof version this may differ from the final Published version. If citing, it is advised that you check and use thepublisher's definitive version.
General rightsCopyright and moral rights for the publications made accessible in the Research Explorer are retained by theauthors and/or other copyright owners and it is a condition of accessing publications that users recognise andabide by the legal requirements associated with these rights.
Takedown policyIf you believe that this document breaches copyright please refer to the University of Manchester’s TakedownProcedures [http://man.ac.uk/04Y6Bo] or contact [email protected] providingrelevant details, so we can investigate your claim.
Download date:28. Feb. 2022
1
A quantitative general population job exposure matrix for occupational
noise exposure
Zara Ann Stokholm1, Mogens Erlandsen2, Vivi Schlünssen3,8, Ioannis Basinas4,
Jens Peter Bonde5, Susan Peters6, Jens Brandt7, Jesper Medom Vestergaard1,
Henrik Albert Kolstad1*
1Department of Occupational Medicine, Danish Ramazzini Centre, Aarhus
University Hospital, 8200 Aarhus N, Denmark; 2Section for Biostatistics,
Department of Public Health, Aarhus University, 8000 Aarhus C, Denmark; 3Environment, Occupation and Health, Danish Ramazzini Centre, Department of
Public Health, Aarhus University, 8000 Aarhus C, Denmark; 4Institute of
Occupational Medicine, Edinburgh EH14 4AP, United Kingdom; 5Department of
Occupational and Environmental Medicine, Bispebjerg University Hospital, 2400
Copenhagen, Denmark; 6Institute for Risk Assessment Sciences, Utrecht
University, 3508 TD Utrecht, the Netherlands; 7CRECEA, 8000 Aarhus C,
Denmark; 8National Research Centre for the Working Environment, 2100
Copenhagen, Denmark
Word count, main text: 3299, abstract: 275, 7 tables, 28 references
*Author to whom correspondence should be addressed. Tel: +45 7845 0900;
Email: [email protected]
Abstract
Occupational noise exposure is a known risk factor for hearing loss and also
adverse cardiovascular effects have been suggested. A job exposure matrix
(JEM) would enable studies of noise and health on a large scale. The objective of
this study was to create a quantitative JEM for occupational noise exposure
assessment of the general working population.
Between 2001-03 and 2009-10, we recruited workers from companies within the
10 industries with the highest reporting of noise-induced hearing loss according
to the Danish Working Environment Authority. We obtained 1343 personal
occupational noise dosimeter measurements among 1140 workers representing
100 different jobs according to the Danish version of the International Standard
Classification of Occupations 1988 (DISCO 88). Four experts used 35 of these
jobs as benchmarks and rated noise levels for the remaining 337 jobs within
DISCO 88. To estimate noise levels for all 372 jobs, we included expert ratings
together with sex, age, occupational class and calendar year as fixed effects,

2
while job and worker were included as random effects in a linear mixed
regression model. The fixed effects explained 40% of the total variance: 72% of
the between-jobs variance, -6% of the between-workers variance and 4% of the
within-worker variance. Modelled noise levels showed a monotonic increase with
increasing expert score and a 20dB difference between the highest and lowest
exposed jobs. Based on the JEM estimates, metal wheel-grinders were among
the highest and finance and sales professionals among the lowest exposed. This
JEM of occupational noise exposure can be used to prioritise preventive efforts of
occupational noise exposure and to provide quantitative estimates of
contemporary exposure levels in epidemiological studies of health effects
potentially associated with noise exposure.
Search terms
Job exposure matrix for occupational noise exposure, Occupational noise
exposure, JEM, Epidemiological studies, Job
Bottom 5 keywords
Noise exposure*, job exposure matrix (JEM)*, occupational*, epidemiology*,
mixed effects model*

3
Introduction
Occupational noise is a known risk factor for hearing loss (Prince, 2002) and other health
effects (Selander et al., 2016; Skogstad et al., 2016).
In Europe, 30% of the work force reported that they were exposed to noise so loud that they
had to raise their voice and this proportion was unchanged from 2000-10 (Eurofound, 2016).
However, in Europe no longitudinal surveillance data are available for occupational noise
levels. In order to prioritise preventive efforts of health consequences of occupational noise
exposure, there is a need for population-based overviews of the distribution of the relevant
exposures across occupations. Such an overview can be provided by a quantitative general
population job exposure matrix (JEM).
A JEM also enables estimation of job and calendar year specific exposure levels of
occupational noise in community-based epidemiological studies investigating exposure-
response relations. Recently, general population JEMs have been developed using quantitative
exposure information from a limited number of occupations in combination with expert rating
(Friesen et al., 2012; Peters et al., 2011; Vested et al., 2019; Wild et al., 2002). This approach
allows calibration of the experts’ ratings as well as assignment of exposure level to
occupations without measurements.
We describe a quantitative JEM for occupational noise exposure assessment of the general
working population combining personal noise exposure measurements with expert ratings.
Methods
Data collection and selection
Companies
During 2001-03 and 2009-10, we recruited workers in companies from the 10 industries
reported having the highest frequency of noise-induced hearing loss in Denmark according to
the Danish Working Environment Authority: manufacturers of food, wood products, non-
metallic mineral products, basic metals, fabricated metal, machinery, motor vehicles,
furniture, publishing and printing, and construction (The Danish Working Environment
Authority, 2019). For optimizing the range in exposure levels and the between group
variability, we also recruited workers of financial services. Finally, children’s day care
facilities were included as recent measurements in Denmark had indicated that workers of

4
these units were exposed to high noise levels. Overall, 175 companies were enrolled in the
two measurement campaigns, both performed as part of epidemiological studies previously
described (Kock et al., 2004; Rubak et al., 2008; Stokholm et al., 2014).
Briefly, Statistics Denmark, a governmental organisation (Thygesen et al., 2011) in 2001
provided a list of 840 eligible companies in 2001, with ≥15 workers within the selected
industries. During 2001 -2003, we randomly enlisted five companies with 15-49 workers and
five companies with ≥50 workers from each industry. From each company a maximum of 10
workers were selected by foremen and managers. In 2009-10 we asked these companies to
participate again in a new measurement campaign and in case they declined or were closed,
we invited other companies within the same industries in order to approach the initial number
of companies.
Workers
Furthermore, we re-invited identifiable 2001-03 participants in the subsequent 2009-10
campaign. In total, the study population then included 1140 workers, 203 participated twice
contributing 30% of all noise measurements (Table 1).
All workers filled in a questionnaire providing information on job according to DISCO 88,
the Danish version of the International Classification of Occupations (ISCO 88) containing
372 occupations on a 4-digit level (DISCO, 2011) , and use of hearing protection devices.
During measurement days, the workers also provided information on work schedules.
Furthermore, a subgroup of 334 workers filled in a log-book with detailed information on
usage of hearing protection devices during the shift. Age and sex were extracted from the civil
registration number (Pedersen, 2011).
The study protocol was approved by the local ethics committee (M-20080239) and the Danish
Data Protection Agency (2009-41-3072) and participants gave written, informed consent.
Noise exposure measurements
Noise measurements started throughout the day, and not necessarily when work started, and
ended about 24 hours later. Only measurements during work were included and not
necessarily the complete working time. Sampling time was defined by the research team. We
measured noise level as A-weighted equivalent sound level means (LEQ) by personal
dosimeters (Brüel & Kjær, model 4443 and 4445) recording every 5 seconds for 24 hours
5
including one work shift. In the first measurement campaign in 2001-2003, dosimeters were
set to a 50-120 dBA range. In the second campaign, dosimeters were set to a 70-140 dBA
range. Therefore, all measurements were standardized to a common 70-120 dBA range. For
any noise recording falling below the limit of detection, a value of 50 dBA replaced the non-
detected level (the LOD/√2 for each non-detectable value, where LOD is the limit of
detection) (Burns et al., 2016; Hornung and Reed, 1990). All measurements were
synchronized with questionnaire information, so each 5 second measurement relative to work,
off-work or night time could be identified. All individual noise recordings during work were
transformed from dBA to intensity, and an arithmetic mean was computed before
transforming back to dBA yielding personal occupational noise intensity levels, hereafter
referred to as noise levels according to the following formula: 10 x log [∑(10dB(A)/10 x T)].
Measurements were obtained on ordinary working days all year round to account for potential
seasonal variation in exposure.
Expert assessment
During 2016, four specialists in occupational medicine with at least 10 years of experience
evaluating occupational exposures within industries and jobs rated noise levels for jobs
included in DISCO 88. In order to qualify ratings, we a priori randomly selected
approximately half (n=35) of the jobs with ≥ 5 noise measurements (mean of 21
measurements per job) in our database to benchmark their assessments. For these jobs, the
experts were informed on mean, median and range of dBA values measured, and the number
of underlying measurements. The experts independently rated the expected average exposure
intensity for a worker during a standard working day of 7.5 hour for each of the remaining
337 jobs (22 jobs with estimated noise exposure level blinded to the experts and 315 jobs with
no or <5 measurements (n=43) and classified each job as low level (<80 dBA), medium level
(80-84 dBA) or high level (≥ 85dBA) exposed. The experts discussed discrepancies in ratings;
based on relevant literature and sound arguments they reached consensus for all jobs. Before
discussing discrepancies and reaching final consensus, 3 or all 4 experts agreed on the ratings
in 85% of the cases, with a kappa of 0.77 for the overall agreements between the experts.
Statistical methods
Noise exposure grouping strategy
6
In order to examine variance components and predictors of noise exposure intensity, we fitted
linear mixed effect models in STATA (mixed-command) using restricted maximum
likelihood estimation, with mean noise exposure level as the dependent variable and job and
worker as random effects including all measurements. We checked the adequacy of the
models confirming the normal distribution of the residuals by QQ-plots and
linearity/homogeneity by scatterplots of the residuals versus fitted values.
Statistical model
The model structure was:
Y = β0 + βsex + βage + β (Ibenchmark x I rating) + βoccupational class +β (Calendar year x I βoccupational class)
+ bjob + bworker +ɛ
The model terms were:
Y: noise level in dB
β0: model intercept
βsex: categorical variable for sex (woman used as reference)
βage: continuous variable for age (40-year-old as reference)
β (Ibenchmark x I rating): categorical interaction term between benchmark (yes, no) and expert
rating (low, medium, high exposed)
βoccupational class: categorical variable for occupational class (blue-, white-collar used as
reference)
β (calendar year x I βoccupational class): continuous interaction term between calendar year
(continuous with 2010 as a reference) and occupational class (blue-, white-collar)
bjob: random effect term for job
bworker: random effect term for worker
ɛ: residual error (within worker)
Information on sampling duration was also assessed but not included in the model because of
statistical insignificance (p-value >0.05). P-values were not corrected for model selection or
multiple testing.
The random effect terms bjob and bworker were assumed statistically independent and normally
distributed with means 0 and two different variance components representing the between job
variance and the between worker (within job) variance. We obtained best linear unbiased
predictions (BLUPs) of the coefficients for each of the jobs with noise measurements
(n=100). The BLUPs shrink the estimates toward the overall mean exposure of the expert
7
score when there are few measurements and pulls the estimates toward the individual
measurements when either there are more measurements available or the exposure variability
is low.
We aimed at assessing noise exposure levels for each of the 372 jobs described by the DISCO
88. Jobs without measurements were assigned the weighted mean noise exposure level
derived from the model for the corresponding category of the expert ratings. For jobs with
exposure measurements available, the job specific prediction from the statistical model
(BLUP) was added to the noise exposure estimate. Thus, an exposure level for all 372 jobs,
sex, age, benchmark and year were estimated.
All analyses were performed using STATA 14.1 (StataCorp LP, College Station, TX, USA).
Results
Noise levels varied between 56 and 107 dBA with an arithmetic mean of 81.7 dBA and a SD
of 6.6. Noise level increased through the expert ratings and was higher among blue-collar
jobs. Mean noise exposure decreased with increasing calendar year and age and was lower
among women than men (Table 2).
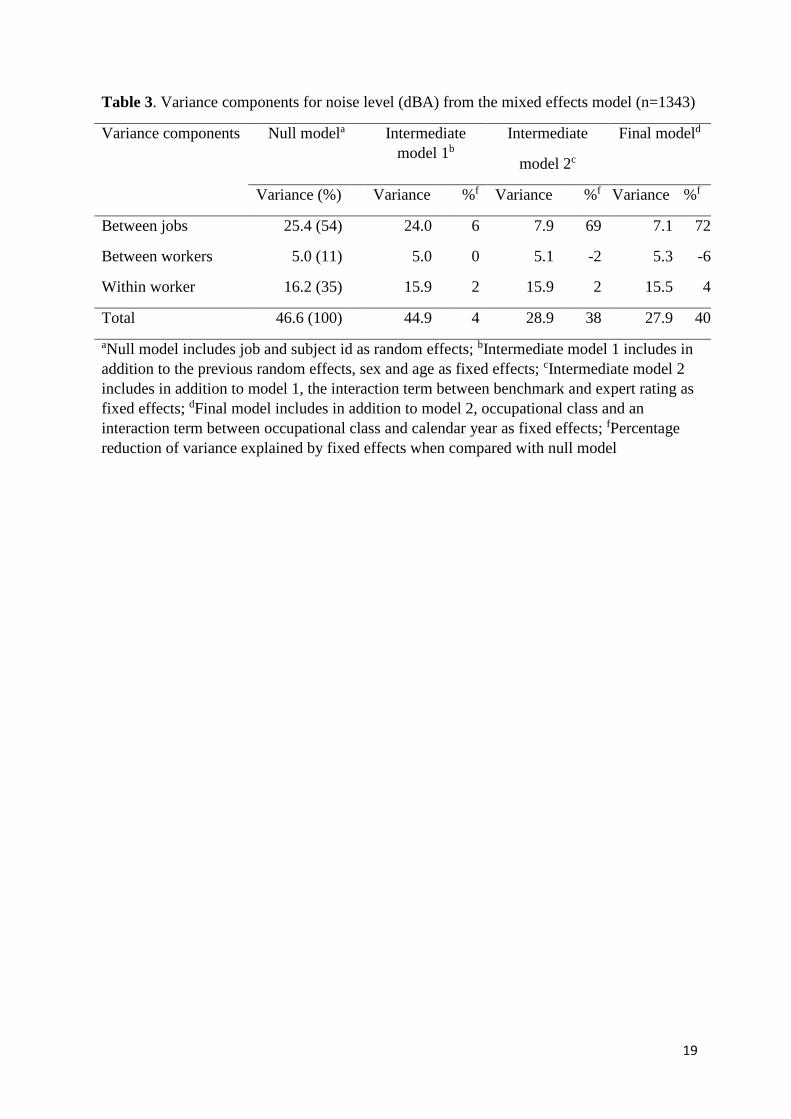
Table 3 presents variance components for noise level from the mixed effects model. More
than 50% (25.4/46.6) of the total variance was between jobs as can be seen from the null
model that only included random effects. By including sex and age as fixed effects, we
observed a 6% reduction of the variance between jobs. When we added the interaction term
between benchmark and expert rating as fixed effect this value increased to 69%, reaching
finally a 71% reduction when we added occupational class and the interaction term between
occupational class and calendar year as fixed effects in the final model.
The fixed effects model parameters are presented in Table 4. Noise level was higher among
men and blue-collar workers. Noise level decreased with increasing age and showed an 0.1
dBA annual decline by increasing calendar year among blue-collar workers while no such
trend was apparent for white-collar workers (test for interaction between occupational class
and calendar year, p=0.012). While medium exposed benchmark jobs were 1 dBA higher than
the medium exposed expert rated jobs (5.99 vs. 4.88 dBA), the corresponding difference was
3 dBA for the high exposed jobs (9.48 vs. 6.41 dBA) (test for interaction between benchmark
and expert rated jobs, p=0.025).
8
Table 5 shows model-based mean noise levels (dBA) for the ten highest and the ten lowest
exposed jobs as estimated for 40-year old male workers in 2010. Metal wheel-grinders,
polishers and tool sharpeners presented the highest level of 88.9 dBA while finance and sales
associate professionals showed the lowest noise level of 70.2 dBA.
Among low, medium and high exposed workers, 12%, 24%, and 29% used hearing protection
according to log-book information (data not shown).
Supplementary table A presents the number of all 372 jobs as defined at the 4-digit level in
DISCO 88 and the number of jobs represented in the dataset for the nine major job categories.
In total, 27% of all jobs were represented in our sample. We prioritized sampling of jobs with
expected high noise exposure levels. A total of 46% of all jobs in the major job category 8
"Plant and machine operators and assemblers" were represented in the data. We also included
low and medium exposed jobs. The noise JEM will be made freely available at the DOC-X
homepage (http://doc-x.dk/).
Discussion
We created a general population quantitative JEM with estimates of personal occupational
noise intensity level specific for sex, age and calendar year. The model calibrated the expert
ratings to a scale (dBA). This enables assessment of job and calendar year specific exposure
levels of occupational noise for all jobs represented in Denmark including those with missing
quantitative information. The JEM will be applicable to epidemiological studies addressing
exposure-response relations between occupational noise exposure and cardiovascular and
other health effects hypothesized to be associated with noise exposure in and outside work.
Two JEMs of occupational noise exposure for the general population have previously been
described. Sjöström et al. developed a Swedish expert based semi-quantitative 3-level JEM
for 321 jobs within the Nordic Occupational Classification system based on ISCO 58. The
expert assessment was informed on 569 measurements from 129 jobs. Twenty five percent of
the measurements were personal and included both short-time and full-shift measurements
from 1970-2004, with most measurements collected during 1995-1999 (Sjöström et al., 2013).
Recently, Roberts et al. reported a quantitative JEM including 753,702 measurements among
443 broad level standard occupational classification groups in the US (Roberts et al., 2018).
The measurements were mainly obtained from the US government occupational exposure
9
databases (85%), private industry (14%), and published literature (1%) and made according to
the Occupational Safety and Health Administration´s (OSHA) permissible exposure limit of
90 dBA criterion level and threshold, and 5 a dB time-intensity exchange rate. They used
imputation statistics for jobs with no available measurements(Roberts et al., 2018) and had
previously conducted a meta-analysis to ensure high heterogeneity across different job titles
(Cheng et al., 2018) . In contrast to this extensive dataset and to the Swedish JEM, we used
personal noise measurements collected in accordance with a research protocol, thereby
circumventing some problems with hot spot measurements or worst case sampling (Cherrie,
2003).
We observed that women were exposed to less noise than men within the same jobs and we
were thus able to capture some of the exposure variation within jobs. Lacking ability to go
beyond the job is a major limitation of most JEMs (Greenland et al., 2016; Kauppinen et al.,
1992). There have previously been indications of sex differences in occupational exposure
levels within the same jobs for assembly workers and janitors (Locke et al., 2014). Some
argue that these differences could either be due to differences in either tasks or reporting (Eng
et al., 2011; Lacourt et al., 2018), however, this might not always be the case (Heilskov-
Hansen et al., 2014). It could be argued that the noise level difference observed is due to sex
differences between jobs rather than within jobs, however in 52% of all jobs both men and
women are represented. And for up to 62% of blue-collar jobs, measurements on both sexes
were available (data not shown).
Interestingly, we also found a decrease of noise exposure by increasing age, which could
reflect changes to less exposed tasks over working years within the same job (Cassidy, 2017).
To our knowledge, only few previous JEMs have combined expert ratings with measurements
in a statistical model framework (Friesen et al., 2012; Peters et al., 2011; Vested et al., 2019).
Applied in epidemiological studies, the use of general population JEMs have recently
depicted the shape of the exposure response relation between low level asbestos and silica
exposure and lung cancer in a population-based case control study (De Matteis et al., 2012;
Olsson et al., 2017).
More than 50% of the total variance of our dataset was between jobs and this is more than
often seen in general population or industry specific exposure (Friesen et al., 2012; Kromhout
et al., 1993; Peters et al., 2011). Since noise exposure is prevalent in many jobs, this is
expected to reflect considerable variation in noise levels across jobs (Kock et al., 2004).
10
Measurements were performed in companies within industries with high reporting of noise
induced hearing loss, which might overestimate noise exposure for the same jobs also
represented in industries with lower noise levels and reporting of noise induced hearing loss.
Adding the fixed effects to the model explained up to 72% of the between job variance,
mostly attributed to the expert ratings. This proportion was about 43% and 18% in Friesen´s
and Peters´ studies of benzene and quartz exposure, respectively (Friesen et al., 2012; Peters
et al., 2011). Hence, most of the variance could be attributed to jobs.
There is a general concern about lack in consistency for expert rating of occupational
exposures, and the agreement between experts can vary from poor to very good depending on
the exposure (Friesen et al., 2011; Teschke et al., 2002). In order to improve homogeneity
between the different experts' ratings, we selected 35 benchmark jobs that permitted the
experts to calibrate their estimates to a common scale. This resulted in a very good agreement
between the experts (kappa=0.77) before discussing discrepancies and reaching final
consensus (Teschke et al., 2002). Noise exposure increased monotonically with increasing
expert rating, however, we observed that experts were not able to capture the full exposure
contrast in noise exposure level by overestimating low and underestimating high noise levels.
A comprehensive study estimated historical levels and long-term trends in occupational
exposures, and found that most exposures declined between 4% and 14% per year, with a
median value of 8% per year influenced by exposure factors including type of monitoring,
historical changes in the threshold limit values (TLVs), and period of sampling (Symanski et
al., 1998). Several other papers have documented the same decreasing trend in occupational
noise exposure (Joy and Middendorf, 2007; Middendorf, 2004; Neitzel et al., 2014; Neitzel et
al., 2011; Sayler et al., 2019). Roberts et al., also reported decreasing occupational noise
exposures in 40.9% of the major classification groups (Roberts et al., 2018). Parallel results
have also been seen by others. Likewise, we observed a linear 0.1 dB annual decline of noise
level among blue-collar workers. This finding provides the possibility to evaluate exposure
changes over time that could be an important source of exposure misclassification if left
unaccounted. Our dataset only included noise recordings made between 2001 and 2010.
Extrapolating noise levels several years back in time based on the linear trend observed within
this rather brief period is however not warranted.

11
Our elaborated final model provides estimates of personal ambient noise exposure levels that
may be significantly attenuated by hearing protection (Arlien-Søborg et al., 2016; Frederiksen
et al., 2017; Stokholm et al., 2014). Based on questionnaire information, about 74% of highly
exposed workers used hearing protective devices in our cohort. Neitzel et al. reported that
workers exposed above 85dBA who reported always using hearing protective devices,
actually only wore them one third of the time (Neitzel, Richard and Seixas, 2005), which was
also the case in our population according to the log-book reporting. With information on the
usage of hearing protection across jobs, it is possible to adjust exposure assessment. Mean
noise level declined about 2 dBA when accounting for the use of hearing protection devices in
a subsample of this population assuming a reduction of an average 10 dBA when wearing
protection (Stokholm et al., 2014).
This study was performed in random samples of small and large companies within a range of
selected industries with high reporting of noise induced hearing loss. Some of the reasons for
declining participation (such as time lag or organizational changes) may not be related to
noise levels, but there is a risk of bias if companies with high noise levels due to limited
resources declined to participate, resulting in underestimation of actual noise levels. Still, it is
plausible that companies that successfully have solved a noise problem would be less
interested in participating. However, neither the participation rate at the industry nor the
number of workers per industry was related to the measured noise levels. Workers were
mainly selected by foremen and managers so as to have at least one employee from each work
area, and this selection might have resulted in bias in an unpredictable direction. Nevertheless,
we expect the measurements to be representative of these industries.
We did not have full-shift measurements for all workers, but sampling time was not defined
by the participants but by the research team, and we regard the included measurements to be
representative of full-shift levels. For that reason, it was not relevant to normalize levels to
full shift duration.
We only had repeated measurements from a few workers. This could bias the results if only
highly motivated workers chose to participate in both measurement campaigns. Still, about
50% of workers agreed to participate in the second campaign when re-invited. However, only
36% (18 % of all participants) had operational measurements, as the remaining were either
performed during days off, or from unemployed or pensioned workers (Frederiksen et al.,
2017).
12
Some non-differential misclassification could also affect the results as 1-minute resolution
questionnaire information was synchronized with 5-second resolution noise level data.
It is problematic to compare these model-based noise levels with the two previous published
JEMs on noise exposure. In Europe, we use a stricter noise exposure standard than in the US
(85 dBA level and a 3 dB time-intensity exchange rate). Thus, US levels are expected to be
higher(Roberts et al., 2018) . Furthermore, Roberts et al. used 443 jobs according to the broad
standard occupational classification (SOC) and Sjöström et al. used 321 jobs classified
according to the Nordic Occupational Classification system (NYK) (Sjöström et al., 2013),
which likewise makes comparability difficult. However, it is possible to compare few jobs
across the three JEMs. In the Swedish JEM most measurements were collected during 1995-
99, and based on this assumption butchers, for example, are exposed to a median of 90 dBA, a
mean of 90.6 dBA according to Roberts et al. and a mean of 90.3 dBA for a 40-year old male
in 1995 according to this JEM. The latter estimate reflected a 2.2 dBA increase from 2010
back to 1995. An increase of 3 dB was observed for the major SOC group in the same period
in the American JEM. Likewise, workshop mechanics are exposed to a mean of 82.7 dB in
2010 (reference year), corresponding to 85.0 dBA in 1995 according to this JEM, a median of
88 dBA in the Swedish JEM and 83.7 dBA according to the American JEM.
Conclusion
The noise estimates of this JEM can guide future preventive efforts, not only focusing on
specific jobs but also targeting age and sex. Additionally, this occupational noise exposure
matrix can be used in epidemiological studies to investigate exposure-response relations
between occupational noise exposure and health effects. This quantitative JEM is designed for
epidemiological studies of the general population as noise exposure is ubiquitous and not
restricted to specific industries. The JEM provides exposure levels by calendar year which is
highly relevant for estimating duration of and cumulative contemporary noise exposure
retrospectively, which may predict otological, cardiovascular and other non-contagious
diseases. Furthermore, we showed the usefulness of applying benchmarks for the calibration
of expert assessment.
13
References
Arlien-Søborg MC, Schmedes AS, Stokholm ZA, Grynderup MB, Bonde JP, Jensen CS,
Hansen ÅM, Frederiksen TW, Kristiansen J, Christensen KL, Vestergaard JM, Lund SP,
Kolstad HA. (2016) Ambient and at-the-ear occupational noise exposure and serum lipid
levels. Int Arch Occup Environ Health 89:1087-1093.
Burns KN, Sun K, Fobil JN, Neitzel RL. (2016) Heart rate, stress, and occupational noise
exposure among electronic waste recycling workers. International Journal of Environmental
Research and Public Health 13:140.
Cassidy H. (2017) Task variation within occupations. Ind Relat 56:393 410-410.
Cheng W, Roberts B, Mukherjee B, Neitzel RL. (2018) Meta-analysis of job-exposure matrix
data from multiple sources. Journal of Exposure Science & Environmental Epidemiology
28:259-274.
Cherrie JW. (2003) The beginning of the science underpinning occupational hygiene. Ann
Occup Hyg 47:179.
De Matteis S, Consonni D, Lubin JH, Tucker M, Peters S, Vermeulen RC, Kromhout H,
Bertazzi PA, Caporaso NE, Pesatori AC, Wacholder S, Landi MT. (2012) Impact of
occupational carcinogens on lung cancer risk in a general population. Int J Epidemiol 41:711-
721.
DISCO. (2011) https://www.dst.dk/en/statistik/dokumentation/nomenklaturer/disco-88
(accessed 14 May 2019).
Eng A, 't Mannetje A, McLean D, Ellison-Loschmann L, Cheng S, Pearce N. (2011) Gender
differences in occupational exposure patterns. Occup Environ Med 68:888-894.
Eurofound. (2016) Sixth European working conditions survey – overview report, publications
office of the European union, Luxembourg.
http://www.eurofound.europa.eu/sites/default/files/ef_publication/field_ef_document/ef1634e
n.pdf (accessed 14 May 2019).
Frederiksen TW, Ramlau-Hansen CH, Stokholm ZA, Grynderup MB, Hansen ÅM,
Kristiansen J, Vestergaard JM, Bonde JP, Kolstad HA. (2017) Noise-induced hearing loss - A
preventable disease? Results of a 10-year longitudinal study of workers exposed to
occupational noise. Noise & Health 19:103-111.
Friesen MC, Coble JB, Lu W, Shu XO, Ji BT, Xue S, Portengen L, Chow WH, Gao YT,
Yang G, Rothman N, Vermeulen R. (2012) Combining a job-exposure matrix with exposure
measurements to assess occupational exposure to benzene in a population cohort in shanghai,
china. Ann Occup Hyg 56:80-91.

14
Friesen MC, Coble JB, Katki HA, Ji B, Xue S, Lu W, Stewart PA. (2011) Validity and
reliability of exposure assessors' ratings of exposure intensity by type of occupational
questionnaire and type of rater. Ann Occup Hyg 55:601-611.
Greenland S, Fischer HJ, Kheifets L. (2016) Methods to explore uncertainty and bias
introduced by job exposure matrices. Risk Anal 36:74-82.
Heilskov-Hansen T, SWS, Thomsen J, Mikkelsen S, Hansson G. (2014) Sex differences in
task distribution and task exposures among danish house painters: An observational study
combining questionnaire data with biomechanical measurements. PLoS One 9.
Hornung RW and Reed LD. (1990) Estimation of average concentration in the presence of
non-detectable values. App Occup Environ Hyg 5:46-51.
Joy GJ and Middendorf PJ. (2007) Noise exposure and hearing conservation in U.S. coal
mines-A surveillance report. Journal of Occupational and Environmental Hygiene 4:26-35.
Kauppinen TP, Mutanen PO, Seitsamo JT. (1992) Magnitude of misclassification bias when
using a job-exposure matrix. Scand J Work Environ Health 18:105.
Kock S, Andersen T, Kolstad HA, Kofoed-Nielsen B, Wiesler F, Bonde JP. (2004)
Surveillance of noise exposure in the danish workplace: A baseline survey. Occup Environ
Med 61:838-843.
Kromhout H, Symanski E, Rappaport SM. (1993) A comprehensive evaluation of within- and
between-worker components of occupational exposure to chemical agents. Ann Occup Hyg
37:253-270.
Lacourt A, Labreche F, Goldberg MS, Siemiatycki J, Lavoue J. (2018) Agreement in
occupational exposures between men and women using retrospective assessments by expert
coders. Ann Work Expo Health.
Locke SJ, Colt JS, Stewart PA, Armenti KR, Baris D, Blair A, Cerhan JR, Chow W, Cozen
W, Davis F, De Roos AJ, Hartge P, Karagas MR, Johnson A, Purdue MP, Rothman N,
Schwartz K, Schwenn M, Severson R, Silverman DT, Friesen MC. (2014) Identifying gender
differences in reported occupational information from three US population-based case-control
studies. Occup Environ Med 71:855-864.
Middendorf PJ. (2004) Surveillance of occupational noise exposures using OSHA's integrated
management information system. American Journal of Industrial Medicine 46:492-504.
Neitzel RL, Galusha D, Dixon-Ernst C, Rabinowitz PM. (2014) Methods for evaluating
temporal trends in noise exposure. International Journal of Audiology 53:S76-S83.
Neitzel RL, Stover B, Seixas NS. (2011) Longitudinal assessment of noise exposure in a
cohort of construction workers. Annals of Occupational Hygiene 55:906-916.

15
Neitzel R and Seixas N. (2005) The effectiveness of hearing protection among construction
workers. Journal of Occupational and Environmental Hygiene 2:227-238.
Olsson AC, Vermeulen R, Schuz J, Kromhout H, Pesch B, Peters S, Behrens T, Portengen L,
Mirabelli D, Gustavsson P, Kendzia B, Almansa J, Luzon V, Vlaanderen J, Stucker I, Guida
F, Consonni D, Caporaso N, Landi MT, Field J, Bruske I, Wichmann HE, Siemiatycki J,
Parent ME, Richiardi L, Merletti F, Jockel KH, Ahrens W, Pohlabeln H, Plato N, Tardon A,
Zaridze D, McLaughlin J, Demers P, Szeszenia-Dabrowska N, Lissowska J, Rudnai P,
Fabianova E, Stanescu Dumitru R, Bencko V, Foretova L, Janout V, Boffetta P, Bueno-de-
Mesquita B, Forastiere F, Bruning T, Straif K. (2017) Exposure-response analyses of asbestos
and lung cancer subtypes in a pooled analysis of case-control studies. Epidemiology 28:288-
299.
Pedersen CB. (2011) The Danish civil registration system. Scand J Public Health 39:22-25.
Peters S, Vermeulen R, Cassidy A, 't Mannetje A, van Tongeren M, Boffetta P, Straif K,
Kromhout H. (2011) Comparison of exposure assessment methods for occupational
carcinogens in a multi-centre lung cancer case-control study. Occupational and
Environmental Medicine 68:148-153.
Peters S, Vermeulen R, Portengen L, Olsson A, Kendzia B, Vincent R, Savary B, Lavoué J,
Cavallo D, Cattaneo A, Mirabelli D, Plato N, Fevotte J, Pesch B, Brüning T, Straif K,
Kromhout H. (2011) Modelling of occupational respirable crystalline silica exposure for
quantitative exposure assessment in community-based case-control studies. Journal of
Environmental Monitoring: JEM 13:3262-3268.
Prince MM. (2002) Distribution of risk factors for hearing loss: Implications for evaluating
risk of occupational noise-induced hearing loss. The Journal of the Acoustical Society of
America 112:557-567.
Roberts B, Cheng W, Mukherjee B, Neitzel RL. (2018) Imputation of missing values in a
large job exposure matrix using hierarchical information. J Expo Sci Environ Epidemiol.
Rubak T, Kock S, Koefoed-Nielsen B, Peter Lund S, Peter Bonde J, Kolstad HA. (2008) The
risk of tinnitus following occupational noise exposure in workers with hearing loss or normal
hearing. International Journal of Audiology 47:109-114.
Sayler SK, Roberts BJ, Manning MA, Sun K, Neitzel RL. (2019) Patterns and trends in
OSHA occupational noise exposure measurements from 1979 to 2013. Occup Environ Med
76:118-124.
Selander J, Albin M, Rosenhall U, Rylander L, Lewne M, Gustavsson P. (2016) Maternal
occupational exposure to noise during pregnancy and hearing dysfunction in children: A
nationwide prospective cohort study in sweden. Environmental Health Perspectives 124:855-
860.
16
Sjöström M, Lewné M, Alderling M, Willix P, Berg P, Gustavsson P, Svartengren M. (2013)
A job-exposure matrix for occupational noise: Development and validation. Ann Occup Hyg
57:774.
Skogstad M, Johannessen HA, Tynes T, Mehlum IS, Nordby KC, Lie A. (2016) Systematic
review of the cardiovascular effects of occupational noise. Occup Med (Lond ) 66:10-16.
Stokholm ZA, Hansen ÅM, Grynderup MB, Bonde JP, Christensen KL, Frederiksen TW,
Lund SP, Vestergaard JM, Kolstad HA. (2014) Recent and long-term occupational noise
exposure and salivary cortisol level. Psychoneuroendocrinology 39:21-32.
Symanski E, Kupper LL, Hertz-Picciotto I, Rappaport SM. (1998) Methodology:
Comprehensive evaluation of long term trends in occupational exposure: Part 2. predictive
models for declining exposures. Occup Environ Med 55:310-316.
Teschke K, Olshan AF, Daniels JL, De Roos AJ, Parks CG, Schulz M, Vaughan TL. (2002)
Occupational exposure assessment in case-control studies: Opportunities for improvement.
Occup Environ Med 59:575-93; discussion 594.
The Danish Working Environment Authority. (2019) https://osha.europa.eu/en/about-eu-
osha/national-focal-points/denmark. (accessed 14 May 2019).
Thygesen LC, Daasnes C, Thaulow I, Brønnum-Hansen H. (2011) Introduction to Danish
(nationwide) registers on health and social issues: Structure, access, legislation, and archiving.
Scandinavian Journal of Public Health 39:12-16.
Vested A, Schlunssen V, Burdorf A, Andersen JH, Christoffersen J, Daugaard S, Flachs EM,
Garde AH, Hansen AM, Markvart J, Peters S, Stokholm Z, Vestergaard JM, Vistisen HT,
Kolstad HA. (2019) A quantitative general population job exposure matrix for occupational
daytime light exposure. Ann Work Expo Health 63:666-678.
Wild P, Sauleau EA, Bourgkard E, Moulin JJ. (2002) Combining expert ratings and exposure
measurements: A random effect paradigm. Ann Occup Hyg 46:479-487.

17
Table 1. Number of companies, jobs, workers and noise measurements by calendar year
Companies Jobsa Workers Measurements
N % N % N % N %
2001-03 23 13 16 16 532 47 532 40
2001-03 & 2009-10 62 35 62 62 203 18 406 30
2009-10 90 52 22 22 405 35 405 30
Total 175 100 100 100 1 140 100 1 343 100
aJobs within the DISCO 88, the Danish version of the International Standard Classification of
Occupations (ISCO), revision 1988

18
Table 2. Number of samples and distribution of noise levels (dBA), overall and by level of
selected variables
Variable Na %b Mean SD
Overall 1 343 100 81.7 6.6
Sex
Women 323 24 78.3 7.1
Men 1 020 76 82.8 6.0
Age (tertiles)
18-37 years 470 35 82.4 6.8
38-46 years 457 34 81.6 6.3
47-65 years 416 31 81.2 6.5
Rating
Low exposed 250 19 74.2 7.3
Medium exposed 541 40 81.9 4.4
High exposed 552 41 85.0 5.0
Calendar year
2001 52 4 84.4 5.4
2002 599 45 82.2 6.5
2003 84 6 82.6 6.7
2009 333 25 81.3 6.4
2010 275 20 80.5 6.7
Occupational class
White-collar 299 22 75.6 7.5
Blue-collar 1 044 78 83.5 5.0
aNumber of samples; bRelative percentages of samples by level
19
Table 3. Variance components for noise level (dBA) from the mixed effects model (n=1343)
Variance components Null modela Intermediate
model 1b
Intermediate
model 2c
Final modeld
Variance (%) Variance %f Variance %f Variance %f
Between jobs 25.4 (54) 24.0 6 7.9 69 7.1 72
Between workers 5.0 (11) 5.0 0 5.1 -2 5.3 -6
Within worker 16.2 (35) 15.9 2 15.9 2 15.5 4
Total 46.6 (100) 44.9 4 28.9 38 27.9 40
aNull model includes job and subject id as random effects; bIntermediate model 1 includes in
addition to the previous random effects, sex and age as fixed effects; cIntermediate model 2
includes in addition to model 1, the interaction term between benchmark and expert rating as
fixed effects; dFinal model includes in addition to model 2, occupational class and an
interaction term between occupational class and calendar year as fixed effects; fPercentage
reduction of variance explained by fixed effects when compared with null model

20
Table 4. Fixed effects model parameters for noise levels (dBA) (n=1343)
β SE P-value
Intercept 72.88 1.22 <0.001
Sex
Woman Ref.
Man 1.25 0.41 0.002
Occupational class
White-collar Ref.
Blue-collar 2.77 1.08 0.011
Agea -0.04 0.01 0.012
Calendar year*occupational classb 0.012
White-collar 0.06 0.07 0.357
Blue-collar -0.14 0.04 <0.001
Benchmarkc*ratingd 0.025
Yes
Low exposed Ref.
Medium exposed 5.99 1.48 <0.001
High exposed 9.48 1.71 <0.001
No
Low exposed 1.87 1.36 0.172
Medium exposed 4.87 1.74 0.006
High exposed 6.41 1.64 <0.001
aAge is standardised to 40 years (continuous); bInteraction term between calendar year
standardised to year 2010 (continuous) and occupational class (dichotomous); cExpert
rating for no benchmark group (low, medium, high exposed); bInteraction term between
benchmark and ratings

21
Table 5. Model-based noise level (dBA) for the ten highest and the ten lowest exposed jobs as
estimated for a 40-year old male worker in 2010 among 100 estimated jobs
Jobsa Job description N Mean
Ten highest exposed jobs
7224 Metal wheel-grinders, polishers and tool sharpeners 6 88.9
8123 Metal-heat-treating-plant operators 8 88.7
7411 Butchers, fishmongers and related food preparers 11 88.1
8275 Fruit-, vegetable- and nut-processing-machine operators 6 86.8
8240 Wood-products machine operators 37 86.3
8271 Meat- and fish-processing-machine operators 20 85.9
7212 Welders and flame cutters 6 85.8
7423 Woodworking machine setters and setter-operators 35 85.7
7211 Metal molders and core makers 12 85.6
8274 Baked-goods, cereal and chocolate-products machine operators 8 85.5
Ten lowest exposed jobs
3419 Finance and sales associate professionals not elsewhere classified <4 70.2
4212 Tellers and other counter clerks <4 70.3
2441 Economists <4 70.7
2419 Business professionals not elsewhere classified 17 71.8
4190 Other office clerks 12 71.9
1227 Production and operations department managers in business services <4 72.0
3411 Securities and finance dealers and brokers <4 72.8
3118 Draughts persons <4 73.0
2351 Education methods specialists <4 73.6
1231 Finance and administration department managers <4 74.1
aJobs within the DISCO 88, the Danish version of the International Standard Classification of
Occupations (ISCO), revision 1988

22
Supplementary material
Table A. Number of jobs defined at the 4-digit level within the nine major groups and the
number of jobs with noise level measurements
Major groupsa Total Jobs with
measurements
N N %
Overall 372 100 27
1 Legislators, senior officials and managers 32 5 16
2 Professionals 55 6 11
3 Technicians and associate professionals 70 12 17
4 Clerks 22 7 32
5 Service workers and shop and market sales workers 20 <4 15
6 Skilled agricultural and fishery workers 12 <4 8
7 Craft and related trades workers 71 28 39
8 Plant and machine operators and assemblers 70 32 46
9 Elementary occupations 20 6 30
aMajor groups within the DISCO 88, the Danish version of the International Standard
Classification of Occupations (ISCO), revision 1988


![Summary of Key Changes on Singapore Financial Reporting … · 2015. 6. 3. · Qualitative and quantitative information [FRS 107.31] • Summary quantitative data about its exposure](https://static.fdocuments.us/doc/165x107/602c2717317bce0ef80962ca/summary-of-key-changes-on-singapore-financial-reporting-2015-6-3-qualitative.jpg)