A Quantitative Cell-Based High-Content Screening Assayccc.chem.pitt.edu/wipf/Current...
24
A Quantitative Cell-Based High-Content Screening Assay for the Epidermal Growth Factor Receptor-Specific Activation of Mitogen-Activated Protein Kinase Richik N. Ghosh, Linnette Grove, and Oleg Lapets ASSAY and Drug Development Technologies 2004, 2: 473-481 Current Literature Presentation Jelena 02-26-2005 Jelena @ Wipf group 1 3/1/2005
Transcript of A Quantitative Cell-Based High-Content Screening Assayccc.chem.pitt.edu/wipf/Current...
A Quantitative Cell-Based High-Content Screening Assay for the Epidermal Growth
Factor Receptor-Specific Activation of Mitogen-Activated Protein Kinase
Richik N. Ghosh, Linnette Grove, and Oleg Lapets
ASSAY and Drug Development Technologies2004, 2: 473-481
Current Literature PresentationJelena
02-26-2005
Jelena @ Wipf group
1 3/1/2005
MAPK – basic facts
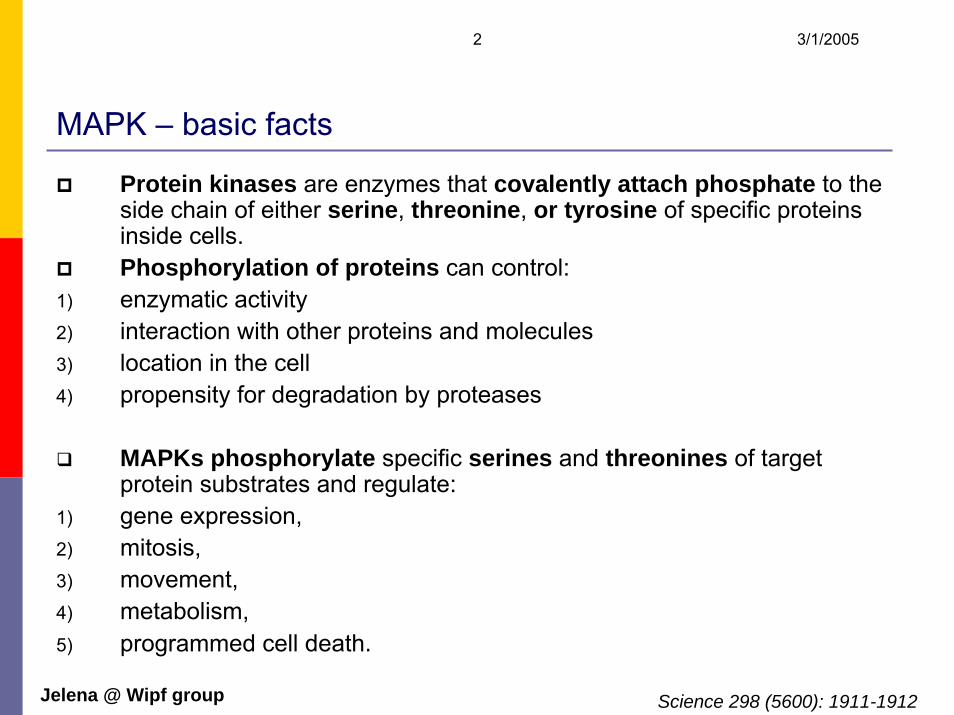
Protein kinases are enzymes that covalently attach phosphate to the side chain of either serine, threonine, or tyrosine of specific proteins inside cells.Phosphorylation of proteins can control:
1) enzymatic activity2) interaction with other proteins and molecules3) location in the cell4) propensity for degradation by proteases
MAPKs phosphorylate specific serines and threonines of target protein substrates and regulate:
1) gene expression,2) mitosis, 3) movement, 4) metabolism,5) programmed cell death.
Jelena @ Wipf group Science 298 (5600): 1911-1912
2 3/1/2005
MAPK – basic facts – cont.
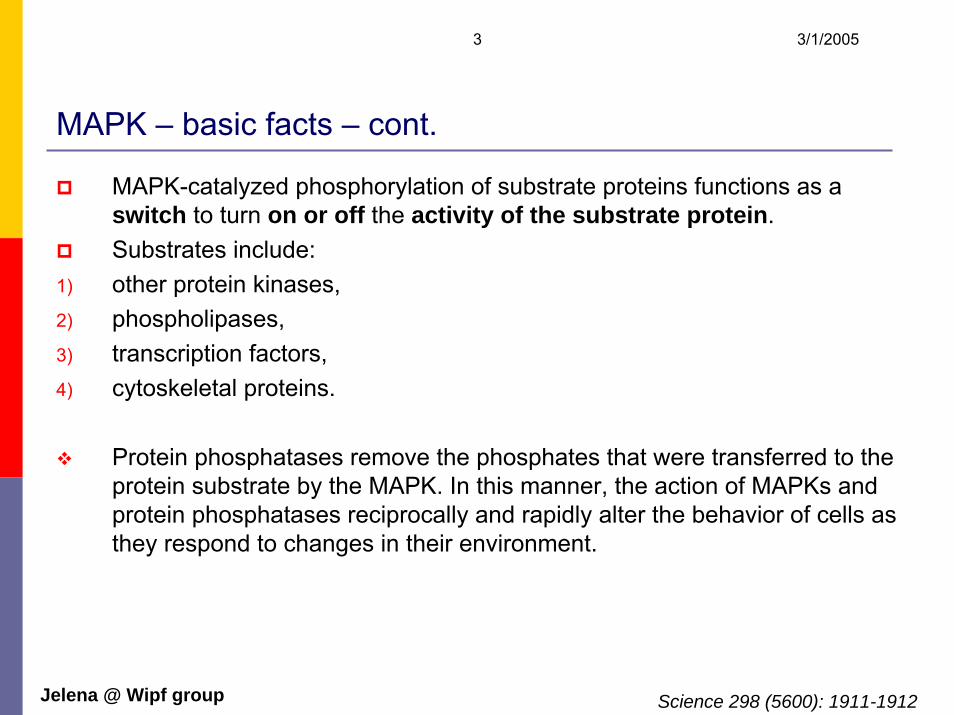
MAPK-catalyzed phosphorylation of substrate proteins functions as a switch to turn on or off the activity of the substrate protein. Substrates include:
1) other protein kinases, 2) phospholipases, 3) transcription factors,4) cytoskeletal proteins.
Protein phosphatases remove the phosphates that were transferred to the protein substrate by the MAPK. In this manner, the action of MAPKs and protein phosphatases reciprocally and rapidly alter the behavior of cells as they respond to changes in their environment.
Jelena @ Wipf group Science 298 (5600): 1911-1912
3 3/1/2005
MAPKs subfamilies
Extracellular signal-regulated kinases: ERK1 and ERK2involved in the regulation of meiosis, mitosis, and postmitotic functions in differentiated cells
c-Jun NH2-terminal kinases: JNK 1, JNK 2, and JNK 3isolated and characterized as stress-activated protein kinases on the basis of their activation in response to inhibition of protein synthesis p38 enzymes: p38α, p38β, p38γ, and p38δregulate the expression of many cytokinesactivated in immune cells by inflammatory cytokines and has an important role in activation of the immune responseactivated by many other stimuli, including hormones, ligands for G protein-coupled receptors, and stresses such as osmotic shock and heat shock.
Jelena @ Wipf group Science 298 (5600): 1911-1912
4 3/1/2005

MAPK phosphorelay systems
This is far from linear!Jelena @ Wipf group Science 298 (5600): 1911-1912
5 3/1/2005
Extracellular signal-regulated kinase: ERK1 and ERK2
ERK1 and ERK2 are proteins of 43 and 41 kDa that are nearly 85% identical overall, with much greater identity in the core regions involved in binding substrates The two phosphoacceptor sites, tyrosine and threonine, which are phosphorylated to activate the kinases, are separated by a glutamate residue in both ERK1 and ERK2 to give the motif TEY in the activation loop
Widely expressedInvolved in the regulation of meiosis, mitosis, and postmitotic functions in differentiated cells. Many different stimuli, including growth factors, cytokines, virus infection, ligandsfor heterotrimeric guanine nucleotide– binding protein (G protein)–coupled receptors, transforming agents, and carcinogens, activate the ERK1 and ERK2 pathways.ERKs 1 and 2 are both components of a three-kinase phosphorelay module that includes the MKKK c-Raf1, B-Raf, or A-Raf, which can be activated by the proto-oncogene Ras.
Science 298 (5600): 1911-1912Endocrine Reviews 22 (2): 153-183Jelena @ Wipf group
6 3/1/2005
Growth factors activate ERKs
In response to epidermal growth factor (EGF), the ERK2 translocatesinto the nucleus.When ERK2 is activated in the cytoplasm, it moves to the nucleus after it is phosphorylated by a mechanism, which has been reported to include at least two pathways:
1. passive diffusion of a monomer and 2. active transport of a dimmer
The EMBO 1999,18, 5347-5358
ERK2 tagged with GFP enters nucleus in a saturable, time and temperature dependent manner and involves a direct interaction with nuclear pore complex proteins.
Jelena @ Wipf group PNAS 2002, 99, 7496-7501
7 3/1/2005
Phosphorylation of ERK-2
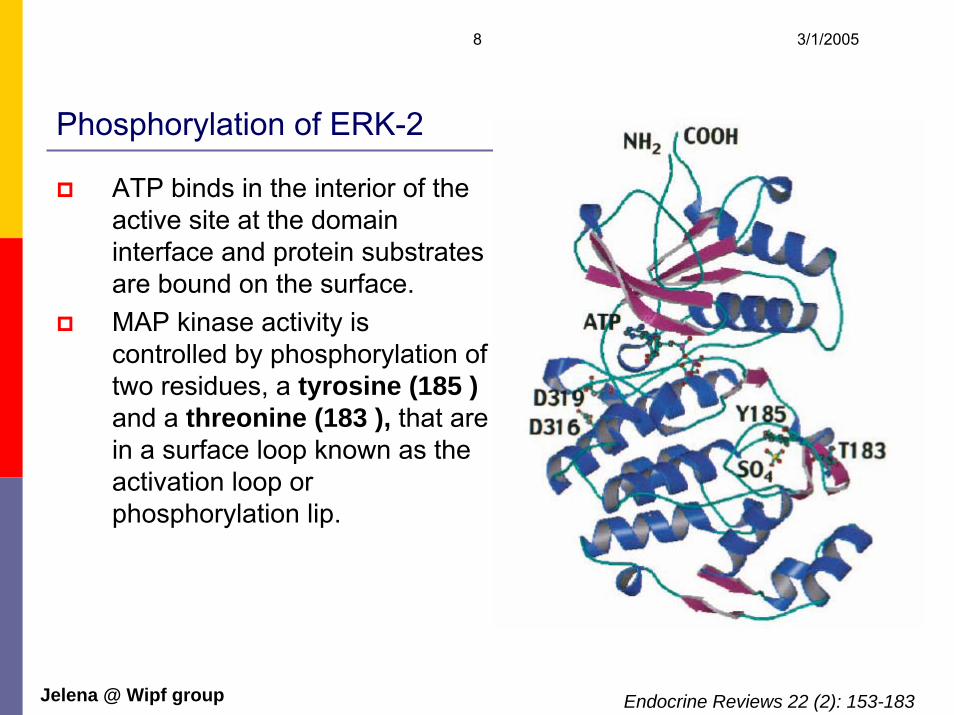
ATP binds in the interior of the active site at the domain interface and protein substrates are bound on the surface. MAP kinase activity is controlled by phosphorylation of two residues, a tyrosine (185 )and a threonine (183 ), that are in a surface loop known as the activation loop or phosphorylation lip.
Jelena @ Wipf group Endocrine Reviews 22 (2): 153-183
8 3/1/2005

http://stke.sciencemag.orgJelena @ Wipf group
9 3/1/2005
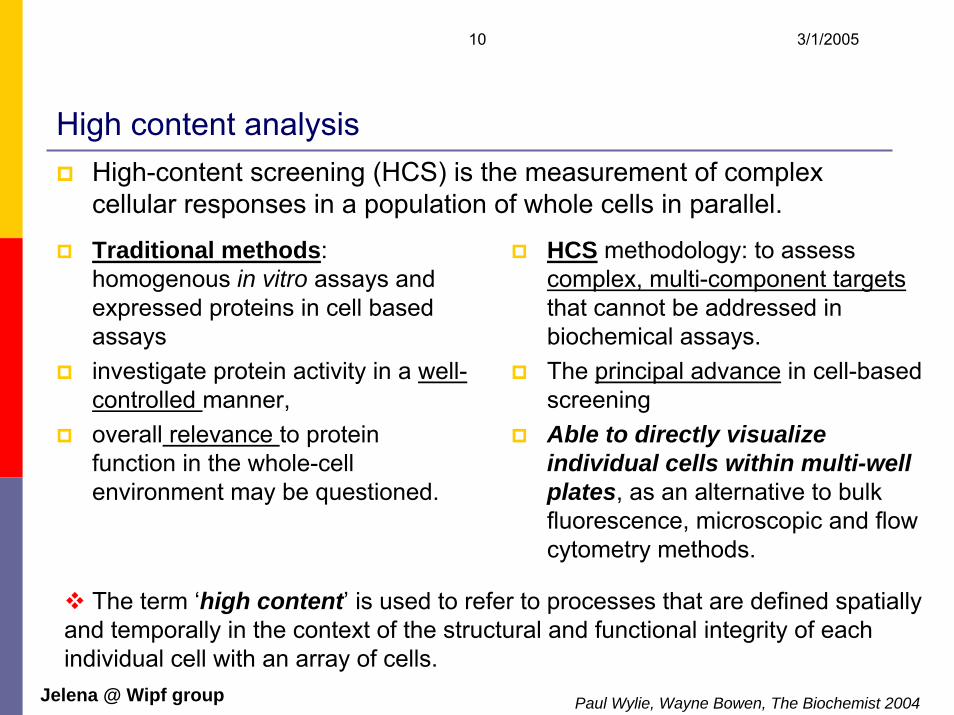
High content analysisHigh-content screening (HCS) is the measurement of complex cellular responses in a population of whole cells in parallel.
Traditional methods: homogenous in vitro assays and expressed proteins in cell based assaysinvestigate protein activity in a well-controlled manner,overall relevance to protein function in the whole-cell environment may be questioned.
HCS methodology: to assess complex, multi-component targetsthat cannot be addressed in biochemical assays.The principal advance in cell-based screeningAble to directly visualize individual cells within multi-well plates, as an alternative to bulk fluorescence, microscopic and flow cytometry methods.
The term ‘high content’ is used to refer to processes that are defined spatially and temporally in the context of the structural and functional integrity of each individual cell with an array of cells.
Jelena @ Wipf group Paul Wylie, Wayne Bowen, The Biochemist 2004
10 3/1/2005
Technological solutionsFluorescence microscopy:
• high resolution, • high information content, • huge data files (tera-bites)• best for validating primary screening hits.
Laser-scanning cytometry:• can be focus-independent• process data directly to rapidly detect and quantify all fluorescent• objects. • exceptionally fast read times (down to 3 minutes per plate)• used to identify objects
Analysis of multicolour fluorescence in fixed and/or live cells by detecting cellular events using fluorescently tagged markersMultiple cellular readouts within a single experiment.Fluorescent biomolecules employed as intracellular protein markers are a major advance for HCS.
Jelena @ Wipf group Paul Wylie, Wayne Bowen, The Biochemist 2004
11 3/1/2005

The flow from biological question to data acquisition and analysis and generation of cellular knowledge
The cycle must be iterated to build on available cellular knowledge. Fully integrated HCS tools are required to automate the processes described for performance on a large scale. Data analysis is represented as an iterative process to reflect the extraction of different kinds of cellular information from the same set of image data.
Jelena @ Wipf group
12 3/1/2005

HCS is an integration!
1) Fluorescent cell-based assays where cells are labeled with fluorescent probes that reflect physiological conditions of the cell,
2) Automated, high-resolution fluorescence microscopy of the fluorescent cells
3) Image processing algorithms - BioApplications, that automatically analyze the acquired images and report quantitative features reflecting the biological state of both individual cells and all the cells in the population, and
4) Advanced informatics software that archives and organizes the acquired images and quantitative analysis results, and enables the scientist to easily review these to assist his or her decision making.
ASSAY and Drug Development TechnologiesVolume 2, Number 5, 2004Jelena @ Wipf group
13 3/1/2005
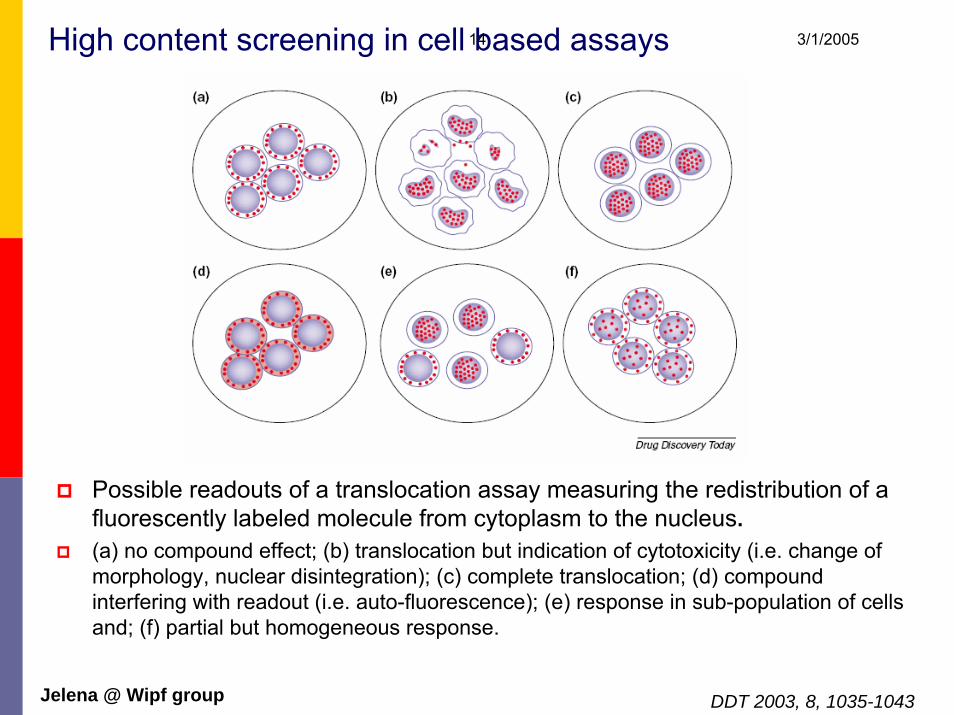
High content screening in cell based assays
Possible readouts of a translocation assay measuring the redistribution of a fluorescently labeled molecule from cytoplasm to the nucleus.(a) no compound effect; (b) translocation but indication of cytotoxicity (i.e. change of morphology, nuclear disintegration); (c) complete translocation; (d) compound interfering with readout (i.e. auto-fluorescence); (e) response in sub-population of cells and; (f) partial but homogeneous response.
Jelena @ Wipf group DDT 2003, 8, 1035-1043
14 3/1/2005

Cell-based HCS assay to quantify the epidermal growth factor (EGF) receptor-specific activation of the MAPK ERK.
The two parallel events being monitored:1. Phosphorylated ERK translocation to the nucleus2. The internalization and degradation of the EGF ligand–receptor complex
in late endosomes and lysosomes initiated by EGF binding to and activating its receptor. Simultaneously detected, quantified, and correlated in the same cell (Compartmental Analysis BioApplication)Phosphorylated ERK in the nucleus is detected using indirect immunofluorescence.
ASSAY and Drug Development TechnologiesVolume 2, Number 5, 2004Jelena @ Wipf group
15 3/1/2005

(A) Temporal sequence of fluorescent EGF internalization and ERK accumulation in the nucleus.
Procedure:
1. HeLa cells were incubated with Texas Red-conjugated EGF for the times indicated and then fixed.
2. The nuclei were labeled with Hoechst 33342,
3. The cells were then processed for immunofluorescence against ERK.
4. The sample was then imaged on the ArrayScanHCS Reader,
5. The images were analyzed with the Compartmental Analysis application.
Jelena @ Wipf group ASSAY and Drug Development TechnologiesVolume 2, Number 5, 2004
16 3/1/2005

Compartmental Analysis BioApplication
ERK signal in the nuclei Internalized EGF in endosomes and lysosomes
ASSAY and Drug Development TechnologiesVolume 2, Number 5, 2004 Jelena @ Wipf group
17 3/1/2005

Jelena @ Wipf group
Compartmental Analysis BioApplication
is a flexible, multi-channel, enables the simultaneous quantitation of the HCS Assay for presence of several different macromolecules in or between different regions or compartments in cells. It also can be used to simultaneously quantify the presence of several macromolecules in distinct cellular regions that are linked by the same signaling or trafficking pathway.
ASSAY and Drug Development TechnologiesVolume 2, Number 5, 2004
18 3/1/2005

ASSAY and Drug Development TechnologiesVolume 2, Number 5, 2004
From pretty pictures to quantitative data!
Result of analyzing images of the HeLa cells with the Compartmental Analysis BioApplication.
Jelena @ Wipf group
19 3/1/2005

Scatter plot showing the ERK and EGF responses for HeLa cells at different times.
ASSAY and Drug Development TechnologiesVolume 2, Number 5, 2004Jelena @ Wipf group
20 3/1/2005
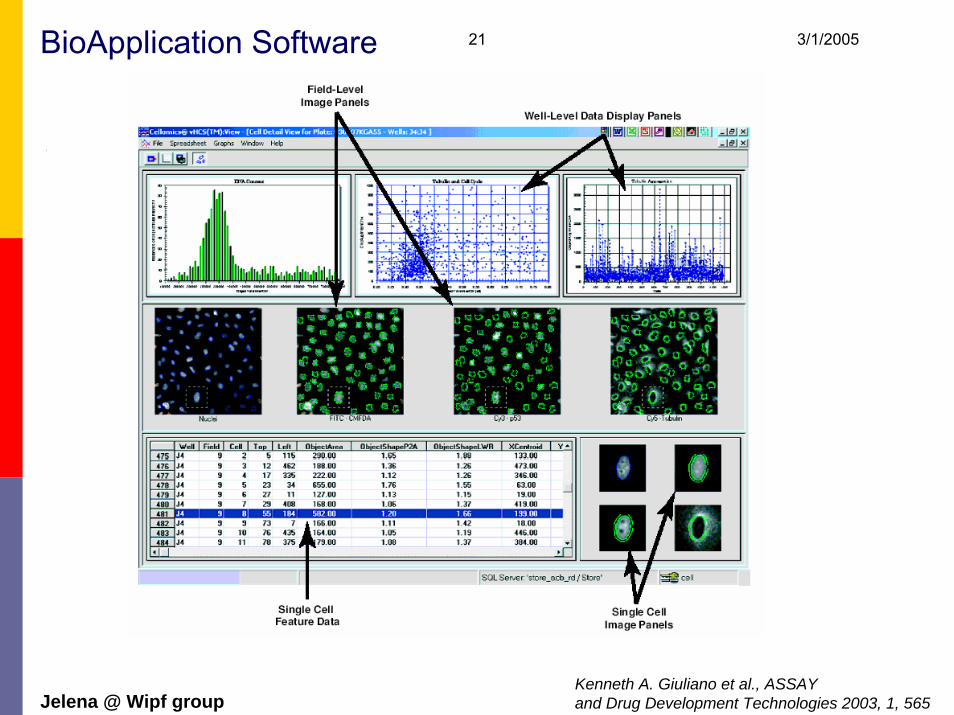
BioApplication Software
Kenneth A. Giuliano et al., ASSAY and Drug Development Technologies 2003, 1, 565Jelena @ Wipf group
21 3/1/2005

Each row of well-graphs defines the concentration titration of one drug and the effect it had on the activation of two kinases.Each point indicates the relative activation of p38 and ERK within a single cell.
Kenneth A. Giuliano et al., ASSAY and Drug Development Technologies 2003, 1, 565Jelena @ Wipf group
22 3/1/2005
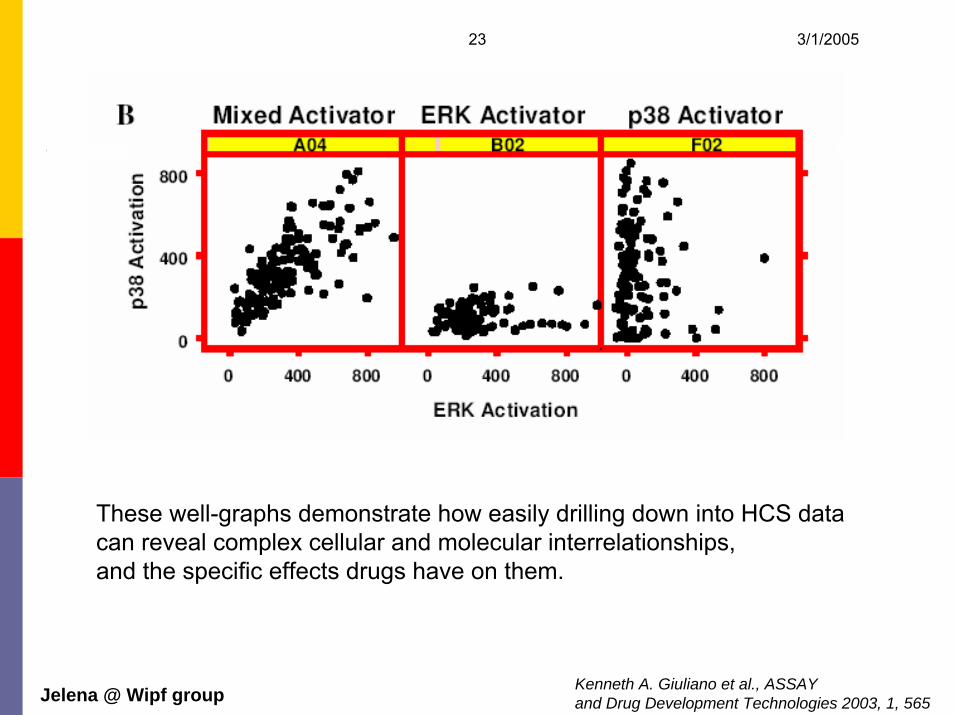
These well-graphs demonstrate how easily drilling down into HCS data can reveal complex cellular and molecular interrelationships,and the specific effects drugs have on them.
Kenneth A. Giuliano et al., ASSAY and Drug Development Technologies 2003, 1, 565Jelena @ Wipf group
23 3/1/2005

High Content Screening
Jelena @ Wipf group www.cellomics.com
24 3/1/2005