A Quantitative Assessment of Ra’ui (a Traditional Approach...
228
A Quantitative Assessment of Ra’ui (a Traditional Approach to Marine Protected Areas) on the Fishes and Invertebrates of Rarotonga, Cook Islands. Sonja Lee Miller A thesis submitted to Victoria University of Wellington in fulfilment of the requirements for the degree of Doctor of Philosophy in Marine Biology Victoria University of Wellington Te Whare Wānanga o te Ūpoko o te Ika a Māui 2008
Transcript of A Quantitative Assessment of Ra’ui (a Traditional Approach...
A Quantitative Assessment of Ra’ui (a Traditional Approach to
Marine Protected Areas) on the Fishes and Invertebrates of
Rarotonga, Cook Islands.
Sonja Lee Miller
A thesis submitted to Victoria University of Wellington in fulfilment of the
requirements for the degree of Doctor of Philosophy in
Marine Biology
Victoria University of Wellington
Te Whare Wānanga o te Ūpoko o te Ika a Māui
2008

2
ABSTRACT
Ra’ui (traditional marine managed areas) in Rarotonga, Cook Islands, are a form
of marine protected area re-implemented in the late 1990s when communities
became concerned about declining fish and invertebrate stocks in the lagoon. In
this thesis I quantified the effects of Ra’ui on fish and invertebrates.
First, for a single focal species of abundant reef fish (Ctenochaetus striatus), I
developed a novel framework to incorporate environmental heterogeneity into a
Control-Impact assessment of Ra’ui effectiveness using an index of habitat
selectivity (Manly’s alpha) to ‘adjust’ the density of a reef fish by ‘preferred’
substrates. My results empirically demonstrated that substrate heterogeneity
impinged upon the interpretation of MPA effects. This suggests that habitat
heterogeneity should be quantitatively incorporated into analyses of MPA effects
to provide a more robust and defensible set of inferences.
The novel framework was then used to assess the effects of Ra’ui on
densities of other common reef fish and invertebrates, as well as fish functional
groups. Averaged across all Ra’ui, a higher percentage of the invertebrate species
(20%) had greater abundances inside Ra’ui relative to corresponding Control sites
than fish species (15%). This may suggest spatial management is more effective
for sessile organisms such as the invertebrates in this study.
Even when environmental heterogeneity was ‘controlled’ in my analyses,
responses to Ra’ui were variable between species and sites, illustrating that factors
other than environmental heterogeneity may be driving varying patterns of
species abundances. However, for the broad-scale functional groups, there were
indications of inverse relationships between predator and prey functional groups
at 3 of the Ra’ui. I applied meta-analytical techniques to my data to assess
whether there was an island-wide effect of Ra’ui on the densities of fish and

Abstract
3
invertebrate species, and functional groups. There was no evidence in the meta-
analyses for an island-wide Ra’ui effect for any species or functional groups.
However, analysis of covariance suggested there was an island-wide Ra’ui effect
for a number of fish and invertebrate species. The body size of fish and
invertebrates is another metric of MPA effectiveness that is expected to increase
with protection. However, in determining an island-wide effect of Ra’ui on size,
only two fish species, Mulloidichthys flavolineatus and Stegastes nigricans, had
greater mean size in Ra’ui relative to Control sites, and Siganus argenteus was the
only reef fish to exhibit greater maximum size in the Ra’ui. Two of the lagoon
invertebrates (Echinometra mathaei and Tripneustes gratilla) and three of the reef-
crest invertebrates (Echinothrix diadema, Echinometra oblonga, and Trochus niloticus)
exhibited an island-wide positive response to Ra’ui for mean size. At individual
Ra’ui sites, a number of invertebrates had greater mean and maximum size.
Further, at individual sites, M. flavolineatus had greater mean size across the most
Ra’ui (4 sites), again indicating that the site fidelity of a species may influence its
response to protection.
Ontogenetic shifts in habitat use are known to occur in fish and
invertebrates. For five fish species, juveniles used habitat differently to adults of
the same species. Further, of the five species, only densities of both juvenile and
adult Acanthurus triostegus exhibited a positive relationship with the proportion of
their preferred habitat (juveniles: r2 = 0.44, p = 0.011; adults: r2 = 0.46, p = 0.009).
Densities of adult Ctenochaetus striatus also increased linearly with the proportion
of preferred substrate cover (r2 = 0.43, p = 0.035). These results suggest that habitat
within an MPA may be limiting for different benthic stages of an organism’s
ontogeny.
Some knowledge of the characteristics that underpin MPA effectiveness can
aid in their design. Using commonly occurring fish and invertebrate species, I
explored the effectiveness of individual Ra’ui using three separate metrics of
effectiveness (the proportion of fish and invertebrates exhibiting 1) greater

Abstract
4
densities, 2) greater mean size, and 3) greater maximum size in Ra’ui relative to
Control sites. Ra’ui area and total fish density in each Ra’ui were characteristics
that best described the effectiveness of Ra’ui in enhancing mean fish and
invertebrate size. The level of compliance with Ra’ui may also have some impact
on Ra’ui effectiveness.
This study highlights the importance of incorporating environmental
heterogeneity into assessments of MPA effects. Further, temporary prohibitions
such as Ra’ui may be more effective for some species if certain conditions are met
e.g., compliance is good, and the species Ra’ui are protecting / enhancing have
high site-fidelity and high growth rates. These findings provide important
information for fisheries and conservation managers (e.g., traditional leaders,
governmental agencies, non-governmental agencies, communities) that will aid in
better design of monitoring programmes and facilitate improved MPA design, not
only in the Pacific region, but worldwide.
5
ACKNOWLEDGMENTS
Firstly, I’d like to acknowledge two of my great uncles who are no longer here, the late Tom McCulloch and the late George Miller. Uncle Tom, for supporting and encouraging me to go back to University, ngā mihi tino nui ki a koe. Uncle George, I’m extremely grateful to you for having continually supported me in my educational endeavours.
I respectfully thank the Koutu Nui in the Cook Islands, particularly Te Tika Mataiapo, Dorice Reid, for allowing, and supporting me in carrying out this research on the Ra’ui of Rarotonga. I’m also thankful to the staff at the Ministry of Marine Resources, particularly Ian Bertram, Kori Raumea, and Jo Anderson for helping me get the research going and for ongoing support during my time in Rarotonga. This thesis would not have been possible without the support of the Koutu Nui and the Cook Islands Ministry of Marine Resources. All work for this thesis was conducted under a Research Permit issued by the Cook Islands Office of the Prime Minister (Permit Reference Number 10/04).
I thank my supervisors, Jeff Shima and Nicole Phillips, for supporting me throughout this research, always being available, providing prompt advice and constructive feedback. I’d also like to thank Jeff and Nicole for the barbeques and pizza nights – they have always been a highlight of my time here in Wellington. You are great supervisors!
Thanks to Dr Shirley Pledger for her statistical expertise – I don’t know what I would have done without your help! I’d also like to thank Dr Colleen Kelly for statistical advice.
Ngā mihi nui ki Te Rōpu Āwhina Putaiao, especially Liz Richardson and Dawn Reeves, and all of the Āwhina whanau. The aroha and āwhi provided by Āwhina have been invaluable to me over the past years. I’d also like to thank MAI ki Poneke at Victoria University of Wellington for reducing the isolation of PhD study.
To everyone who supported me in this research in the Cook Islands from back in 2001 when it was just an idea until now; Gerald McCormack, Judith Künzle, Pasha Carruthers, Anna Tiraa-Passfield, Ngatuaine Maui, Navy Epati, Vaitoti Tupa, Diane Charlie, Russell Thomas, Gwen Welland, Jacqui Evans, and staff at the Cook Islands Environment Service - meitaki ma’ata! To those who helped out by letting me use their kayaks or access the beach through their properties, especially, Anna and Charlie Tetevano, Jeannine Peyroux, staff at the Little Polynesian Hotel, and Noeline Burden- meitaki ma’ata!
Mona Matepi and Pat Fitzgibbon at WWF Cook Islands, thanks heaps for the cups of tea and chats! It meant a lot to me. Also to all the crew at Rarotonga Hash House Harriers – thanks for the friendly faces during my time on Rarotonga.

Acknowledgments
6
I’m especially grateful to Samuel Brown in Rarotonga – for support and friendship, particularly for helping me out in the field (you coped well with the bossy ‘expedition leader’). Meitaki ma’ata e hoa!
I gratefully acknowledge the financial support provided by the following: the Foundation for Research, Science and Technology (Tūāpapa Pūtaiao Māori fellowship – Contract VUWX0302), New Zealand Agency for International Development (NZAID) (NZAID Postgraduate Field Research Award), Victoria University of Wellington (PhD Completion Scholarship, and 2 Faculty Research Grants from the Faculty of Science).
I’d also like to acknowledge my late Uncle Tom for helping to maintain and nurture the connection between the southern arm of the family and Wellington and New Plymouth whanau. Thanks to Aunty Marion McCulloch, and Linda McCulloch for providing me with what felt like a second home in New Plymouth. Kia ora also to Chargn Keenan and Wikitoria Keenan for their support of my research and return to tertiary study.
In SBS and the Science Faculty I’d like to thank the following staff – especially the Laydeez (Mary Murray, Patricia Stein, Delwyn Carter-Jarrratt, and Sandra Taylor), Michelle Sainsbury, Jo Long, Angela Flemming, Paul Marsden, Cameron Jack, Rachel Zhang, Belinda Tuari, Kasey Beveridge, and James Allen.
I’d like to thank my friends for their support prior to, and during my time at university, especially Sherrill Passau, Juliet and Greg Larkin, Barbara Bennett, Gina Huakau, Luke Mosley, Tim Ritchie, Richard Dukes (Dicky) and Belinda Smith, Mark Shafer, Sandra Bourguignon, Amber Bill, and Chris Fleck. I’d especially like to thank Helen Kettles for sharing her home with me for the past couple of years and coping super-well with my thesis-induced mania (especially near the end) - thanks heaps for your friendship and giving me a place to call home! To Kim Holland, Glen Mills and Sam Mills for giving me Gizzy mini-breaks (spas and barbeques, surfing, surf-casting at Nuhiti, and Muir’s bookshop). I’d also like to thank my ‘paper’ supplier, Ann McCrone for her frequent e-mails. Chris Gibbons – thanks for the “breaks” and ‘mean as’ fussball games. Arohanui ki Lesley McLeod rāua ko Adele Whyte. Thanks so much to you both for your support, understanding, and friendship.
Gill Stotter, Ruth Highet, Liz Kemp, and Tessa Meek have also helped me produce this thesis (even if they didn’t know it). I’d also like to thank a number of anonymous reviewers for their comments that have helped to improve the second chapter of this thesis. Thanks also to Darrin Drumm, Armagan Sabetian and Richard Hamilton for discussions and assistance prior to my returning to study.
Thanks to everyone in the Shima-Phillips lab group at Vic including Vanessa Hernaman, Chris McDermott, and David Aguirre. I’m especially appreciative of the time and effort Shane Geange, Anna Smith, Bionda Morelissen, and John van der Sman took to read over draft chapters and provide feedback. Shane Geange and Snout (aka Daniel McNaughton) were always only too happy to discuss stats with me – I owe you both a beer or two.

Acknowledgments
7
The people I’ve shared office space over the past years have made returning to university a pleasure. Marc Hasenbank – thanks for all the R help and also your friendship; Rudi Schnitzler – you’ve been there for me when things weren’t going so well – thanks for your friendship!; Cliff Young – for thoughtful conversation - who would have thought you’d be post-docking it in Odense of all places!; David Hall - you saved me days of work with your “R” expertise); Bruce Dudley – so many cups of tea!; Nicolai Trümper – what would I have done without the chocolate, thought-provoking discussions, and software help?; Phil James – you sure make super-strong coffees!; Peter Martin – for the fussball thrashings; Shane Geange – you’ve always been keen to help out, and good company; and Bruce Norris – it’s been a joy sharing an office with you, especially for the coffee, decent whisky (I didn’t know what a decent whisky was until you taught me), more coffee, IT support (yup, I had to put that in), expanding my music repertoire, feeding me with delicious cakes and pasta bakes, and decent gut-wrenching laughs that have made the last 6 months of this process almost enjoyable!
Which reminds me, I must thank the following for early inspiration in my youth: the cast of Stingray (in ‘Supermarionation’!), ‘the Man from Atlantis’ (aka Patrick Duffy, more famously known as Bobby Ewing in ‘Dallas’), and Jacques Cousteau. In terms of music that has gotten me through, I’m indebted to Marvin Gaye, Shihad, SJD, Wilco, Jeff Buckley, and yes, a hangover from the music of my youth, A-Ha.
The “Supreme Champions of the World” (aka SCOTW) - the core crew deserve a special mention - Kristen (our beloved team leader), Dean, Kerry, Amy, and Bruce. Kristen, what would I have done every Thursday night if you hadn’t invited me to join SCOTW at the Southern Cross music quiz, and Havana bar with the two for one mint and passionfruit daiquiris (it’s healthy coz it’s got greens and fruit in it!)
John – thank you so much for introducing me to the calming effects of sailing on Wellington Harbour, collecting kaimoana on the Wainuiomata coast, “gourmet” tramping, and highly competitive crib games (by the way, who’s the champ?). Long may it go on! Your patience, love, and understanding have seen me through.
Finally, I’d like to thank my family; my sisters, Rachel and Jenny, for always having time for a chat and laugh on the phone, Paul Sirota for telling me to “start writing now!”, wee Jozef Sirota for arriving into our lives, my bro Dave for being my dependable younger big brother, and my Mum and Dad for always being there for me. Without my family’s love and support, this process would have been a lot harder.

8
Aroa Ra’ui, Rarotonga, Cook Islands
This thesis is dedicated to my parents, John and Vicky, my sisters, Jenny and Rachel, and
my brother, David.
9
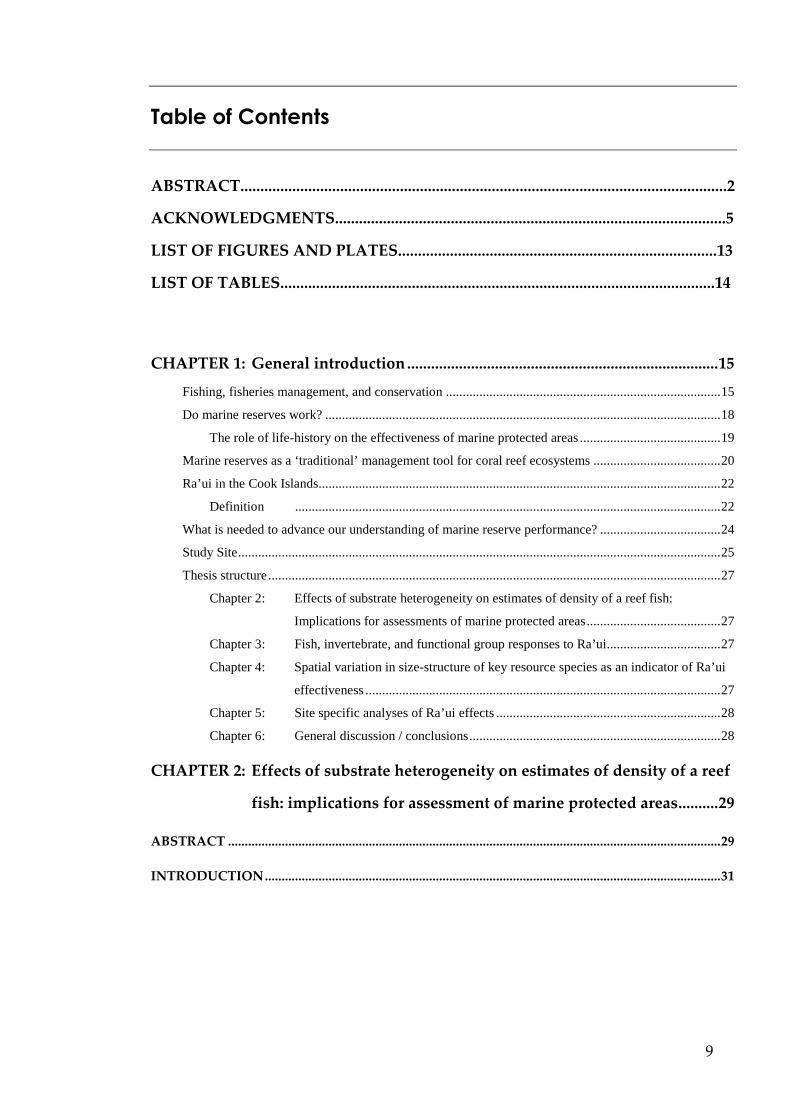
Table of Contents
ABSTRACT..........................................................................................................................2
ACKNOWLEDGMENTS..................................................................................................5
LIST OF FIGURES AND PLATES................................................................................13
LIST OF TABLES.............................................................................................................14
CHAPTER 1: General introduction ..............................................................................15
Fishing, fisheries management, and conservation ..................................................................................15
Do marine reserves work? ......................................................................................................................18
The role of life-history on the effectiveness of marine protected areas..........................................19
Marine reserves as a ‘traditional’ management tool for coral reef ecosystems ......................................20
Ra’ui in the Cook Islands........................................................................................................................22
Definition ...............................................................................................................................22
What is needed to advance our understanding of marine reserve performance? ....................................24
Study Site................................................................................................................................................25
Thesis structure.......................................................................................................................................27
Chapter 2: Effects of substrate heterogeneity on estimates of density of a reef fish:
Implications for assessments of marine protected areas........................................27
Chapter 3: Fish, invertebrate, and functional group responses to Ra’ui..................................27
Chapter 4: Spatial variation in size-structure of key resource species as an indicator of Ra’ui
effectiveness ..........................................................................................................27
Chapter 5: Site specific analyses of Ra’ui effects ...................................................................28
Chapter 6: General discussion / conclusions...........................................................................28
CHAPTER 2: Effects of substrate heterogeneity on estimates of density of a reef
fish: implications for assessment of marine protected areas..........29
ABSTRACT ...................................................................................................................................................29
INTRODUCTION........................................................................................................................................31

Table of Contents
10
MATERIALS AND METHODS ................................................................................................................34
Study system and species........................................................................................................................34
Sampling regime.....................................................................................................................................36
Estimating effects of Ra’ui .....................................................................................................................37
Overview ...............................................................................................................................37
Adjusting fish densities based upon substrate preference...............................................................39
Evaluating Ra’ui effects using response ratios ...............................................................................39
Direct test of overall Ra’ui effect ...................................................................................................40
Contrasting simple and preference corrected density estimates with ANCOVA ...........................40
RESULTS .......................................................................................................................................................41
Substrate use by Ctenochaetus striatus...................................................................................................41
Estimates of local Ra’ui effects ..............................................................................................................43
Fish densities ...............................................................................................................................43
Direct test of an overall Ra’ui effect.......................................................................................................45
Response to protection – simple data versus substrate adjusted data......................................................45
Variation in fish densities .......................................................................................................................46
DISCUSSION ...............................................................................................................................................49
CONCLUSIONS...........................................................................................................................................54
CHAPTER 3: Fish, invertebrate, and functional group responses to Ra’ui using a
novel assessment framework for marine protected areas ...............55
ABSTRACT ...................................................................................................................................................55
INTRODUCTION........................................................................................................................................57
MATERIALS AND METHODS ................................................................................................................61
Study System and Sampling Regime......................................................................................................61
Data analysis...........................................................................................................................................62
Estimating robust effect sizes for Control-Impact derived data......................................................62
Quantification of Ra’ui Effects Using Log Response Ratios..........................................62
Island-wide assessment of Ra’ui effects .........................................................................................63
a) Applying a Meta-analysis to Response Ratios...........................................................63
b) Partitioning variation with ANCOVA...................................................................64
How data were constrained for analysis .........................................................................................64

Table of Contents
11
RESULTS .......................................................................................................................................................65
Responses of individual fish species to Ra’ui.................................................................................65
Responses of individual invertebrate species to Ra’ui....................................................................69
Effects of Ra’ui on lagoon species by site ......................................................................................72
Fine-scale and broad-scale fish functional group responses...........................................................73
Meta-analyses of fish, invertebrates, and functional group responses to Ra’ui ..............................76
Direct test of an overall Ra’ui effect...............................................................................................77
DISCUSSION ...............................................................................................................................................89
A priori hypotheses.................................................................................................................................89
Variation in responses to Ra’ui...............................................................................................................95
CONCLUSIONS...........................................................................................................................................97
CHAPTER 4: Spatial variation in size-structure of key resource species as an
indicator of Ra’ui effectiveness............................................................99
ABSTRACT ...................................................................................................................................................99
INTRODUCTION......................................................................................................................................101
METHODS ..................................................................................................................................................104
Sampling regime...................................................................................................................................104
Data Analysis........................................................................................................................................105
Overall effects of Ra’ui ................................................................................................................105
Relationship between habitat and size structure across sites ........................................................105
Relationship between habitat and size: juvenile and adult fish.....................................................106
RESULTS .....................................................................................................................................................107
Overall effects of Ra’ui.........................................................................................................................107
Fish .............................................................................................................................107
Invertebrates .............................................................................................................................111
Lagoon ..........................................................................................................................111
Outer Strata...................................................................................................................115
Relationship between habitat and size structure across sites ................................................................120
Ontogenetic shifts in habitat use...................................................................................................120
DISCUSSION .............................................................................................................................................126
Overall effects of Ra’ui: fish and invertebrates ....................................................................................126
Relationship between habitat and size structure across sites ................................................................130
Level of fishing.....................................................................................................................................132
Other factors influencing size ...............................................................................................................132
CONCLUSIONS.........................................................................................................................................133

Table of Contents
12
CHAPTER 5: Are some Ra’ui more effective than others? Site specific analyses
of Ra’ui effects .......................................................................................134
ABSTRACT .................................................................................................................................................134
INTRODUCTION......................................................................................................................................136
METHODS ..................................................................................................................................................139
Study System and Sampling Regime....................................................................................................139
Data analysis.........................................................................................................................................139
1). Site specific Ra’ui effects on mean and maximum size of fish and invertebrates.................139
Response Ratios for fish and invertebrate mean size....................................................140
2). Which Ra’ui are most effective?...........................................................................................140
Effects on abundance ....................................................................................................141
Effects on size...............................................................................................................141
3). Possible sources of variation in Ra’ui effectiveness .............................................................141
RESULTS .....................................................................................................................................................143
Site effects on mean and maximum size of fish and invertebrates .......................................................143
Ra’ui effectiveness................................................................................................................................146
Sources of variation in Ra’ui effectiveness...........................................................................................146
DISCUSSION .............................................................................................................................................148
Ra’ui ‘effectiveness’ .............................................................................................................................148
Variation in Ra’ui ‘effectiveness’.........................................................................................................150
CONCLUSIONS.........................................................................................................................................153
CHAPTER 6: General discussion and conclusions .................................................154
Overview ..............................................................................................................................................154
Novel framework to remove confounding by environmental heterogeneity.........................................155
Site fidelity, Ra’ui size, and ontogenetic shifts – considerations for the design of MPAs....................156
Effectiveness of temporary closures such as Ra’ui...............................................................................157
Community-based marine resource management and Ra’ui effectiveness...........................................157
Conclusions ..........................................................................................................................................158
APPENDIX A ..................................................................................................................160
APPENDIX B ...................................................................................................................166
APPENDIX C...................................................................................................................177
REFERENCES .................................................................................................................200
13
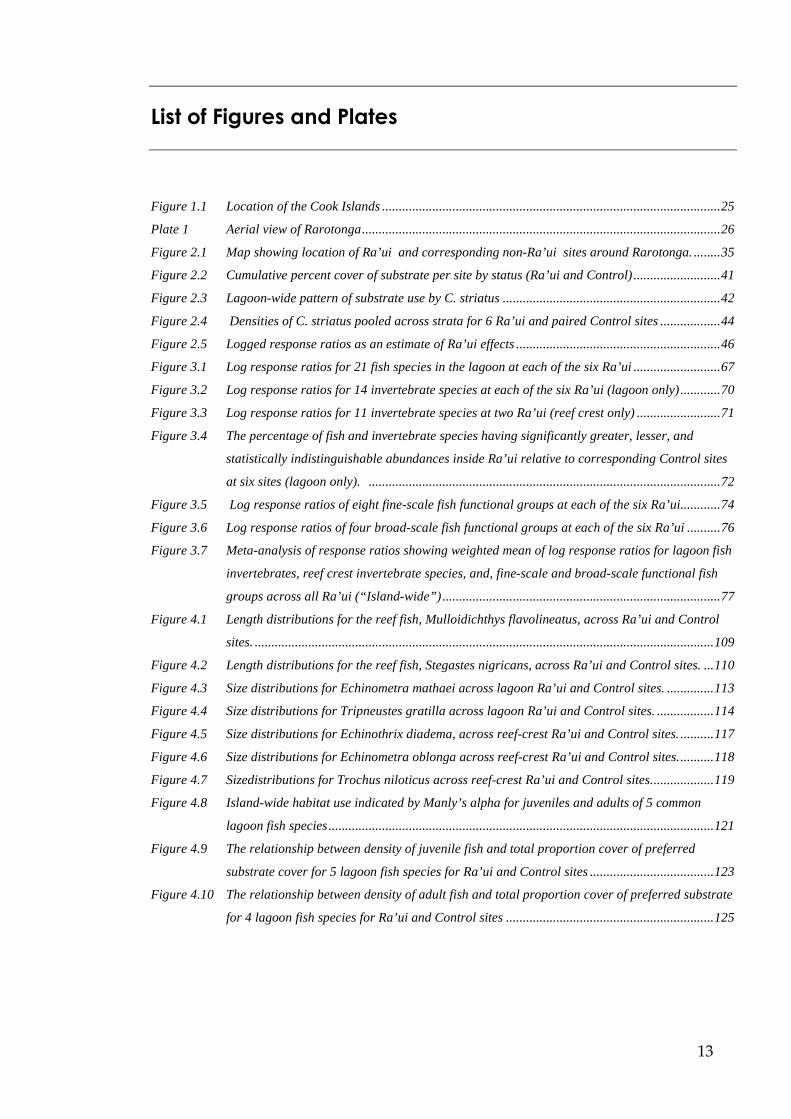
List of Figures and Plates
Figure 1.1 Location of the Cook Islands .....................................................................................................25
Plate 1 Aerial view of Rarotonga...........................................................................................................26
Figure 2.1 Map showing location of Ra’ui and corresponding non-Ra’ui sites around Rarotonga. ........35
Figure 2.2 Cumulative percent cover of substrate per site by status (Ra’ui and Control)..........................41
Figure 2.3 Lagoon-wide pattern of substrate use by C. striatus .................................................................42
Figure 2.4 Densities of C. striatus pooled across strata for 6 Ra’ui and paired Control sites ..................44
Figure 2.5 Logged response ratios as an estimate of Ra’ui effects .............................................................46
Figure 3.1 Log response ratios for 21 fish species in the lagoon at each of the six Ra’ui ..........................67
Figure 3.2 Log response ratios for 14 invertebrate species at each of the six Ra’ui (lagoon only)............70
Figure 3.3 Log response ratios for 11 invertebrate species at two Ra’ui (reef crest only) .........................71
Figure 3.4 The percentage of fish and invertebrate species having significantly greater, lesser, and
statistically indistinguishable abundances inside Ra’ui relative to corresponding Control sites
at six sites (lagoon only). .........................................................................................................72
Figure 3.5 Log response ratios of eight fine-scale fish functional groups at each of the six Ra’ui............74
Figure 3.6 Log response ratios of four broad-scale fish functional groups at each of the six Ra’ui ..........76
Figure 3.7 Meta-analysis of response ratios showing weighted mean of log response ratios for lagoon fish
invertebrates, reef crest invertebrate species, and, fine-scale and broad-scale functional fish
groups across all Ra’ui (“Island-wide”)...................................................................................77
Figure 4.1 Length distributions for the reef fish, Mulloidichthys flavolineatus, across Ra’ui and Control
sites. .........................................................................................................................................109
Figure 4.2 Length distributions for the reef fish, Stegastes nigricans, across Ra’ui and Control sites. ...110
Figure 4.3 Size distributions for Echinometra mathaei across lagoon Ra’ui and Control sites. ..............113
Figure 4.4 Size distributions for Tripneustes gratilla across lagoon Ra’ui and Control sites. .................114
Figure 4.5 Size distributions for Echinothrix diadema, across reef-crest Ra’ui and Control sites. ..........117
Figure 4.6 Size distributions for Echinometra oblonga across reef-crest Ra’ui and Control sites...........118
Figure 4.7 Sizedistributions for Trochus niloticus across reef-crest Ra’ui and Control sites...................119
Figure 4.8 Island-wide habitat use indicated by Manly’s alpha for juveniles and adults of 5 common
lagoon fish species...................................................................................................................121
Figure 4.9 The relationship between density of juvenile fish and total proportion cover of preferred
substrate cover for 5 lagoon fish species for Ra’ui and Control sites .....................................123
Figure 4.10 The relationship between density of adult fish and total proportion cover of preferred substrate
for 4 lagoon fish species for Ra’ui and Control sites ..............................................................125

14
List of Tables
Table 1.1 Characteristics of the 6 Ra’ui around Rarotonga ....................................................................23
Table 2.1 Two factor analysis of covariance evaluating densities of C. striatus across all Ra’ui and
Control sites...............................................................................................................................45
Table 2.2 Analysis of covariance evaluating densities of C. striatus between separate Ra’ui and
corresponding Control sites.......................................................................................................48
Table 3.1 The effect size, ratio of within-site variation (Qwi) to between-site variation (Qb), and
homogeneity statistic (Q) calculated across all Ra’ui for each lagoon fish and invertebrate
species........................................................................................................................................68
Table 3.2 Ratio of within-site variation (Qwi) to between-site variation (Qb), and the homogeneity
statistic (Q) calculated across all Ra’ui for each broad- and fine-scale fish functional group.75
Table 3.3 Two-factor analysis of covariance (and post-hoc power analysis) evaluating densities of
lagoon fish species across all Ra’ui and Control sites ..............................................................79
Table 3.4 Two-factor analysis of covariance (and post-hoc power analysis) evaluating densities of
lagoon invertebrate species across all Ra’ui and Control sites.................................................82
Table 3.5 Two-factor analysis of covariance (and post-hoc power analysis) evaluating densities of reef-
crest invertebrate species across all Ra’ui and Control sites....................................................85
Table 3.6 Two-factor analysis of covariance (and post-hoc power analysis)) evaluating densities of fine-
scale functional groups across all Ra’ui and Control sites .......................................................87
Table 3.7 Two-factor analysis of covariance (and post-hoc power analysis) evaluating densities of
broad-scale functional groups across all Ra’ui and Control sites ............................................88
Table 4.1 Maximum and mean size of all fish at Ra’ui and Control sites................................................108
Table 4.2 Maximum and mean size of all lagoon invertebrates at Ra’ui and Control sites ....................112
Table 4.3 Maximum and mean size of all reef crest invertebrates at Ra’ui and Control sites ................116
Table 4.4 Estimated size at maturity of five lagoon reef fish species.......................................................121
Table 5.1 Maximum and mean size of commonly occurring fish and invertebrates at each Ra’ui and
Control site .............................................................................................................................144
Table 5.2 The proportion of lagoon fish and invertebrates per Ra’ui site where mean densities, mean
size, and maximum size were greater in the Ra’ui...................................................................146
Table 5.3 Ra’ui characteristics included in multiple regressions as predictor variables........................147
Table 5.4 Stepwise backward multiple regression of Ra’ui effectiveness for mean fish and invertebrate
size ...........................................................................................................................................148

15
CHAPTER 1: General introduction
Fishing, fisheries management, and conservation
There is increasing evidence that a combination of anthropogenic activities
including fishing, pollution, and coastal development, are altering ocean
ecosystems (PISCO 2007). Marine fisheries are in decline worldwide with over
half of individual fish stocks fully exploited, a further 20% over-exploited, and
over-fishing threatening the world’s food security (Botsford et al. 1997, Garcia and
Newton 1997, Watson and Pauly 2001).
Fishing is a consumptive (top down) process that can lead to major shifts in
the trophic organization of fish and reef communities (Shears and Babcock 2002).
Major changes can occur from fishing, including reduced species diversity and
reduced abundances or loss of predatory species (Roberts 1995a). Fishing can lead
to the loss of keystone species that sometimes results in major effects on reef
processes, and the possible loss of whole functional groups, as well as affecting
size-composition and life-history characteristics (Roberts 1995a). On a world-wide
scale, fishing has led to major changes in the structure of marine food webs,
evidenced by a shift in catches over the past 45 years from large piscivorous fishes
to small invertebrates and planktivorous fishes (Pauly et al. 1998).
The impacts of fishing are not only restricted to global fisheries but also
small island nations such as the Cook Islands in the South Pacific. Over-fishing, in
concert with other human impacts such as pollution, is leading to reductions in
fish stocks and suitable habitat (Sale et al. 2005).
Western management approaches to fisheries are generally based on
conventional fisheries science theory, which was developed for the temperate,
often single-species fisheries of the northern hemisphere (Botsford et al. 1997, Sale
2002). However, coral reef fisheries are generally multi-species fisheries, with

Chapter 1 Introduction
16
marine communities that respond differently to fishing than temperate fisheries
on which the bulk of fisheries science is based (Sale 2002). For example, major
changes in community structure can occur as evidenced by regions in the
Caribbean where intense fishing led to a single species of urchin subsequently
dominating the herbivorous community (Lessios 1988, Jennings and Polunin
1996b). When the urchin suffered a mass mortality, there were no herbivores left
in the system to keep algal abundances in check, resulting in no coral recruitment
and death of existing corals (Hughes 1994, Jennings and Polunin 1996b, Pinnegar
et al. 2000). Hence, existing fisheries management strategies where the focus is
primarily on target fish populations and the use of concepts such as Maximum
Sustainable Yield (MSY) and Maximum Economic Yield (MEY) use approaches
that may not be well-suited to many reef fisheries in developing countries, and
using such tools is likely not appropriate when applied to tropical reef ecosystems
(Jennings and Polunin 1996b). Moreover, conventional fisheries management
approaches rely upon the availability of long-term data sets and complex analyses
(Sale 2002). Many developing nations lack the human resources and financial
capacity to effectively implement this approach (Adams 1998). Consequently,
many tropical reef fisheries are managed inadequately or not managed at all (Sale
2002).
There are alternatives to management based on conventional fisheries
science for coral reef fisheries. One alternative is the use of marine protected
areas, particularly when there are few data on which to base management
decisions (Sale 2002, Botsford 2005). In addition, many countries reliant on coral
reefs possess a wealth of knowledge with regard to managing the resource
(Johannes 2002). Traditional forms of management based on indigenous
knowledge, previously dismissed but now receiving more mainstream attention,
are experiencing a renaissance (Johannes 1994, Young 2004). In particular,
Polynesian cultures retain a great deal of indigenous knowledge that may provide
Chapter 1 Introduction
17
innovative approaches to fisheries management (Adams 1998, Calamia 1999,
Johannes 2002).
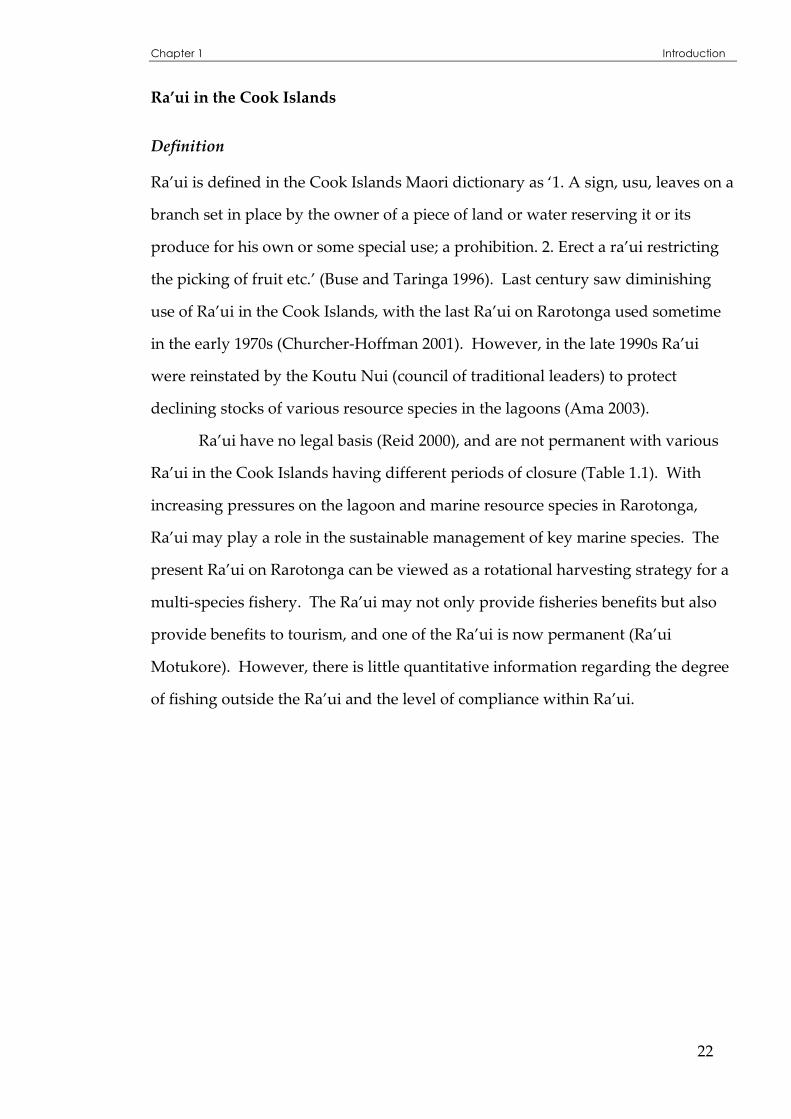
‘Marine protected area’ is a term that can refer to a number of protective
mechanisms including strictly protected reserves, coastal management units
including terrestrial and marine areas, or any kind of marine managed area
(Agardy et al. 2003). It has generally been shown that marine protected areas
result in increased size, abundance and diversity of marine organisms (Bohnsack
1998, Halpern and Warner 2002).
No-take marine protected areas differ from other forms of marine
protection in that the harvest of marine life is prohibited (Roberts and Polunin
1991, Palumbi 2001). As well as conserving habitats and fish populations, there
appears to be increasing evidence that no-take marine protected areas may sustain
or increase catches in surrounding fisheries through what is referred to as
‘spillover’, via the export of larvae, and the export of adult biomass to areas
outside the reserve (Balmford et al. 2004, Halpern et al. 2004). However, detection
of ‘spillover’ requires very powerful sampling designs (Zeller et al. 2003).
Conservation and fisheries benefits are two common goals often stated for
the design of marine reserve networks (Hastings and Botsford 2003, Neubert
2003). The design of marine reserve networks has much in common with
terrestrial reserve design, incorporating aspects of the SLOSS (Single Large or
Several Small) debate instigated by Diamond (1975). The results of models
suggest that marine reserves may have benefits for fisheries when they are
designed appropriately (Botsford et al. 2003, Hastings and Botsford 2003).
It is generally agreed that marine protected area design requirements vary
depending on the desired outcome, whether that is primarily conservation or
fisheries enhancement. It has been argued that reserves for conservation should
be as large as possible, while reserves for fisheries enhancement should strive to
maximise larval export out of reserve areas; fisheries reserves should be as small
as possible but occupy a larger area of the coastline (Hastings and Botsford 2003).

Chapter 1 Introduction
18
In short, reserves for fisheries enhancement generally need to be smaller than
those for conservation purposes, yet still large enough to maintain breeding
populations while simultaneously maximising their edge to area ratio so that spill-
over can occur across as large an area as possible (Hastings and Botsford 2003).
Connectivity, the linkage between local populations and processes, is an
important consideration in the design of reserve networks, as the larvae (and often
eggs) of most marine species have a dispersive pelagic stage (Roberts 1997).
Hence, distant processes may have strong implications for local populations e.g.,
larvae spawned elsewhere may contribute to the persistence of populations in
reserves (Roberts 1997, Lockwood et al. 2002, Sala et al. 2002). The implication is
that marine reserves will not necessarily enhance species within their bounds if a
critical bottleneck for a stage of the specie’s life-history occurs outside the reserve.
Another design consideration for marine reserves relates to the
displacement of fishers. Larval export from a marine reserve is required to offset
increases in fishing pressure in adjacent areas (Halpern et al. 2004). That is,
recruitment within the reserve needs to be over and above that necessary to
compensate for the loss of the area to fishing, hence the size of the marine reserve
is important (Halpern et al. 2004). However, caution should be applied to the use
of marine reserves as unknown dispersal distances of larvae can mean that a
reserve may end up disproportionately benefiting short-distance dispersing
species, thus biasing a resultant community away from a ‘natural’ community
(Botsford et al. 2001). If the implementation of a reserve results in a shift away
from the natural community then it may not necessarily enhance surrounding
fisheries for a particular suite of species.
Do marine reserves work?
There is a plethora of literature advocating the benefits of marine reserves for
biodiversity and fisheries management yet it has been argued that there have been
few adequately designed studies that clearly show fish density increases in marine

Chapter 1 Introduction
19
reserves, and there are still conflicts about whether fisheries benefit from marine
reserves (Sale 2002, Willis et al. 2003). Few studies have incorporated sampling
designs to clearly determine effects. Hence, the evidence to support the use of
marine reserves for fisheries management is still somewhat equivocal (Willis et al.
2003, Hilborn et al. 2004). However, marine reserves may be highly effective at
increasing the size and density of fish within their bounds (Polunin and Roberts
1993, Jennings and Polunin 1997), but it is difficult to determine whether fisheries
adjacent to marine reserves benefit (Palumbi 2001). Nevertheless, as mentioned
previously, marine protected areas, especially for multi-species coral reef fisheries,
are regarded as a viable alternative to conventional fisheries management (Sale
2002).
The role of life-history on the effectiveness of marine protected areas
The life-history of a species plays an important role in determining the
effectiveness of spatial management tools such as marine protected areas. The
stage at which any movement of a species occurs during its ontogeny has a large
effect on the effectiveness of spatial management tools (Roughgarden et al. 1988).
For species where little movement occurs, e.g., urchins, reproductive capacity is
increased by spatial management (fishing mortality is reduced to nil assuming
fisher compliance) as there will be little or no movement outside the protected
area (Gerber et al. 2003). However, for highly mobile fish, marine protected areas
may do little in comparison to conventional fisheries management tools (Hilborn
et al. 2004) as the benefits afforded by marine protected areas decrease with
increasing rates of adult movement (Gerber et al. 2003) with any movement
outside protected area boundaries increasing vulnerability to fishing mortality.
Therefore, spatial management tools may not be appropriate for species with high
rates of juvenile and adult movement (Gerber et al. 2003)and consequently, spatial
management (e.g., marine protected areas) is generally agreed to have the most
effect on sedentary or sessile fish and invertebrates (Botsford 2005, Parnell et al.
2005). As many fish and invertebrate species on coral reefs conform to this life-

Chapter 1 Introduction
20
history (i.e., sessile / site-attached adults), spatial management via protected areas
may be a good approach (Hastings and Botsford 1999).
However, fisheries benefits may not necessarily result from marine
protected areas as evidenced by the work of Ashworth et al. (2004) in Egypt, who
concluded that for sedentary molluscan invertebrates such as Tridacna species,
there was little evidence for potential spillover. Thus, any benefit to fisheries
would depend on greater larval production as a result of no-take zones (Ashworth
et al. 2004). Nevertheless, invertebrate fisheries in coral reef environments are
usually located in shallow reef habitats that are easily accessible and therefore
vulnerable to exploitation from over-fishing (Drumm 2004). Hence marine
protected areas may prevent over-exploitation but there may be few, if any,
fisheries benefits.
Another aspect of life-history particularly relevant to temporary marine
protected areas is growth rate and age at maturity. For a temporary protected area
to increase the reproductive output of a species, the closure should at least provide
the species enough time to reach maturity and reproduce. For fast growing, short-
lived species, species recovery may only take a few years in a protected area (Gell
& Roberts 2002), which may be an adequate period of temporary closure if the aim
of the closure is to increase stocks for harvest. However, for longer-lived, slower
growing species, it would take longer for a species to reach its age at maturity
(Gell & Roberts 2002), and consequently, any temporary protected area would at
least need to be in place long enough for this to occur. Therefore, consideration of
the life-history of any species to be ‘protected’ is a vitally important for temporary
marine protected areas.
Marine reserves as a ‘traditional’ management tool for coral reef ecosystems
Coral reefs are highly diverse marine ecosystems yet more than half of the world’s
coral reefs are threatened by human processes (Al-Jufaili et al. 1999, Moberg and
Folke 1999), particularly over-fishing, which decreases the capacity of coral reefs

Chapter 1 Introduction
21
to be productive or even sustainable (Roberts 1995a, Sale 2002). Although coral
reef fisheries may contribute to only a small proportion of the global commercial
fisheries catch, they remain a vital source of food and livelihood for many people,
particularly in developing countries (Pauly et al. 2002, Sale 2002, Bellwood et al.
2004).
Coral reef ecosystems in the Pacific remain an important, if not vital
resource for Pacific peoples, providing food and income (Overton and Thaman
1999, Samou 1999, SPREP 2001). Various forms of marine management based on
observations over generations and learning from the past were in place
throughout the Pacific pre-colonisation, and many of these systems are still
functioning today, for example taboo in Fiji and Kiribati, Ra’ui in the Cook Islands,
and rāhui in the islands of eastern Polynesia such as Moorea and Tahiti (Johannes
1994, Taniera 1994, Adams 1998, Veitayaki 1998, Barclay 2001, Churcher-Hoffman
2001, Young 2004). Similarly, in New Zealand, taiāpure (locally managed marine
areas), mataitai (reserved coastal marine areas for marae use), and rāhui
(prohibitions, see definition below) are present day marine management tools that
can be used by an iwi (tribe) within their rohe moana (coastal area). Although
indigenous knowledge systems have historically been dismissed by the western
world (Barclay 2001), the last 20 years has seen a renaissance of community-based
marine resource management in the Pacific Islands (Johannes 2002).
In New Zealand, rāhui is a means to prohibit a certain human activity from taking
place or continuing (Mead 1984). A common type of rāhui is the conservation
rāhui, often described as having ‘no teeth’, or being mild (Mead 1984). It is used in
New Zealand, and also the Cook Islands in the form of Ra’ui, to protect resources
derived from water or the land and involves restricted access or closed seasons to
allow resources to regenerate (Barclay 2001).
Chapter 1 Introduction
22
Ra’ui in the Cook Islands
Definition
Ra’ui is defined in the Cook Islands Maori dictionary as ‘1. A sign, usu, leaves on a
branch set in place by the owner of a piece of land or water reserving it or its
produce for his own or some special use; a prohibition. 2. Erect a ra’ui restricting
the picking of fruit etc.’ (Buse and Taringa 1996). Last century saw diminishing
use of Ra’ui in the Cook Islands, with the last Ra’ui on Rarotonga used sometime
in the early 1970s (Churcher-Hoffman 2001). However, in the late 1990s Ra’ui
were reinstated by the Koutu Nui (council of traditional leaders) to protect
declining stocks of various resource species in the lagoons (Ama 2003).
Ra’ui have no legal basis (Reid 2000), and are not permanent with various
Ra’ui in the Cook Islands having different periods of closure (Table 1.1). With
increasing pressures on the lagoon and marine resource species in Rarotonga,
Ra’ui may play a role in the sustainable management of key marine species. The
present Ra’ui on Rarotonga can be viewed as a rotational harvesting strategy for a
multi-species fishery. The Ra’ui may not only provide fisheries benefits but also
provide benefits to tourism, and one of the Ra’ui is now permanent (Ra’ui
Motukore). However, there is little quantitative information regarding the degree
of fishing outside the Ra’ui and the level of compliance within Ra’ui.
Chapter 1 Introduction
23
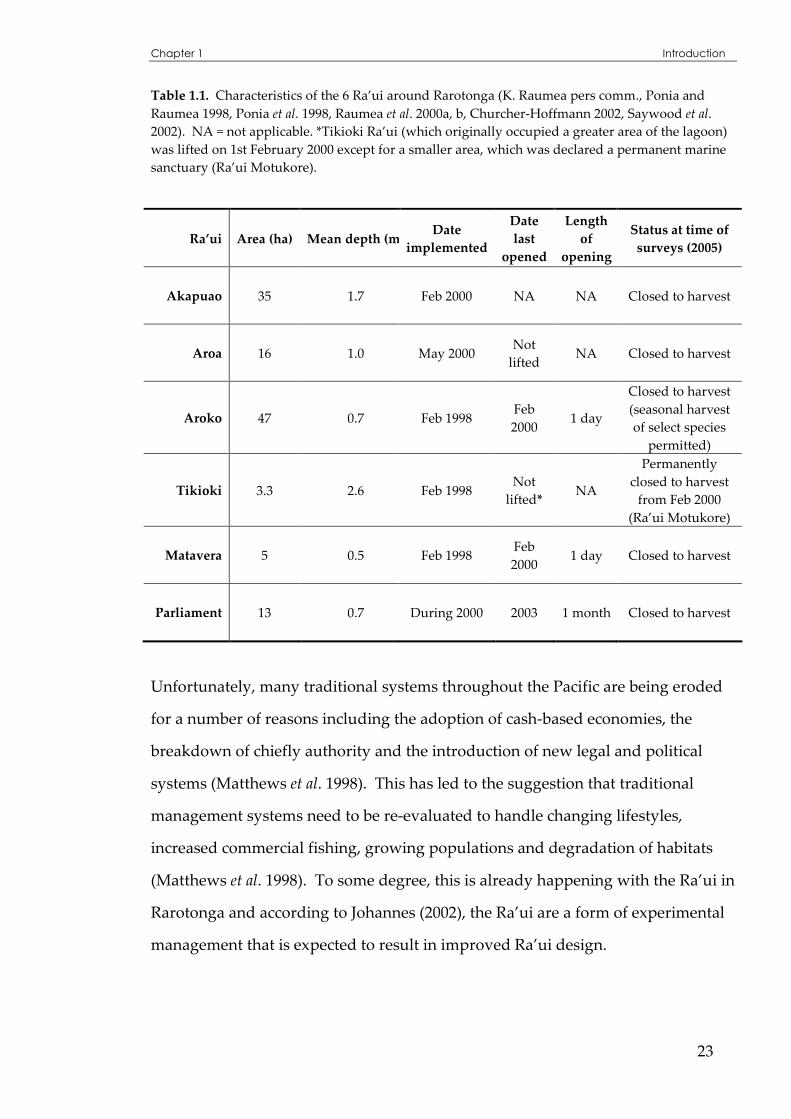
Table 1.1. Characteristics of the 6 Ra’ui around Rarotonga (K. Raumea pers comm., Ponia and Raumea 1998, Ponia et al. 1998, Raumea et al. 2000a, b, Churcher-Hoffmann 2002, Saywood et al. 2002). NA = not applicable. *Tikioki Ra’ui (which originally occupied a greater area of the lagoon) was lifted on 1st February 2000 except for a smaller area, which was declared a permanent marine sanctuary (Ra’ui Motukore).
Ra’ui Area (ha) Mean depth (m)Date
implemented
Date
last
opened
Length
of
opening
Status at time of
surveys (2005)
Akapuao 35 1.7 Feb 2000 NA NA Closed to harvest
Aroa 16 1.0 May 2000 Not
lifted NA Closed to harvest
Aroko 47 0.7 Feb 1998 Feb 2000
1 day
Closed to harvest (seasonal harvest of select species
permitted)
Tikioki 3.3 2.6 Feb 1998 Not
lifted* NA
Permanently closed to harvest
from Feb 2000 (Ra’ui Motukore)
Matavera 5 0.5 Feb 1998 Feb 2000
1 day Closed to harvest
Parliament 13 0.7 During 2000 2003 1 month Closed to harvest
Unfortunately, many traditional systems throughout the Pacific are being eroded
for a number of reasons including the adoption of cash-based economies, the
breakdown of chiefly authority and the introduction of new legal and political
systems (Matthews et al. 1998). This has led to the suggestion that traditional
management systems need to be re-evaluated to handle changing lifestyles,
increased commercial fishing, growing populations and degradation of habitats
(Matthews et al. 1998). To some degree, this is already happening with the Ra’ui in
Rarotonga and according to Johannes (2002), the Ra’ui are a form of experimental
management that is expected to result in improved Ra’ui design.

Chapter 1 Introduction
24
What is needed to advance our understanding of marine reserve performance?
The effectiveness of Ra’ui (or any managed marine area) is directly related to the
life-histories of those species targeted for harvest. The temporal, spatial, and
seasonal extent of the Ra’ui may be optimised to better sustain key resource
species such as the pa’ua (Tridacna species), and rori (Holothuroidea) based on a
better understanding of the life-history of each of these species. For example,
short-lived and/or rapidly recruiting species might require shorter and/or more
frequent closures to recover from harvests than longer-lived, slower growing /
maturing or slower recruiting species.
My research will quantitatively investigate the effects of the Ra’ui of
Rarotonga on fish and key resource invertebrate species. Few studies have
examined such effects, particularly in the context of a network of temporary
closures (i.e., Ra’ui, as opposed to permanent marine reserves). The Ra’ui of
Rarotonga provide a unique opportunity to study these effects.
This study also provides an opportunity to try and avoid some of the
problems with sampling design found in previous studies (see Willis et al. 2003).
The data in my study comprise a single ‘snapshot’ in time, and consequently this
limits generalisations and inferences that can be made based on my single large
dataset. However, my ecological surveys sample replicate pairings of ‘Control’
and ‘Ra’ui’ sites, and I develop and implement a new approach that attempts to
statistically evaluate the potential effects of natural environmental variability (i.e.,
a typically unexplored source of variation that may confound estimated ‘reserve-
effects’ in most existing studies, particularly Control-Impact assessments).
My study was conducted with the consent and support of the Koutu Nui on
Rarotonga, and in close association with the Cook Islands Ministry of Marine
Resources (MMR). Results are expected to assist with management of the lagoon
fish and invertebrate resources on Rarotonga.

Chapter 1 Introduction
25
Study Site
The Cook Islands comprises 15 islands located in the South Pacific Ocean, lying
roughly north-east of New Zealand between latitudes 8°-23°S and longitudes 156°-
167°W (Drumm 2004) (Figure 1.1). The main island, Rarotonga, (my study site)
with a land area of 6719 hectares, is located in the Southern group of islands and is
a volcanic high island surrounded by a shallow lagoon fringed by a narrow barrier
reef (Wood et al. 1970) (Plate 1).
Figure 1.1. Location of the Cook Islands (map provided by G McCormack and J Künzle, Cook Islands Natural Heritage Project).
The climate in the Cook Islands is tropical, characterised by warm temperature,
high humidity, moist winter months (June – September) and wet summer months
(December – May) (Leslie 1980). The mean annual temperature on Rarotonga is

Chapter 1 Introduction
26
24 °C, with a mean annual relative humidity of 84% and, mean rainfall in winter of
425mm and 939mm in summer (Leslie 1980).
The lagoon is wider and deeper on the windward side of the island
(between the south-east and west side) and narrower and shallower on the
leeward side (between the north-west and east side). Tides on Rarotonga are
semi-diurnal and small with a range of 0.3 metres on neap tides and 0.8m on
spring tides (Gibbs et al. 1971).
Plate 1. Aerial view of Rarotonga from the south-east corner (Muri) looking west. Photograph courtesy of Ewan Smith, Cook Islands.
The Ra’ui of Rarotonga provide a unique opportunity to investigate the
effectiveness of marine protected areas, in the context of a ‘network’ of temporary
closures. To advance our understanding surrounding the performance of marine
protected areas, my thesis is structured as follows:

Chapter 1 Introduction
27
Thesis structure
Chapter 2: Effects of substrate heterogeneity on estimates of density of a reef
fish: Implications for assessments of marine protected areas
Chapter 2 specifically addresses one of the potential biases (habitat heterogeneity)
that may arise from an implicit assumption of many researchers that chosen
Impact and Control sites are ‘roughly equivalent’. A single, ubiquitous reef fish
species, Ctenochaetus striatus, is used to evaluate the effects of Ra’ui. The
framework used for this work is a simple Control-Impact design, supplemented
with species-specific estimates of habitat use and availability. This supplemental
information is used to adjust estimates of fish density, and facilitates empirical
evaluation of potentially confounding effects of habitat heterogeneity.
Chapter 3: Fish, invertebrate, and functional group responses to Ra’ui
The novel method to incorporate habitat heterogeneity into the analysis of Ra’ui
effects developed in Chapter 2 is applied to other fish and invertebrate species to
investigate responses to Ra’ui. The effects of Ra’ui are determined across
functional groups for fish. I assess whether there are any notable patterns in the
response of select species or functional groups to Ra’ui at each site. Using meta-
analytical methods I also assess whether there is an island-wide effect of Ra’ui for
any of the species or functional groups examined.
Chapter 4: Spatial variation in size-structure of key resource species as an
indicator of Ra’ui effectiveness
For a subset of species for which I have representative and robust estimates of
size-structure, I assess whether mean and maximum size (which can be used to
infer estimates of natural growth and mortality) varies between Ra’ui and Control
sites. I incorporate substrate heterogeneity into analyses of size distributions for

Chapter 1 Introduction
28
five commonly occurring fish species. Habitat use can change over the course of
an organism’s ontogeny; consequently, habitat availability may determine the
abundances of organisms during a particular stage of their ontogeny. I assess
separately whether juveniles and adults use habitat differently. I then determine
whether the amount of preferred substrate locally available shapes juvenile and
adult densities.
Chapter 5: Site specific analyses of Ra’ui effects
In this chapter I explore the effectiveness of individual Ra’ui, obtaining separate
estimates of ‘effectiveness’ for (1) effects on local abundance, (2) mean size, and (3)
maximum size. I also explore some of the traits of Ra’ui that may shape variation
in their effectiveness.
Chapter 6: General discussion / conclusions
Chapter 6 provides an overall synthesis of my thesis findings. I discuss the
implications of my findings for Ra’ui, and marine protected areas.
Recommendations are made for the assessment of MPAs (particularly those in
tropical regions), which may assist in optimising the management of tropical fish
and invertebrates for both conservation and fisheries purposes.

29
CHAPTER 2: Effects of substrate heterogeneity on
estimates of density of a reef fish:
implications for assessment of marine
protected areas
ABSTRACT
Many estimates of ‘marine protected area (MPA) effects’ may be confounded by
heterogeneity in environmental features (e.g., available substrate, habitat
complexity) between ‘Impact’ (i.e., MPA) and ‘Control’ sites. However, the
magnitude and extent of such confounding is generally unknown. Here, I
explicitly explore the effects of substrate availability on estimates of MPA
performance. I estimated: 1) abundance of the reef fish, Ctenochaetus striatus, 2)
available substrate, and 3) substrate selectivity (Manly’s alpha) of C. striatus within
6 ‘Ra’ui’ (traditionally managed MPAs) and 6 paired ‘Control’ sites on the island
of Rarotonga. I used a two-factor analysis of covariance (ANCOVA) model with
‘useable substrate’ as the covariate to test for an overall effect of Ra’ui. I used
logged response ratios to evaluate putative effects of MPAs separately for simple
counts recorded on my sampling transects, and for ‘preference corrected’
densities, where substrate types were weighted by an index of habitat selectivity
(Manly’s alpha). I contrasted both my simple and ‘preference corrected’ densities
at each site with ANCOVA models. My results suggest that adjusting for
substrate availability may significantly alter perceptions of the effects of Ra’ui on
C. striatus. My framework allows estimates of effect size, a metric useful for
assessing MPA effectiveness, and in concert with my ANCOVA models, provides
a stronger assessment of MPA effects. Further, I conclude that substrate effects (or
more generally, environmental heterogeneity) should be incorporated into future

Chapter 2 Effects of Substrate Heterogeneity
30
assessments of MPA effectiveness, and this work describes one potential
framework to accomplish this.

Chapter 2 Effects of Substrate Heterogeneity
31
INTRODUCTION
Marine protected areas (MPAs) are widely used as tools for both conservation and
fisheries management (Roberts et al. 2001; Sale 2002; Hastings and Botsford 2003;
Cinner et al. 2006). Good estimates of MPA effectiveness are important for
adaptive management and decision-making. The predicted effects of marine
protection are that density, size, diversity and biomass of organisms will increase
within MPA boundaries (Roberts 1995b; Jennings et al. 1996b; Russ and Alcala
1996; Wantiez et al. 1997; McClanahan et al. 1999; Tuya et al. 2000; McClanahan and
Arthur 2001; Claudet et al. 2006). The general inference therefore is that reserves
often have ‘positive effects’ in the context of conservation and fisheries
management.
The assessment of MPA effects typically requires an estimate of ‘baseline’
conditions; for example, how many fish would be expected in the (theoretical)
absence of an established MPA? However, in contrast to manipulative field
experiments, the assessment of MPA effects typically cannot be effectively
replicated. Accordingly, a number of approaches have been proposed to address
difficulties associated with assessments of unreplicated interventions such as the
implementation of MPAs e.g., Before-After (Box and Tiao 1975), Control-Impact
(Osenberg and Schmitt 1996), Before-After-Control-Impact (Green 1979), and,
Before-After-Control-Impact-Paired-Series (BACIPS) (Stewart-Oaten et al. 1986)
study designs. Although a BACIPS study is considered the best for detecting the
effects of unreplicated interventions, such as MPAs, there is typically little
opportunity to implement this study design for a variety of reasons (see Osenberg
and Schmitt 1996 for further discussion).
Limited opportunities to implement optimal assessment designs results in a
preponderance of Control-Impact studies used to assess the effects of MPAs (Cole
et al. 1990; Roberts 1995b; McClanahan et al. 1999; Tuya et al. 2000; Halpern 2003;
Westera et al. 2003; Osenberg et al. 2006). For such studies, the intervention site

Chapter 2 Effects of Substrate Heterogeneity
32
(i.e., the MPA, or ‘Impact’ site), is assumed to be independent of a nearby Control
site, which is selected as a point of comparison to represent the state of the natural
system that would have existed had the intervention not been implemented
(Osenberg and Schmitt 1996; Osenberg et al. 2006). However, Control-Impact
studies confound effects attributable to the intervention with natural spatial
variability in ecological systems (because no two sites are ever ‘identical’;
Osenberg and Schmitt 1996).
Sites (both Control and Impact) vary for many reasons, and this can lead to
erroneous inferences of MPA effects, especially when siting is non-random
(Osenberg et al. 2006). Despite the quantity of evidence (primarily from Control-
Impact assessments; Halpern 2003), which suggests positive local effects of MPAs,
some researchers (and managers, and fishers) continue to highlight limitations of
existing assessments (Osenberg et al. 2006), raising questions about the actual
effectiveness of MPAs as a tool for management and conservation (García-Charton
and Perez Ruzafa 1999; Sale 2002; Willis et al. 2003).
One important factor that can produce spatial variability in marine
organisms is habitat availability, which has been shown to influence species
abundances (Bell and Galzin 1984, Pulliam and Danielson 1991, Chittaro 2004).
One of the critical underlying assumptions of most Control-Impact assessments,
and therefore of most existing assessments of MPAs, is that the available habitat
within Control and Impact sites is similar. Careful Control site selection can
reduce dissimilarities in available habitat between Control and Impact sites (and
improve the validity of inferences). However, it is unrealistic to expect available
habitat to be the same. García-Charton and Perez-Ruzafa (1999) have noted that
few assessments of MPA effects have given quantitative attention to potentially
confounding effects of environmental (e.g., habitat) heterogeneity, though the idea
of such confounding effects is not new (e.g., Edgar and Barrett 1997; Chapman and
Kramer 1999). A recent meta-analysis of the effects of MPAs (Halpern 2003)
examined 89 separate empirical studies and found that mean densities for a wide
Chapter 2 Effects of Substrate Heterogeneity
33
range of species were significantly higher inside MPAs relative to reference areas.
However, Halpern (2003) also acknowledged that habitat type and quality were
not considered in his meta-analysis as many of the empirical studies reviewed
typically did not report this information. Consequently, the degree to which
unreported environmental heterogeneity may shape inferences regarding the
effects of MPAs (e.g., are estimated effects more typically ‘positive’ because MPAs
are often sited in the ‘best’ areas within a region?) remains uncertain.
In this chapter I address the potential biases in inferences that may arise
from an implicit assumption of many researchers that chosen Impact and Control
sites are ‘roughly equivalent’. Specifically, I evaluate the effects of a collection of
MPAs on Rarotonga (Cook Islands). Though I simultaneously collected data on
many species as part of a wider study on the effects of MPAs, here I focus on a
single species of reef fish to more clearly illustrate: 1) my approach, and 2) the
potential biases in inferences that may arise as a result of differences in available
habitat. My assessment framework is a simple Control-Impact design,
supplemented with estimates of resource (in this case, substrate) use and resource
availability relevant to my focal species. This supplemental information is used to
adjust estimates of fish density, and facilitates empirical evaluation of potentially
confounding effects of heterogeneous substrate between sites. However, this
approach, which assumes substrate is simply a confounding variable that is not
itself responding to protection, may mask MPA effects if available substrate is
playing a role in determining differences in fish abundances between sites.
Therefore, to address biases in inferences derived from my assessment framework,
I compare my model with more commonly implemented analysis of covariance
(ANCOVA) models with metrics of substrate availability as covariates, allowing
the separation of the effects of protection from the effects of substrate availability.
I suggest a combination of my approach and the more traditional use of ANCOVA
models as an improved framework for future Control-Impact studies, particularly
as BACIPS field assessments are often not feasible.

Chapter 2 Effects of Substrate Heterogeneity
34
MATERIALS AND METHODS
Study system and species.
All work was conducted within the shallow lagoon system surrounding the island
of Rarotonga, Cook Islands (latitude 21°12´S longitude 159°46´E, Figure 2.1).
Lagoon depths reach a maximum of 3.5 metres on the windward side of the
island, and 1.5 metres on the leeward side of the island, and habitat features
within the lagoon system are spatially variable. The present lagoon system is
divided into management zones (Figure 2.1) that are open to harvest, interspersed
with management zones that are under some form of harvest control. Within
these controlled areas, known as Ra’ui, some or all species may be protected from
harvest, though the areas may be open to fishing from time to time (and
compliance during periods of protection may be spatially and temporally
variable)(See Chapter 1, Table 1.1). The Ra’ui, having no legal basis, rely on
respect for traditional authority (Reid 2000). At the time of my surveys (autumn /
winter 2005), there were 6 Ra’ui designated within the lagoon that were closed to
the harvest of fish and invertebrates (Figure 2.1, see Chapter 1, Table 1.1).

Chapter 2 Effects of Substrate Heterogeneity
35
Figure 2.1. Map showing location of Ra’ui (R) [i.e., ‘MPA’ or ‘Impact’ sites] and corresponding non-Ra’ui [i.e., paired ‘Control’ (C)] sites around Rarotonga. Sites are coded as: AP = Akapuao, AA = Aroa, AK = Aroko, TK = Tikioki, MT = Matavera, PR = Parliament.
In this chapter I explore spatial patterns of abundance of the reef fish Ctenochaetus
striatus in relation to Ra’ui and associated environmental features that may vary
systematically among Ra’ui (= ‘MPA’ = ‘Impact’ site) and/or between Ra’ui and
harvested (non-Ra’ui) areas (= ‘Control’ sites). C. striatus is found throughout the
Indo-pacific region (excluding the Hawaiian, Marquesan and Easter Islands)
(Randall 2005), is locally common in the lagoon surrounding Rarotonga (S. Miller,
pers. obs.), and has been a favoured food fish, particularly in the southern group
of the Cook Islands (McCormack 2007). C. striatus occurs in lagoons, on reef flats,
and seaward reefs to depths over 30 metres, and can be found singly or in small to
sometimes large, often mixed-species aggregations (Randall 2005). Using C.
striatus as a focal species, (particularly as it occurred in abundances great enough
to facilitate my statistical analyses), my overall aim is to evaluate the degree of
concordance between estimates of reserve effects that either (1) ignore fine-scale
0 1 2 3 4 5 kilometres

Chapter 2 Effects of Substrate Heterogeneity
36
habitat heterogeneity (implicit in most MPA assessments) or (2) attempt to
statistically control for habitat heterogeneity relevant to the focal species.
Sampling regime
Field work was conducted between March and July 2005, with a total of 16 sites
surveyed, including 6 Ra’ui paired with 6 ‘Control’ sites (Figure 1). Paired Control
sites were located at least 300m from Ra’ui boundaries and were selected and
paired with Ra’ui based upon their proximity and qualitative similarities in depth,
substrate composition and habitat complexity. All sites except for Matavera Ra’ui
and its paired Control (due to an anomalously narrow lagoon) were spatially
stratified into ‘inner’ and ‘outer’ strata, determined by the midpoint between the
reef crest and shore for each site. Within each strata, 5 randomly located replicate
transects (25m x 4m) were sampled once within all sites. In total, 150 transects
were surveyed throughout the lagoon with all diurnally active fish, and numerous
invertebrate species censused as part of a wider study investigating the responses
of a suite of reef fish species and invertebrates to protection. I did not stratify my
sampling ‘by microhabitat’ for each species because, like many MPA assessments,
1) habitat/resource requirements were not known a priori for most censused
species and 2) such approaches are not practical for multi-species surveys (e.g.,
what may have been suitable habitat for one species, may not be suitable for other
species).
I randomised spatial sampling through time to minimise potential biases
arising from the sampling of sites/strata over a number of months and tidal cycles,
as one of the objectives of the wider study was to investigate whether there were
island-wide effects of Ra’ui. For each transect within strata I recorded: 1) counts of
all C. striatus; 2) the substrate type upon which each individual C. striatus was
initially observed, and; 3) fixed-point contact data (collected at 1m intervals in a
uniform grid pattern within each transect) to estimate percent cover of substrate

Chapter 2 Effects of Substrate Heterogeneity
37
types over the area of the transect (125 points per transect – see below for
description of substrates).
Ctenochaetus striatus is generally found in coral, rocky, pavement and rubble
habitats (Lieske and Myers 2002). Based on this information (and information and
observations of substrate use for other species examined as part of my wider study
examining the effects of MPAs), I selected broad substrate categories based on
prior observations in the field, and for ease of implementation during the surveys.
Substrate was categorised as either: 1) dead coral (large upright limestone
structures either cemented to substrate or else free from substrate but > ~60cm
diameter, i.e., relatively immobile), 2) live coral (comprising genera: Porites,
Acropora, Pocillopora, Montastrea, Favia, Acanthastrea, Leptastrea, Hydnophora,
Cyphastrea, Galaxea, Echinopora, Montipora, Millepora species), (3) sand, 4) pavement
(substrate that has been compressed and cemented into a conglomerate mass), 5)
rubble (substrate ~0.5-60cm diameter but not cemented), 6) turf algae
(filamentous algal species), and 7) all other algae (including Anabaena torulosa,
Halimeda, Turbinaria, Galaxaura, and Phorium spp).
Environmental/ancillary information including depth, visibility, time and
date of sampling, tide and lunar phase was also recorded. All sampling was
conducted on snorkel in 0.5 - 3.5m water depths, between the hours of 9:00 and
16:00 to ensure diurnally active fish species were sampled (English et al. 1997).
Estimating effects of Ra’ui
Overview
My overall approach used a Control-Impact assessment framework (Osenberg and
Schmitt 1996) to estimate the putative effects of individual Ra’ui in two separate
ways: either with- or without adjustment for substrate availability. As some of the
data did not meet the assumption of homogeneity of variance required by the
Student’s t-test (Quinn and Keough 2002), I used the Welch test to explore spatial
Chapter 2 Effects of Substrate Heterogeneity
38
variation in C. striatus densities (no./m2 of bottom area, estimated from visual
counts on replicate transects) between each Ra’ui and paired Control site.
I used permutational analysis of variance (PERMANOVA) (Anderson 2001;
McArdle and Anderson 2001) to evaluate variation in substrate cover between
each Ra’ui and paired Control site (i.e., 6 separate multivariate analyses were
conducted). Arc-sine square-root transformed proportions of substrate cover
comprised the set of independent variables, and my analyses tested the null
hypothesis that substrate was homogenous in multivariate space for each set of
paired sites. Substrate composition estimated from my fixed-point contacts was
heterogeneous among sites (I suspect this is a common feature of most MPA
assessments, though habitat heterogeneity is rarely quantified) (Figure 2.2).
Differences in available substrate between Ra’ui and Control sites, coupled
with my observation that C. striatus did not appear to use all substrates equally,
prompted me to quantify patterns of substrate use for C. striatus (detailed below),
and then adjust estimates of ‘available substrate’ based upon species-specific
substrate preferences. These adjusted estimates of available substrate facilitated
adjustments of densities (on a per ‘available substrate basis’ as opposed to a per m2
benthos measure). Variation in these ‘preference-corrected’ densities between each
Ra’ui and paired Control were then analysed with Welch tests using the R
statistical platform (R Development Core Team 2006). I directly tested for an
overall effect of Ra’ui with a two-factor ANCOVA model with protection (i.e.,
Ra’ui or Control) and site as fixed factors and a substrate ‘usability index’ as the
covariate. I then contrasted ANCOVA models for each Ra’ui / Control pair
(protection as the fixed factor and substrate ‘usability index’ the covariate) to
quantify sources of variation in C. striatus densities for each site and assess the
utility of my adjusted densities.

Chapter 2 Effects of Substrate Heterogeneity
39
Adjusting fish densities based upon substrate preference
I adjusted estimates of density by weighting substrate types by an index of
resource selectivity, Manly’s alpha (Manly 1974; Chesson 1978; 1983; Manly 1993).
In this case, Manly’s alpha provides a measure of preference for the different
substrates C. striatus was observed on in the lagoon while accounting for natural
variation in the availability of each substrate type at each site (Pledger et al. 2007).
For each of the seven substrate types (described above), Manly’s alpha was
calculated by taking the mean of separate Manly’s alpha values calculated using
the statistical platform, R (R Development Core Team 2006) across 16 sites around
Rarotonga, including the 6 Ra’ui and Control site pairs (i.e., 12 sites). I calculated
density two ways; one form yielded a simple density (number per area) (Equation
1), and the other yielded a ‘preference-corrected’ density in which the availabilities
of substrates were weighted by their preference (Equation 2):
Equation 1) t
tki it
tt A
Ns
ND =∑
==1 ,
and
Equation 2) ∑
==
ki iti
tt s
ND1 ,α
where N is the number of fish counted on a 100m2 transect, t is the transect
number, k is the number of substrate types (in this case, 7), s is the proportion of
the transect represented by the substrate type, and α is Manly’s alpha.
Evaluating Ra’ui effects using response ratios
I used logged response ratios (Hedges et al. 1999) generated from the average
densities of C. striatus at each site [ln (densityRa’ui / densitypaired Control)] to evaluate:
(1) overall effects of Ra’ui on densities of C. striatus and, (2) concordance in
estimates of effect sizes based upon simple versus substrate preference corrected

Chapter 2 Effects of Substrate Heterogeneity
40
densities. In my calculations, logged response ratios greater than zero indicate a
positive response to protection; values of zero, or less than zero, indicate no
response, or a negative response, respectively. 95% confidence intervals were
calculated based on Hedges et al. (1999).
Direct test of overall Ra’ui effect
Using the statistical software package SPSS (SPSS 2008), I assessed the overall
effect of Ra’ui using a two factor ANCOVA model (square-root transformed
densities were the response variables; factors were level of protection i.e., Ra’ui or
Control; and site) to evaluate variation in densities of C. striatus between Ra’ui and
Control sites, with a substrate ‘usability index’ per transect (S) (Equation 3) as
covariate:
Equation 3) ∑==
k
iitit sS
1,α
where k is the number of substrate types (in this case, 7), t is the transect number,
α is Manly’s alpha, and s is the proportion of the transect represented by the
substrate type.
Further, I treated each Ra’ui and Control pair as blocks in my ANCOVA
analysis. My ANCOVA model explicitly tested the effect of Ra’ui, available
substrate, and site (also evaluating the interaction between level of protection and
site).
Contrasting simple and preference corrected density estimates with ANCOVA
I contrasted the logged response ratios of my simple density estimates and my
‘preference-corrected’ density estimates for each Ra’ui and Control pair with
ANCOVA models for each site, again with ‘substrate usability’ index as the
covariate. My aim was to assess the concordance of my simple and ‘preference-
corrected’ density estimates at each site with those from my ANCOVA models,

Chapter 2 Effects of Substrate Heterogeneity
41
0%
10%
20%
30%
40%
50%
60%
70%
80%
90%
100%
C R C R C R C R C R C R
AP AA AK TK MT PR
WINDWARD LEEWARD
Site
Sub
stra
te C
over
0.037 0.356 0.003 0.001 0.008 0.008
and to assess whether any statistical differences in densities between Ra’ui and
Control were due to the effect of Ra’ui, or available substrate.
RESULTS
Substrate use by Ctenochaetus striatus
Substrate cover differed in 5 of the 6 Ra’ui / Control pairings (Figure 2). Only
Aroa showed evidence of statistically indistinguishable habitat structure between
the Ra’ui and its paired Control (Figure 2).
Figure 2.2. Cumulative percent cover of substrate per site by status (Ra’ui and Control). P-values at top of chart are results from a PerMANOVA of arc-sine square-root transformed proportion substrate cover for each Ra’ui and Control pair. AP = Akapuao, AA = Aroa, AK = Aroko, TK = Tikioki, MT = Matavera, PR = Parliament. TA = turf algae, S = sand, R = rubble, P = pavement, OA = other algae, D = dead coral, and C = live coral.

Chapter 2 Effects of Substrate Heterogeneity
42
Manly’s alpha values falling above or below a calculated value that is
representative of random assortment (in this case, 0.143) reflect overuse (i.e.,
apparent preference) or under-use (i.e., apparent avoidance), respectively. Island-
wide, C. striatus exhibited preference for dead coral and rubble substrates, and
avoided live coral, other algae, pavement, sand, and turf algae (Figure 2.3).
Figure 2.3. Lagoon-wide pattern of substrate use (error bars are 95% confidence intervals) by C. striatus across, evaluated for 7 substrates, as indicated by Manly’s alpha. Dotted line depicts value of Manly’s alpha consistent with random distribution; values above or below indicate overuse (preference) or under-use (avoidance) respectively.
-0.1
0.0
0.1
0.2
0.3
0.4
0.5
0.6
Live Coral Dead Coral Other Algae Pavement Rubble Sand Tur f Algae
Substrate Category
Man
ly's
Alp
ha

Chapter 2 Effects of Substrate Heterogeneity
43
Estimates of local Ra’ui effects
Fish densities
Simple mean densities of C. striatus within Ra’ui at Matavera and Parliament sites
were significantly greater than densities estimated for paired Control regions by
almost threefold (Figure 4A). For C. striatus densities estimated on a per meter
benthos scale, all other Ra’ui and Control site pairings were statistically
indistinguishable (Figure 4A). Based on adjusted density estimates, the estimated
disparity between Parliament Ra’ui and its paired Control became more extreme
(and remained significant based upon a Welch test). After adjusting for habitat
heterogeneity, elevated densities inside the Matavera Ra’ui were no longer
significantly different from the paired Control, and instead Akapuao Ra’ui
appeared to have enhanced densities relative to its paired Control (Figure 4B). For
Tikioki Ra’ui, adjusting densities based upon habitat heterogeneity modified my
perceptions of relative abundance inside versus outside Ra’ui.
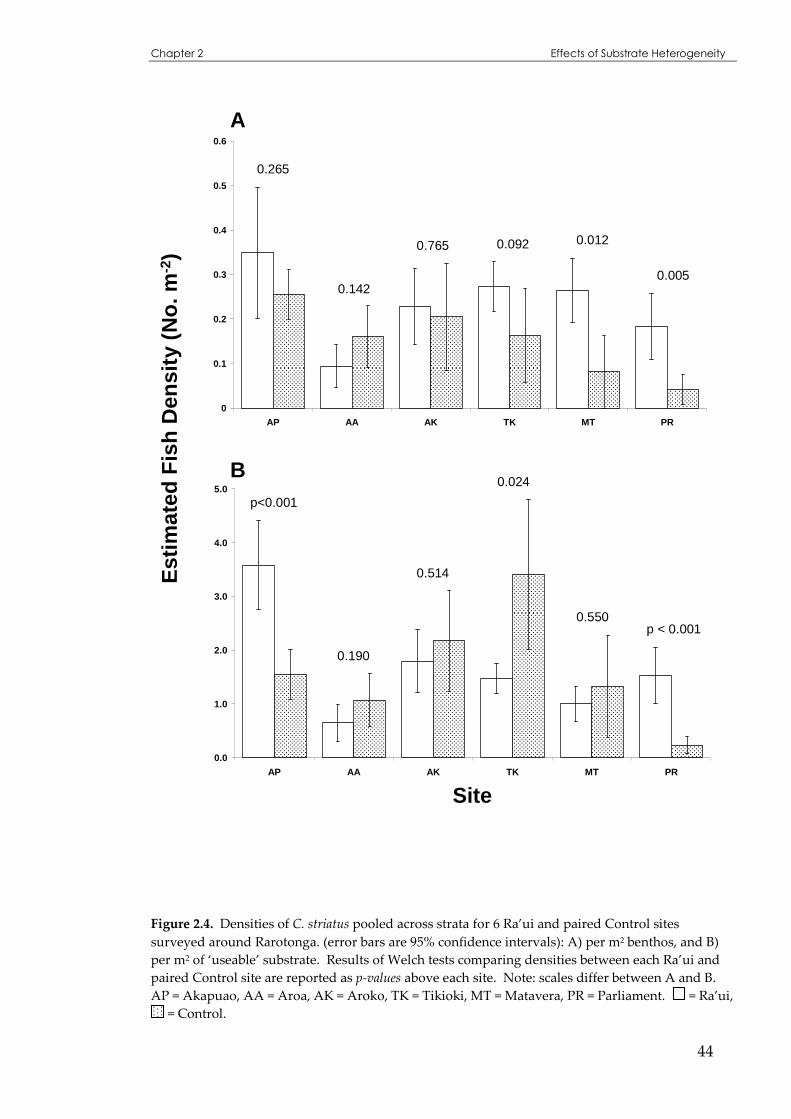
Chapter 2 Effects of Substrate Heterogeneity
44
Figure 2.4. Densities of C. striatus pooled across strata for 6 Ra’ui and paired Control sites surveyed around Rarotonga. (error bars are 95% confidence intervals): A) per m2 benthos, and B) per m2 of ‘useable’ substrate. Results of Welch tests comparing densities between each Ra’ui and paired Control site are reported as p-values above each site. Note: scales differ between A and B. AP = Akapuao, AA = Aroa, AK = Aroko, TK = Tikioki, MT = Matavera, PR = Parliament. = Ra’ui,
= Control.
0
0.1
0.2
0.3
0.4
0.5
0.6
AP AA AK TK MT PR
0.0
1.0
2.0
3.0
4.0
5.0
AP AA AK TK MT PR
A
B
Est
imat
ed F
ish
Den
sity
(N
o. m
-2)
p<0.001
0.024
0.092
0.550p < 0.001
0.142
0.765
0.265
0.012
0.005
0.514
0.190
Site

Chapter 2 Effects of Substrate Heterogeneity
45
Direct test of an overall Ra’ui effect
My two-factor ANCOVA model, with level of protection and site as fixed factors,
and ‘useable substrate’ index the covariate, indicated that both site and substrate
significantly contributed to variation in C. striatus densities across all Ra’ui (Table
2.1). There was also a significant interaction between the level of protection and
site (Table 2.1).
Table 2.1. Two factor analysis of covariance (factors = protection and site) evaluating densities of C. striatus across all Ra’ui and Control sites, with index of ‘usable substrate’ as covariate.
Estimated Marginal Mean Treatment df MS F-ratio p
Ra’ui Control
Full model 12 0.208 11.139 p < 0.0001 0.408 0.367 Protection 1 0.037 1.985 0.162
Site 5 0.195 10.465 p < 0.0001 Substrate 1 0.935 50.053 p < 0.0001
Protection X Site 5 0.065 3.489 0.006 Error 97
Response to protection – simple data versus substrate adjusted data
In the context of a Control-Impact framework, inferred responses of C. striatus to
protection are given as logged response ratios (Figure 2.5). This graphical analysis
suggests that C. striatus exhibited a heterogeneous response to protection across all
Ra’ui sites, based upon either the simple density estimates or ‘preference-
corrected’ estimates. Basing inferences on simple density estimates, Matavera and
Parliament Ra’ui appeared to have a positive effect on C. striatus density; the
inferred effects of all other Ra’ui were equivocal (Figure 2.5).

Chapter 2 Effects of Substrate Heterogeneity
46
-2
-1
0
1
2
3
AP AA AK TK MT PR
Res
pons
e R
atio
Figure 2.5. Logged response ratios [Ln (density Ra’ui / density Control)] as an estimate of Ra’ui effects, calculated for simple densities and ‘preference-corrected’ densities. Error bars are bootstrapped 95% confidence intervals. AP = Akapuao, AA = Aroa, AK = Aroko, TK = Tikioki, MT = Matavera,
PR = Parliament. = simple densities, = ‘preference-corrected’ densities
Basing inferences upon ‘preference-corrected’ densities, C. striatus appeared to
respond favorably to protection from harvest at Akapuao and Parliament, and
negatively to protection from harvest at Tikioki (Figure 2.5). In several cases (e.g.,
Tikioki and Matavera), adjusting for substrate heterogeneity qualitatively
modified inferences of MPA effectiveness (Figure 2.5).
Variation in fish densities
ANCOVA models to quantify the sources of variation in C. striatus densities
between paired Ra’ui and Control sites suggested there were significant
differences between Ra’ui and Control C. striatus densities at 4 of the 6 Ra’ui sites
(Table 2.2). However, Ra’ui accounted for this difference at only one site,
Parliament. For Akapuao, Aroko, Parliament, Matavera, and Tikioki, the total

Chapter 2 Effects of Substrate Heterogeneity
47
percentage of preferred substrate accounted for a significant amount of variation
in C. striatus densities between paired Ra’ui and Control sites (Table 2.2). Further,
there was an interaction between protection and substrate at Akapuao and Tikioki
Ra’ui. There was a significant interaction between Ra’ui (level of protection) and
the total percentage of preferred substrate at Akapuao, Matavera, and Tikioki
(Table 2.2).
Estimated marginal mean C. striatus densities were calculated from my
ANCOVA model in SPSS (SPSS 2008) (Table 2.2). Estimated marginal mean C.
striatus densities were significantly greater at Akapuao and Parliament Ra’ui sites,
and significantly lower at Aroko and Tikioki Ra’ui sites than corresponding
Control sites (Table 2.2). There were no significant differences in C. striatus
estimated marginal mean densities at Aroa or Matavera Ra’ui and their
corresponding Control sites (Table 2.2). The direction of my simple C. striatus
density responses were concordant with the direction of paired Ra’ui / Control
estimates from my ANCOVA model at only two of the six sites, Aroa and
Parliament (Table 2.2, Figure 2.4). However, the direction of my adjusted density
estimates were concordant with the direction of my ANCOVA model estimated
densities at five of the six sites (Table 2.2, Figure 2.4).

Chapter 2 Effects of Substrate Heterogeneity
48
Table 2.2. Analysis of covariance evaluating densities of C. striatus between separate Ra’ui and corresponding Control sites, with index of ‘usable substrate’ as covariate. Given are separate analyses for each Ra’ui/Control site pairing. Estimated marginal means of C. striatus densities (with covariates held at their overall mean value) are included in the table.
SITE Treatment df MS F-ratio p Estimated
Marginal Mean
Ra’ui Control
AKAPUAO Full model 3 0.128 11.088 p<0.001 0.664 0.464
Protection 1 0.005 0.408 0.532
Substrate 1 0.297 25.734 p<0.001
Protection X Substrate 1 0.093 8.046 0.012
Error 16 0.012
AROA Full model 3 0.022 0.76 0.533 0.263 0.373
Protection 1 0.008 0.291 0.597
Substrate 1 0.003 0.114 0.74
Protection X Substrate 1 0.00001 0 0.983
Error 16 0.029
AROKO Full model 3 0.183 12.703 p<0.001 0.412 0.447
Protection 1 0.009 0.616 0.444
Substrate 1 0.539 37.364 p<0.001
Protection X Substrate 1 0.025 1.726 0.207
Error 16 0.014
TIKIOKI Full Model 3 0.117 11.571 p<0.001 0.461 0.579
Protection 1 0.017 1.646 0.218
Substrate 1 0.191 18.941 p<0.001
Protection X Substrate 1 0.069 6.804 0.019
Error 16 0.01
MATAVERA Full model 3 0.064 2.6 0.565 0.742 0.231
Protection 1 0.02 1.967 0.121
Substrate 1 0.008 0.824 0.049
Protection X Substrate 1 0.007 0.312 0.044
Error 6 0.025 0.277
PARLIAMENT Full model 3 0.205 20.827 p<0.001 0.385 0.178
Protection 1 0.153 15.567 0.001
Substrate 1 0.222 22.58 p<0.001
Protection X Substrate 1 0.025 2.491 0.134
Error 16 0.01

Chapter 2 Effects of Substrate Heterogeneity
49
DISCUSSION
Adequate assessments of interventions such as MPAs are vital in order to
understand MPA effects and ensure MPAs meet their conservation goals. In this
study I demonstrate the effects of incorporating substrate availability into MPA
assessments. Ignoring putative effects of substrate availability and using a
standard Control-Impact assessment framework (the most common form of MPA
assessment), I inferred a varying response of C. striatus to protection across the 6
censused Ra’ui. When substrate availability was incorporated into my analyses,
perceptions (i.e., inferences derived from a set of Control-Impact assessments)
were altered. My two-factor ANCOVA model assessing an overall Ra’ui effect
also suggested that C. striatus had a variable response to protection across Ra’ui. I
suggest that my framework for adjusting densities as a function of the relative
abundance of, and preferences for, substrate types may provide more meaningful
estimates of density in a set of observations where substrates (and preferences)
may be heterogeneous. At any rate, my approach facilitates a quantitative
comparison of effect sizes (i.e., inferred effects of MPAs) with and without
adjustment for substrate availability (e.g., Figure 5). Further, my ANCOVA
models of C. striatus densities at each site were concordant with my ‘preference-
corrected’ model for 5 of the 6 Ra’ui / Control paired sites, giving support to my
adjusting densities for ‘useable’ substrate.
ANCOVA models indicated that the majority of C. striatus densities at each
site were influenced by substrate availability. Consequently, it is likely the lack of
significant differences in C. striatus ‘preference corrected’ densities (see Figure 2.4)
between Ra’ui and corresponding Controls at Aroa, Aroko, and Matavera were
due to each Ra’ui having a similar index of ‘usable substrate’ (S) to its paired
Control, whereas S was higher at Ra’ui for Akapuao and Parliament, and lower at
Tikioki, than its paired Control site. Subsequent Welch t-tests using the R
statistical platform (R Development Core Team) of the respective null (and
alternative) hypotheses (i.e., H0 = SRa’ui = SControl , HA = SRa’ui ≠ SControl (Aroa, Aroko, and

Chapter 2 Effects of Substrate Heterogeneity
50
Matavera), H0 = SRa’ui = SControl , HA = SRa’ui < SControl (Tikioki), and H0 = SRa’ui = SControl , HA
= SRa’ui > SControl (Akapuao and Parliament) were accepted for Aroa (t = -0.265, df =
17.04, p = 0.794), Aroko (t = 0.929, df = 17.68, p = 0.366), and Parliament (t = 5.839,
df = 17.64, p = 0.794) and rejected for Matavera (t = 11.316, df = 6.93, p ≤ 0.001),
Tikioki (t = 5.839, df = 17.64, p ≤ 0.001), and Akapuao (t = -2.560, df = 17.93, p =
0.010) confirming my suppositions regarding ‘usable substrate’ at 4 of the 6 sites.
In contrast, Parliament did not have greater ‘useable substrate’ at Ra’ui sites,
indicating that Ra’ui (or some other factor that I failed to quantify e.g., habitat
rugosity) contributed to greater C. striatus densities at the Parliament Ra’ui than at
its corresponding Control. This result also agreed with the ANCOVA model for
Parliament (Table 2.2) where protection accounted for a significant amount of
variation in C. striatus densities between Ra’ui and Control sites.
Response ratios enabled the magnitude of effect for both simple and
adjusted density estimates to be quantified. Further, ANCOVAs with substrate as
covariates indicated whether protection or substrate contributed to variation in
fish densities between paired Ra’ui and Control sites. Increasingly, alternatives to
null-hypothesis significance testing such as effect size statistics are being
advocated in the biological sciences (Nakagawa and Cuthill 2007; Stephens et al
2007). The use of effect sizes (e.g., response ratios) provides more biologically
meaningful information relative to standard null hypothesis significance tests,
because these approaches give information on both the magnitude of the effect,
and the precision of the effect size estimate (Nakagawa and Cuthill 2007). Further,
estimates of effect size with confidence intervals can provide clear and informative
conclusions that can become the basis for decision-making (Stewart-Oaten 1996),
and enable the quantification of the response to a restoration activity such as the
implementation of an MPA (Osenberg et al. 2006). Although response ratios
generated from my preference corrected densities don’t provide specific
information regarding the sources of variation contributing to differences in fish
densities between sites, this information could still be used as a baseline for future

Chapter 2 Effects of Substrate Heterogeneity
51
work with increases or decreases in effect size as indications of recovery or
decline, respectively. Further, the concurrent use of ANCOVA models can
partition sources of variation to ascertain, for example, whether differences
between sites are due to protection or substrate availability or a combination of
these two factors. Together, my two approaches increase biological inferences that
can be gained from MPA assessments.
That available substrate appears to affect densities of organisms is not a
novel finding. It is generally acknowledged that habitat availability is a factor
contributing to the abundance of many species, including fish (Bell and Galzin
1984, Pulliam and Danielson 1991, Chittaro 2004). In contrast, few assessments of
MPAs (reviewed in Halpern 2003; Osenberg et al. 2006) consider (in any
quantitative form) the potentially confounding effects of environmental
heterogeneity in their design, analysis, or interpretation.
Though confounding effects of spatio-temporal variation are perhaps best
dealt with in more sophisticated assessment designs (e.g., BACIPS, sensu Stewart-
Oaten et al. 1986), there is often little opportunity to collect required ‘Before’ data
(e.g., Mosquera et al. 2000; Parnell et al. 2005; Floeter et al. 2006). Consequently,
many previous assessments of MPA effectiveness have been simple Control-
Impact studies, or a variation on this type of study (Osenberg et al. 2006). Control-
Impact studies do not typically incorporate habitat heterogeneity into assessment
designs, though some workers have acknowledged this as a limitation in their
work (e.g., Parnell et al. 2005; Floeter et al. 2006). Several previous studies have
attempted to account for environmental variation by incorporating information
regarding habitat or environmental heterogeneity into their analyses (Buxton and
Smale 1989; Tuya et al. 2000; McClanahan and Arthur 2001; Friedlander et al. 2003;
Westera et al. 2003; Willis and Anderson 2003; Evans and Russ 2004; Friedlander et
al. 2007), usually via analysis of covariance (ANCOVA) with environmental
variables as covariates, or regression analysis with environmental variables being
a single, or one of many, predictor variables.

Chapter 2 Effects of Substrate Heterogeneity
52
Control-Impact studies are sometimes replicated through time after establishment
of an MPA (e.g., Russ and Alcala 1996; Russ and Alcala 1998a, b; Begg et al. 2005;
Micheli et al. 2005; Tuya et al. 2006). However, the coupling of temporal and
spatial variability (García-Charton and Pérez Ruzafa 1999), suggests that, as with
one-off Control-Impact studies, temporally replicated Control-Impact studies are
still prone to confounding by natural spatial variability between the Control and
Impact sites, independent of the intervention (Osenberg and Schmitt 1996).
BACIPS sampling designs, or sampling designs with some elements of
BACIPS, have been used more recently by some workers to separate the effects of
MPAs from natural temporal and spatial heterogeneity (e.g., Nardi et al. 2004;
Lincoln-Smith et al. 2006; Shears et al. 2006; McClanahan et al. 2007; Samoilys et al.
2007). BACIPS is currently among the most rigorous survey protocols that could
be used to assess MPA effectiveness (Lincoln-Smith et al. 2006; see Osenberg et al.
2006 for a discussion and modification of this design pertinent to MPAs).
However, this type of survey design is often not feasible (e.g., because assessments
are rarely planned and implemented in advance of MPA legislation and/or
enforcement; reviewed in Osenberg et al. 2006).
The approach I have used to assess the effects of MPAs is novel in that it
incorporates an index of resource selectivity (Manly’s alpha) into a Control-Impact
assessment framework, as a weighting factor to account for environmental
variation between sites. Alternately, I also demonstrated the index of Manly’s
alpha can be used to determine ‘preferred’ habitats for an organism, and a
substrate ‘usability index’ can then be used as a covariate in an ANCOVA model.
There are a number of indices used to estimate selection of a resource by an
organism (Manly et al. 2002). Generally, resource selection functions have been
used to look at food and habitat selection (Popham 1944; Neu et al. 1974; Light and
Jones 1997; Dudas et al. 2005; Meyer et al. 2007). In the context of marine reserves,
La Mesa et al. (2006) used a modification of Ivlev’s (1961) electivity index to assess
the preference of cryptobenthic fish fauna in a Mediterranean marine reserve. As

Chapter 2 Effects of Substrate Heterogeneity
53
far as I am aware, no-one has yet used resource selection indices to incorporate
available habitat into assessments of MPA effects. Strong habitat associations are
clear and important features of many reef fish and invertebrate assemblages (e.g.,
Chittaro 2004). When using assessment frameworks that are sensitive to natural
spatial variation in habitat features (e.g., Control-Impact studies covering a broad
suite of species), I suggest that an explicit, quantitative incorporation of habitat
heterogeneity into analyses facilitates a more robust and defensible set of
inferences.
When beneficial effects of MPAs are inferred from Control-Impact studies,
an alternative interpretation is that the observations reflect a pre-existing
difference between an MPA and Control site (e.g., because MPAs may typically be
sited in the ‘best’ available locations within a region; Osenberg et al. 2006). My
inability to sample prior to the Ra’ui being implemented means I was unable to
assess whether available substrate had changed due to protection (with
subsequent indirect effects on faunal abundances). However, when I evaluated a
set of Control-Impact studies while ignoring substrate heterogeneity, ~83% of
MPAs (i.e., 5 of 6 Ra’ui) showed some evidence of being ‘effective’ for C. striatus
(i.e., positive response ratios in Figure 2.5). When I adjusted densities by preferred
substrate availability, only ~33% of MPAs (2 of 6 Ra’ui) showed any evidence of
effectiveness. One interpretation of this pattern is that some Ra’ui on Rarotonga
may be sited in particularly good sites with respect to C. striatus, and my approach
effectively controlled for this underlying variation in substrate availability.
Further, analysis using ANCOVA demonstrated this may be the case for 4 out of 6
of the Ra’ui sites surveyed i.e., substrate availability accounted for variation in fish
densities between sites, not Ra’ui.
I note that my set of Control-Impact studies suggest that C. striatus on
Rarotonga appear to exhibit heterogeneous responses to protection regardless of
my treatment of habitat heterogeneity (Figure 2.5). This may be attributable to
spatial variation in: 1) compliance and/or fishing history associated with each
Chapter 2 Effects of Substrate Heterogeneity
54
MPA (some Ra’ui on Rarotonga are occasionally open to harvest) and the degree
to which C. striatus is harvested, 2) demographic rates of C. striatus (e.g.,
recruitment and/or natural mortality), and/or 3) higher order ecological
interactions (e.g., trophic cascades impinging upon C. striatus that vary among
Ra’ui, depending upon the structure of the local community). Additionally, some
component of my observed responses may still be prone to underlying spatial
variation in environmental features that I did not quantify between each Ra’ui and
its paired Control site, with the unquantified environmental components (e.g.,
habitat complexity, rugosity) ‘swamping’ the quantified substrate-related effects.
CONCLUSIONS
My study empirically demonstrates how environmental heterogeneity can
impinge upon interpretations of MPA assessments. Many reef organisms exhibit
strong habitat preferences, and marked spatial variation in habitat features
characterizes many reefs. Where Control-Impact assessments are subject to bias
(e.g., protected areas are sited in areas of ‘better habitat’ than corresponding
control sites), bias can be reduced using my framework. Hence, I advocate
incorporation of substrate heterogeneity into assessment designs that are
confounded by natural spatial variation (e.g., Control-Impact studies) whenever
more robust assessments (e.g., BACIPS) are not feasible. Further, my framework
may even improve the power of BACIPS assessments, through accounting for
variation attributable to putative substrate differences between sites. My
framework allows quantification of effect sizes between different Ra’ui, and
coupled with an ANCOVA model, some indication of sources of variation.

55
CHAPTER 3: Fish, invertebrate, and functional
group responses to Ra’ui using a
novel assessment framework for
marine protected areas
ABSTRACT
Marine protected areas (MPAs) are generally expected to increase the abundance,
size, diversity and biomass of organisms within their boundaries. However, our
ability to generalise these effects across species and / or locations is limited by
uncertainties associated with existing assessment methodologies. Most MPA
assessments are Control – Impact studies, but an unavoidable limitation of such
studies is uncontrolled variation between the Control site and the Impact site.
Hence, spatial variation in critical habitat features (e.g., abundance or structure)
that shapes distributions of organisms can confound any reserve effect. I chose to
address this problem within the framework of a simple control-impact assessment
framework by weighting densities of censused organisms by ‘preferred substrate’.
Here, I used this novel analytical approach (described in Chapter 2) to explore the
effects of Ra’ui across a broad range of species (fish and invertebrates) and
functional groups found within the lagoon of Rarotonga. I applied meta-
analytical methods to assess whether there was an overall island-wide effect of
Ra’ui for any of the species or functional groups examined and found no overall
Ra’ui effect. However, in quantifing sources of variation in fish, invertebrate, and
functional group densities with a blocked two-factor analysis of covariance, there
was an island-wide effect of Ra’ui for some species. Results indicated that
responses to protection were highly variable for species and functional groups
both within and across Ra’ui. However, some analyses suggest that predator
densities are enhanced in some of the Ra’ui. This Chapter illustrates how

Chapter 3 Fish, Invertebrate, and Functional Group Responses to Ra’ui
56
apparent responses to protection (i.e., MPA effects, as estimated by Control-
Impact studies) can vary even when careful attempts are made to control for
habitat heterogeneity (one source of variation that potentially confounds estimates
of MPA effects).

Chapter 3 Fish, Invertebrate, and Functional Group Responses to Ra’ui
57
INTRODUCTION
Fishing is now one of the main anthropogenic activities affecting life in the oceans
(Edgar et al. 2005). In attempts to mitigate human impacts (primarily fishing) on
marine ecosystems (Roberts and Polunin 1991, 1992, Sumaila et al. 2000, Roberts et
al. 2001), marine protected areas (MPAs) are increasingly being advocated and
implemented around the world. MPAs are an intervention used to modify human
fishing behaviour through restrictions on, or complete exclusions of fishing (see
Agardy et al. 2003 for discussion on the definition of MPAs). MPAs are rapidly
becoming conventional tools for the conservation of biodiversity (Agardy et al.
2003) and the management of fisheries (Boersma and Parrish 1999), with a general
expectation that MPAs will have direct effects that include increased numbers,
size, biomass, and diversity of organisms within their bounds (Roberts and
Polunin 1992, McClanahan 1994, Roberts 1995b, Jennings et al. 1996b, Russ and
Alcala 1996, Wantiez et al. 1997, McClanahan et al. 1999, Tuya et al. 2000,
McClanahan and Arthur 2001, Claudet et al. 2006).
Evidence from several recent reviews of research on MPAs suggests that
no-take MPAs result in greater overall fish density, size, biomass and diversity
relative to reference areas (Roberts and Polunin 1993, Francour et al. 2001, Halpern
and Warner 2002, Russ 2002, Halpern 2003). The abundance and size of larger
carnivores and heavily fished species has been shown to be greater inside
protected areas than in fished areas (Roberts and Polunin 1993, Rowley 1994,
Francour et al. 2001). However, there is also evidence of differential responses to
protection of different trophic groups (Palumbi 2004), community-wide effects of
protection (Roberts and Polunin 1991), and trophic cascades occurring in fished
areas relative to protected areas (Pinnegar et al. 2000, Francour et al. 2001).
Recent meta-analyses of the effects of MPAs have concluded that fish
abundance often varies between MPAs and reference sites. For example,
Mosquera et al. (2000) found the overall abundance of fish inside reserves to be

Chapter 3 Fish, Invertebrate, and Functional Group Responses to Ra’ui
58
significantly (3.7 times) greater than outside; similarly, Côté et al. (2001) noted a
non-significant (25%) increase in overall fish abundance inside versus outside
MPAs. However, in some analyses non-target fish species appear to have similar
abundances in fished and protected areas (Mosquera et al. 2000, Côté et al. 2001),
and in some cases, abundance may be lower inside MPAs. It is clear that putative
effects of MPAs vary (though most studies cannot strongly attribute observed
variation to MPA effects), and some authors have suggested that such variability
may result from higher-order effects that may, for example, include indirect effects
of protection occurring via induced changes in predatory and/or competitive
interactions (Micheli et al. 2005). Nonetheless, many published meta-analyses
concur that (1) abundances of species targeted by fishing often increase inside
reserves relative to reference areas (Mosquera et al. 2000, Côté et al. 2001, Micheli et
al. 2005), and (2) top trophic levels often comprise a greater proportion of total fish
biomass in protected areas (Micheli et al. 2005).
Meta-analyses have been successfully applied to ecological questions
(Hedges et al. 1999, Osenberg et al. 1999). The analytical framework provides an
excellent means of integrating and collectively analysing results from separate
studies (Hedges and Olkin 1985), and the approach has recently been used to
evaluate generalised effects of MPAs (Mosquera et al. 2000, Côté et al. 2001, Micheli
et al. 2004, Ojeda-Martinez et al. 2007). Whereas standard reviews conventionally
use significance values (e.g., p-values) to ‘vote-count’ (Hedges and Olkin 1985),
meta-analysis requires an estimation of ‘effect size’ for each of the separate studies
incorporated in the meta-analysis. The effect size from each individual study is
then subject to further analysis (Osenberg et al.. 1999). The use of effect sizes
provides biologically more meaningful information than that from standard null
hypothesis significance tests which tend to form the basis of most reviews, because
estimates of effect size give information on both the magnitude of the effect, and
the precision of the effect size estimate (Nakagawa and Cuthill 2007). However, to
date, no meta-analyses of the effects of MPAs have incorporated habitat.

Chapter 3 Fish, Invertebrate, and Functional Group Responses to Ra’ui
59
Variability in estimates of MPA effects are not unexpected, as there are many
processes that may act to obscure and/or confound MPA effects. Many ecological
processes (e.g. disturbance, competition, facilitation and predation) can affect
demographic rates (e.g., mortality, growth, maturation and fecundity) to shape
patterns of abundance and community structure of marine organisms (Jones et al.
1991). For example, sampling artefacts and associated difficulties with acquiring
representative samples (Samoilys and Carlos 2000), environmental heterogeneity
(reviewed in García-Charton and Perez Ruzafa 1999), variable recruitment (Russ
and Alcala 1998a), and indirect effects such as trophic interactions (Shears and
Babcock 2002, Dulvy et al. 2004a) can all mask and/or confound MPA effects.
In Chapter 2 I demonstrated how MPA effects can be confounded by
differences in habitat between Ra’ui and Control sites, and developed a novel
approach to address incorporating habitat into the assessment of MPA effects.
Here, I adopt the approach that I developed in Chapter 2 and apply it to a broad
range of species and functional groups. My objectives were to investigate the
effects of Ra’ui across a range of fish and invertebrate species, and fish functional
groups, using the statistical approach that I developed in Chapter 2. This
approach modifies a simple Control-Impact assessment framework, and addresses
some of the limitations that may affect many MPA assessments. Specifically,
while controlling for natural variation in ‘available substrate’, I address the
following questions: (1) Do Ra’ui effects vary among sites and across species and
functional groups? (2) Using meta-analysis, is there an island-wide Ra’ui effect
across species and functional groups? Further, using a blocked two-factor
ANCOVA, I assess whether substrate availability or protection, or a combination
of protection and substrate availability drive any statistical differences in island-
wide densities between Ra’ui and Control sites. Detailed hypotheses are outlined
in Box 3.1.

Chapter 3 Fish, Invertebrate, and Functional Group Responses to Ra’ui
60
Box 3.1 Hypotheses (when statistically controlling for habitat differences)
1. Densities of harvested fish species (for example, Mullidae (goatfish), Naso
species (unicornfish), Scaridae (parrotfish), Siganidae (rabbitfish), and
Serranidae (grouper)) will be greater in Ra’ui than corresponding Control
sites.
2. Densities of harvested invertebrate species such as Echinometridae and
Diadematidae (urchins), Tridacnidae (giant clams), Dendropoma maxima
(wormsnail), Trochus niloticus and Turbo setosus will be greater in Ra’ui than
Control sites.
3. Responses to protection exhibited by invertebrates will be stronger due to
the sedentary / sessile nature of a many invertebrate species relative to
many reef fish.
4. Reef crest invertebrates will exhibit a stronger response than either lagoon
fish or lagoon invertebrates, as reef crest invertebrates are more readily
visible and accessible to fishers, especially at low tide when the reef crest is
exposed.
5. At the functional group level, the density of carnivores (which tend to be
larger, slower growing, often fished, species) will be greater in Ra’ui than
Control sites.
6. Densities of prey species will be lower or the same in Ra’ui relative to
corresponding control sites due to predator-prey interactions arising from
enhanced predator abundances in Ra’ui (see hypothesis 5 above).
7. For each species or functional group, there will be a general Ra’ui effect
across all sites

Chapter 3 Fish, Invertebrate, and Functional Group Responses to Ra’ui
61
MATERIALS AND METHODS
Study System and Sampling Regime
Research was conducted within the shallow lagoon system surrounding the island
of Rarotonga, Cook Islands (21°12´ S, 159°46´ W). A detailed description of the
study system and sampling programme conducted in the lagoon between March
and July 2005 can be found in Chapter 2.
In addition to the lagoon sampling described previously, I surveyed
invertebrates at additional locations on the reef crest (conducted at low tide) for
two pairs of Ra’ui / Control sites. Within each lagoon strata, and at each sampled
reef crest location, five randomly positioned replicate transects (25m x 4m) were
surveyed once within all sites. In total, I surveyed 110 transects throughout the
lagoon and 20 transects on the reef crest.
Data were recorded for all diurnally active fish species (136 species in total)
within the lagoon and 18 invertebrate species on the reef crest and in the lagoon.
Each species was counted and the substrate type upon which each individual was
initially observed was recorded. For each transect, I used fixed-point contact
surveys (collected at 1m intervals in a uniform grid pattern) to estimate percent
cover of substrate types (125 points per transect). Detailed descriptions of the
seven substrate types discriminated and characterised during lagoon surveys can
be found in Chapter 2. Percent cover and substrate use was estimated for only six
substrate types present at the reef crest (i.e., turf algae did not occur in any of the
censused transects and was thus excluded) (Appendix A, Figure 1).
All lagoon sampling was conducted on snorkel in water 0.5 - 3.5m water
deep, between the hours of 9:00 and 16:00 to ensure diurnally active fish species
were sampled (English et al. 1997). Reef crest sampling was conducted at low tide,
on foot, during daylight hours.

Chapter 3 Fish, Invertebrate, and Functional Group Responses to Ra’ui
62
Data analysis
Estimating robust effect sizes for Control-Impact derived data
In Chapter 2, the effects of a collection of MPAs were estimated for one species of
reef fish (Ctenochaetus striatus), and inferences drawn from a standard analytical
approach were evaluated against those of a novel approach (in concert with a
more traditional ANCOVA approach) that attempted to control for the
confounding effects of substrate heterogeneity (see Chapter 2 for details). The
novel approach developed and evaluated in Chapter 2, and also used here,
integrates a standard Control-Impact study design with an index of resource
selectivity (Manly’s alpha). I use Manly’s alpha to re-weight densities obtained
from standard censuses to effectively account for spatial variation in the
availability of each substrate type among sites (Chesson 1983). I then use response
ratios (Hedges et al. 1999) as a metric of effect size for treatments (e.g., intervention
= Ra’ui) effect size, calculated from weighted densities to estimate an effect of
Ra’ui on focal organisms (Chapter 2, see Halpern 2003, Cole et al. 2007, Samoilys et
al. 2007 for further examples of the use of response ratios in ecological studies).
Quantification of Ra’ui Effects Using Log Response Ratios
To evaluate the effect of Ra’ui on densities of individual fish species, invertebrate
species, and fish functional groups, logged response ratios [ln (densityRa’ui /
densitypaired Control)], a common measure of experimental effect (Hedges et al. 1999),
were calculated at each site for substrate-adjusted densities. Log response ratios
greater than zero indicate a positive response to protection; values of zero, or less
than zero, indicate no response, or a negative response, respectively. 95%
bootstrapped confidence intervals were calculated based on Hedges et al. (1999).

Chapter 3 Fish, Invertebrate, and Functional Group Responses to Ra’ui
63
Island-wide assessment of Ra’ui effects
a) Applying a Meta-analysis to Response Ratios
Meta-analytical techniques, which require estimates of effect size (Hedges and
Olkin 1985), were applied to the response ratios on fully protected Ra’ui sites.
Using a random effects model, the average effect size across all sites (the weighted
mean of the log response ratios) (Hedges et al. 1999) was calculated in Microsoft
Excel to assess whether there was an overall Ra’ui effect across sites for any of the
fish and invertebrate species, and functional groups, and whether general
inferences could be made regarding island-wide Ra’ui effects for a species or
functional group. Parametric confidence intervals were calculated based on
Hedges et al. 1999.
Meta-analysis was chosen in conjunction with null hypothesis significance
tests (NHST) because although NHSTs provide a measure of statistical
significance, this is not necessarily correlated with biological significance
(Fernandez-Duque 1997). Meta-analysis provides an estimate of effect size while
methods for combining p-values from NHST do not give any indication of the
magnitude of effects, and NHST ignores small effect sizes (i.e., where often in
ecological studies the sample size is too small to give a ‘statistically significant’
result) (Fernandez-Duque 1997). Meta-analysis enables the combination and
synthesis of individual studies or ‘experiments’ with varying sample sizes
(Fernandez-Duque and Valeggia 1994), and allows a combined estimate of
‘response to Ra’ui’ to be generated across all sites which are weighted depending
on the precision of the estimate. Sites where measurements are more precise
receive greater weight while less precise estimates receive less weight (Shaddish
and Haddock 1994, Hedges et al. 1999).
Variation in effect size (QT) can be partitioned into within-experiment
variation (Qwi), and between-experiment variation (Qb) (see Hedges et al. 1999 for
further detail). Qb is tested by the homogeneity statistic, Q, with the null

Chapter 3 Fish, Invertebrate, and Functional Group Responses to Ra’ui
64
hypothesis that the between-experiment variance (Qb) is zero rejected whenever Q
exceeds the 100(1 - α) percentage point on the chi-squared distribution (Hedges et
al. 1999, Huedo-Medina et al. 2006). That is, if the null-hypothesis of Ra’ui effects
being homogenous is rejected, then the response of Ra’ui is heterogeneous across
sites i.e., Ra’ui effect sizes vary. The meta-analysis used in this study addresses
whether there are consistent responses to Ra’ui across sites, and whether general
inferences of Ra’ui effects are appropriate at the level of either species or
functional groups.
b) Partitioning variation with ANCOVA
Two-factor ANCOVA models using a blocked design (each site’s Ra’ui / Control
pair constitutes a block) were used to quantify the sources of variation in densities
of fish, invertebrates and functional groups (see a above). Square-root
transformed density was the response variable, protection and site were the fixed
factors (the interaction between level of protection and site was also evaluated)
and substrate ‘usability index’ (S), the covariate. A post-hoc power analysis was
carried out using the R statistical platform (R Development Core Team 2006).
However, the blocking factor (“site’) had to be removed from the ANCOVA to
maintain a balanced design for power analysis (as data was gathered from only 5
transects in each Ra’ui / Control pair at Matavera, but from 10 transects in each
Ra’ui / Control pair at the 5 other sites).
How data were constrained for analysis
To investigate responses of individual species to Ra’ui, I constrained my available
data to species that were present at most of the sites across my sampling areas (see
Appendix A, Table 1 for list including common and Cook Islands Māori names)
For fish species, the criteria for inclusion was being present at more than 10 of the
12 sites, for invertebrates being present at greater than 5 of the 12 lagoon sites, and
at more than 3 of the 4 reef crest sites. 21 of the recorded 136 species of fish, 14 of

Chapter 3 Fish, Invertebrate, and Functional Group Responses to Ra’ui
65
the 18 lagoon invertebrate species, and 11 of the 18 reef crest fauna met these
criteria and were retained for analyses.
To examine variation in the responses of functional groups to Ra’ui, each of
the 136 originally censused fish species were assigned to functional groups based
on adult diet (Randall 1965, Froese and Pauly 2008). The assignment of species to
functional groups, and the difficulties therein, have engendered much debate
(Parrish 1989, Jones 1991). I therefore explored two levels of aggregation: broad-
scale (based on Halpern 2003), and fine-scale (based on Floeter et al. 2006). The
broad-scale approach used four categories: carnivores, planktivore/invertebrate
feeders, omnivores, and herbivores. The fine-scale approach functional used eight
categories: piscivores (feed on fish only), carnivores (feed on both fish and
invertebrates), sessile invertebrate feeders (feed on sessile invertebrates),
omnivores (feed on animal and algal material), mobile invertebrate feeders (feed
on mobile invertebrates), planktivores, territorial herbivores, and roving
herbivores.
RESULTS
Responses of individual fish species to Ra’ui
Fish species showed inconsistent responses to Ra’ui; both across species within a
site, and by species across sites (Figure 3.1a). No species appeared to have
consistently greater or lesser abundances inside relative to outside the Ra’ui across
all sites. Responses to Ra’ui differed between sites for all of the 22 species
included in the analysis (Figure 3.1a), and for 14 of the fish species sampled, Ra’ui
did not share a statistically significant common effect size (Table 3.1).
Responses within families varied between species (Figure 3.1a). Of the four
Acanthurids (all roving herbivores) included in the analysis, Ctenochaetus striatus,
had significantly greater abundances in the Akapuao, and Parliament Ra’ui, and
lower abundances in the Tikioki Ra’ui relative to Control sites, while abundances
were similar inside and outside Ra’ui at the other three sites. Abundances of

Chapter 3 Fish, Invertebrate, and Functional Group Responses to Ra’ui
66
Acanthurus triostegus were significantly greater inside Tikioki Ra’ui, and similar
inside and outside Ra’ui at all other sites (Figure 3.1). Abundances of Naso
lituratus were similar inside and outside the Ra’ui across all sites, while Naso
unicornis had higher abundances inside Akapuao and Parliament Ra’ui, but lower
abundances at Matavera Ra’ui (at all other sites confidence intervals overlapped
zero) (Figure 3.1). Labrids and Siganids, had variable responses to Ra’ui, while the
Chaetodontids all had similar abundances inside and outside Ra’ui, except at
Tikioki Ra’ui where Chaetodon citrinellus had significantly lower abundances inside
the Ra’ui than the corresponding Control sites (Figure 3.1). Only one of the two
goatfish species, Parupeneus multifasciatus, had significantly higher abundances
inside Ra’ui, at only one site, Parliament, and significantly lower abundances
inside Ra’ui at Tikioki. The other goatfish species, Mulloidichthys flavolineatus, had
significantly lower abundances at Aroa and Matavera Ra’ui (Figure 3.1). Both
goatfish species had similar abundances inside and outside Ra’ui at all remaining
sites (Figure 3.1). The parrotfish, Chlorurus sordidus, had similar abundances
inside and outside Ra’ui, except at Aroa Ra’ui, where abundance was significantly
lower inside the Ra’ui compared to the corresponding control site (Figure 3.1).
Epinephelus hexagonatus had lower or similar densities within Ra’ui relative to
Control sites, except at Aroa Ra’ui where E. hexagonatus was found inside the Ra’ui
but was absent from the corresponding Control site (Figure 3.1).
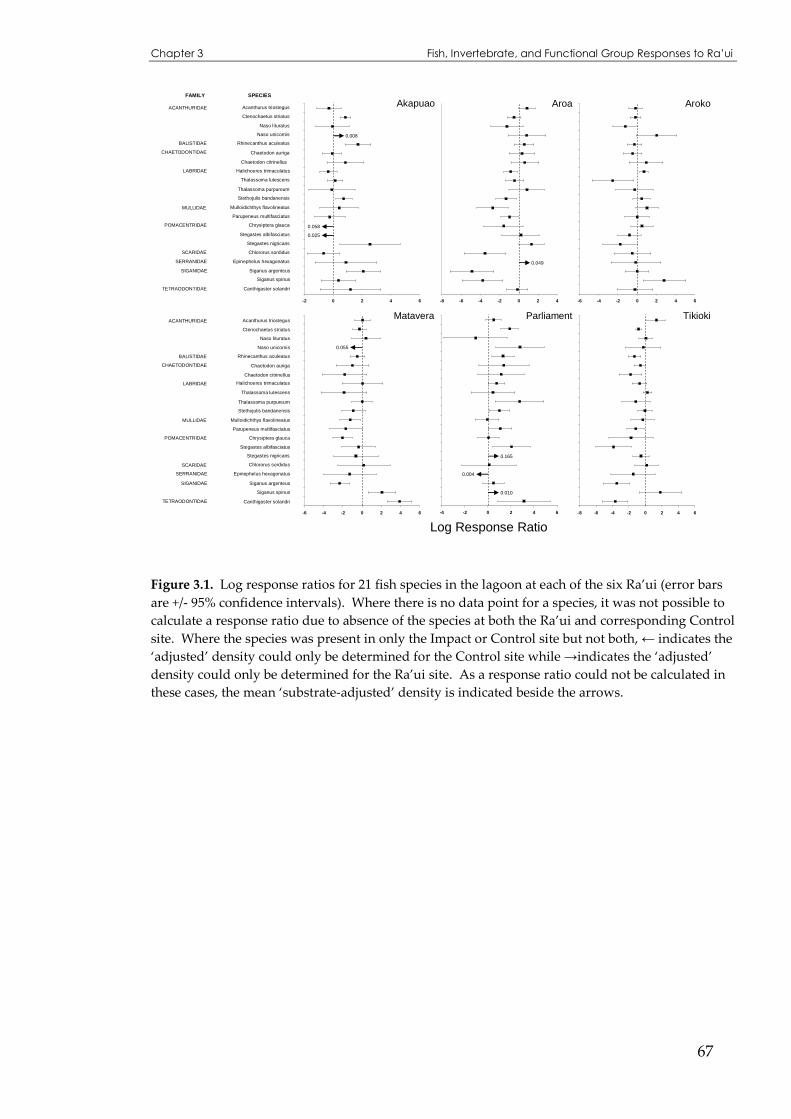
Chapter 3 Fish, Invertebrate, and Functional Group Responses to Ra’ui
67
Figure 3.1. Log response ratios for 21 fish species in the lagoon at each of the six Ra’ui (error bars are +/- 95% confidence intervals). Where there is no data point for a species, it was not possible to calculate a response ratio due to absence of the species at both the Ra’ui and corresponding Control site. Where the species was present in only the Impact or Control site but not both, ← indicates the ‘adjusted’ density could only be determined for the Control site while →indicates the ‘adjusted’ density could only be determined for the Ra’ui site. As a response ratio could not be calculated in these cases, the mean ‘substrate-adjusted’ density is indicated beside the arrows.
FAMILY SPECIES
-4 -2 0 2 4 6
-2 0 2 4 6
0.008
Akapuao Aroa Aroko
Matavera Parliament Tikioki
Acanthurus triostegus
Ctenochaetus striatus
Naso lituratus
Naso unicornis
Rhinecanthus aculeatus
Chaetodon auriga
ACANTHURIDAE
BALISTIDAE
CHAETODONTIDAE
LABRIDAE
Chaetodon citrinellus
Halichoeres trimaculatus
Thalassoma lutescens
Thalassoma purpureum
Stethojulis bandanensis
Mulloidichthys flavolineatus
Parupeneus multifasciatus
Chrysiptera glauca
Stegastes albifasciatus
Stegastes nigricans
Siganus argenteus
Siganus spinus
Chlororus sordidus
Epinephelus hexagonatus
MULLIDAE
Canthigaster solandriTETRAODONTIDAE
POMACENTRIDAE
SCARIDAE
SERRANIDAE
SIGANIDAE
Log Response Ratio
0.058
0.055
0.010
0.004
0.165
0.049
0.025
-8 -6 -4 -2 0 2 4 -6 -4 -2 0 2 4 6
-6 -4 -2 0 2 4 6 -8 -6 -4 -2 0 2 4 6

Chapter 3 Fish, Invertebrate, and Functional Group Responses to Ra’ui
68
Table 3.1. The effect size (weighted mean of the response ratio) with 95% confidence intervals, the ratio of within-site variation (Qwi) to between-site variation (Qb), and the homogeneity statistic (Q) calculated across all Ra’ui for each lagoon fish and invertebrate species. * indicates statistical significance following a chi-square test. If Q is greater than the critical value (Critical value for 5 df and alpha = 0.05 is 11.070), the null hypothesis of no difference in variance between Ra’ui is rejected (i.e., there is significant heterogeneity in response to protection between Ra’ui).
Family Scientific Name Effect Size (95%
CI)
Ratio
(Qb
/Qwi)
Q Heterogenous?
FISH
ACANTHURIDAE Acanthurus triostegus 0.305 (-0.994, 1.605) 0.713 9.032
Ctenochaetus striatus 0.143 (-0.673, 0.959) 5.993 47.343 *
Naso lituratus -0.334 (-3.021, 2.354) 0.08 5.611
Naso unicornis 1.333 (-1.579, 4.245) 1.617 8.280
BALISTIDAE Rhinecanthus aculeatus 0.206 (-0.863, 1.275) 4.996 31.272 *
CHAETODONTIDAE Chaetodon auriga -0.264 (-2.443, 1.914) 0.093 5.827
Chaetodon citrinellus 0.017 (-2.243, 2.276) 1.150 11.769 *
LABRIDAE Halichoeres trimaculatus -0.036 (-1.484, 1.412) 1.052 15.549 *
Thalassoma lutescens -0.183 (-2.582, 2.216) 0.284 9.236
Thalassoma purpureum 0.246 (-2.282, 2.774) 0.626 8.372
Stethojulis bandanensis 0.064 (-1.121, 1.248) 1.886 15.859 *
MULLIDAE Mulloidichthys flavolineatus -0.406 (-2.181, 1.369) 1.706 14.521 *
Parupeneus multifasciatus -0.437 (-2.045, 1.172) 1.463 13.649 *
POMACENTRIDAE Chrysiptera glauca -0.769 (-3.258, 1.721) 1.125 11.644 *
Stegastes albifasciatus -0.477 (-2.786, 1.832) 2.491 16.175 *
Stegastes nigricans 0.154 (-2.252, 2.560) 1.529 11.747 *
SCARIDAE Chlororus sordidus -0.714 (-3.134, 1.705) 0.902 10.569
SERRANIDAE Epinenephelus hexagonatus -0.688 (-3.491, 2.115) 5.102 47.423 *
SIGANIDAE Siganus argenteus -1.236 (-3.245, 0.772) 8.306 59.072 *
Siganus spinus 0.647 (-1.924, 3.219) 3.986 23.257 *
TETRAODONTIDAE Canthigaster solandri 0.663 (-1.640, 2.967) 8.071 54.663 *
INVERTEBRATES
DIADEMATIDAE Diadema savignyi 1.752 (-2.651, 6.154) 5.780 16.042 *
Echinothrix diadema 1.594 (-1.537, 4.726) 2.339 12.217 *
ECHINOMETRIDAE Echinometra mathaei -0.368 (-1.495, 0.759) 3.932 30.184 *
Echinometra oblonga -1.416 (-5.054, 2.223) 0.948 4.761
HOLOTHURIIDAE Actinopyga mauritiana 1.754 (-2.287, 5.795) 4.534 5.534
Holothuria atra -0.102 (-1.553, 1.349) 3.807 30.601 *
Holothuria cinerascens 1.941 (-2.051, 5.933) 0.939 3.873
Holothuria leucospilota -0.536 (-2.422, 1.350) 10.397 89.587 *
OPHIDIASTERIDAE Linckia laevigata 0.492 (-4.604, 5.588) -0.218 1.243
STICHOPODIDAE Stichopus chloronotus 0.222 (-2.015, 2.459) 1.824 15.896 *
TOXOPNEUSTIDAE Tripneustes gratilla 0.677 (-3.111, 4.465) 0.086 3.335
TRIDACNIDAE Tridacna spp. 0.315 (-1.556, 2.187) 3.501 27.002 *
TROCHIDAE Trochus niloticus 1.364 (-0.828, 3.557) 2.003 9.367
VERMETIDAE Dendropoma maxima 0.963 (-1.659, 3.585) 1.631 12.322 *

Chapter 3 Fish, Invertebrate, and Functional Group Responses to Ra’ui
69
Responses of individual invertebrate species to Ra’ui
Lagoon invertebrates exhibited inconsistent responses to Ra’ui, both within Ra’ui
(i.e., all species did not share the same response to protection within a Ra’ui), and
across Ra’ui (i.e., across all Ra’ui, a single species did not have a consistent
response to protection) (Figure 3.2). Ra’ui did not share a statistically significant
common effect size for around 60% of the invertebrate species sampled (Table 3.1).
The Diadematid urchins, Diadema savignyi and Echinothrix diadema, both had
significantly greater abundances inside Aroa Ra’ui but significantly lower
abundances at Aroko Ra’ui relative to Control sites (Figure 3.2). Giant clam
species (Tridacna spp.) had significantly greater abundances in the Akapuao, Aroa
and Parliament Ra’ui than at corresponding Control sites (Figure 3.2).
Abundances of Trochus niloticus were similar at all Ra’ui relative to Control sites,
except at Aroko Ra’ui where T. niloticus occurred in the Ra’ui but not at the control
site (Figure 3.2). The vermetid snail, Dendropoma maxima, was significantly more
abundant inside the Aroa Ra’ui relative to the Control site with abundances at all
other sites were similar in Ra’ui and Controls, except for Aroko and Parliament
Ra’ui, where D. maxima did not occur at the corresponding Control sites (Figure
3.2).
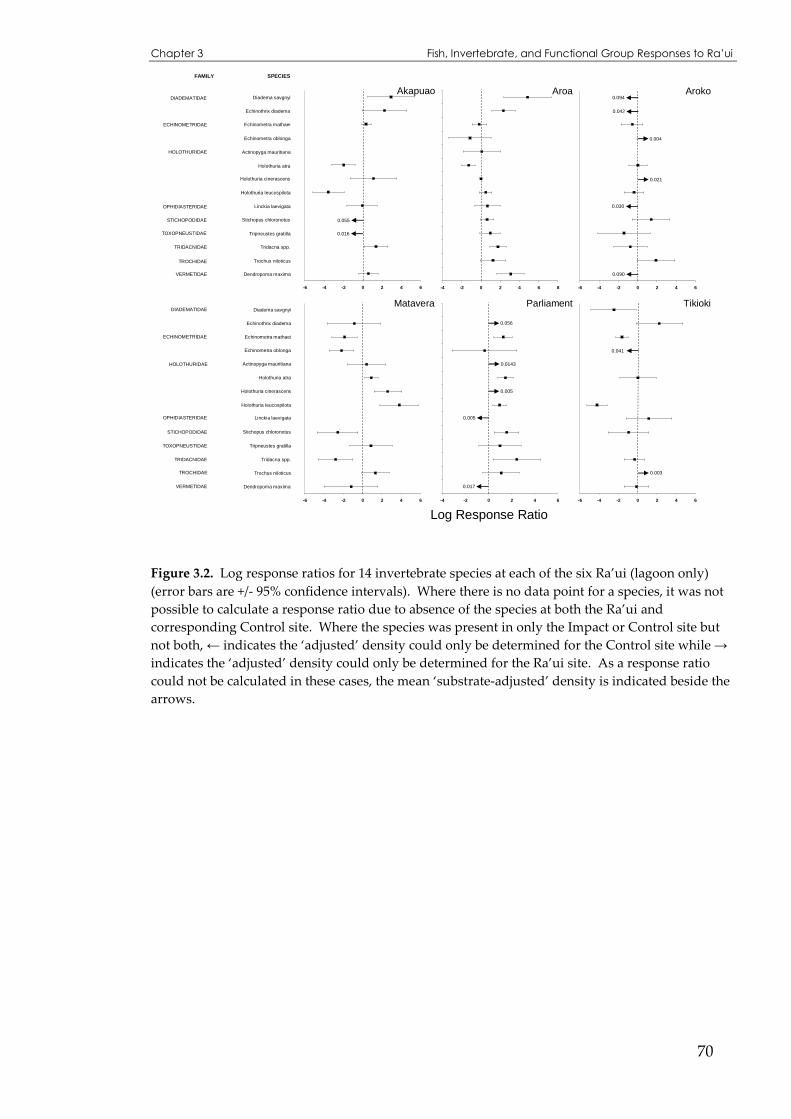
Chapter 3 Fish, Invertebrate, and Functional Group Responses to Ra’ui
70
Figure 3.2. Log response ratios for 14 invertebrate species at each of the six Ra’ui (lagoon only) (error bars are +/- 95% confidence intervals). Where there is no data point for a species, it was not possible to calculate a response ratio due to absence of the species at both the Ra’ui and corresponding Control site. Where the species was present in only the Impact or Control site but not both, ← indicates the ‘adjusted’ density could only be determined for the Control site while → indicates the ‘adjusted’ density could only be determined for the Ra’ui site. As a response ratio could not be calculated in these cases, the mean ‘substrate-adjusted’ density is indicated beside the arrows.
FAMILY SPECIES
-6 -4 -2 0 2 4 6-4 -2 0 2 4 6
-6 -4 -2 0 2 4 6
0.041
Akapuao Aroa Aroko
Matavera Parliament Tikioki
Log Response Ratio
Diadema savgnyiDIADEMATIDAE
ECHINOMETRIDAE
HOLOTHURIDAE
OPHIDIASTERIDAE
VERMETIDAE
STICHOPODIDAE
TOXOPNEUSTIDAE
TRIDACNIDAE
TROCHIDAE
Echinothrix diadema
Echinometra mathaei
Echinometra oblonga
Actinopyga mauritiana
Holothuria atra
Holothuria cinerascens
Holothuria leucospilota
Linckia laevigata
Stichopus chloronotus
Tripneustes gratilla
Tridacna spp.
Trochus niloticus
Dendropoma maxima
0.094
0.042
0.004
0.055
0.016
0.030
0.021
0.090
Diadema savgnyiDIADEMATIDAE
ECHINOMETRIDAE
HOLOTHURIDAE
OPHIDIASTERIDAE
VERMETIDAE
STICHOPODIDAE
TOXOPNEUSTIDAE
TRIDACNIDAE
TROCHIDAE
Echinothrix diadema
Echinometra mathaei
Echinometra oblonga
Actinopyga mauritiana
Holothuria atra
Holothuria cinerascens
Holothuria leucospilota
Linckia laevigata
Stichopus chloronotus
Tripneustes gratilla
Tridacna spp.
Trochus niloticus
Dendropoma maxima 0.017
0.056
0.005
0.0143
0.005
0.003
-6 -4 -2 0 2 4 6 -4 -2 0 2 4 6 8
-6 -4 -2 0 2 4 6

Chapter 3 Fish, Invertebrate, and Functional Group Responses to Ra’ui
71
Matavera Parliament
Logged Response Ratio
0.023
0.387
Echionthrix diademaDIADEMATIDAE
ECHINOMETRIDAE Echinometra mathaei
Heterocentrotus mamillatus
Actinopyga mauritiana
Dendropoma maxima
Turbo setosus
Trochus niloticus
Holothuria leucospilota
Holothuria cinerascens
Holothuria atra
Echinometra oblonga
HOLOTHURIDAE
TROCHIDAE
TURBINIDAE
VERMETIDAE 0.024
-4 -2 0 2 4 6 -4 -2 0 2
Matavera Parliament
Log Response Ratio
0.023
0.387
Echionthrix diademaDIADEMATIDAE
ECHINOMETRIDAE Echinometra mathaei
Heterocentrotus mamillatus
Actinopyga mauritiana
Dendropoma maxima
Turbo setosus
Trochus niloticus
Holothuria leucospilota
Holothuria cinerascens
Holothuria atra
Echinometra oblonga
HOLOTHURIDAE
TROCHIDAE
TURBINIDAE
VERMETIDAE 0.024
-4 -2 0 2 4 6 -4 -2 0 2
Invertebrates at the two reef crest sites also demonstrated variable responses to
Ra’ui (Figure 3.3). Holothuria cinerascens and Trochus niloticus had greater
abundances inside relative to outside at both Ra’ui, while Echinothrix diadema, and
Actinopyga mauritiana had consistently similar abundances inside and outside
Ra’ui across all sites (Figure 3.3). Urchins at Matavera Ra’ui tended to have the
opposite response to those in the Parliament Ra’ui, with urchins generally more
abundant in the Matavera Ra’ui and less abundant in the Parliament Ra’ui relative
to Control sites (Figure 3.3). Turbo setosus abundances were similar inside and
outside the Matavera Ra’ui, with none present inside the Parliament Ra’ui, only
outside. Dendropoma maxima only occurred inside the Matavera Ra’ui, with none
occurring outside.
Figure 3.3. Log response ratios for 11 invertebrate species at two Ra’ui (reef crest only) (error bars are +/- 95% confidence intervals). Where there is no data point for a species, it was not possible to calculate a response ratio due to absence of the species at both the Ra’ui and corresponding Control site. Where the species was present in only the Impact or Control site but not both, ← indicates the ‘adjusted’ density could only be determined for the Control site while → indicates the ‘adjusted’ density could only be determined for the Ra’ui site. As a response ratio could not be calculated in these cases, the mean ‘substrate-adjusted’ density is indicated beside the arrows.
FAMILY SPECIES

Chapter 3 Fish, Invertebrate, and Functional Group Responses to Ra’ui
72
0%
10%
20%
30%
40%
50%
60%
70%
80%
90%
100%
Fish Inverts Fish Inverts Fish Inverts Fish Inverts Fis h Inverts Fish Inverts
Akapuao Aroa Aroko Matavera Parliament Tikioki
21 11 21 13 21 13 21 12 21 13 21 11
Effects of Ra’ui on lagoon species by site
More lagoon invertebrates had higher abundances inside Ra’ui relative to Control
sites, than fish (Figure 3.4). On average, 15% of fish species, and 20% of the
invertebrate species had significantly higher (95% confidence interval did not
overlap zero) abundances inside Ra’ui than corresponding Control sites (Figure
3.4). Abundances for 43% of the fish and 38% of the invertebrates were
significantly higher inside the Parliament Ra’ui relative to Control sites. At
Akapuao Ra’ui, 24% of the fish had higher abundances inside than outside the
Ra’ui. Of all Ra’ui, Aroa, Aroko, Tikioki and Matavera had the lowest percentage
of fish species (< 10%), and Aroko, and Tikioki had the lowest percentage of
invertebrate species (0%) with lower abundances inside the Ra’ui than the
corresponding Control (Figure 3.4).
Figure 3.4. The percentage of fish and invertebrate species having significantly greater ( ), lesser ( ), and statistically indistinguishable ( ) abundances inside Ra’ui relative to corresponding Control sites at six sites (lagoon only). Where fish or invertebrates were present inside the Ra’ui but not outside, and vice-versa (see Figures 3.2, 3.3 & 3.4), a non-parametric Mann-Whitney U test assessed whether these Ra’ui and Control abundances were significantly different. The total number of species per site is represented by ‘n’ at the top of each bar.
Chapter 3 Fish, Invertebrate, and Functional Group Responses to Ra’ui
73
Fine-scale and broad-scale fish functional group responses
At the fine-scale level of categorisation, no functional groups had consistently
higher or lower abundances inside Ra’ui relative to Control sites, with
heterogeneous effect sizes across Ra’ui (Figure 3.5). Carnivores had higher
abundances inside Ra’ui than at Control sites at only one site, Parliament, while
Piscivores had higher abundances inside Ra’ui than at Control sites over the
greatest number of sites (3 sites) (Figure 3.5). Planktivores, territorial herbivores,
and sessile invertebrate feeders generally had similar abundances inside Ra’ui and
Control sites (4, 4, and 5 sites respectively), while the response of both omnivores
and roving herbivores responses were split, displaying higher (omnivores at
Parliament; roving herbivores at Akapuao and Aroko), similar (omnivores at
Akapuao, Aroko and Aroa, roving herbivores at Aroko, Parliament and Tikioki),
and lower (omnivores at Tikioki and Matavera, roving herbivores at Aroa and
Matavera) abundances within Ra’ui compared to Control sites (Figure 3.5). Five
out of the eight fine-scale functional groups had a statistically significant
heterogeneous responses to Ra’ui (Table 3.2).

Chapter 3 Fish, Invertebrate, and Functional Group Responses to Ra’ui
74
-2 -1 0 1 2 3
Akapuao Aroa Aroko
Matavera Parliament Tikioki
CARNIVORES
Logged Response Ratio
ROVING HERBIVORES
OMNIVORES
MOBILE INVERTEBRATE FEEDERS
-3 -2 -1 0 1 2 3 4 -3 -2 -1 0 1 2 3
PISCIVORES
PLANKTIVORES
SESSILE INVERTEBRATE FEEDERS
TERRITORIAL HERBIVORES
-3 -2 -1 0 1 -3 -2 -1 0 1 2 3 4 -4 -2 0 2 4 6
CARNIVORES
ROVING HERBIVORES
OMNIVORES
MOBILE INVERTEBRATE FEEDERS
PISCIVORES
PLANKTIVORES
SESSILE INVERTEBRATE FEEDERS
TERRITORIAL HERBIVORES
0.015
0.040
0.032
0.289
0.063
-2 -1 0 1 2 3
Akapuao Aroa Aroko
Matavera Parliament Tikioki
CARNIVORES
Log Response Ratio
ROVING HERBIVORES
OMNIVORES
MOBILE INVERTEBRATE FEEDERS
-3 -2 -1 0 1 2 3 4 -3 -2 -1 0 1 2 3
PISCIVORES
PLANKTIVORES
SESSILE INVERTEBRATE FEEDERS
TERRITORIAL HERBIVORES
-3 -2 -1 0 1 -3 -2 -1 0 1 2 3 4 -4 -2 0 2 4 6
CARNIVORES
ROVING HERBIVORES
OMNIVORES
MOBILE INVERTEBRATE FEEDERS
PISCIVORES
PLANKTIVORES
SESSILE INVERTEBRATE FEEDERS
TERRITORIAL HERBIVORES
0.015
0.040
0.032
0.289
0.063
-3 -2 -1 0 1 2 3
Akapuao Aroa Aroko
Matavera Parliament Tikioki
CARNIVORES
Log Response Ratio
ROVING HERBIVORES
OMNIVORES
MOBILE INVERTEBRATE FEEDERS
PISCIVORES
PLANKTIVORES
SESSILE INVERTEBRATE FEEDERS
TERRITORIAL HERBIVORES
CARNIVORES
ROVING HERBIVORES
OMNIVORES
MOBILE INVERTEBRATE FEEDERS
PISCIVORES
PLANKTIVORES
SESSILE INVERTEBRATE FEEDERS
TERRITORIAL HERBIVORES
0.015
0.040
0.032
0.289
0.063
-3 -2 -1 0 1 2 3 4 -3 -2 -1 0 1 2 3
-3 -2 -1 0 1 -4 -3 -2 -1 0 1 2 3 4 -4 -2 0 2 4 6
Figure 3.5. Log response ratios of eight fine-scale fish functional groups at each of the six Ra’ui (error bars are +/- 95% confidence intervals). Where there is no data point for a functional group, it was not possible to calculate a response ratio due to absence of the functional group at both the Ra’ui and corresponding Control site. Where the functional group was present in only the Impact or Control site but not both, ← indicates the ‘adjusted’ density could only be determined for the Control site while → indicates the ‘adjusted’ density could only be determined for the Ra’ui site. As a response ratio could not be calculated in these cases, the mean ‘substrate-adjusted’ density is indicated beside the arrows.
FINE-SCALE FUNCTIONAL GROUP

Chapter 3 Fish, Invertebrate, and Functional Group Responses to Ra’ui
75
Table 3.2. Ratio of within-site variation (Qwi) to between-site variation (Qb), and the homogeneity statistic (Q) calculated across all Ra’ui for each broad- and fine-scale fish functional group. * indicates statistical significance following a chi-square test. If Q is greater than the critical value (Critical value for 5 df and alpha = 0.05 is 11.070), then reject H0 that there is no difference in variance (variance is homogenous) between Ra’ui i.e., there is significant heterogeneity in response to protection between Ra’ui.
Broad-scale functional group responses were similar to fine-scale functional group
responses, with no consistently higher or lower abundances inside relative to
outside Ra’ui (Figure 3.6). Carnivores had significantly higher abundances
(confidence intervals did not span zero) inside Ra’ui at the greatest number of sites
(two sites), while carnivores and planktivores had similar abundances inside and
outside Ra’ui at four sites each (Figure 3.6). The responses of herbivores were split
across Ra’ui between higher (Akapuao), equal (Aroko, Parliament, and Tikioki)
and lower (Aroa and Matavera) abundances inside Ra’ui relative to Control sites.
All broad-scale functional groups had a statistically significant heterogeneous
response to Ra’ui (Table 3.2).
Functional Group Effect Size (95% CI) Ratio
(Qb / Qwi) Q Heterogenous?
FINE-SCALE Carnivores 0.331 (-0.679, 1.341) 2.314 17.303 * Piscivores 0.415 (-3.244, 4.074) 0.390 4.217 Planktivores 0.637 (-3.129, 4.404) 0.130 3.540 Mobile Invertebrate Feeders -0.051 (-1.113, 1.011) 1.896 16.633 * Sessile Invertebrate Feeders -0.591 (-7.266, 6.084) -0.540 1.594 Omnivores -0.173 (-0.976, 0.630) 5.178 40.329 * Roving Herbivores -0.108 (-1.035, 0.818) 4.172 28.732 * Territorial Herbivores 0.134 (-1.248, 1.516) 2.360 20.845 * BROAD-SCALE Carnivores 0.335 (-0.702, 1.373) 1.693 14.095 * Planktivores / Invertebrate feeders -0.010 (-1.028, 1.008) 1.999 17.377 * Omnivores -0.177 (-0.997, 0.643) 7.332 43.968 * Herbivores -0.093 (-0.969, 0.784) 4.467 28.748 *

Chapter 3 Fish, Invertebrate, and Functional Group Responses to Ra’ui
76
Figure 3.6. Log response ratios of four broad-scale fish functional groups at each of the six Ra’ui (error bars are +/- 95% confidence intervals). Where there is no data point for a functional group, it was not possible to calculate a response ratio due to absence of the functional group at both the Ra’ui and corresponding Control site. Where the functional group was present in only the Ra’ui or Control site but not both, ← indicates the ‘adjusted’ density could only be determined for the Control site while → indicates the ‘adjusted’ density could only be determined for the Ra’ui site. As a response ratio could not be calculated in these cases, the mean ‘substrate-adjusted’ density is indicated beside the arrows.
Meta-analyses of fish, invertebrates, and functional group responses to Ra’ui
Meta-analysis assessed whether there was an overall Ra’ui effect for each
individual fish, invertebrate species, and functional group across all sites
combined. Island-wide, neither fish, invertebrates, nor functional groups
exhibited overall increased or decreased abundances inside relative to outside
Ra’ui.
BROAD-SCALE FUNCTIONAL GROUP
Akapuao Aroa Aroko
Matavera Parliament Tikioki
CARNIVORES
Log Response Ratio
PLANKTIVORES /INVERTEBRATE FEEDERS
OMNIVORES
HERBIVORES
PLANKTIVORES /INVERTEBRATE FEEDERS
CARNIVORES
HERBIVORES
OMNIVORES
-2 -1 0 1 2 -2 -1 0 1 -1 0 1 2
-3 -2 -1 0 1 -1 0 1 2 3 -2 -1 0 1 2

Chapter 3 Fish, Invertebrate, and Functional Group Responses to Ra’ui
77
-6 -4 -2 0 2 4 6
1
2
3
4
5
6
7
8
9
10
11
12
13
14
Acanthurus triostegus
Ctenochaetus striatus
Naso lituratus
Naso unicornis
Rhinecanthus aculeatus
Chaetodon auriga
ACANTHURIDAE
BALISTIDAE
CHAETODONTIDAE
LABRIDAE
Chaetodon citrinellus
Halichoeres trimaculatus
Thalassoma lutescens
Thalassoma purpureum
Stethojulis bandanensis
Mulloidichthys flavolineatus
Parupeneus multifasciatus
Chrysiptera glauca
Stegastes albifasciatus
Stegastes nigricans
Siganus argenteus
Siganus spinus
Chlororus sordidus
Epinephelus hexagonatus
MULLIDAE
Canthigaster solandriTETRAODONTIDAE
POMACENTRIDAE
SCARIDAE
SERRANIDAE
SIGANIDAE
Weighted Mean of Log Response Ratio
-4 -3 -2 -1 0 1 2 3 4 5
1
2
3
4
5
6
7
8
9
10
11
12
13
14
15
16
17
18
19
20
21
Diadema savgnyiDIADEMATIDAE
ECHINOMETRIDAE
HOLOTHURIDAE
OPHIDIASTERIDAE
VERMETIDAE
STICHOPODIDAE
TOXOPNEUSTIDAE
TRIDACNIDAE
TROCHIDAE
Echinothrix diadema
Echinometra mathaei
Echinometra oblonga
Actinopyga mauritiana
Holothuria atra
Holothuria cinerascens
Holothuria leucospilota
Linckia laevigata
Stichopus chloronotus
Tripneustes gratilla
Tridacna spp.
Trochus niloticus
Dendropoma maxima
Echionthrix diademaDIADEMATIDAE
ECHINOMETRIDAE Echinometra mathaei
Heterocentrotus mamillatus
Actinopyga mauritiana
Dendropoma maxima
Turbo setosus
Trochus niloticus
Holothuria leucospilota
Holothuria cinerascens
Holothuria atra
Echinometra oblonga
HOLOTHURIDAE
TROCHIDAE
TURBINIDAE
VERMETIDAE
-7 -6 -5 -4 -3 -2 -1 0 1 2 3 4 5
1
2
3
4
5
6
7
8
9
10
11
-8 -6 -4 -2 0 2 4 6
1
2
3
4
5
6
7
8
9
10
11
12
Carnivores
Planktivores/ invertebrate feeders
Omnivores
Herbivores
Carnivores
Roving herbivores
Omnivores
Mobile invertebrate feeders
Piscivores
Planktivores
Sessile invertebrate feeders
Territorial herbivores
FINE-SCALE FISHFUNCTIONAL GROUPS
BROAD-SCALE FISHFUNCTIONAL GROUPS
FAMILY
FAMILY FAMILY SPECIES
SPECIES
SPECIES
A B
DC
Figure 3.7. Meta-analysis of response ratios showing weighted mean of log response ratios for lagoon fish (A) and invertebrates (B), reef crest invertebrate species (C), and, fine-scale and broad-scale functional fish groups (D) across all Ra’ui (“Island-wide”). Error bars are +/- 95% confidence intervals. Note: a weighted mean could not be calculated where reef crest invertebrate species (C) only occurred at one of the two reef crest sites.
Direct test of an overall Ra’ui effect
Fish
Contrary to the meta-analyses above, blocked two factor ANCOVA models, with
level of protection and site as fixed factors, and ‘usable substrate’ as covariate,
indicated that protection determined a significant amount of variation in densities
for 6 (Rhinecanthus aculeatus, Parupeneus multifasciatus, Chrysiptera glauca, Stegastes
nigricans, Chlorurus sordidus, and Siganus spinus) of the 21 fish species throughout
the lagoon (Table 3.3). However, for 4 (R. aculeatus, C. glauca, C. sordidus, and S.
spinus) of the 6 species, there was also a significant interaction between the level of
protection (i.e., Ra’ui versus Control) and site (Table 3.3). There were only 5 fish
Chapter 3 Fish, Invertebrate, and Functional Group Responses to Ra’ui
78
species (Naso unicornis, Stethojulis bandanensis, Parupeneus multifasciatus, Stegastes
nigricans, and Epinephelus hexagonatus) where site did not determine a significant
amount of variation in densities throughout the lagoon (Table 3.3). Again, for 12
of the 16 species where site was significant in determining variation in fish
densities, there was also a significant interaction between the level of protection
and site (Table 3.3). Substrate was significant in determining variation in densities
for 10 of the 21 fish species in the lagoon (Table 3.3). Level of protection alone
determined a significant amount of variation in densities of the goatfish,
Parupeneus multifasciatus, in the lagoon around Rarotonga, while level of
protection and substrate accounted for significant variation in densities of the
dusky gregory, Stegastes nigricans.
Power was adequate for detecting an effect of protection for 19 of the 21 fish
species (i.e., power (1-β) ≥ 0.8), except for two species, the unicornfish, Naso
unicornis, and the goatfish, Parupeneus multifasciatus (Table 3.3). Power for N.
unicornis was low, indicating that although no significant effect of protection was
observed, with increased sampling, there may be a detectable effect (Table 3.3).
Alternately, power was also low for P. multifasciatus, but there was a significant
effect of protection for this species.

Chapter 3 Fish, Invertebrate, and Functional Group Responses to Ra’ui
79
Table 3.3. Two-factor analysis of covariance (factors = protection, and site) evaluating densities of lagoon fish species across all Ra’ui and Control sites, with index of ‘usable substrate’ (Substrate) as covariate. A post-hoc power analysis to detect an effect of protection is included where * denotes power value is ≥ 0.995
Scientific Name Treatment df MS F-ratio p Power (1-β)
Acanthurus triostegus Full model 12 0.118 4.269 p<0.001 *
Protection 1 0.086 3.101 0.081 Site 5 0.083 2.980 0.015 Substrate 1 0.359 12.925 0.001 Protection X Site 5 0.031 1.109 0.361 Error 97 0.028
Ctenochaetus striatus Full model 12 0.208 11.139 p<0.001 *
Protection 1 0.037 1.985 0.162 Site 5 0.195 10.465 p<0.001 Substrate 1 0.935 50.053 p<0.001 Protection X Site 5 0.065 3.489 0.006 Error 97 0.019
Naso lituratus Full model 12 0.012 3.147 0.001 0.143 Protection 1 0.000 0.014 0.905 Site 5 0.020 5.149 p<0.001 Substrate 1 0.003 0.703 0.404 Protection X Site 5 0.007 1.891 0.103 Error 97 0.004
Naso unicornis Full model 12 0.008 1.442 0.160 * Protection 1 0.011 2.063 0.154 Site 5 0.009 1.626 0.160 Substrate 1 0.005 1.020 0.315 Protection X Site 5 0.006 1.119 0.355 Error 97 0.005
Rhinecanthus aculeatus Full model 12 0.029 5.490 p<0.001 * Protection 1 0.037 6.900 0.010 Site 5 0.037 7.070 p<0.001 Substrate 1 0.004 0.671 0.415 Protection X Site 5 0.014 2.595 0.030 Error 97 0.005
Chaetodon auriga Full model 12 0.014 2.373 0.010 * Protection 1 0.003 0.518 0.473 Site 5 0.027 4.792 0.001 Substrate 1 0.003 0.577 0.449 Protection X Site 5 0.003 0.557 0.733 Error 97 0.006
Chaetodon citrinellus Full model 12 0.005 1.503 0.136 * Protection 1 0.001 0.438 0.510 Site 5 0.009 2.802 0.021 Substrate 1 0.001 0.285 0.594 Protection X Site 5 0.003 0.794 0.556 Error 97 0.003
Halichoeres trimaculatus Full model 12 0.098 11.425 p<0.001 * Protection 1 0.005 0.609 0.437 Site 5 0.086 10.028 p<0.001 Substrate 1 0.381 44.412 p<0.001 Protection X Site 5 0.030 3.502 0.006 Error 97 0.009

Chapter 3 Fish, Invertebrate, and Functional Group Responses to Ra’ui
80
Table 3.3 continued. Two-factor analysis of covariance (factors = protection, and site) evaluating densities of lagoon fish species across all Ra’ui and Control sites, with index of ‘usable substrate’ (Substrate) as covariate. A post-hoc power analysis to detect an effect of protection is included where * denotes power value is ≥ 0.995
Scientific Name Treatment df MS F-ratio p Power (1-β)
Thalassoma lutescens Full model 12 0.067 14.048 p<0.001 * Protection 1 0.011 2.419 0.123 Site 5 0.131 27.596 p<0.001 Substrate 1 0.014 2.980 0.087 Protection X Site 5 0.023 4.934 p<0.001 Error 97 0.005
Thalassoma purpureum Full model 12 0.036 11.310 p<0.001 * Protection 1 0.012 3.655 0.059 Site 5 0.039 12.277 p<0.001 Substrate 1 0.059 18.439 p<0.001 Protection X Site 5 0.009 2.936 0.016 Error 97 0.003
Stethojulis bandanensis Full model 12 0.019 4.242 p<0.001 * Protection 1 0.000 0.009 0.924 Site 5 0.005 1.214 0.309 Substrate 1 0.106 23.556 p<0.001 Protection X Site 5 0.010 2.288 0.052 Error 97 0.005
Mulloidichthys flavolineatus Full model 12 0.136 3.674 p<0.001 * Protection 1 0.000 0.012 0.915 Site 5 0.149 4.044 0.002 Substrate 1 0.262 7.080 0.009 Protection X Site 5 0.099 2.686 0.026 Error 97 0.037
Parupeneus multifasciatus Full model 12 0.009 1.122 0.352 0.115 Protection 1 0.043 5.136 0.026 Site 5 0.003 0.372 0.867 Substrate 1 0.007 0.878 0.351 Protection X Site 5 0.013 1.543 0.184 Error 97 0.008
Chrysiptera glauca Full model 12 0.093 10.508 p<0.001 * Protection 1 0.039 4.438 0.038 Site 5 0.058 6.497 p<0.001 Substrate 1 0.453 51.106 p<0.001 Protection X Site 5 0.028 3.199 0.010 Error 97 0.009
Stegastes albifasciatus Full model 12 0.078 7.020 p<0.001 0.919 Protection 1 0.002 0.155 0.694 Site 5 0.089 8.020 p<0.001 Substrate 1 0.309 27.889 p<0.001 Protection X Site 5 0.056 5.073 p<0.001 Error 97 0.011
Stegastes nigricans Full model 12 0.037 3.855 p<0.001 * Protection 1 0.055 5.791 0.018 Site 5 0.014 1.434 0.219 Substrate 1 0.108 11.371 0.001 Protection X Site 5 0.010 1.055 0.390 Error 97 0.010
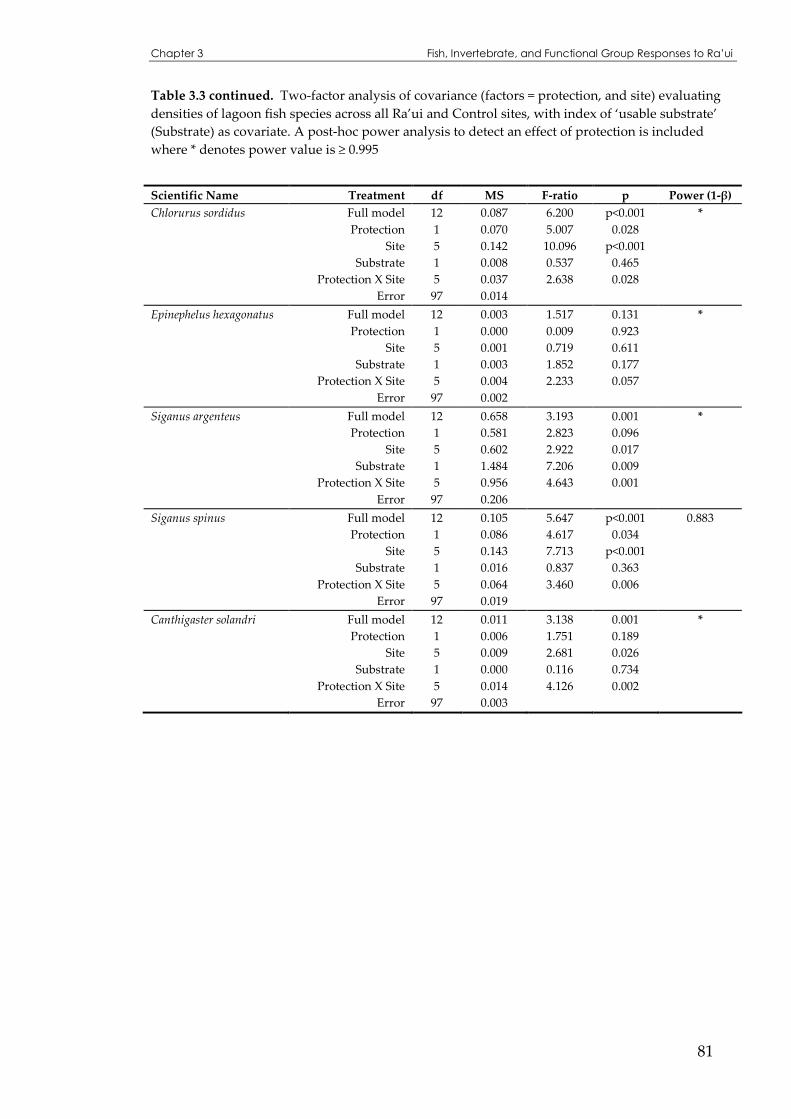
Chapter 3 Fish, Invertebrate, and Functional Group Responses to Ra’ui
81
Table 3.3 continued. Two-factor analysis of covariance (factors = protection, and site) evaluating densities of lagoon fish species across all Ra’ui and Control sites, with index of ‘usable substrate’ (Substrate) as covariate. A post-hoc power analysis to detect an effect of protection is included where * denotes power value is ≥ 0.995
Scientific Name Treatment df MS F-ratio p Power (1-β)
Chlorurus sordidus Full model 12 0.087 6.200 p<0.001 * Protection 1 0.070 5.007 0.028 Site 5 0.142 10.096 p<0.001 Substrate 1 0.008 0.537 0.465 Protection X Site 5 0.037 2.638 0.028 Error 97 0.014
Epinephelus hexagonatus Full model 12 0.003 1.517 0.131 * Protection 1 0.000 0.009 0.923 Site 5 0.001 0.719 0.611 Substrate 1 0.003 1.852 0.177 Protection X Site 5 0.004 2.233 0.057 Error 97 0.002
Siganus argenteus Full model 12 0.658 3.193 0.001 * Protection 1 0.581 2.823 0.096 Site 5 0.602 2.922 0.017 Substrate 1 1.484 7.206 0.009 Protection X Site 5 0.956 4.643 0.001 Error 97 0.206
Siganus spinus Full model 12 0.105 5.647 p<0.001 0.883 Protection 1 0.086 4.617 0.034 Site 5 0.143 7.713 p<0.001 Substrate 1 0.016 0.837 0.363 Protection X Site 5 0.064 3.460 0.006 Error 97 0.019
Canthigaster solandri Full model 12 0.011 3.138 0.001 * Protection 1 0.006 1.751 0.189 Site 5 0.009 2.681 0.026 Substrate 1 0.000 0.116 0.734 Protection X Site 5 0.014 4.126 0.002 Error 97 0.003

Chapter 3 Fish, Invertebrate, and Functional Group Responses to Ra’ui
82
Lagoon Invertebrates
Level of protection was significant in determining variation in densities for 5
(Echinothrix diadema, Echinometra mathaei, Actinopyga mauritiana, Holothuria
cinerascens, and Trochus niloticus) of the 14 lagoon invertebrate species with a
significant interaction between level of protection and site for 4 of the 5 species
(excluding E. diadema). Site accounted for variation in 13 of the 14 invertebrate
species (excluding Linckia laevigata), again with a significant interaction between
level of protection and site for 10 of the 13 invertebrate species (Table 3.4).
Substrate accounted for significant variation in densities for 9 of the 14
invertebrate species (Table 3.4).
Power to detect an effect of protection was low for two of the 14 lagoon
invertebrate species (Table 3.4). The urchins, Echinometra oblonga and Tripneustes
gratilla, both had low power and non-significant effects of protection (Table 3.4).
Table 3.4. Two-factor analysis of covariance (factors = protection, and site) evaluating densities of lagoon invertebrate species across all Ra’ui and Control sites, with index of ‘usable substrate’ (Substrate) as covariate. A post-hoc power analysis to detect an effect of protection is included where * denotes power value is ≥ 0.995
Scientific Name Treatment df MS F-ratio p Power (1-β)
Diadema savignyi Full model 12 0.034 2.383 0.010 *
Protection 1 0.028 1.959 0.165
Site 5 0.037 2.625 0.029
Substrate 1 0.002 0.172 0.679
Protection X Site 5 0.037 2.590 0.030
Error 97 0.014
Echinothrix diadema Full model 12 0.017 2.809 0.002 *
Protection 1 0.025 4.102 0.046
Site 5 0.022 3.638 0.005
Substrate 1 0.004 0.728 0.396
Protection X Site 5 0.011 1.754 0.130
Error 97 0.006
Echinometra mathaei Full model 12 0.880 7.235 p<0.001 *
Protection 1 0.536 4.404 0.038
Site 5 1.177 9.673 p<0.001
Substrate 1 2.126 17.480 p<0.001
Protection X Site 5 0.417 3.428 0.007
Error 97 0.122

Chapter 3 Fish, Invertebrate, and Functional Group Responses to Ra’ui
83
Table 3.4 continued. Two-factor analysis of covariance (factors = protection, and site) evaluating densities of lagoon invertebrate species across all Ra’ui and Control sites, with index of ‘usable substrate’ (Substrate) as covariate. A post-hoc power analysis to detect an effect of protection is included where * denotes power value is ≥ 0.995
Scientific Name Treatment df MS F-ratio p Power (1-β)
Echinometra oblonga Full model 12 0.010 5.428 p<0.001 0.344
Protection 1 0.006 3.217 0.076
Site 5 0.019 10.652 p<0.001
Substrate 1 0.003 1.917 0.169
Protection X Site 5 0.002 1.322 0.261
Error 97 0.002
Actinopyga mauritiana Full model 12 0.016 20.227 p<0.001 0.887
Protection 1 0.031 38.255 p<0.001
Site 5 0.017 20.787 p<0.001
Substrate 1 0.000 0.113 0.737
Protection X Site 5 0.014 17.816 p<0.001
Error 97 0.001
Holothuria atra Full model 12 2.766 13.339 p<0.001 *
Protection 1 0.523 2.524 0.115
Site 5 5.484 26.447 p<0.001
Substrate 1 1.300 6.270 0.014
Protection X Site 5 0.846 4.080 0.002
Error 97 0.207
Holothuria cinerascens Full model 12 0.110 17.688 p<0.001 0.901
Protection 1 0.129 20.705 p<0.001
Site 5 0.129 20.666 p<0.001
Substrate 1 0.010 1.559 0.215
Protection X Site 5 0.072 11.479 p<0.001
Error 97 0.006
Holothuria leucospilota Full model 12 0.942 8.380 p<0.001 *
Protection 1 0.099 0.879 0.351
Site 5 1.255 11.172 p<0.001
Substrate 1 1.319 11.737 0.001
Protection X Site 5 0.801 7.132 p<0.001
Error 97 0.112
Linckia laevigata Full model 12 0.006 2.527 0.006 *
Protection 1 0.005 2.187 0.142
Site 5 0.004 1.505 0.195
Substrate 1 0.026 10.419 0.002
Protection X Site 5 0.000 0.090 0.994
Error 97 0.003
Stichopus chloronotus Full model 12 0.327 18.047 p<0.001 *
Protection 1 0.000 0.007 0.935
Site 5 0.693 38.306 p<0.001
Substrate 1 0.164 9.037 0.003
Protection X Site 5 0.054 2.980 0.015
Error 97 0.018

Chapter 3 Fish, Invertebrate, and Functional Group Responses to Ra’ui
84
Table 3.4 continued. Two-factor analysis of covariance (factors = protection, and site) evaluating densities of lagoon invertebrate species across all Ra’ui and Control sites, with index of ‘usable substrate’ (Substrate) as covariate. A post-hoc power analysis to detect an effect of protection is included where * denotes power value is ≥ 0.995
Scientific Name Treatment df MS F-ratio p Power (1-β)
Tripneustes gratilla Full model 12 0.058 8.192 p<0.001 0.770
Protection 1 0.000 0.004 0.951
Site 5 0.087 12.178 p<0.001
Substrate 1 0.092 12.901 0.001
Protection X Site 5 0.017 2.401 0.042
Error 97 0.007
Tridacna spp. Full model 12 0.022 4.330 p<0.001 0.974
Protection 1 0.010 1.860 0.176
Site 5 0.015 2.993 0.015
Substrate 1 0.025 4.916 0.029
Protection X Site 5 0.016 3.038 0.014
Error 97 0.005
Trochus niloticus Full model 12 0.093 9.951 p<0.001 *
Protection 1 0.179 19.071 p<0.001
Site 5 0.150 16.065 p<0.001
Substrate 1 0.040 4.302 0.041
Protection X Site 5 0.043 4.557 0.001
Error 97 0.009
Diadema maxima Full model 12 0.027 4.557 p<0.001 *
Protection 1 0.020 3.396 0.068
Site 5 0.028 4.607 0.001
Substrate 1 0.053 8.799 0.004
Protection X Site 5 0.017 2.762 0.022
Error 97 0.006
Reef Crest Invertebrates
Level of protection was significant in determining variation in the densities of 3
(Holothuria cinerascens, Holothuria leucospilota, and Trochus niloticus) of the 11 reef
crest invertebrates (Table 3.5). Site was significant in determining variation in the
densities of 5 of the 11 reef crest invertebrates, including a significant interaction
between level of protection and site for Echinometra oblonga (Table 3.5). Substrate
contributed significantly to densities of only H. leucospilota on the reef crest.
Power to detect an effect of protection was adequate for all reef-crest invertebrates
(Table 3.5).
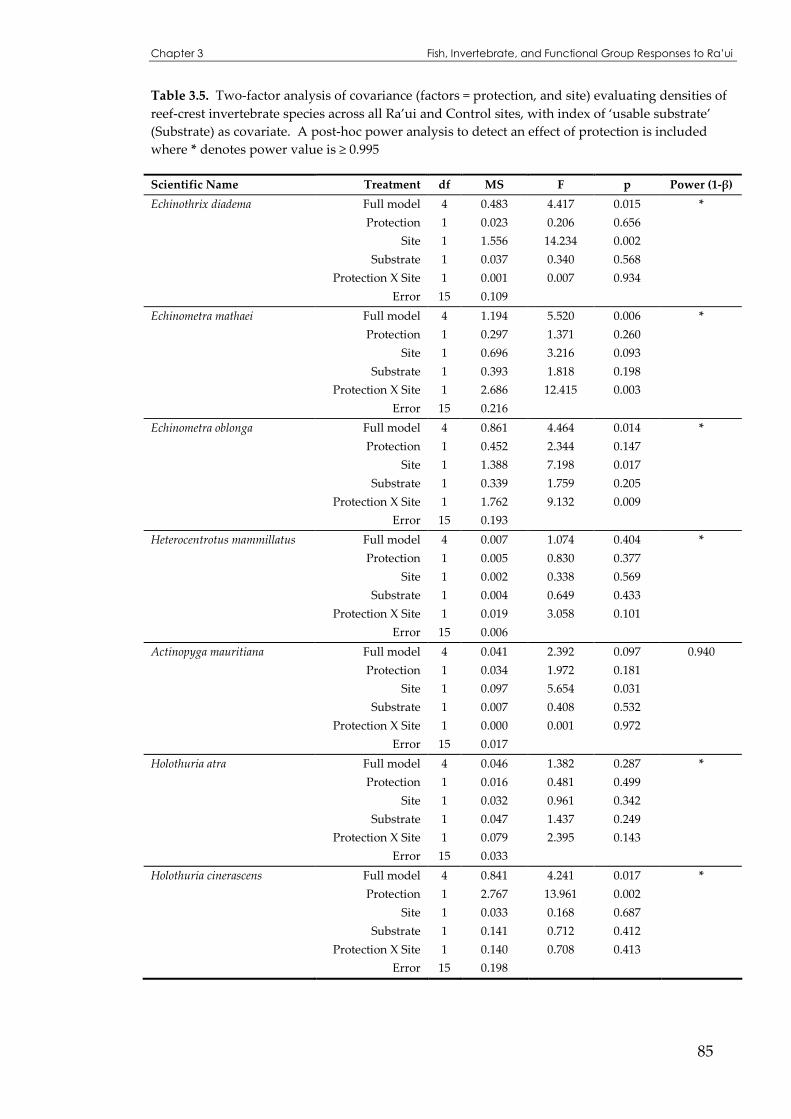
Chapter 3 Fish, Invertebrate, and Functional Group Responses to Ra’ui
85
Table 3.5. Two-factor analysis of covariance (factors = protection, and site) evaluating densities of reef-crest invertebrate species across all Ra’ui and Control sites, with index of ‘usable substrate’ (Substrate) as covariate. A post-hoc power analysis to detect an effect of protection is included where * denotes power value is ≥ 0.995
Scientific Name Treatment df MS F p Power (1-β)
Echinothrix diadema Full model 4 0.483 4.417 0.015 *
Protection 1 0.023 0.206 0.656
Site 1 1.556 14.234 0.002
Substrate 1 0.037 0.340 0.568
Protection X Site 1 0.001 0.007 0.934
Error 15 0.109
Echinometra mathaei Full model 4 1.194 5.520 0.006 *
Protection 1 0.297 1.371 0.260
Site 1 0.696 3.216 0.093
Substrate 1 0.393 1.818 0.198
Protection X Site 1 2.686 12.415 0.003
Error 15 0.216
Echinometra oblonga Full model 4 0.861 4.464 0.014 *
Protection 1 0.452 2.344 0.147
Site 1 1.388 7.198 0.017
Substrate 1 0.339 1.759 0.205
Protection X Site 1 1.762 9.132 0.009
Error 15 0.193
Heterocentrotus mammillatus Full model 4 0.007 1.074 0.404 *
Protection 1 0.005 0.830 0.377
Site 1 0.002 0.338 0.569
Substrate 1 0.004 0.649 0.433
Protection X Site 1 0.019 3.058 0.101
Error 15 0.006
Actinopyga mauritiana Full model 4 0.041 2.392 0.097 0.940
Protection 1 0.034 1.972 0.181
Site 1 0.097 5.654 0.031
Substrate 1 0.007 0.408 0.532
Protection X Site 1 0.000 0.001 0.972
Error 15 0.017
Holothuria atra Full model 4 0.046 1.382 0.287 *
Protection 1 0.016 0.481 0.499
Site 1 0.032 0.961 0.342
Substrate 1 0.047 1.437 0.249
Protection X Site 1 0.079 2.395 0.143
Error 15 0.033
Holothuria cinerascens Full model 4 0.841 4.241 0.017 *
Protection 1 2.767 13.961 0.002
Site 1 0.033 0.168 0.687
Substrate 1 0.141 0.712 0.412
Protection X Site 1 0.140 0.708 0.413
Error 15 0.198
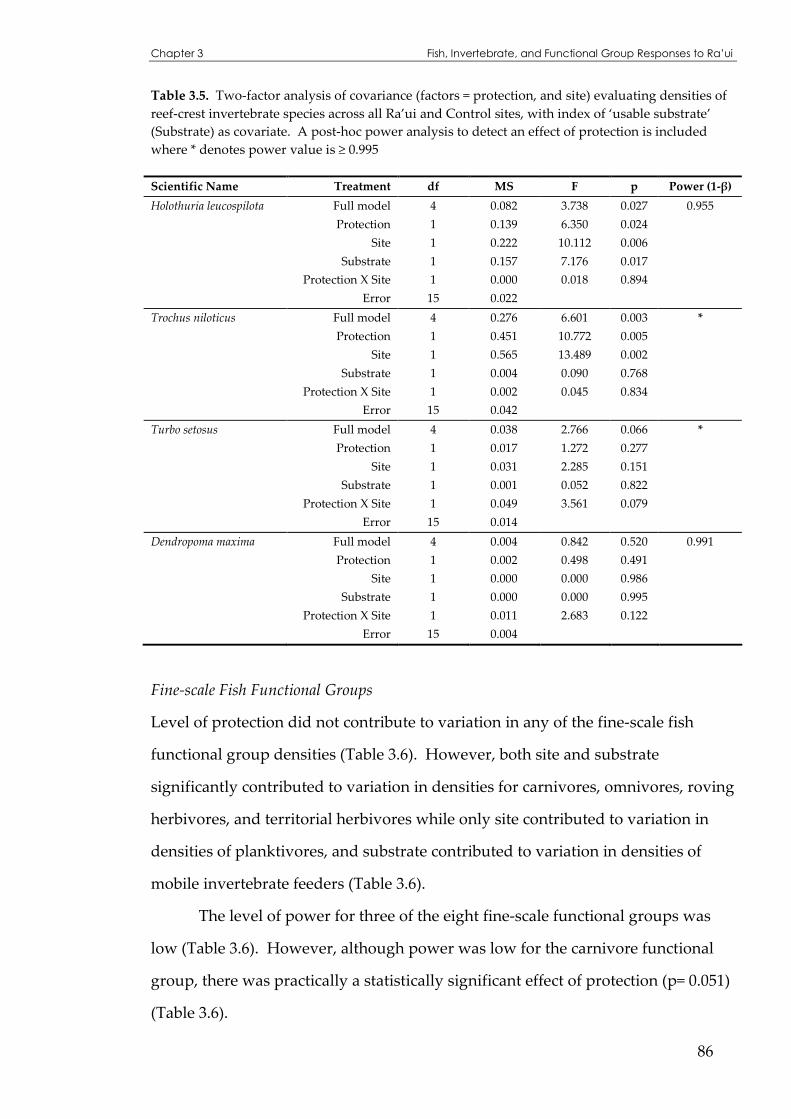
Chapter 3 Fish, Invertebrate, and Functional Group Responses to Ra’ui
86
Table 3.5. Two-factor analysis of covariance (factors = protection, and site) evaluating densities of reef-crest invertebrate species across all Ra’ui and Control sites, with index of ‘usable substrate’ (Substrate) as covariate. A post-hoc power analysis to detect an effect of protection is included where * denotes power value is ≥ 0.995
Scientific Name Treatment df MS F p Power (1-β)
Holothuria leucospilota Full model 4 0.082 3.738 0.027 0.955
Protection 1 0.139 6.350 0.024
Site 1 0.222 10.112 0.006
Substrate 1 0.157 7.176 0.017
Protection X Site 1 0.000 0.018 0.894
Error 15 0.022
Trochus niloticus Full model 4 0.276 6.601 0.003 *
Protection 1 0.451 10.772 0.005
Site 1 0.565 13.489 0.002
Substrate 1 0.004 0.090 0.768
Protection X Site 1 0.002 0.045 0.834
Error 15 0.042
Turbo setosus Full model 4 0.038 2.766 0.066 *
Protection 1 0.017 1.272 0.277
Site 1 0.031 2.285 0.151
Substrate 1 0.001 0.052 0.822
Protection X Site 1 0.049 3.561 0.079
Error 15 0.014
Dendropoma maxima Full model 4 0.004 0.842 0.520 0.991
Protection 1 0.002 0.498 0.491
Site 1 0.000 0.000 0.986
Substrate 1 0.000 0.000 0.995
Protection X Site 1 0.011 2.683 0.122
Error 15 0.004
Fine-scale Fish Functional Groups
Level of protection did not contribute to variation in any of the fine-scale fish
functional group densities (Table 3.6). However, both site and substrate
significantly contributed to variation in densities for carnivores, omnivores, roving
herbivores, and territorial herbivores while only site contributed to variation in
densities of planktivores, and substrate contributed to variation in densities of
mobile invertebrate feeders (Table 3.6).
The level of power for three of the eight fine-scale functional groups was
low (Table 3.6). However, although power was low for the carnivore functional
group, there was practically a statistically significant effect of protection (p= 0.051)
(Table 3.6).

Chapter 3 Fish, Invertebrate, and Functional Group Responses to Ra’ui
87
Table 3.6. Two-factor analysis of covariance (factors = protection, and site) evaluating densities of fine-scale functional groups across all Ra’ui and Control sites, with index of ‘usable substrate’ (Substrate) as covariate. A post-hoc power analysis to detect an effect of protection is included where * denotes power value is ≥ 0.995 Functional Group Treatment df MS F p Power (1-β)
Carnivores Full model 12 0.078 8.363 p<0.001 0.057 Protection 1 0.036 3.921 0.051 Site 5 0.072 7.732 p<0.001 Substrate 1 0.149 16.043 p<0.001 Protection X Site 5 0.017 1.783 0.123 Error 97 0.009
Piscivores Full model 12 0.003 0.537 0.886 0.991 Protection 1 0.015 2.628 0.108 Site 5 0.002 0.318 0.901 Substrate 1 0.006 1.026 0.314 Protection X Site 5 0.003 0.441 0.819 Error 97 0.006
Planktivores Full model 12 0.009 2.215 0.016 * Protection 1 0.013 3.211 0.076 Site 5 0.012 2.831 0.020 Substrate 1 0.001 0.204 0.653 Protection X Site 5 0.004 0.926 0.468 Error 97 0.004
Mobile Invertebrate Feeders Full model 12 0.099 2.485 0.007 0.115 Protection 1 0.000 0.001 0.971 Site 5 0.076 1.907 0.100 Substrate 1 0.170 4.282 0.041 Protection X Site 5 0.135 3.417 0.007 Error 97 0.040
Sessile Invertebrate Feeders Full model 12 0.008 2.138 0.021 0.998 Protection 1 0.001 0.381 0.539 Site 5 0.005 1.376 0.240 Substrate 1 0.011 3.014 0.086 Protection X Site 5 0.010 2.822 0.020 Error 97 0.004
Omnivores Full model 12 0.051 5.736 p<0.001 0.441 Protection 1 0.000 0.026 0.871 Site 5 0.027 3.029 0.014 Substrate 1 0.198 22.330 p<0.001 Protection X Site 5 0.026 2.911 0.017 Error 97 0.009
Roving Herbivores Full model 12 0.521 3.233 0.001 * Protection 1 0.003 0.019 0.890 Site 5 0.542 3.362 0.008 Substrate 1 2.077 12.885 0.001 Protection X Site 5 0.360 2.236 0.057 Error 97 0.161
Territorial Herbivores Full model 12 0.132 8.913 p<0.001 * Protection 1 0.001 0.057 0.811 Site 5 0.036 2.469 0.038 Substrate 1 0.963 65.221 p<0.001 Protection X Site 5 0.065 4.370 0.001 Error 97 0.015

Chapter 3 Fish, Invertebrate, and Functional Group Responses to Ra’ui
88
Broad-scale Fish Functional Groups
As with the fine-scale fish functional groups, level of protection did not contribute
to variation in any of the broad-scale fish functional group densities (Table 3.7).
Site was significant in determining variation in densities for carnivores,
herbivores, and omnivores, while substrate significantly contributed to variation
in densities of all four broad-scale functional groups (Table 3.7). For herbivores,
omnivores, and planktivores / invertebrate feeders, there was a significant
interaction between level of protection and site (Table 3.7). Omnivores were the
only broad-scale functional group where power was low (Table 3.7).
Table 3.7. Two-factor analysis of covariance (factors = protection, and site) evaluating densities of broad-scale functional groups across all Ra’ui and Control sites, with index of ‘usable substrate’ (Substrate) as covariate. A post-hoc power analysis to detect an effect of protection is included where * denotes power value is ≥ 0.995 Functional Group Treatment df MS F p Power (1-β)
Carnivores Full model 8 0.062 6.537 p<0.001 *
Protection 1 0.006 0.603 0.441
Site 3 0.087 9.116 p<0.001
Substrate 1 0.051 5.365 0.024
Protection X Site 3 0.011 1.172 0.328
Error 61 0.010
Herbivores Full model 12 0.568 3.728 p<0.001 *
Protection 1 0.000 0.000 0.992
Site 5 0.498 3.269 0.009
Substrate 1 2.852 18.713 p<0.001
Protection X Site 5 0.372 2.442 0.040
Error 97 0.152
Omnivores Full model 12 0.051 5.845 p<0.001 0.468
Protection 1 0.000 0.034 0.854
Site 5 0.027 3.117 0.012
Substrate 1 0.204 23.271 p<0.001
Protection X Site 5 0.027 3.065 0.013
Error 97 0.009
Planktivores / Invertebrate feeders Full model 12 0.109 2.771 0.003 0.999
Protection 1 0.001 0.036 0.850
Site 5 0.090 2.292 0.051
Substrate 1 0.275 6.997 0.010
Protection X Site 5 0.134 3.415 0.007
Error 97 0.039

Chapter 3 Fish, Invertebrate, and Functional Group Responses to Ra’ui
89
DISCUSSION
A priori hypotheses
Harvested fish species had significantly greater abundances inside Ra’ui relative
to corresponding Control sites at only one or two of the six sites. This is contrary
to the results of a recent meta-analysis examining the effects of MPAs (Mosquera
et al. 2000). Mosquera et al. (2000) found that fished (=target) species were
significantly more abundant inside MPAs relative to outside, while the abundance
of non-target species remained similar between reserve and non-reserve areas.
The variable responses of harvested invertebrate species to Ra’ui in my study also
contrasts with work by Ashworth et al. (2004) who found densities of invertebrates
targeted by fishing were greater in MPAs than reference sites. However, in this
study, one Ra’ui, Aroa, appeared more effective for harvested invertebrate species
than all other Ra’ui. Aroa had the highest number of harvested invertebrate
species (including Diadema savignyi, Echinothrix diadema, Tripneustes gratilla,
Tridacna species, and Dendropoma maxima) where densities were significantly
higher inside the Ra’ui relative to corresponding Control sites.
Interestingly, my analyses suggest that lagoon invertebrates were more
likely to exhibit stronger positive responses to Ra’ui effects relative to fish species.
This is consistent with my a priori hypothesis and suggestions by others that
marine reserves may be more effective for relatively sessile or site-attached species
(e.g., many invertebrates; Parnell et al. 2005). However, the life-history traits (i.e.,
being sessile or site-attached) which could make MPAs more effective refuges for
invertebrates, may also make invertebrates more vulnerable to exploitation
(Ashworth et al. 2004, Drumm 2004). This has important implications; if
compliance in MPAs is patchy, harvested invertebrates are potentially more
sensitive to poaching relative to many fishes. For invertebrates on the reef crest,
only the harvested marine gastropod (Trochus niloticus) had greater abundances at
both reef crest Ra’ui relative to Control sites. I had expected that some of the
Chapter 3 Fish, Invertebrate, and Functional Group Responses to Ra’ui
90
harvested echinoderms such as Echinothrix diadema and Heterocentrotus
mammillatus would also have greater abundances inside Ra’ui than at Control
sites, but their abundances were similar inside and outside Ra’ui. Again, my
finding is in contrast with one of the few studies that has looked at the effects of
MPAs on harvested invertebrates where harvested invertebrates were more
abundant inside the MPA than in fished zones (Ashworth et al. 2004).
Results from broad scale trophic classifications were similar to those for
fine-scale trophic classifications: Carnivores (= predators) had significantly higher
densities inside the Ra’ui relative to control sites at two Ra’ui (Parliament and
Tikioki), and this pattern was nearly significant for Aroko, somewhat consistent
with my a priori expectations, although carnivore densities were not consistently
higher across all Ra’ui. The significantly greater abundances of carnivores inside
Parliament and Tikioki Ra’ui are consistent with other studies where carnivores
appear to have increased disproportionately in protected or lightly fished areas
(Friedlander and DeMartini 2002, Graham et al. 2003, Sosa-Lopez et al. 2005).
Fishing tends to remove big, long-lived species at the top of food webs (i.e.,
carnivores) (Pitcher 2001, Halpern and Warner 2002, Myers and Worm 2003,
Rochet and Trenkel 2003). Subsequently, protection is expected to result in
increased predator abundances. In my study, a number of species classified as
carnivores are fished species around Rarotonga (groupers / cod, trevally (Moore
2006)) (see Appendix A, Table 2 for details of functional groupings for species).
Densities of carnivores/predators were similar inside and outside Ra’ui at all other
sites, contrary to my a priori hypothesis. In a meta-analysis of the effects of MPAs
(Mosquera et al. 2000), fished (= target) species were significantly more abundant
inside MPAs relative to outside, while the abundances of non-target species
remained similar between reserve and non-reserve areas. However, a number of
fished species in my study were not carnivorous (for example, goatfish, parrotfish,
mullet, and drummers) but rather herbivores or planktivores / invertebrate
feeders. As suggested by the response ratios in this study, planktivores /

Chapter 3 Fish, Invertebrate, and Functional Group Responses to Ra’ui
91
invertebrate feeders had greater abundances at only Aroko Ra’ui, while herbivores
had greater abundances at Akapuao and Parliament Ra’ui relative to control sites.
My data also provides some evidence consistent with an inverse
relationship between predator and prey abundances occurring between functional
groups within Ra’ui at Tikioki, Aroa, and Aroko Ra’ui, although these patterns
were not biologically significant (i.e., confidence intervals for response ratios
overlapped zero). Additionally, my observation of an inverse relationship
between predator and prey abundances assumes that members of the other three
functional groups (herbivores, omnivores, and planktivore / invertebrate feeders)
comprise the prey of carnivores. Several published studies provide some evidence
for subsequent decreases in prey abundance following implementation of a
reserve (e.g., Williamson et al. 2004). For example, negative correlations between
predatory species and their prey have been reported by Graham et al. (2003) and
Sosa-Lopez et al. (2005), who demonstrated that the biomass of fished carnivorous
species increased with protection while prey species inside MPAs decreased.
Watson et al. (2007) found that the structure of fish assemblages between fished
and protected areas differed greatly, and suggested that the removal of piscivores
in fished areas results in increased abundances of prey species. Langlois et al.
(2006) reached a similar conclusion for invertebrates, where predation by rock
lobsters reduced survival of adult bivalves, suggesting the potential for trophic
interactions. However, Graham et al. (2003) noted factors including recruitment
variability, variation in habitat, and differences due to other predator effects that
influence prey abundances that were not measured in their study, may confound
the statistically significant negative correlations between predator and prey
biomass.
There was no evidence for any inverse predator – prey relationship at the
other three Ra’ui (Akapuao, Matavera, and Parliament). The lack of an inverse
predator – prey relationship is consistent with inconclusive attempts to detect
trophic effects such as predator–prey interactions and trophic cascades in MPAs /

Chapter 3 Fish, Invertebrate, and Functional Group Responses to Ra’ui
92
fishing in coral reef ecosystems where significant decreases in piscivorous fish
have not been associated with a corresponding increase in prey abundance
(Jennings and Polunin 1997, Russ and Alcala 1998a, Halpern 2003).
Trophic cascades were first described by Hairston et al. (1960) as occurring
when predators decrease the abundance of herbivores, with a subsequent increase
in plant material (i.e., a food chain with three trophic levels). Further, according to
Pinnegar et al. (2000), a trophic cascade does not necessarily have to involve plants
or algae at the bottom of the food web, but may involve other trophic levels, so
long as there is a tri-trophic level interaction. Although others have demonstrated
trophic cascades occur in MPAs (Shears and Babcock 2003, Guidetti and Sala
2007), in my study there is no evidence of any trophic cascade occurring within
either the Parliament or Tikioki Ra’ui, as my data fail to document clear decreases
in abundances of other functional groups that would be consistent with a trophic
cascade.
Tikioki Ra’ui had a particularly high abundance of carnivores, and this is
noteworthy because the reserve is among the smallest on the island. The high
densities of carnivores are somewhat surprising because carnivorous reef fishes
are generally more mobile than other functional groups, and losses due to
harvested spill-over might be expected to deplete populations in the Tikioki Ra’ui
relative to others on the island due to the relatively small size of the Tikioki Ra’ui.
In its favour, compliance at Tikioki is possibly high (it is well-known as a prime
snorkelling spot on Rarotonga, with nearby residents and businesses profiting
from visiting snorkelers, providing incentives for vigilance / enforcement). It is
possible that higher compliance may offset the small size of Tikioki Ra’ui, and this
speculation is consistent with Halpern’s (2003) synthesis of MPA effects, which
determined the proportional MPA effect to be independent of reserve size. As an
alternative hypothesis, fish feeding that regularly occurs at Tikioki reserve
(personal observations) may shape some of the patterns recorded for this Ra’ui.
Previous work by Milazzo et al. (2005) demonstrated that fish feeding led to

Chapter 3 Fish, Invertebrate, and Functional Group Responses to Ra’ui
93
significant spatio-temporal changes in fish assemblages in an MPA, and suggested
that an increase in predators as a result of fish feeding could result in decreased
abundances of prey species. It is possible that fish feeding at Tikioki Ra’ui,
coupled with the age of the Ra’ui (five years of closure to fishing at the time of my
censuses) and possibly good compliance, may have played a combined role in the
responses observed in my study. Good compliance may also contribute to the
greater abundances of carnivores observed within Parliament Ra’ui relative to
Control sites, as the Cook Islands’ Parliament buildings and a number of
residences are directly adjacent to Parliament Ra’ui. However, further
information regarding overall fishing pressure and rates of compliance would be
required for more definitive inferences.
There was no evidence for a general Ra’ui effect for any species or
functional group across all sites when the data was subject to meta-analysis,
contrary to my a priori hypothesis. However, blocked two-factor ANCOVA
models indicated that island-wide, level of protection significantly contributed to
variation in fish and invertebrate densities, with level of protection alone
determining a significant amount of variation in densities of the goatfish,
Parupeneus multifasciatus, the urchin, Echinothrix diadema (lagoon only), and the sea
cucumbers, Holothuria cinerascens, and Holothuria leucospilota (reef crest only), and
the gastropod, Trochus niloticus (reef crest only).
I suggest that the lack of concordance between the island-wide meta-
analysis of Ra’ui effects (no significant effect of protection for any species or
functional groups) and the blocked two-factor ANCOVA models (level of
protection determined the densities for some fish and invertebrate densities (see
Tables 3.3, 3.4, and 3.5), for the majority of species, is not due to lack of statistical
power in my sampling design. Power can be defined as the probability of
detecting a given effect in samples if the effect actually occurs in the population
(Quinn and Keough 2002). Power analysis (see Tables 3.3, 3.4, 3.5, 3.6 and 3.7)
indicated there was adequate power to detect an effect of protection at an island-

Chapter 3 Fish, Invertebrate, and Functional Group Responses to Ra’ui
94
wide scale for the majority of the fish, invertebrates, and functional groups. It is
more likely that the lack of concordance between testing for an ‘island-wide’ effect
of protection between meta-analysis and ANCOVA is an artefact relating to the
combination of response ratios for each site using meta-analysis.
Meta-analyses are only ‘as good’ as the quality of data synthesised. A
limitation of Control-Impact sampling designs is that they confound natural
spatial variation (e.g., substrate heterogeneity) with the effect they are attempting
to measure. This can be problematic when the results from Control-Impact
assessments are incorporated into meta-analyses, which are then used to indicate
the possible direction and magnitude of response to protection (reviewed by
Osenberg et al. 2006). Although I undertook extensive efforts to statistically
‘control’ for potentially confounding effects of substrate heterogeneity, it is still
possible that my underlying data is subject to other sources of spatial variation.
Thus, the meta-analytical conclusion of ‘no overall effect of Ra’ui’ may, in part, be
an artefact of spatial heterogeneity that was not effectively incorporated into my
approach. For example, particular to each of the 6 sites, trophic interactions
between species, temporal variability in sampling, and the confounding effects of
spillover and larval export, along with other unmeasured factors, may have
contributed to the conclusion of ‘no effect’ in the ‘island-wide’ meta-analyses.
However, I suggest that the key reason there was no significant effect of Ra’ui in
the meta-analyses relates to the lack of a consistent response to Ra’ui at the level of
site which may be, in part, due to the aforementioned factors. For example, no
lagoon fish, invertebrates, or fish functional groups exhibited consistent responses
to Ra’ui across all 6 sites. When the site data were combined in a meta-analysis,
those sites where species showed a positive response to Ra’ui cancelled out those
sites where species showed a negative response to Ra’ui i.e., the lack of consistent
responses to Ra’ui across sites led to a “cancellation effect” upon synthesis via
meta-analysis.

Chapter 3 Fish, Invertebrate, and Functional Group Responses to Ra’ui
95
Variation in responses to Ra’ui
My results illustrating highly variable putative responses to protection for fish and
invertebrate species, and functional groups, both within Ra’ui, and across Ra’ui,
were not completely unexpected. As Côté et al. (2001) concluded, marine reserve
responses can differ significantly in their degree and direction. Willis and
Anderson (2003) similarly noted that individual species or groups of species can
respond positively, negatively, or have no response to protection, with a negative
response not necessarily indicating a poorly functioning reserve. In addition, my a
priori expectations were not met across all sites with responses to Ra’ui seemingly
‘idiosyncratic’ (sensu Lawton 1994) with several possible reasons for the variable
responses for species and functional groups across sites.
Environmental gradients around the island of Rarotonga may play some
role in determining the response of fish and invertebrates to Ra’ui. For example,
Tikioki Ra’ui is at the south-east windward side of the island where the lagoon is
deeper and wider, and lies between two passages open to the ocean located at
Avana, and Avaavaroa. Aroa, Akapuao, and Aroko Ra’ui are also located on the
windward side of the island, near large reef passages. Yet, across these windward
sites, species and functional group responses to Ra’ui were not consistent. It is
possible that processes governing larval and nutrient supply that may influence
species abundance and composition at sites, are occurring at a higher spatial
resolution than side of the island. Some current measurements have been made
around Rarotonga (Holden 1992a, 1992b) but there is little information available to
attribute marine circulatory patterns to observed Ra’ui effects.
Both age and size of Ra’ui may also contribute to the variability in Ra’ui
effects. Commonly, the assumption is that larger MPAs are more effective,
however, Halpern (2003) found the proportional effect of MPAs was independent
of size. Similarly, Halpern and Warner (2002) suggested that the age of an MPA
may be relatively unimportant (because responses are rapid; but see Osenberg et

Chapter 3 Fish, Invertebrate, and Functional Group Responses to Ra’ui
96
al. 2006 for an alternate interpretation; and work by others is contradictory, e.g.,
Dufour et al. 1995). However, the Ra’ui were all of similar age at the time of my
surveys; the time since the Ra’ui were implemented or last opened to fishing was
between 4.5 to 5 years. With respect to the characteristics of Ra’ui on Rarotonga, I
will explore these issues in greater detail in Chapter 5.
The level of fishing outside Ra’ui, as well as the degree of compliance inside
Ra’ui may also influence responses to Ra’ui. According to a fish consumption
survey of households on Rarotonga (Moore 2006), 33% of the 90 households
surveyed carry out some form of fishing in the lagoon; consumption of both
lagoon fish and invertebrates still occurs in Rarotonga. However, it is not known
if the fish and invertebrates referred to by survey participants are sourced from
the lagoon on Rarotonga or from the outer islands, as there was no information on
the exact location where fish and / or invertebrates were collected (Moore 2006). A
more recent survey of finfish, invertebrates, and socioeconomics was carried out
on Rarotonga in October 2007 (SPC 2007), indicating that only 44% of all
households engage in some form of fishing. Relative to other islands in the Cook
Islands, the level of fishing on Rarotonga is low, due to people leading an
increasingly urban lifestyle compared with other islands in the Cook Islands, and
the potential for lagoon fish to be ciguatoxic (SPC 2007). However, around 20% of
the 500 households surveyed still go fishing, primarily for invertebrates such as
sea cucumbers (rori, Holothuria spp.), giant clams (Tridacna spp.), urchins (vana,
Echinothrix diadema; avake, Tripneustes gratilla), Trochus niloticus, and worm-snails
(ungakoa, Dendropoma maxima) (SPC 2007). While carrying out the surveys for this
study, I sporadically observed fishing occurring at various locations throughout
the lagoon for some invertebrate and fish species including urchins (Diadema
savignyi and E. diadema), sea cucumbers (rori toto, Holothuria atra), octopus (eke,
Octopus maorium), and goatfish (vete, Mulloidichthys flavolineatus). The level of
fishing outside Ra’ui may vary around the island, as may the degree of
compliance within Ra’ui. Both have implications for detecting MPA effects; if little

Chapter 3 Fish, Invertebrate, and Functional Group Responses to Ra’ui
97
fishing occurs at Control sites relative to corresponding Ra’ui sites, then there may
not be any observed effects of Ra’ui.
Finally, physical disturbance and site modification may also result in
variation in responses to Ra’ui. Prior to the surveys conducted in autumn / winter
2005, a series of 5 cyclones of varying magnitude passed through Rarotonga,
causing damage to coastal properties, and depositing debris (coral rubble)
predominantly along the northern and eastern coasts. Previous work has shown
that although cyclones result in little change to adult fish assemblages, they can
lead to high juvenile mortality and redistribution of sub-adult fish (Lassig 1983),
and consequently play an important role in structuring fish communities. Other
work has shown that fish move from shallow to deeper waters during storms,
with no overall decrease in the population or species despite habitat destruction
and an eventual return to pre-cyclone community structure (Walsh 1983). It is
likely that the cyclones of 2005 played a role in observed responses to Ra’ui, but to
what degree is unknown as there is limited information on fish or invertebrate
communities across all Ra’ui sites prior to the 2005 cyclones.
CONCLUSIONS
To summarise, a number of studies have looked at the effect of MPAs on fish
community structure (Wantiez et al. 1997, Russ and Alcala 1998a, 1998b, Samoilys
1988, Edgar and Barrett 1999) but few have focused on multiple MPAs (Wantiez et
al. 1997, Samoilys 1988), and even fewer have looked at the effects of a network of
traditional MPAs (such as Ra’ui) in the South Pacific (this study). Furthermore, no
studies have attempted a meta-analysis of the effects of MPAs across a number of
sites as part of a single study (although one study was carried out using meta-
analysis to examine the effects of a single MPA over a six year period (Ojeda-
Martinez et al. 2007).
This study reinforces some of the difficulties associated with establishing
causal linkages between MPAs and observed differences in species abundances

Chapter 3 Fish, Invertebrate, and Functional Group Responses to Ra’ui
98
between fished and protected areas. My results illustrate how apparent responses
to protection (i.e., MPA effects, as estimated by Control-Impact studies) can vary
even when careful attempts are made to control for habitat heterogeneity (one
source of variation that potentially confounds estimates of MPA effects, see
Chapter 2 for more discussion). My estimated responses of Families, of species
within and among Families, and of functional groups classified according to two
different published schemes, all varied within and among Ra’ui. This information
is important as it implies that the effects of MPAs (assuming these are even
measured by my approach) cannot always be generalised as there are a wide
range of processes occurring, besides protection status and habitat heterogeneity,
which can influence community structure, and fish and invertebrate abundances.
The results of this study may identify which species might best be used as
‘indicator’ species when assessing the effects of MPAs. If it is not possible to carry
out a comprehensive survey of fish and invertebrate species to assess MPA effects,
the use of ‘indicator’ species or ‘representative’ species such as goatfish (Mullidae)
(Uiblein 2007) and harvested sessile invertebrate species, may be good indicators.
However, the use of indicator species should be approached with caution, given
the variable responses observed here across species and functional groups.
Moreover, any survey should incorporate location specific fishing knowledge, as
an indicator species at one location may not serve as an indicator species at
another location. Finally, Ra’ui-specific effects (e.g., age, size, and compliance)
may be important uncontrolled sources of variation in this study; these will be
examined in Chapter 5.
99
CHAPTER 4: Spatial variation in size-structure of
key resource species as an indicator
of Ra’ui effectiveness
ABSTRACT
In general, the size of organisms within marine protected areas (MPAs) is
expected to increase. In this chapter I test whether the maximum and mean sizes
of common fish and invertebrate species within the lagoon of Rarotonga are
significantly greater in Ra’ui than at Control sites. As habitat has been shown to
influence the size of fish, I incorporate variation in substrate between Ra’ui and
Control sites into the analyses of size distributions (represented by 25th, 50th, 75th
and 95th percentiles along a size frequency distribution) for five ubiquitous fish
species using permutational multivariate analysis of variance (PERMANOVA).
Further, using Manly’s alpha for juveniles and adults of these same five fish
species, I assess whether each ontogenetic stage i.e., juveniles or adults, uses
habitat differently, and then determine whether the proportion of preferred
substrate locally available shapes juvenile and adult densities. Results indicate
only one fish species (Siganus argenteus) had significantly greater maximum size in
Ra’ui relative to corresponding Control sites, while Mulloidichthys flavolineatus and
Stegastes nigricans were the only fish to exhibit a significantly greater mean size in
Ra’ui relative to corresponding Control sites. Two of the lagoon invertebrates
(Echinometra mathaei and Tripneustes gratilla) and three of the reef-crest
invertebrates (Echinothrix diadema, Echinometra oblonga, and Trochus niloticus) had
significantly greater mean size in Ra’ui relative to corresponding Control sites.
Juveniles of five fish species used habitat differently relative to adults.
Densities of Acanthurus triostegus juveniles increased linearly with the proportion
Chapter 4 Spatial Variation in Size Structure
100
of preferred substrate cover (r2 = 0.44, p= 0.011), whereas densities of adult A.
triostegus (r2 = 0.46, p= 0.009) and Ctenochaetus striatus (r2 = 0.43, p= 0.035) increased
linearly with the proportion of preferred substrate cover. Although not
statistically significant, densities of adult M. flavolineatus exhibited a trend of
decreasing linearly in both Ra’ui (r2 = 0.49, p= 0.074) and corresponding Control (r2
= 0.15, p= 0.448) sites with increasing preferred substrate cover, suggesting a
possible effect of protection. However, this result was accompanied by an
interaction between protection and substrate that is difficult to interpret. Factors
including site-fidelity and the mobility of an organism, the level of fishing
pressure in the lagoon, disturbance events, sporadic recruitment, and temporal
variation in sampling may explain why so few significant increases in size were
observed in Ra’ui relative to corresponding Control sites across a wide range of
fish and invertebrate species.

Chapter 4 Spatial Variation in Size Structure
101
INTRODUCTION
Life-history characteristics such as whether an organism is highly mobile or
sedentary, long- or short-lived, reaches maturity quickly or slowly, and how
fecund it is, can influence how a species responds to exploitation or protection
(Jennings et al. 1999). Further, these life-history characteristics evolve together as
interrelated traits determined by demographic rates that may depend upon the
local environment (Williams 1966, Stearns and Crandall 1984). Fishing has
enormous impacts on the demographic environment of harvested species by
directly affecting population densities, and decreasing the mean size of targeted
species (Rochet 1998). The demographic environment created via the removal of
older and larger fish results in changes to the age and size structure of fished
populations (Jennings and Polunin 1996a, Goni 1998), and exploited fish stocks
may respond directly to fishing- induced decreases in population density with
increased growth (Stearns and Crandall 1984). Conversely, when fishing levels
are reduced or fishing ceases altogether, the mean size and age of the previously
fished population may increase (Edgar and Barrett 1999, Sanchez-Lizaso et al.
2000, Ashworth et al. 2004).
Maximum observed size, an easily measured life-history parameter, has
been found to correspond with population trends of harvested fish on coral reefs
(Jennings et al. 1999) and is a good predictor for other life-history parameters, such
as age at maturity (Blueweiss et al. 1978). Jennings et al. (1999) suggest that the
theoretical maximum size (L∞), which is closely correlated with observed
maximum size, may serve as a proxy to indicate the response of a species to
fishing. The ease with which observed maximum size can be estimated (for
example, via underwater visual census) is of particular relevance in assessing the
vulnerability of coral reef fisheries, which tend to be data deficient (Jennings et al.
1999, Johannes 1998, Aswani et al. 2007).

Chapter 4 Spatial Variation in Size Structure
102
Marine protected areas (MPAs) are not only expected to increase densities of
organisms within their bounds, but also increase the size of targeted fish and
invertebrates (Sanchez-Lisazo et al. 2000, Westera et al. 2003, Begg et al. 2005).
Although some studies show no increase in mean sizes of fish in MPAs (e.g.
Wantiez et al. 1997), many other studies have demonstrated an increase in mean
size of fish and invertebrates when fishing ceases (see Dugan and Davis 1993 for a
review, Buxton and Smale 1989, Edgar and Barrett 1999, Uthicke and Benzie 2000,
Ashworth et al. 2004, Floeter et al. 2006). A recent meta-analysis supports the
association of larger sized fish (but not invertebrates) within MPAs (Halpern
2003).
To date, empirical evidence for increased organism size in MPAs remains
equivocal, as no studies have incorporated a range of necessary protocols
(including Before-After Control-Impact Paired-Series (BACIPS) assessment design,
and factoring out confounding effects of habitat) into the assessment of MPA
effects (Russ 2002). Further, the claims of meta-analyses remain questionable, as
these are based on studies that are potentially systematically confounded (Edgar et
al. 2004, see Chapter 2 of this thesis for further discussion).
Environmental heterogeneity is one factor known to confound MPA
assessments. Although environmental heterogeneity is known to account for
variation in fish abundance and diversity, little consideration has been given to its
potential to confound assessments of the effects of MPAs (see Chapter Two for
further discussion). Further, few studies have looked at how the effects of habitat
on the size of fish or invertebrates may confound the effects of MPAs (Jennings et
al. 1996b, Chapman and Kramer 1999, Chateaux and Wantiez 2005). Of the studies
that have controlled for habitat correlates when examining the effects of MPAs on
organism size, one study found that 14 of the 26 observed fish species had a
significant linear relationship between mean length and one or more habitat
variables (Chapman and Kramer 1999). However, another study has suggested no
link between habitat and fish and invertebrate size (Hawkins et al. 2006). One

Chapter 4 Spatial Variation in Size Structure
103
objective of my study is to assess whether habitat contributes to differences in size
between Ra’ui and corresponding Control sites for a number of commonly
occurring fish species.
Habitat has also been shown to influence post-settlement processes such as
growth and survival for reef fish, with a number of studies demonstrating or
suggesting different growth rates that are habitat dependent (Jones 1988, Gust et
al. 2001). These studies are concordant with the assumption that growth rates are
indicative of habitat quality with higher growth indicating better quality habitat
e.g., better food supply, suitable shelter from predators (Searcy et al. 2007). Hence,
if the siting of MPAs is on the basis of good quality habitat relative to other
potential sites, then it is likely that if growth of fish and invertebrates will be
enhanced, confounding MPA effects with the effects of habitat quality.
In addition to the potential for habitat to influence the size of fish and
invertebrates, habitat may also be one determinant of juvenile (small fish) and
adult (large fish) fish abundances. Spatial and temporal variation may also
contribute to differences observed in the size structure of populations as a number
of reef fish undergo ontogenetic shifts in habitat use over their life-cycles (Lecchini
and Galzin 2005). Certain habitats may better support different periods in the life-
history of an individual (for example, juveniles versus adults), with ontogenetic
shifts in habitat use known to occur in many fish species (Gillanders et al. 2003,
Lechhini and Galzin 2005, Gratwicke et al. 2006, Shepherd and Brook 2007). For
example, movement of the Nassau grouper, Epinephelus striatus, occurs from
shallow macroalgal meadows as juveniles to offshore coral reefs as adults
(Dahlgren and Eggelston 2001). Niche shifts over the ontogeny of invertebrates
are less well known. One example is the Queen Conch, Strombus gigas, moving
from shallow sand and seagrass habitats to deeper seagrass, sand and algal
habitats as it transitions from juvenile to adult (Gillanders et al. 2003).
The recognition of crucial links between habitat and the ontogeny of a
species is vital. If an MPA is intended to completely protect a species, then all

Chapter 4 Spatial Variation in Size Structure
104
habitats used by that species over its life-cycle needs to be encompassed (PISCO
2007). Here I explore the issue of ontogenetic shifts by examining whether habitat
plays a role in association with Ra’ui in determining abundances of juveniles and
adults for a number of locally common fish species.
In Chapters 2 and 3 I demonstrated the importance of decoupling the
effects of protection from any effects of environmental heterogeneity (e.g., habitat
quality, substrate variability) on fish and invertebrate size. Accordingly, here I
explore whether size structure differs between Ra’ui and Control sites when the
confounding effect of substrate is factored out in my data analysis for a select
number of fish species. In this chapter, I address the following questions: (1)
Island-wide, do potentially harvested species have a greater maximum size, and
greater mean size in Ra’ui relative to corresponding Control sites? (2) Is there
evidence that Ra’ui increase the size of some of the more commonly occurring fish
species when substrate heterogeneity among sites is factored out in data analysis?
(3) Is there a relationship between the proportion of life-stage-specific preferred
substrate and i) juvenile, and ii) adult densities for five of the most common fish
species, and a concurrent effect of Ra’ui?
METHODS
Sampling regime
Fieldwork was carried out following sampling methods detailed in Chapter 2 and
3. In addition, standard lengths for all diurnal fish species (as per English et al.
1997), and size for 18 invertebrate species were estimated. This was done
concurrently while gathering abundance data. All fish standard lengths were
estimated to the nearest centimetre on snorkel using underwater visual census
techniques by one observer (the author) only, while invertebrate sizes were
measured predominantly by the author, and two additional persons, using a ruler
marked in 1cm increments.
Chapter 4 Spatial Variation in Size Structure
105
Data Analysis
Overall effects of Ra’ui
To assess whether size structure differed overall between Ra’ui and Control sites,
data from each of the 6 Ra’ui and 6 Control sites were treated as replicates in this
analysis. Only those species where there was size data for both Ra’ui and Control
sites across all sites were selected for analysis i.e., the most commonly occurring
fish and invertebrate species. This meant that fish data for 15 species were
included for analysis (Table 4.1). For invertebrates, those species found on the reef
crest were analysed separately from those inhabiting the lagoon. Twelve
invertebrate species from the lagoon were included in the analysis of the overall
effects of Ra’ui on size (Table 4.2). Invertebrates from only 2 sites (Parliament and
Matavera) at the reef crest were surveyed inside and outside the Ra’ui, with a total
of 9 invertebrate species from the reef crest included in analyses (Table 4.3).
As not all data met assumptions necessary for parametric tests, I used the
non-parametric Wilcoxon-Mann-Whitney U test (Siegel and Castellan 1988) to test
the null hypothesis that the maximum size and mean size of fish or invertebrates
was not greater at Ra’ui than Control sites. Size-frequency histograms were
plotted for each individual fish species and a two sample one-sided Kolmogorov-
Smirnov test (KS test) was used to assess the hypothesis that Ra’ui had size
distributions skewed towards larger sizes compared with Control sites.
Relationship between habitat and size structure across sites
Substrate has been shown to influence the size and survivorship of fish. In
assessment of the effects of Ra’ui on the size structure of commonly occurring fish,
I included the proportion of substrate cover at each site as covariates in my
analysis to control for possible substrate effects.
Percentiles (25th, 50th, 75th and 95%) of fish standard length were determined
from size-frequency data for each of five abundant fish species at each of the 6
Ra’ui and Control sites. Permutational analysis of variance (PERMANOVA;

Chapter 4 Spatial Variation in Size Structure
106
Anderson 2001, McArdle and Anderson 2001) was applied to the percentile data
for each species with arc-sine transformed proportion cover of all substrates
present at each site as covariates to test the null hypothesis of no Ra’ui effect on
size structure when substrate is considered.
Relationship between habitat and size: juvenile and adult fish
A number of fish and invertebrates are known to undergo ontogenetic shifts in
habitat use. Accordingly, substrate availability during particular stages of an
individual’s life-cycle (for example, the juvenile phase) may contribute to
determining abundances of individuals at that stage.
Size-frequency data for five abundant fish species were split into juveniles
and adults based on reported size at maturity for each species (Froese and Pauly
2008, see Table 4.4 for source references), to assess whether the proportion of
preferred habitat plays a role in determining the abundance and distribution of
juveniles and adults. Manly’s alpha (see Chapter 2 for a detailed description) was
calculated for juveniles and adults of each of the 5 fish species to determine those
substrates disproportionately over-used (and assumed here to represent most
preferred) by juveniles and adults. The null hypothesis that juveniles and adults
of the same species have similar preferences (as indicated by Manly’s alpha) was
tested by calculating Bray-Curtis distances and running randomisation tests to
assess statistical significance (Pledger et al. 2007).
The total proportion of substrate preferred by each juvenile and adult
species was calculated by summing together all those substrates (out of the 7
available substrates categorised and censused, see Chapter 2) that had Manly’s
alpha values greater than 0.143 (values above the 0.143 threshold indicate
substrate preference). Densities of juveniles and adults at each site were square-
root transformed, and the proportion of preferred substrate cover was arcsine
transformed to improve homogeneity of variance. Analyses were carried out
separately for juveniles and adults of each of the five species. Linear regression
was used to assess whether there was a relationship between the proportion of

Chapter 4 Spatial Variation in Size Structure
107
preferred substrate cover and densities of fish, and whether there is a relationship
between the proportion of preferred substrate cover separately for Ra’ui and
Control sites. Analysis of covariance (ANCOVA) was used to test for an effect of
protection (i.e., Ra’ui) on densities of juveniles (and subsequently, adults), with the
proportion of preferred substrate between Ra’ui and Control sites as covariates.
Siganus argenteus was omitted from the analysis of adults as although there were
adults at the Ra’ui sites (n = 8), there were no adults at Control sites.
RESULTS
Overall effects of Ra’ui
Fish
Of the 15 species selected for analysis, only one, Mulloidichthys flavolineatus, had
greater mean size in Ra’ui relative to Control sites (Table 4.1). A greater
proportion of larger individuals of M. flavolineatus and Stegastes nigricans were
present within Ra’ui sites relative to Control sites (Figures 4.1 and 4.2) (KS-test: M.
flavolineatus, D = 0.199, p < 0.0001; S. nigricans, D = 0.239, p = 0.024). Only one fish
species, Siganus argenteus, had a greater maximum size in Ra’ui relative to Control
sites (Table 4.1). There was also some evidence for Naso unicornis having greater
mean size in Ra’ui relative to Control sites (Table 4.1).
Non-significant size-distributions are presented in Appendix B, Figure 1 for
the 19 other fish species. It appears that a greater proportion of larger individuals
were present across Control sites than Ra’ui sites for Acanthurus triostegus, Naso
lituratus, Rhinecanthus aculeatus, Stetholjus bandanensis and Chlorurus sordidus
(Appendix B, Figure 1).
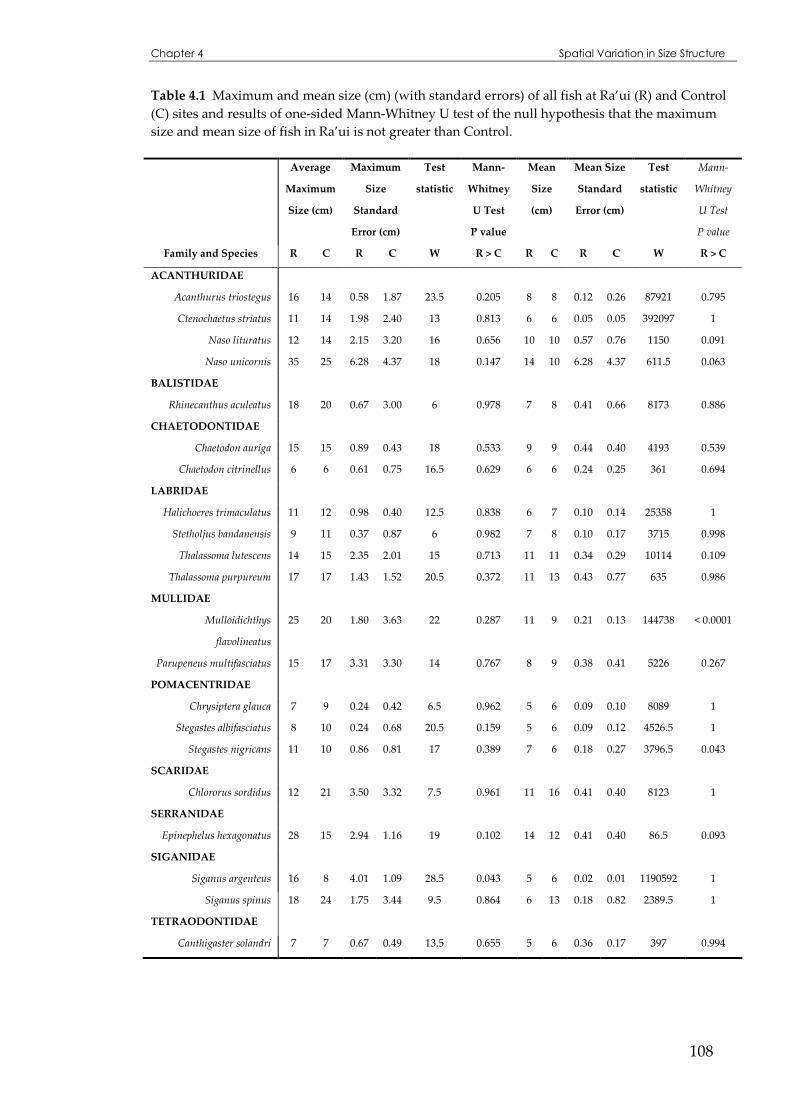
Chapter 4 Spatial Variation in Size Structure
108
Table 4.1 Maximum and mean size (cm) (with standard errors) of all fish at Ra’ui (R) and Control (C) sites and results of one-sided Mann-Whitney U test of the null hypothesis that the maximum size and mean size of fish in Ra’ui is not greater than Control.
Average
Maximum
Size (cm)
Maximum
Size
Standard
Error (cm)
Test
statistic
Mann-
Whitney
U Test
P value
Mean
Size
(cm)
Mean Size
Standard
Error (cm)
Test
statistic
Mann-
Whitney
U Test
P value
Family and Species R C R C W R > C R C R C W R > C
ACANTHURIDAE
Acanthurus triostegus 16 14 0.58 1.87 23.5 0.205 8 8 0.12 0.26 87921 0.795
Ctenochaetus striatus 11 14 1.98 2.40 13 0.813 6 6 0.05 0.05 392097 1
Naso lituratus 12 14 2.15 3.20 16 0.656 10 10 0.57 0.76 1150 0.091
Naso unicornis 35 25 6.28 4.37 18 0.147 14 10 6.28 4.37 611.5 0.063
BALISTIDAE
Rhinecanthus aculeatus 18 20 0.67 3.00 6 0.978 7 8 0.41 0.66 8173 0.886
CHAETODONTIDAE
Chaetodon auriga 15 15 0.89 0.43 18 0.533 9 9 0.44 0.40 4193 0.539
Chaetodon citrinellus 6 6 0.61 0.75 16.5 0.629 6 6 0.24 0.25 361 0.694
LABRIDAE
Halichoeres trimaculatus 11 12 0.98 0.40 12.5 0.838 6 7 0.10 0.14 25358 1
Stetholjus bandanensis 9 11 0.37 0.87 6 0.982 7 8 0.10 0.17 3715 0.998
Thalassoma lutescens 14 15 2.35 2.01 15 0.713 11 11 0.34 0.29 10114 0.109
Thalassoma purpureum 17 17 1.43 1.52 20.5 0.372 11 13 0.43 0.77 635 0.986
MULLIDAE
Mulloidichthys
flavolineatus
25 20 1.80 3.63 22 0.287 11 9 0.21 0.13 144738 < 0.0001
Parupeneus multifasciatus 15 17 3.31 3.30 14 0.767 8 9 0.38 0.41 5226 0.267
POMACENTRIDAE
Chrysiptera glauca 7 9 0.24 0.42 6.5 0.962 5 6 0.09 0.10 8089 1
Stegastes albifasciatus 8 10 0.24 0.68 20.5 0.159 5 6 0.09 0.12 4526.5 1
Stegastes nigricans 11 10 0.86 0.81 17 0.389 7 6 0.18 0.27 3796.5 0.043
SCARIDAE
Chlororus sordidus 12 21 3.50 3.32 7.5 0.961 11 16 0.41 0.40 8123 1
SERRANIDAE
Epinephelus hexagonatus 28 15 2.94 1.16 19 0.102 14 12 0.41 0.40 86.5 0.093
SIGANIDAE
Siganus argenteus 16 8 4.01 1.09 28.5 0.043 5 6 0.02 0.01 1190592 1
Siganus spinus 18 24 1.75 3.44 9.5 0.864 6 13 0.18 0.82 2389.5 1
TETRAODONTIDAE
Canthigaster solandri 7 7 0.67 0.49 13.5 0.655 5 6 0.36 0.17 397 0.994

Chapter 4 Spatial Variation in Size Structure
109
Figure 4.1. Length-frequency distribution for the reef fish, Mulloidichthys flavolineatus, across Ra’ui and Control sites.
Standard length (cm)
Fre
quen
cy
Control
Ra’ui
0 5 10 15 20 25 30
0.0
0.2
0.4
0.6
0.8
0 5 10 15 20 25 30
0.0
0.2
0.4
0.6
0.8
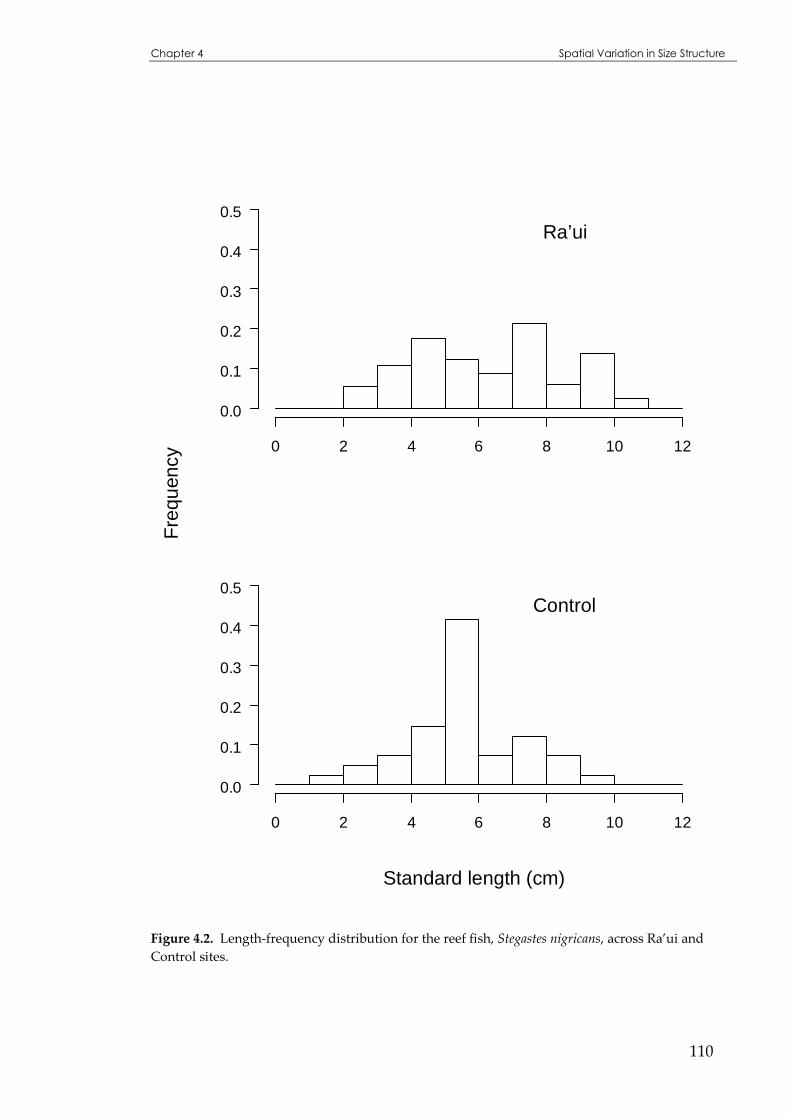
Chapter 4 Spatial Variation in Size Structure
110
Figure 4.2. Length-frequency distribution for the reef fish, Stegastes nigricans, across Ra’ui and Control sites.
Standard length (cm)
Fre
quen
cy
Control
Ra’ui
0 2 4 6 8 10 12
0.0
0.1
0.2
0.3
0.4
0.5
0 2 4 6 8 10 12
0.0
0.1
0.2
0.3
0.4
0.5

Chapter 4 Spatial Variation in Size Structure
111
Invertebrates
Lagoon
Two of the 12 invertebrate species selected for analysis (the urchins Echinometra
mathaei and Tripneustes gratilla), had greater mean size across Ra’ui relative to
Control sites (Table 4.2). Size distributions for E. mathaei and T. gratilla are
presented in Figures 4.3 and 4.4 (KS-test: E. mathaei, D = 0.144, p < 0.0001; T.
gratilla, D = 0.278, p = 0.005). Size-distributions are presented in Appendix B,
Figure 2 for the 10 other lagoon invertebrate species.

Chapter 4 Spatial Variation in Size Structure
112
Table 4.2 Maximum and mean size (cm) (with standard errors) of all lagoon invertebrates at Ra’ui (R) and Control (C) sites and results of one-sided Mann-Whitney U test of the null hypothesis that the maximum and mean invertebrate size in Ra’ui is not greater than Control.
Maximum
Size (cm)
Maximum
Size
Standard
Error (cm)
Test
statistic
Mann-
Whitney
U Test
P value
Mean
Size
(cm)
Mean Size
Standard
Error (cm)
Test
statistic
Mann-
Whitney
U Test
P value
Family and Species R C R C W R > C R C R C W R > C
DIADEMATIDAE
Diadema savignyi 10 9 0.00 1.11 6 0.587 8 9 0.13 0.37 1041 0.984
Echinothrix diadema 8 7 1.69 1.77 15 0.335 8 7 0.18 0.65 630 0.306
ECHINOMETRIDAE
Echinometra mathaei 7 7 0.48 0.24 12 0.858 3 3 0.03 0.02 3820731 <0.0001
Echinometra oblonga 3 5 1.44 0.97 3 0.995 2 3 0.85 0.39 50 0.969
TOXOPNEUSTIDAE
Tripneustes gratilla 9 9 0.98 0.85 7.5 0.771 9 8 0.11 0.19 3810 <0.0001
HOLOTHURIIDAE
Actinopyga mauritiana 24 18 0.33 8.50 3 0.617 14 17 1.08 4.93 33 0.722
Holothuria atra 31 29 1.11 1.54 26.5 0.097 13 14 0.06 0.06 10531885 1
STICHOPODIDAE
Stichopus chloronotus 23 24 0.92 1.99 12 0.743 12 14 0.17 0.30 53877 1
OPHIDIASTERIDAE
Linckia laevigata 31 28 4.58 3.60 8.5 0.440 24 25 1.77 1.23 152 0.825
TRIDACNIDAE
Tridacna species 12 12 1.25 1.95 19.5 0.436 9 7 0.45 0.49 2314 0.089
TROCHIDAE
Trochus niloticus 8 7 1.59 1.16 14.5 0.163 4 4 0.09 0.29 4624 0.516
VERMETIDAE
Dendropoma maxima 2 2 0.24 0.08 16.5 0.146 2 2 0.05 0.06 1523 0.588

Chapter 4 Spatial Variation in Size Structure
113
Figure 4.3 Size-frequency distributions for Echinometra mathaei across lagoon Ra’ui and Control sites.
Standard length (cm)
Fre
quen
cy
0 2 4 6 8 10
0.0
0.1
0.2
0.3
0.4
0 2 4 6 8 10
0.0
0.1
0.2
0.3
0.4Control
Ra’ui

Chapter 4 Spatial Variation in Size Structure
114
Figure 4.4 Size-frequency distributions for Tripneustes gratilla across lagoon Ra’ui and Control sites.
Standard length (cm)
Fre
quen
cy
Control
Ra’ui
0 5 10 15
0.0
0.1
0.2
0.3
0.4
0 5 10 15
0.0
0.1
0.2
0.3
0.4

Chapter 4 Spatial Variation in Size Structure
115
Outer Strata
The urchins, Echinothrix diadema, Echinometra oblonga, and the gastropod, Trochus
niloticus, had statistically greater mean sizes in the Ra’ui relative to Control sites
(Table 4.3, Figures 4.5, 4.6 and 4.7) (KS-test: E. diadema, D = 0.224, p < 0.0001; E.
oblonga, D = 0.361, p < 0.0001; T. niloticus, D = 0.207, p = 0.005). There was also
some evidence for Holothuria atra having greater mean size in Ra’ui relative to
Control sites (Table 4.3). Stichopus chloronotus was not encountered at Ra’ui sites
but was present within both sampled Control sites (Table 4.3). Non-significant
size-distributions are presented in Appendix B, Figure 3 for the 6 other reef-crest
invertebrate species.

Chapter 4 Spatial Variation in Size Structure
116
Table 4.3 Maximum and mean size (cm) (with standard errors) of all reef crest invertebrates at Ra’ui (R) and Control (C) sites and results of one-sided Mann-Whitney U test of the null hypothesis that the maximum size and mean size of reef crest invertebrates in Ra’ui is not greater than Control.
Average
Maximum
Size (cm)
Mean
Size (cm)
Mean Size
Standard
Error (cm)
Test
statistic
Mann-Whitney U Test
P value
Family and Species R C R C R C W R > C
DIADEMATIDAE
Echinothrix diadema 9 10 7 6 0.07 0.09 63017 <0.0001
ECHINOMETRIDAE
Echinometra mathaei 5 5 2 3 0.02 0.03 676775 1
Echinometra oblonga 4 3 2 1 0.03 0.03 282863 <0.0001
Heterocentrotus mammillatus 4 3 3 3 0.22 0.30 41 0.734
HOLOTHURIIDAE
Actinopyga mauritiana 26 25 15 15 0.53 0.56 3250 0.801
Holothuria atra 29 26 16 15 0.49 0.51 8736 0.077
STICHOPODIDAE
Stichopus chloronotus - 20 - 9 - 0.50 - Present in Control only
TROCHIDAE
Trochus niloticus 12 12 9 9 0.09 0.25 14420 0.036
TURBINIDAE
Turbo setosus 4 4 3 3 0.14 0.22 261 0.267
Note: To calculate maximum size in the above table, sites were replicates. At the reef-crest I was only able to sample two sites (n = 2). Therefore, standard errors could not be calculated. In addition, the Mann-Whitney U test of the difference between maximum size between Ra’ui and Control could not be carried out.

Chapter 4 Spatial Variation in Size Structure
117
Figure 4.5 Size-frequency distributions for Echinothrix diadema, across reef-crest Ra’ui and Control sites.
Standard length (cm)
Fre
quen
cy
Control
Ra’ui
0 5 10 15
0.0
0.1
0.2
0.3
0.4
0 5 10 15
0.0
0.1
0.2
0.3
0.4

Chapter 4 Spatial Variation in Size Structure
118
Figure 4.6 Size-frequency distributions for Echinometra oblonga across reef-crest Ra’ui and Control sites.
Standard length (cm)
Fre
quen
cy
Control
Ra’ui
0 2 4 6 8 10
0.0
0.2
0.4
0.6
0.8
0 2 4 6 8 10
0.0
0.2
0.4
0.6
0.8
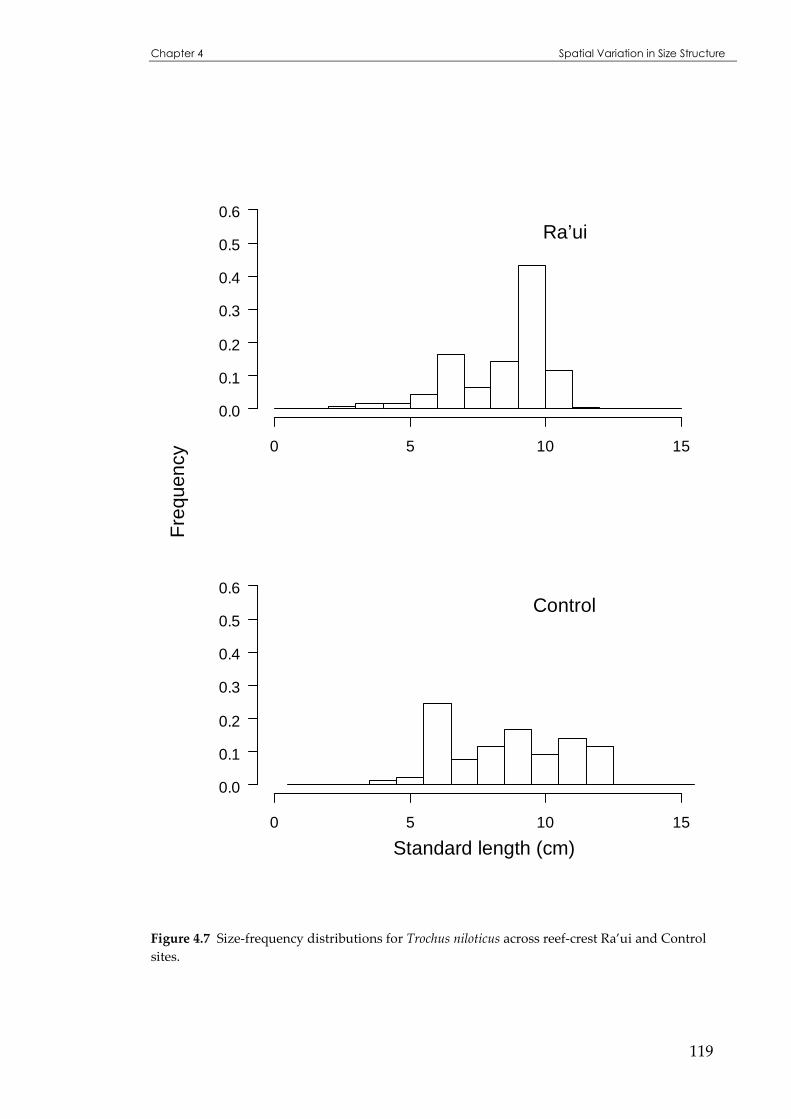
Chapter 4 Spatial Variation in Size Structure
119
Figure 4.7 Size-frequency distributions for Trochus niloticus across reef-crest Ra’ui and Control sites.
Standard length (cm)
Fre
quen
cy
Control
Ra’ui
0 5 10 15
0.0
0.1
0.2
0.3
0.4
0.5
0.6
0 5 10 15
0.0
0.1
0.2
0.3
0.4
0.5
0.6

Chapter 4 Spatial Variation in Size Structure
120
Relationship between habitat and size structure across sites
PERMANOVA was carried out with level of protection (i.e., Ra’ui versus Control)
as a factor and the proportion of each of the 7 substrate types present at each site
as covariates. No significant difference was observed for level of protection on the
size-frequency distributions of any of the five common fish species, Acanthurus
triostegus, Ctenochaetus striatus, Mulloidichthys flavolineatus, Chlorurus sordidus, or
Siganus argenteus. However, the proportion of substrate cover at each site, was
significant in determining the size-distribution of Acanthurus triostegus (df = 7, F =
6.5, p = 0.04).
Ontogenetic shifts in habitat use
Based on the information from available literature, size at maturity was estimated
for 5 fish species (Table 4.4) and island-wide habitat use was estimated for each
species (Figure 4.8). Substrate use was significantly different between juveniles
and adults of each species (Figure 4.8). Juvenile Acanthurus triostegus mostly used
rubble but adults predominantly used dead coral. The other Acanthurid,
Ctenochaetus striatus, appeared to use both dead and live coral, with adults using
dead and live coral but also turf algae (Figure 4.8). Juveniles of Chlorurus sordidus
mostly used rubble and dead coral with adults largely using dead coral and sand
(Figure 4.8). Sand, rubble and pavement were used by juveniles of Mulloidichthys
flavolineatus with adults using proportionately higher amounts of sand than
juveniles. Juveniles of Siganus argenteus used a wider range of substrate types (5
substrate types) than adults which used only two substrate types (dead coral and
sand) (Figure 4.8).

Chapter 4 Spatial Variation in Size Structure
121
Table 4.4 Estimated size (standard length (SL)) at maturity of five lagoon reef fish species, with source references.
Scientific Name Size (SL) at Maturity (cm) Reference
Acanthurus triostegus 6 Murty 2002
Ctenochaetus striatus 14 Choat and Robertson 2002
Mulloidichthys flavolineatus 11 Myers 1999
Chlorurus sordidus 13 Murty 2002, Gust 2004
Siganus argenteus 20 Myers 1999
Figure 4.8 Island-wide habitat use indicated by Manly’s alpha for juveniles (J) and adults (A) of 5 common lagoon fish species. P-values given above each pair of bars are generated from randomisation tests with values of p < 0.05 indicating that juveniles and adults of the same species do not have the same substrate usage. . = turf algae, = sand, = rubble, = pavement, = other algae, = dead coral, = coral.
0.0
0.1
0.2
0.3
0.4
0.5
0.6
0.7
0.8
0.9
1.0
J A J A J A J A J A
Acanthurustriostegus
Chlorurussordidus
Ctenochaetusstriatus
Mulloidichthysflavolineatus
Siganusargenteus
< 0.0001 < 0.0001 0.006 < 0.0001 0.012
Man
ly’s
alph
a cu
mul
ativ
e fr
eque
ncy

Chapter 4 Spatial Variation in Size Structure
122
Analysis of covariance (ANCOVA) suggested that protection was not significant
in determining the abundances of juvenile Acanthurus triostegus. However, there
was a statistically significant positive relationship between the proportion of
preferred substrate cover and the density of juveniles (y = -2.79 + 8.897(x), n = 12,
R2 = 0.44, p = 0.011) (Figure 4.9). Non-significant interaction terms were removed
from all ANCOVA models (see Engqvist 2005 for discussion). Protection was
significant for Chlorurus sordidus, with a significant interaction between protection
and substrate but no significant effect of substrate (Ra’ui: y = 8.632 – 6.637(x), n = 6,
R2 = 0.43, p = 0.093; Control: y = -5.162 + 13.919(x), n = 6, R2 = 0.75, p = 0.017) (Figure
4.9). There was a significant positive relationship between the proportion of
preferred substrate cover and densities of juvenile C. sordidus in Ra’ui, but this
relationship was significantly negative at Control sites. Neither protection nor
substrate were significant in determining juvenile abundances for Ctenochaetus
striatus, Mulloidichthys flavolineatus, or Siganus argenteus (Figure 4.9).

Chapter 4 Spatial Variation in Size Structure
123
Figure 4.9 The relationship between density (square-root transformed) of juvenile fish and total proportion cover of preferred substrate cover (arcsine transformed) for 5 lagoon fish species for Ra’ui (�) and Control (�). Results of ANCOVA are displayed on each panel. Where statistically significant, regression lines have been fitted (univariate regression = ―, Ra’ui = -----, Control = -—).
0.0 0.5 1.0 1.5
0
5
10
15
0.0 0.5 1.0 1.5
0
5
10
15
20
0.0 0.5 1.0 1.5
0
5
10
15
0.0 0.5 1.0 1.5
0
5
10
15
0.0 0.5 1.0 1.5
0
10
20
30
40
Acanthurus triostegus Ctenochaetus striatus
Mulloidichthys flavolineatus Chlorurus sordidus
Siganus argenteus
Protection nsSubstrate * Protection ns
Substrate ns
Protection nsSubstrate ns
Protection **Substrate nsProtection X Substrate **
Protection nsSubstrate ns
Transformed Proportion Substrate Cover
Tra
nsfo
rmed
Den
sity
(no
/m2 )

Chapter 4 Spatial Variation in Size Structure
124
ANCOVA suggested that level of protection was not significant in determining
adult densities for Acanthurus triostegus, or Ctenochaetus striatus but there were
statistically significant positive relationships between the proportion preferred
substrate cover and the density of adults for both fish (Acanthurus triostegus: y = -
4.703 + 21.786(x), n = 12, R2 = 0.46, p = 0.009; Ctenochaetus striatus: y = -1.218 +
4.85(x), n = 12, R2 = 0.43, p = 0.035) (Figure 4.10). Protection and substrate were
significant in determining adult densities for Mulloidichthys flavolineatus. The
relationship between the proportion of preferred substrate cover and adult M.
flavolineatus densities at both Ra’ui and Control sites was negative (Ra’ui: y = -
19.942 + 22.694(x), n = 6, R2 = 0.49, p = 0.074; Control: y = -2.052 + 3.586(x), n = 6, R2 =
0.15, p = 0.448) (Figure 4.10). There was also a significant interaction between
substrate and protection. However, this interaction may be driven by a single site,
which if excluded, would likely result in no real pattern. Neither protection nor
substrate was significant in determining abundances for Chlorurus sordidus adults
(Figure 4.10).

Chapter 4 Spatial Variation in Size Structure
125
0.0 0.5 1.0 1.5
0
5
10
15
20
0.0 0.5 1.0 1.5
0
1
2
3
4
5
0.0 0.5 1.0 1.5
0
5
10
15
0.0 0.5 1.0 1.5
0
5
10
15
Acanthurus triostegus Ctenochaetus striatus
Mulloidichthys flavolineatus Chlorurus sordidus
Protection nsSubstrate *
Protection *Substrate *Protection X Substrate *
Protection nsSubstrate ns
Protection nsSubstrate *
Transformed Proportion Substrate Cover
Tra
nsfo
rmed
Den
sity
(no
/m2 )
Figure 4.10 The relationship between density (square-root transformed) of adult fish and total proportion cover of preferred substrate (arcsine transformed) for 4 lagoon fish species for Ra’ui (�) and Control (�). ANCOVA results are displayed on each panel. Where statistically significant, regression lines have been fitted (univariate regression = ―, Ra’ui = -----, Control = -—).

Chapter 4 Spatial Variation in Size Structure
126
DISCUSSION
Overall effects of Ra’ui: fish and invertebrates
Siganus argenteus was the only fish species that exhibited greater maximum size
across Ra’ui, consistent with my a priori expectation of greater maximum size of
fish in Ra’ui relative to corresponding Control sites. S. argenteus is a food fish
(McCormack 2007) that is likely still harvested, and it is possible there is an effect
of Ra’ui contributing to its greater maximum size. The size distribution for S.
argenteus clearly indicated there was a small proportion of larger fish
(approximately 20cm standard length) in the Ra’ui that were not present at
Control sites (Appendix B, Figure 1). Although S. argenteus is a roving herbivore
(Diamant 1989) usually seen in small aggregations (Randall 2005), and is likely to
easily move between Ra’ui and non-Ra’ui areas, my results provide some evidence
supporting harvested fish reaching greater maximum sizes in protected areas.
Across all Ra’ui, only one fish species, the goatfish, Mulloidichthys
flavolineatus, met my a priori expectation of fished species having a significantly
greater mean size in the Ra’ui than at Control sites. Site fidelity could be the
primary reason why M. flavolineatus was the only fish to exhibit greater mean size
in Ra’ui. Holland et al. (1993) used ultrasonic telemetry to track individual M.
flavolineatus and found M. flavolineatus had strong site fidelity and a restricted
home range. Blythe-Skyrme et al. (2006) contrasted areas under conventional
fisheries management controls with an area under towed-fishing gear restrictions
(a form of MPA) and found that fish with low site-fidelity gained few benefits
from the MPA. Correspondingly, Malvadkar and Hastings (2008) suggested
reserves are appropriate for mobile species if they have at least one of the
following qualities; small movement rates, high birth rates to fishing rates, or large
habitat sizes. The lack of clear evidence of size increases in the Raúi by the other
fish species I examined suggests that these species may have lower site fidelity
than M. flavolineatus.

Chapter 4 Spatial Variation in Size Structure
127
Although M. flavolineatus is considered to be moderately vulnerable to fishing
(Froese and Pauly 2008), previous work has found that the growth rate of M.
flavolineatus is such that preventing the harvest of the fish for three years would
produce a ‘marketable product’ (i.e., fish standard length ~ 24cm) (Holland et al.
1993). M. flavolineatus has a relatively short population doubling time of 1.4 – 4.4
years (Froese and Pauly 2008), so it is possible that even with relatively short
periods of protection from harvest, effects of protection such as increased size in
Ra’ui relative to Control sites may be observed.
Although not statistically significant, there was also some evidence to
indicate that Naso unicornis may have greater mean size in Ra’ui relative to Control
sites. N. unicornis is a prized food fish in the Cooks Islands (McCormack 2007),
and commonly targeted elsewhere in the Pacific by fishers (Meyer 2003). A
tagging study by Meyer and Holland (2005) found that N. unicornis were site-
attached to home-ranges within the boundaries of a small Hawaiian marine
reserve (32 ha). As with Mulloidichthys flavolineatus, site fidelity may be why N.
unicornis mean size was greater in Ra’ui than at Control sites. The Ra’ui on
Rarotonga range between 3.3 and 47 hectares, and the size of the Ra’ui (for
example Akapuao (35 ha) and Aroko (47 ha), and Aroa (16 ha)) may be adequate
to encompass the home-range of N. lituratus and provide protection from any
fishing.
The other fish species to have a significantly greater mean size in Ra’ui was
the highly territorial Stegastes nigricans. However, S. nigricans is not known to be
fished in Rarotonga (it is a small, highly territorial, aggressive damselfish reaching
maximum lengths of 13cm standard length (Lieske and Myers 2002, Randall
2005)). A cohort of similar-sized individuals appeared to drive the difference in
size distributions between Ra’ui and Control sites for S. nigricans. This cohort
could be a recruitment pulse signal that has persisted in the Control but not the
Ra’ui, with predator / prey interactions one explanation for the reduced size of the
cohort in Ra’ui. There were significantly greater numbers of carnivorous fishes in

Chapter 4 Spatial Variation in Size Structure
128
two Ra’ui (Parliament and Tikioki) which may have led to increased predation on
juvenile S. nigricans.
Two lagoon invertebrates, only one of which is a harvested species
(Tripneustes gratilla) had significantly greater mean size in Ra’ui relative to Control
sites. Three reef-crest invertebrate species, two of which are known to be
harvested (Echinothrix diadema and Trochus niloticus), also had significantly greater
mean size within Ra’ui relative to reference sites. Four of the five invertebrate
species with greater mean size in the Ra’ui than at corresponding Control sites
were echinoderms. The sea cucumber, Holothuria atra, also had a trend of
increased size in the Ra’ui relative to corresponding Control sites. In comparison
to the fish sampled in this study, invertebrates had greater numbers of species
exhibiting increased mean size in the Ra’ui relative to Control sites. This result
may be due to disparities between the levels of invertebrate harvest and the levels
of fish harvested from the lagoon. Invertebrates are still harvested in the lagoon of
Rarotonga but rates of harvest for fish may be much lower than invertebrates,
especially due to the presence of ciguatera in the lagoon of Rarotonga (Drumm
2004, Moore 2006, SPC 2007, pers. obs.) As already discussed in Chapter 3, if little
or no fishing for a species occurs outside Raúi, then there may not be any observed
Raúi effect for that species. Results here for invertebrates are also consistent with
Parnell et al. (2005) who suggest that reserves may be more effective for more
sessile or site-attached species (see Chapter Three for brief discussion). Further,
the greater mean sizes for three of the invertebrate species at the outer strata may
indicate that harvesting of some invertebrate species such as Trochus niloticus and
the long-spine sea urchin, Echinothrix diadema, predominantly occurs on the reef-
crest where these species may be easier to access and are found in greater
abundances. Other harvested species such as the urchin, Tripneustes gratilla, are
predominantly found in the lagoon.
The marine gastropod, Trochus niloticus, is not generally harvested for food
in the Pacific Islands region, however there is a market for its shell (Drumm 2004).

Chapter 4 Spatial Variation in Size Structure
129
Trocus niloticus had a significantly greater mean size in Ra’ui with this pattern
appearing to be driven by a single cohort of similar-sized individuals (90 mm
basal area). This cohort could be a recruitment pulse signal that has persisted in
Ra’ui but not at Control sites. T. niloticus are broadcast spawners and recruitment
can be affected due to an allee effect if the parent stock drops below a certain
density (Bour 1990). However, as the planktonic phase of T. niloticus can last for
more than a week, larval T. niloticus are likely to be distributed and settle in areas
distant from where spawning occurred i.e., both Ra’ui and non-Ra’ui sites. As
only two reef-crest sites (Parliament and Matavera) were able to be sampled in this
study due to sea conditions, the observed pattern in the size distribution of T.
niloticus may signal the period since these two Ra’ui were last closed
(approximately 4½ to 5 years prior to my surveys), and indicates that Ra’ui are
effective for T. niloticus.
The sea cucumber, Stichopus chloronotus, was only found at Control sites
and not Ra’ui on the reef-crest. Lincoln-Smith et al. (2006) found that there was no
effect of a marine conservation area on the abundance of the sea cucumber, S.
chloronotus. In addition, the cryptic nature of many juvenile holothurians may
decrease the likelihood of detecting increasing size or abundances following
implementation of a protected area (Lincoln-Smith et al. 2006). It is also possible
that predator-prey interactions specific to Ra’ui sites may be occurring on the reef-
crest that may be suppressing S. chloronotus abundances in Ra’ui, however
predation on adult holothurians is thought to be rare (Bakus 1973).
The response of fish and invertebrates to protection can depend on the life-
history of the animal, and as a consequence, can vary among species. Perhaps this
provides some explanation for my observation of so few statistically significant
increases in size for any of the species included in my data analysis. For example,
Tuya et al. (2006) surveyed two MPAs and found differences in biomass were
species-specific across four fished species. Invertebrate species also have
differential responses to marine protection. Lincoln-Smith et al. (2006) noted that a

Chapter 4 Spatial Variation in Size Structure
130
wide-range of factors such as generation time, degree of prior fishing pressure,
and reserve location and size, play a role in the length of time it takes a species to
respond to protection from harvest. However, low statistical power may have
been the reason I was unable to detect any significant differences in the mean or
maximum sizes for many of the fish and inverterbrates between Ra’ui and Control
sites. Low statistical power to detect changes in the abundance and size of less
common species is one of the disadvantages of underwater visual census of coral
reef multispecies assemblages (English et al. 1997).
Relationship between habitat and size structure across sites
Substrate heterogeneity may alter interpretations of Ra’ui (and MPA) effects for
fish abundances (see Chapter 2 for discussion regarding relationships between fish
abundance and habitat). There is also evidence that habitat influences the size
structure of fish populations (Jennings et al. 1996a, Chapman and Kramer 1999,
Chateaux and Wantiez 2005). Yet when I incorporated substrate heterogeneity for
five fish species into the analysis of size-frequency distributions (indicated by 25th,
50th, 75th, and 95th percentiles), substrate was significant in determining the size-
distribution for only one fish species, Acanthurus triostegus. This result could
indicate that substrate use may not be as tightly coupled with size as it is with fish
densities, and provides some support for not incorporating substrate into the
analysis of mean fish and invertebrate size between Ra’ui and Control sites. In
addition, habitat on the reef crest did not differ significantly between Ra’ui and
Control sites for the reef crest invertebrates (see Chapter 3) so substrate
heterogeneity is unlikely to be a confounding factor for the size-structure of the
reef-crest invertebrates in my analyses.
My results demonstrating significantly different habitat use between
juveniles and adults of each of the five abundant fish species agrees with work
showing ontogenetic habitat shifts in temperate and tropical fish (MacPherson
1998, Lecchini and Galzin 2005). Lecchini and Galzin’s (2005) work on tropical
Chapter 4 Spatial Variation in Size Structure
131
reef fish in Moorea, French Polynesia, provides evidence of ontogenetic shifts from
juvenile to adult habitats occurring for four of the five species I focussed on:
Acanthurus triostegus, Chlorurus sordidus, Ctenochaetus striatus, and Mulloidichthys
flavolineatus. However, Lecchini and Galzin’s (2005) work focussed on ‘seascapes’
which are distinct habitat zones, whereas my work focuses on individual substrate
types. This difference in spatial resolution between Lecchini and Galzin’s (2005)
study and my study makes comparisons of the habitat use of juveniles and adults
of each species difficult. However, my results provide some evidence in support
of ontogenetic shifts in habitat use occurring between juvenile and adults for some
species, and add some weight to the suggestion that habitat supporting all life-
history stages for a species, or suite of species, should be incorporated into MPAs
(Gillanders et al. 2003, PISCO 2007).
I had expected that there would be a relationship between the proportion of
preferred substrate cover and juvenile fish densities for both Ra’ui and Control
sites. Similarly, I also expected a relationship between the proportion of preferred
substrate cover and adult fish densities for Ra’ui and Control sites. However, this
relationship only occurred in Chlorurus sordidus juveniles in Control sites. Some
species exhibited non-significant trends of increasing density with increases in the
proportion of preferred substrate. For example, even though protection was not
significant in determining Acanthurus triostegus densities, the proportion of
preferred substrate may play a role in determining densities for this species.
These results regarding relationships between the proportion of preferred
substrate cover and juvenile fish densities may indicate that proportion of
preferred substrate may limit juvenile fish densities for some species.
Of the adult fish, only the goatfish, Mulloidichthys flavolineatus, had
increased densities with increasing proportion of preferred substrate cover, and
only in the Ra’ui. Acanthurus triostegus and Ctenochaetus striatus densities
increased with increasing proportion of preferred substrate cover, but protection
was not significant in determining densities. The parrotfish, Chlorurus sordidus,

Chapter 4 Spatial Variation in Size Structure
132
showed a non-significant trend towards increased densities with increasing
proportion of preferred substrate cover. Again, as with the juvenile fish (and
consistent with work associating abundance with habitat types in Chapter 2), the
trends observed for three of the adult species in my analysis (increasing density
with increasing proportion of preferred substrate cover), may indicate that adult
fish may be limited by substrate regardless of protection. My results for substrate
use by juvenile and adults add weight to protecting a range of habitat types for all
life-history stages.
Level of fishing
I found little evidence for significant increases in mean size and size distributions
in Ra’ui. This finding was inconsistent with my expectations of increased size
with protection from fishing. Fishing pressure at corresponding Control sites may
not be high enough for any Ra’ui effects to be detected, or conversely, there may
be non-compliance with Ra’ui. As previously mentioned in Chapter Three, there
is scant information about fishing around Rarotonga. However, while fishing in
the lagoon still occurs, it is at a level lower than two decades ago (Moore 2006).
Fishing occurs primarily for invertebrates rather than fish (Moore 2006, SPC 2007).
As such, invertebrates are more likely to exhibit a response to Ra’ui, if compliance
with Ra’ui is good (pers. obs, Moore 2006, SPC 2007).
Other factors influencing size
As discussed in Chapter Three, other processes such as trophic interactions may
obscure and / or confound MPA effects. Disturbances such as cyclones, which can
result in high juvenile mortality and the redistribution of sub-adult fish (Lassig
1983), and recruitment that may vary among sites within years (Williams and Sale
1981) may also influence size structure for some fish and invertebrates around
Rarotonga. In addition, temporal variation, including growth of some fish and
invertebrates over the sampling period, may have reduced the statistical power to
detect patterns of variation in size for fish and invertebrates in my data. This is
Chapter 4 Spatial Variation in Size Structure
133
unlikely however, as sampling of sites / strata was randomised over time to
reduce any potential biases arising from sampling over a number of months and
tidal cycles.
CONCLUSIONS
Site fidelity of fish and invertebrates appears to play an important role in
determining the response of fish and invertebrates to MPAs (Kramer and
Chapman 1999). This is evidenced by my observation of increased mean size in
Raúi for relatively sessile harvested invertebrates (e.g., Echinothrix diadema, Trochus
niloticus, and Tripneuestes gratilla), and a fish with high site fidelity (e.g.,
Mulloidichthys flavolineatus). One important implication of greater body size is the
associated higher fecundity of larger individuals and the potential to provide
more recruits into the population. Processes other than fishing mortality, such as
predation, competition, and recruitment fluctuations (Jones et al. 1991, Warner
1991), will also be contributing to the size structure of fish and invertebrate
populations. The variability associated with processes such as fluctuations in
recruitment makes it difficult to ascertain the effectiveness of MPAs in enhancing
the size of fish and invertebrates. In Chapter 5, I will discuss reasons why some
Ra’ui appear to be more effective than others in increasing abundance and size of
organisms within their boundaries.
134
CHAPTER 5: Are some Ra’ui more effective than
others? Site specific analyses of Ra’ui
effects
ABSTRACT
In Chapter 3 I demonstrated that the effects of Ra’ui on fish and invertebrate
densities vary in both extent and magnitude. In this Chapter I assess the
effectiveness of 6 Ra’ui around Rarotonga using three separate metrics of
effectiveness for local assemblages of fish and invertebrates; the proportion of fish
and invertebrates exhibiting 1) greater densities, 2) greater mean size, and 3)
greater maximum size in Ra’ui relative to corresponding Control sites. The results
for individual Ra’ui effectiveness indicate that of the 6 Raúi, Parliament Ra’ui had
the highest proportion of fish and invertebrate species with greater densities
(0.41), and greater maximum size (0.64) inside Raúi relative to corresponding
Control sites while Aroa Ra’ui had the highest proportion of fish and invertebrate
species with greater mean size (0.39), relative to corresponding Control sites.
Tikioki Ra’ui had the lowest proportion of species with greater densities (0.03) in
the Ra’ui, while Aroko and Akapuao Ra’ui had the lowest proportion of species
with greater mean size in the Ra’ui (0.00), relative to corresponding Control sites.
Akapuao Ra’ui had the lowest proportion of fish and invertebrate species with
greater maximum size (0.22) inside Ra’ui relative to corresponding Control sites. I
used stepwise backward multiple regressions to assess the influence of Ra’ui
characteristics (Ra’ui size (ha), density of fish in Ra’ui, distance from Ra’ui to reef-
crest , and the human population in the vicinity of the Ra’ui) as predictors of fish
and invertebrate responses to Ra’ui. The effectiveness of Ra’ui in enhancing mean
fish and invertebrate size was best predicted by Ra’ui area and total fish density in
each Ra’ui (coefficients of both predictor variables were negative, R2 = 0.86,

Chapter 5 Ra’ui Effectiveness
135
F = 16.05, p = 0.03). Multiple regressions of Ra’ui characteristics were not
significant in predicting the effectiveness of Ra’ui with respect to fish and
invertebrate densities or maximum size. I speculate that good compliance due to
Ra’ui visibility may explain why some Ra’ui appear to be more effective in
enhancing fish and invertebrate densities, mean size, and maximum size, while
predator-prey interactions and Ra’ui shape may explain the apparent
ineffectiveness of some Ra’ui in enhancing fish and invertebrate densities.
Density-dependent effects occurring within Ra’ui and Ra’ui size seem to
contribute to variation in putative effects of Ra’ui on mean fish and invertebrate
size. These patterns may have important implications for the future design of
MPAs.

Chapter 5 Ra’ui Effectiveness
136
INTRODUCTION
Increases in density, size, diversity and biomass of fish and invertebrates within
MPA boundaries are metrics that have been commonly used to assess the
effectiveness of MPAs (Halpern 2003). However, recent meta-analyses of MPA
effects and studies of focal MPAs have shown that the effects of protection are not
universal, and have concluded that MPA effects vary in both extent and
magnitude (Côté et al. 2001, Halpern and Warner 2002, Samoilys et al. 2007).
In Chapter Three I demonstrated that fish and invertebrate abundances had
variable responses to protection across the 6 Ra’ui I surveyed, even when the
confounding effects of substrate heterogeneity between Ra’ui and Control sites
were factored out in my analyses. The variable responses of fish and invertebrate
abundances to Ra’ui from Chapter Three suggest that Ra’ui may also variably
affect sizes of fish and invertebrates within them.
Understanding the characteristics of marine protected areas (MPAs) that
underpin their effectiveness can assist with future MPA design. However, there is
contradictory evidence for the effects of MPA size and age on MPA performance
(Côté et al. 2001, Halpern and Warner 2003, Claudet et al. 2008). In a meta-analysis
of the effects of marine reserve characteristics on fish populations, Côté et al. (2001)
found no correlation between the response to protection in terms of changes in
fish abundance and diversity, and any of the reserve characteristics examined (i.e.
size, age, latitude of the reserve, and total fish diversity). Halpern (2003) also
found that the effects of MPAs on density and biomass were independent of
reserve size. However, a more recent meta-analysis found that the response of
commercial fish species was dependent on reserve size with a 35% increase in the
density of commercial fishes with every 10-fold increase in the size of the no-take
zone (Claudet et al. 2008).
Accordingly, there may be some characteristics of Ra’ui in Rarotonga that
may contribute to some being more effective than others. Characteristics such as
the size of the Ra’ui, food supply, level of fishing pressure outside the Ra’ui (see

Chapter 5 Ra’ui Effectiveness
137
Chapter Three discussion), and density-dependent effects in the Ra’ui may
contribute to Ra’ui effectiveness.
Food supply may contribute to the effectiveness of Ra’ui. Experimental
studies have certainly demonstrated that food supply can affect the growth of fish
(Jones 1986, Forrester 1990). Further, recent modelling efforts suggest that MPAs
should be sited in areas where food is concentrated, for example, upwelling
regions (Martell et al. 2005). On coral reefs, wave action often moves nutrient-
containing waters across barrier reef systems and into downstream lagoons
(Glynn 1973, Munro and Williams 1985, Wolanski and Delesalle 1995, Andrefouet
et al. 2001, Dominici-Arosemena and Wolff 2005, Hamner et al. 2007).
Consequently, the siting of Ra’ui in areas that receive more nutrients than other
areas may contribute to increased growth of organisms. In this study, I use the
distance from the shore of the Ra’ui to the reef crest as a proxy for food availability
and predictor of Raúi effectiveness. Other studies have found that the level of
exposure (e.g., waves) can shape reef assemblages (Friedlander et al. 2003, Micheli
et al. 2005). However, these studies did not discuss the role that exposure plays in
moving nutrients across the reef flat into the lagoon.
Total fish density may also contribute to Ra’ui effectiveness, particularly as
measured by changes in mean size of organisms. To investigate whether the
overall fish density within Ra’ui contributes to Ra’ui effectiveness (e.g., via
density-dependent growth mechanisms), I use total fish density (no./m2) in each
Ra’ui as a predictor of Raúi effectiveness. The best established evidence for
density-dependent responses in marine organisms is exhibited by growth rates: a
large number of studies have demonstrated compensatory density-dependence
via increased growth rates of individuals at low densities (see Sanchez-Lisazo et al.
2000 for discussion). However, very few studies have attempted to evaluate
whether density-dependent changes in life-history traits occur in protected
populations, and none have yet demonstrated such changes (Sanchez-Lisazo et al.
2000). I assess whether the total density of fish inside Ra’ui contributes to MPA

Chapter 5 Ra’ui Effectiveness
138
effectiveness, especially in terms of organism size (i.e., density-dependent effects),
as reduced growth rates have been reported where fish densities are high
(Sanchez-Lisazo et al. 2000).
Gerber et al. (2002) suggest that fishing pressure outside marine reserves is
a key determinant of reserve effectiveness. In any impact assessment, it is difficult
to detect impacts with any confidence if the impacts are small relative to natural
variability (Osenberg et al. 1996). This equally applies to detecting the impacts of
MPAs. If levels of fishing outside an MPA are low, then it will be difficult to
distinguish an MPA effect from natural variability (Kulbicki et al. 2007). Although
numerous authors have investigated the influence of fishing intensity on coral reef
fish communities, (Russ and Alcala 1998b, Dulvy et al. 2004b, Graham et al. 2005),
to my knowledge, no studies have looked at the effects of a network of MPAs
which are sited in areas of differing fishing intensities. Jennings and Polunin
(1997) divided the length of the reef fronting qoliqoli (traditional Fijian fishing
grounds) by the number of people with fishing rights to assess the effects of
fishing on the structure, biomass, and diversity of fish communities. In this study,
I use the density of the human population within the vicinity of the Ra’ui as a
rough proxy for potential fishing pressure, and as another predictor of Raúi
effectiveness.
In this chapter I will focus on densities, mean size, and maximum size of
fish and invertebrates at individual Ra’ui sites to assess whether some Ra’ui may
be more effective than others in enhancing the abundance and size of fish and
invertebrates within their bounds. For each individual Ra’ui site, I calculate
response ratios for the mean size of abundant fish and invertebrates. I also assess
whether fish and invertebrates had greater maximum sizes in Raúi than in
corresponding Control sites. I then use the response ratios for fish and
invertebrate size at each Ra’ui, in conjunction with response ratios from Chapter 3
for fish and invertebrate abundances, to assess which Ra’ui appear to be most
effective. I assess Ra’ui effectiveness with three separate metrics; the proportion of

Chapter 5 Ra’ui Effectiveness
139
abundant fish and invertebrates exhibiting 1) increased densities, 2) increased
mean size, and 3) increased maximum size in Ra’ui relative to corresponding
Control sites.
Finally, I explore the influence of Ra’ui characteristics (Ra’ui size (ha), total
density of fish in Ra’ui, distance from Ra’ui to reef-crest, and the human
population in the vicinity of the Ra’ui) in predicting the 3 separate metrics of Ra’ui
effectiveness. I hypothesised that all four predictor variables would play a part in
determining the effectiveness of Ra’ui for organism densities, and that total fish
density in each Ra’ui would contribute to Ra’ui effectiveness for mean and
maximum size. The age of the Ra’ui were not included in my analyses as the
amount of time since the Raúi were implemented, or last lifted, was similar
(between 4.5 and 5 years prior to my surveys).
METHODS
Study System and Sampling Regime
Fieldwork was carried out in the lagoon around Rarotonga following sampling
methods detailed in Chapters 2 and 3 for the estimation of fish and invertebrate
abundances and Chapter 4 for the estimation of fish and invertebrate size.
Data analysis
1). Site specific Ra’ui effects on mean and maximum size of fish and
invertebrates
In this chapter I limit my consideration to fish and invertebrate species sizes where
the data is sufficient to facilitate separate statistical analyses for each Ra’ui and
Control pair. Hence, my data was constrained to five fish species; Acanthurus
triostegus, Ctenochaetus striatus, Mulloidichthys flavolineatus, Chlorurus sordidus and
Siganus argenteus (all of which are potentially fished species), 9 lagoon invertebrate
species (Diadema savignyi, Echinothrix diadema, Echinometra mathaei, Holothuria atra,
Stichopus chloronotus, Tripneustes gratilla, Tridacna spp., Trochus niloticus and

Chapter 5 Ra’ui Effectiveness
140
Dendropoma maxima), and 7 reef crest invertebrate species (Echinothrix diadema,
Echinometra mathaei, Echinometra oblonga, Actinopyga mauritiana, Holothuria atra,
Trochus niloticus, and Turbo setosus).
I calculated the mean and maximum size of the above fish and
invertebrates for each individual Ra’ui and its corresponding Control site. Where
densities for some species at particular sites were too low for analysis, these sites
were excluded. Size-frequency histograms for the fish and invertebrates were also
plotted for each Ra’ui - Control pair and are contained in Appendix C, Figures 1–3.
Response Ratios for fish and invertebrate mean size
I calculated response ratios (Hedges et al. 1999, and see Chapter 2) for the mean
size [ln (mean size Ra’ui / mean size paired Control)] of fish and invertebrates at each site
for use in subsequent analyses of relationships with Ra’ui characteristics.
Response ratios greater than zero, with confidence intervals that do not overlap
zero, indicate a positive response to protection i.e., fish or invertebrates have
greater densities, mean, or maximum size inside a Ra’ui than at its corresponding
Control site. Values of zero, or less than zero, indicate no response i.e., fish or
invertebrates have the same densities, mean, or maximum size within Ra’ui as
corresponding Controls, while response ratios less than zero indicate a negative
response to Ra’ui i.e., fish or invertebrates have lower densities, mean, or
maximum size inside a Ra’ui than at the corresponding Control site. I also
calculated 95% confidence intervals for each response ratio based on Hedges et al.
(1999).
2). Which Ra’ui are most effective?
My overall approach estimates Ra’ui ‘effectiveness’ using local assemblages of fish
and invertebrates. I obtain separate estimates of ‘effectiveness’ for (1) effects on
local abundance, (2) mean size, and (3) maximum size. More ‘effective’ Ra’ui are
those with proportionally more species with greater densities, mean, or maximum

Chapter 5 Ra’ui Effectiveness
141
size relative to corresponding Control sites. Assumptions underlying these
measures are considered in the Discussion.
Effects on abundance
I used response ratios calculated for lagoon fish and invertebrates (see Chapter
Three) as a measure of Ra’ui ‘effectiveness’, and estimated an overall measure of
effectiveness from the proportion of lagoon fish and invertebrates that had
significantly greater abundances within Ra’ui boundaries (i.e., positive response
ratios – see Chapters Two and Three).
Effects on size
I used response ratios calculated for mean size (see 1. above) as one measure of
Ra’ui ‘effectiveness’. Whether the maximum size of fish or invertebrates was
higher in Ra’ui or corresponding Controls was used as another measure of Ra’ui
‘effectiveness’. I estimated an overall measure of effectiveness from the
proportion of lagoon fish and invertebrates that had significantly greater mean
size, and greater maximum size, within Ra’ui boundaries. As some species were
locally rare/absent at particular sites, and were thus not able to be incorporated
into size analyses, proportions were based upon the local (i.e. reduced) species
pool. Reef crest sites were excluded from the assessment of Ra’ui effects on
abundance and size as only 2 Ra’ui sites were sampled on the reef crest, compared
with all 6 Ra’ui sites sampled in the lagoon.
3). Possible sources of variation in Ra’ui effectiveness
I carried out 3 separate multiple regressions to examine potential sources of
variation that may contribute to each the measures of Ra’ui effectiveness.
Dependent variables (i.e. indicators of Ra’ui effectiveness) were the proportion of
lagoon fish and invertebrate species out of the total number of species sampled
(see table 5.4) having significantly 1) greater densities in Ra’ui; 2) greater mean

Chapter 5 Ra’ui Effectiveness
142
size in Ra’ui, and 3) greater maximum size in Ra’ui, relative to corresponding
Control sites.
Independent Ra’ui characteristics tested in the stepwise multiple
regressions included Ra’ui area (ha), distance to reef crest (m), the size of the
human population located in the vicinity of each Ra’ui (number of persons), and
the total fish density in the Ra’ui (number of fish per m2). Information regarding
Ra’ui size was provided by the Cook Islands Ministry of Marine Resources
(Saywood et al. 2002, K. Raumea pers comm). The linear distance from the shore
of each Ra’ui to the reef crest was estimated by superimposing Ra’ui boundaries
onto a georectified coastal aerial photograph mosaic for Rarotonga (Drumm 2004)
and linear distance estimated in metres from the centre of the shore within the
Ra’ui directly out to the edge of the reef crest. The distance from the shore to the
reef crest served as a proxy for food supply to each Ra’ui. Information regarding
the human population in the vicinity of the Ra’ui was obtained from the Cook
Islands 2006 census (Statistics Office, Cook Islands 2006), which listed the number
of persons resident in each of the 12 census districts around Rarotonga, Cook
Islands. I extracted data from each census district corresponding with Ra’ui
location, using this information as a proxy for potential fishing pressure. Total
fish densities within each Ra’ui were calculated as the number of all fish species
surveyed within each Ra’ui divided by the total area sampled within each Ra’ui
(100m2) giving the density of fish per m2.
Prior to carrying out the multiple regressions, I calculated partial
correlation coefficients in SPSS (SPSS Inc. 2008) while controlling for the effects of
each of the dependent variables of Ra’ui effectiveness (density, mean, and
maximum size), to assess if there were any correlations between the predictor
variables to be included in subsequent multiple regressions. Finally, to assess the
influence of Ra’ui characteristics in predicting fish and invertebrate responses to
Ra’ui, I used stepwise backward multiple regressions. This analysis was done
using the ‘step’ function in R (R Development Core Team 2006) which utilises

Chapter 5 Ra’ui Effectiveness
143
Akaike’s information criterion (AIC), penalising any redundant model parameters,
and removing the redundant parameters from the model (Crawley 2007). The
statistical platform, R, was used for all the above data analyses (R Development
Core Team 2006).
RESULTS
Site effects on mean and maximum size of fish and invertebrates
Maximum size and response ratios (with 95% confidence intervals) for mean size
were calculated for commonly occurring fish and invertebrates at each Ra’ui site
(Table 5.1). Of the six Ra’ui sites, three (Aroa, Parliament, and Matavera)
consistently had greater mean size of invertebrates and fish compared to the
control site. Three of the five fish species had greater mean sizes in some Ra’ui,
but responses were not consistent across all censused Ra’ui. Ctenochaetus striatus
were found to be larger within Ra’ui at Aroa and Parliament, Mulloidichthys
flavolineatus were larger within Ra’ui at Aroa, Matavera, Parliament, and Tikioki,
and Siganus argenteus were larger within Ra’ui at Aroa and Parliament (Table 5.1).
Common to all three species, mean size was consistently greater at the Aroa Ra’ui
relative to the Control site (Table 5.1). Four of the nine lagoon invertebrate species
had significantly greater mean sizes in any of the Ra’ui (Diadema savignyi and
Tripneustes gratilla at Aroa, Echinometra mathaei at Matavera, and Trochus niloticus
at Parliament (Table 5.1). On the reef crest, where only two sites were surveyed,
mean size was significantly greater for Echinothrix diadema, Holothuria atra, and
Trochus niloticus at Parliament, Echinometra mathaei at Matavera, and Echinometra
oblonga at Matavera and Parliament (Table 5.1). Trochus niloticus was also only
present in the Matavera Ra’ui and not in the corresponding Control site (Table
5.1). Size frequency histograms for all fish and invertebrates listed in Table 5.1 are
presented in Appendix C, Figures 1 - 3.

Chapter 5 Ra’ui Effectiveness
144
Table 5.1 Maximum and mean size (cm) of commonly occurring fish and invertebrates at each Ra’ui (R) and Control (C) site. * indicates that maximum size is greater at Ra’ui sites than corresponding Control sites. Response ratios (RR) with 95% confidence intervals are shown for mean size. * indicates that mean size in the Ra’ui is significantly greater than zero relative to corresponding Control sites as the lower CI is greater than zero. – indicates that a value cannot be calculated (AP = Akapuao, AA = Aroa, AK = Aroko, MT = Matavera, PR = Parliament, TK = Tikioki).
FISH Maximum Size
(cm)
Mean Size (cm)
Family Genus & Species Site R C R > C? R C RR Lower
CI (RR)
Lower
CI >
zero?
ACANTHURIDAE AP 15 14 * 9.00 9.34 -0.037 -0.117
Acanthurus
triostegus AA 14 18 6.11 7.22 -0.167 -0.254
AK 16 16 5.10 6.72 -0.276 -0.396
MT 16 5 * 4.29 3.91 0.091 -0.017
PR 17 14 * 5.12 4.87 0.050 -0.085
TK 18 16 * 9.86 12.73 -0.255 -0.294
ACANTHURIDAE AP 15 18 5.35 6.07 -0.126 -0.161
Ctenochaetus
striatus AA 14 13 * 6.39 5.77 0.103 0.051 *
AK 7 20 5.02 5.75 -0.136 -0.169
MT 6 7 5.34 5.61 -0.049 -0.103
PR 7 6 * 5.44 5.15 0.055 -0.000
TK 17 17 6.61 6.56 0.008 -0.036
MULLIDAE AP 25 28 8.31 9.25 -0.108 -0.198
Mulloidichthys
flavolineatus AA 17 25 12.50 8.90 0.339 0.151 *
AK 28 18 * 8.79 8.51 0.032 -0.018
MT 22 11 * 8.86 8.21 0.077 0.032 *
PR 29 9 * 9.22 7.93 0.150 0.073 *
TK 26 30 16.79 9.06 0.617 0.579 *
SCARIDAE AP 25 30 11.64 17.26 -0.394 -0.443
Chlorurus sordidus
AK 7 18 6.67 12.58 -0.635 -0.736
TK 20 24 12.24 20.47 -0.514 -0.578
SIGANIDAE AP 7 13 4.63 6.06 -0.270 -0.289
Siganus argenteus
AA 25 7 * 21.00 5.75 1.295 1.232 *
AK 7 7 5.11 6.00 -0.159 -0.170
MT 7 6 * 5.37 5.56 -0.034 -0.065
PR 28 6 * 5.57 5.01 0.106 0.086 *
TK 20 7 * 8.27 5.92 0.334 0.177 *
LAGOON INVERTEBRATES
DIADEMATIDAE Diadema savignyi AA 10 6 * 7.90 6.00 0.275 0.250 *
AA 11 10 * 7.75 7.40 0.046 -0.119
Echinothrix
diadema TK 11 4 * 9.27 4.00 0.840 -
ECHINOMETRIDAE AP 6 6.5 3.16 4.03 -0.243 -0.291
Echinometra
mathaei AA 7 8 3.09 3.62 -0.157 -0.190
AK 9 6.5 * 3.47 3.63 -0.046 -0.161
MT 6 7.5 3.18 2.10 0.413 0.370 *
PR 7 7 4.13 4.05 0.018 -0.038
TK 6 7 3.03 3.90 -0.253 -0.304

Chapter 5 Ra’ui Effectiveness
145
Table 5.1 continued…
LAGOON INVERTEBRATES
CONTINUED…
Maximum Size
(cm) Mean Size (cm)
Family Genus & Species Site R C R > C? R C RR Lower
CI (RR)
Lower
CI >
zero?
HOLOTHURIIDAE Holothuria atra AP 28 35 15.83 17.02 -0.073 -0.173
AA 32 25 * 13.54 13.63 -0.007 -0.022
AK 35 29 * 12.70 14.44 -0.129 -0.137
MT 32 30 * 16.91 15.70 0.074 0.032
PR 28 27 * 13.09 15.11 -0.143 -0.155
TK 32 25 * 15.08 16.43 -0.086 -0.168
STICHOPODIDAE AA 24 25 11.67 13.61 -0.154 -0.179
Stichopus
chloronotus MT 16 26 13.67 19.16 -0.338 -0.475
PR 25 20 * 14.17 13.08 0.080 -0.005
TOXOPNEUSTIDAE Tripneustes
gratilla
AA 11 10 * 8.75 7.55 0.147 0.098
TRIDACNIDAE Tridacna spp. AP 18 16 * 10.03 9.00 0.108 -0.080
AA 14 11 * 6.90 7.00 -0.014 -0.204
TK 16 14 * 10.00 8.67 0.143 -0.012
TROCHIDAE Trochus niloticus AA 6 4.5 * 3.32 3.88 -0.154 -0.419
AK 7 11 5.11 7.50 -0.385 -0.660
MT 10 6.5 * 3.98 4.65 -0.156 -0.287
PR 6.5 4 * 3.80 3.00 0.236 0.093 *
VERMETIDAE Dendropoma
maxima
AP 2.5 2.5 1.85 1.76 0.047 -0.171
AA 2 2 1.63 1.67 -0.022 -0.405
TK 3 2 * 2.07 2.00 0.033 -0.092
REEF CREST INVERTEBRATES
DIADEMATIDAE Echinothrix
diadema
PR 10 12 7.09 6.39 0.104 0.076 *
ECHINOMETRIDAE MT 5 5 2.29 1.15 0.693 0.479 *
Echinometra
mathaei PR 5 5 2.01 2.66 -0.282 -0.323
MT 4 2 * 1.67 0.70 0.865 0.729 *
Echinometra
oblonga PR 3 3 1.80 1.22 0.386 0.241 *
HOLOTHURIIDAE MT 23 25 12.80 15.38 -0.184 -0.286
Actinopyga
mauritiana PR 28 25 * 15.63 15.35 0.018 -0.032
Holothuria atra MT 32 30 * 15.11 13.47 0.115 0.047 *
PR 28 27 * 17.29 14.91 0.148 0.087 *
TROCHIDAE MT 11 0 8.97 - - None present in Control
Trochus niloticus
PR 12 12 8.97 8.55 0.049 0.005 *
TURBINIDAE Turbo setosus MT 4 4 2.67 2.33 0.134 -0.133

Chapter 5 Ra’ui Effectiveness
146
Ra’ui effectiveness
Of the 6 Ra’ui, Parliament had the greatest proportion of fish and invertebrate
species with higher densities, and maximum size relative to its corresponding
Control site while Aroa Ra’ui had the greatest proportion of fish and invertebrate
species with greater mean size relative to its corresponding Control site (Table
5.2). Tikioki Ra’ui had the lowest proportion of fish and invertebrate species with
higher densities relative to corresponding Control sites, while Aroko and Akapuao
Ra’ui had the lowest proportion of fish and invertebrate species with greater mean
size in the Ra’ui relative to corresponding Control sites. Akapuao Ra’ui had the
lowest proportion of fish and invertebrate species with greater maximum size
inside Ra’ui relative to corresponding Control sites (Table 5.2).
Table 5.2 The proportion of lagoon fish and invertebrates per Ra’ui site from Table 5.1 where mean densities, mean size, and maximum size were greater in the Ra’ui (R). The total number of fish and invertebrates in the local species pool for each particular metric and site are in brackets. Note: some species were locally rare/absent at particular sites, and were thus not able to be incorporated into size analyses, so proportions were based upon the local (i.e. reduced) species pool.
All Fish and Invertebrates
Site Density Mean Size Maximum Size
Akapuao 0.22 (32) 0.00 (9) 0.22 (9)
Aroa 0.15 (34) 0.39 (13) 0.62 (13)
Aroko 0.06 (34) 0.00 (8) 0.38 (8)
Matavera 0.15 (33) 0.38 (8) 0.54 (8)
Parliament 0.41 (34) 0.38 (8) 0.64 (8)
Tikioki 0.03 (32) 0.22 (9) 0.60 (10)
Sources of variation in Ra’ui effectiveness
The Ra’ui characteristics for use in multiple regressions predicting the response of
fish and invertebrate densities and size (mean and maximum size) are presented
in Table 5.3. Aroko Ra’ui was the largest Ra’ui in place at the time of my surveys

Chapter 5 Ra’ui Effectiveness
147
at over 9 times the size of the smallest, Matavera (Table 5.3). Aroko Ra’ui was the
Ra’ui located the greatest distance from the reef crest while Matavera Ra’ui was
located immediately at the reef crest (Table 5.3). The human population was
lowest at Akaoa, in the vicinity of the Aroa Ra’ui, while it was highest at
Ngatangiia-Muri, where the Aroko Ra’ui is located (Table 5.3). Total fish densities
were highest at Akapuao Ra’ui and lowest at Aroa Ra’ui.
Table 5.3 Ra’ui characteristics included in multiple regressions as predictor variables. For human population, census district is listed in parentheses.
Site Ra’ui
Area (ha)
Distance to
reef crest (m)
Human Population
(number of persons)
Overall fish density in
Ra’ui (number per m2)
Akapuao 35 642 1645 (Titikaveka) 2.04
Aroa 16 500 955 (Akaoa) 0.70
Aroko 47 785 1815 (Ngatangiia–Muri) 1.59
Matavera 5 143 1490 (Pue-Matavera) 0.91
Parliament 13 429 1373 (Nikao-Panama) 1.38
Tikioki 3.3 671 1645 (Titikaveka) 1.71
There were no significant partial correlations between any of the predictor
variables when controlling, separately, for each of the dependent variables of
Ra’ui effectiveness (fish and invertebrate density, mean size, and maximum size)
(see Appendix C, Table 1). Subsequently, all four predictor variables were
retained in the multiple regressions assessing the effectiveness of Ra’ui at
enhancing fish and invertebrate densities, mean size, and maximum size.
Stepwise multiple regressions exploring sources of variation in mean
organism size retained two of the four Ra’ui characteristics as significant
predictors (Table 5.4). The effectiveness of Ra’ui in enhancing mean fish and
invertebrate size was best described by Ra’ui area and total fish density in each
Ra’ui (Table 5.4). Multiple regressions of Ra’ui characteristics were not significant
in predicting the effectiveness of Ra’ui in enhancing fish and invertebrate

Chapter 5 Ra’ui Effectiveness
148
densities, and maximum size. Regression output generated in R is included in
Appendix C, Tables 2 - 4.
Table 5.4 Stepwise backward multiple regression of Ra’ui effectiveness for mean fish and invertebrate size. Predictor variables retained in the regression were Raúi area and total fish density.
Parameter Beta coefficients Adjusted R2 F P
Ra’ui effectiveness (mean size) 0.86 16.05 0.03
Partial R2
Ra’ui area -0.0062 0.757
Total fish density -0.1997 0.732
DISCUSSION
Ra’ui ‘effectiveness’
My criteria for Ra’ui effectiveness are based on a reduced suite of species where
abundances were high enough to allow for separate statistical analyses at each
Ra’ui site. Consequently, inferences regarding Ra’ui effectiveness are limited by
the reduced dataset which may have excluded potentially important fished species
(particularly carnivorous species) such as Serranids and Lutjanids, which were
infrequently encountered during my sampling. Based on my criteria for Ra’ui
effectiveness, the most ‘effective’ Ra’ui sites in this study were Parliament Ra’ui
for enhancing fish and invertebrate density and maximum size, and Aroa Ra’ui for
enhancing fish and invertebrate mean size. The least ‘effective’ Ra’ui were Tikioki
Ra’ui for fish and invertebrate abundances, Aroko and Akapuao Ra’ui for fish and
invertebrate mean size, and Akapuao Ra’ui for fish and invertebrate maximum
size.
Both Aroa and Parliament Ra’ui are highly visible, which may result in
good compliance, and ultimately, greater effectiveness based on my assessment
criteria. Drumm (2004), in his assessment of the effects of Ra’ui on reef-top

Chapter 5 Ra’ui Effectiveness
149
invertebrates on Rarotonga, stated that the very public location of one of the Ra’ui
(Nikao), coupled with strong community support for the Ra’ui, ensured good
compliance. Aroa Ra’ui is located directly in front of the Rarotongan Beach
Resort, with the resort promoting non-extractive use (snorkelling) of the Ra’ui (C
Hood, pers comm.), while the Parliament Ra’ui is directly in front of the Cook
Islands Parliament buildings. A number of authors have advocated that the
effects of non-compliance with MPAs be included in quantitative MPA
assessments (Kritzer 2004, Byers and Noonburg 2007). Guidetti et al. (2008) looked
at the effectiveness of 15 marine reserves in Italy, demonstrating that reserve
effectiveness was greatest where enforcement was high. Furthermore, Guidetti et
al. (2008) noted that in Italy, MPAs are often underfunded and understaffed,
which affects the governance of MPAs, and ultimately, MPA effectiveness.
Poaching has recently been recognised as a problem in the Matavera Ra’ui, and
the traditional leaders have requested that the Ra’ui be legally recognised under
the Cook Islands Environment Act 2003 (Tiraa 2006). Subsequently, the varying
levels of Ra’ui effectiveness may be due to variable compliance.
Tikioki Ra’ui is the smallest Ra’ui in the lagoon and is long and narrow,
covering reef formations that run in a thin strip from the shore out to the reef crest.
It is possible that the size and shape of this Ra’ui plays a role in its effectiveness.
Kramer and Chapman (1999) predict that reserves with lower edge to area ratios
will have higher population densities and mean body sizes. In simulations to
assess factors that affect the movement and density of animals in patches of
habitat, the edge to area ratio was the main factor that influenced movement in
and out of the patch (Buechner 1987). Meester et al. (2004) define the ideal shape
for MPAs as being m X n rectangles with a configuration of either m = n (square)
or m = n+1 (compact rectangle). The long, narrow shape of the Tikioki Ra’ui gives
it a high edge to area ratio. The high edge to area ratio allows fish to move easily
between Ra’ui and non-Ra’ui areas, thus increasing their vulnerability to being
caught. An important implication of high edge to area ratios noted by Buechner

Chapter 5 Ra’ui Effectiveness
150
(1987) is that the conservation of threatened species is more difficult, and more so
if the species have large home ranges. Consequently, the shape of the Tikioki
Ra’ui may make it less effective for fish with large home ranges.
In Chapter Three I noted that Tikioki had a higher abundance of carnivores
relative to other fish functional groups. At Tikioki Ra’ui, predator-prey
relationships, whereby top predators in the ecosystem may depress local prey
densities (Salomon et al. 2002), may drive the patterns in abundances for the suite
of species I have used to assess Ra’ui effectiveness. Salomon et al. (2002) caution
that ecological interactions within an MPA may result in declines in prey species,
which does not necessarily indicate MPA ineffectiveness. The lower effectiveness
of the Tikioki Ra’ui to enhance fish and invertebrate abundances relative to the
other Ra’ui in this study may be due to the suite of species I use to assess Ra’ui
effectiveness i.e., most are likely prey species with very few being top-predators.
This is a limitation of my study driven by a requirement that fish and invertebrate
abundances were high enough to allow for separate statistical analyses at each
Ra’ui site.
Variation in Ra’ui ‘effectiveness’
Ra’ui characteristics (area, distance to reef crest, human population size, and total
fish density) included in the multiple regressions here were unable to predict the
variability in Ra’ui effectiveness in terms of enhancing mean density or maximum
size of fish and invertebrates. It may be that the two proxies I used for food
availability and fishing pressure did not adequately represent either of these Raúi
characteristics. Although work has been done looking at the effects of exposure
(e.g., waves) and MPA status on coral reef fish assemblages (Friedlander et al.
2003), none has examined the effect of food availability on MPA effectiveness,
where distance to reef crest from the shore of the MPA has acted as a food proxy.
Furthermore, sources of primary production on coral reefs include fleshy
macrophytes, filamentous algae, and zooxanthellae in coral tissue while detritus

Chapter 5 Ra’ui Effectiveness
151
and zooplankton carried over the reef via water movement only contributes to a
portion of organic production on coral reefs (Lewis 1977). My other proxy for
fishing pressure may have been suitable a number of decades ago when fishing on
Rarotonga was more widespread, but may be less appropriate as a proxy for
fishing pressure now with the decline in fishing on Rarotonga (Moore 2006, see
Chapters 3 and 4 for discussion, SPC 2007).
Eighty six percent of the variation in the effectiveness of Ra’ui in enhancing
the mean size of fish and invertebrates was explained by Ra’ui area and the total
fish density within Ra’ui. This result suggests that higher total fish density may
lead to smaller mean sizes of censused fishes and invertebrates within Ra’ui, and it
is consistent with suggestions by other workers that the individual growth rate of
organisms decreases with increased total fish density at a site (Sanchez-Lisazo et
al. 2000). Greater mean size of organisms in protected areas is a common measure
of MPA effectiveness (Edgar and Barrett 1999, Sanchez Lizaso et al. 2000, Halpern
2003, Ashworth et al. 2004). Consequently, mean size may not be a good indicator
of Ra’ui effectiveness if Ra’ui enhance densities and growth rates are density
dependent.
Ra’ui area also contributed to variation in Ra’ui effectiveness for mean fish
and invertebrate size, with increasing Ra’ui size leading to a decreased proportion
of fish and invertebrates with greater mean size in Ra’ui. In terms of the ideal size
for MPAs, modelling studies suggest that for conservation purposes, marine
reserves should be as large as practically possible, while for maximising yield for
fisheries, reserves should be as small as possible to maximise larval export to areas
outside the reserve (Hastings and Botsford 2003). Further, organisms with longer
larval dispersal distances need bigger reserves covering a greater proportion of the
coastline to maximise persistence of the population under worst-case scenarios
(Botsford et al. 2003). Kramer and Chapman (1999) predict that densities and
mean body sizes of fish will be higher in reserves that (1) cover a greater area
(contrary to my result) and (2) have a higher edge to area ratio. Parnell et al. (2006)

Chapter 5 Ra’ui Effectiveness
152
note that marine reserves should be large enough to sustain those populations that
spend the majority of their time in the reserve area. However, my results indicate
that the effectiveness of Ra’ui (as measured by mean sizes) may vary inversely
with Ra’ui size; this contradicts conclusions of Halpern (2003) and predictions
made by Kramer and Chapman (1999).
Halpern (2003) concluded that the relative magnitude of reserve effect was
independent of reserve size with even very small reserves having similar
magnitude of reserve effects to large reserves. In my study, Ra’ui size ranged
from 3.3 to 35 hectares (0.033 to 0.35 km2). In Halpern’s meta-analysis, reserve size
ranged between 0.002 and 846 km2. To assess whether Halpern’s meta-analysis
covering a wide range of reserve sizes had perhaps masked any relationship for
small reserves with reserve area, I extracted Halpern’s (2003) data for those
reserves that were similar in size (0.002 to 0.0375 km2) to the Ra’ui. I then
regressed Halpern’s (2003) reserve size data against the corresponding response
ratios for density and biomass (there were no response ratio data for size for the
reduced dataset) and, as Halpern found with his complete dataset, there was no
significant relationship between reserve area and the magnitude of response. I
then removed those reserves in temperate locations from Halpern’s (2003) data,
leaving only those reserves located in the tropics, and repeated the regression
analysis for both the response of density and biomass with reserve size. Again,
there were no significant relationships between reserve area and the magnitude of
reserve response.
With my data, it is possible that an interaction between the two predictor
variables, fish density and Ra’ui size, may contribute to variation in effectiveness
of Ra’ui, as measured by mean size. However, in my examination of the partial
correlations between predictor variables in the multiple regressions, Ra’ui size was
not correlated with total fish density. This implies that if Ra’ui size is not driving
the variable patterns in Ra’ui effectiveness for fish and invertebrate mean size,
then perhaps some other characteristic that I did not measure may be doing so.
Chapter 5 Ra’ui Effectiveness
153
CONCLUSIONS
To summarise, compliance is often neglected as a factor influencing MPA
effectiveness (Kritzer 2004, Byers and Noonburg 2007). In Rarotonga, the location
(i.e. visibility) and social context (i.e., community support) of Ra’ui likely has some
degree of influence on Ra’ui effectiveness. Species interactions (e.g., predator-prey
interactions and/or competition for resources) and the physical shape of Ra’ui may
also play a role in reducing the effectiveness of Ra’ui on fish and invertebrate
densities. My data hint at possible density-dependent effects that may be
occurring within Ra’ui, which possibly contribute to variation in certain measures
of Ra’ui effectiveness (e.g., as measured by mean sizes). Thus, density dependent
growth may confound the use of mean size as an indicator of Ra’ui effectiveness.
Contrary to findings of some recent meta-analyses (e.g., Halpern 2003, Claudet et
al. 2008), I found some evidence that the effectiveness of Ra’ui in Rarotonga may
be inversely related to Ra’ui size. Overall, my results highlight variation in
potential Ra’ui effectiveness around Rarotonga. This finding, coupled with the
identification of characteristics that potentially contribute to Ra’ui effectiveness
(Ra’ui area and total fish density), may prove valuable for future Ra’ui assessment
and design.

154
CHAPTER 6: General discussion and conclusions
Overview
The Ra’ui of Rarotonga are a series of relatively small, young, traditionally
managed marine protected areas (MPAs). Reef resources within the Ra’ui have
been regularly assessed by the Cook Islands Ministry of Marine Resources since
the Ra’ui were first implemented (for example Ponia and Raumea 1998, Ponia et al.
1998, Raumea et al. 2000a, 2000b, Saywood et al. 2002). Various researchers have
conducted quantitative evaluations of the effectiveness of individual Ra’ui
(Manarangi-Trott 2000, Drumm 2004), or characterised the Ra’ui (Cucknell 2005,
Egerton 2005, May 2005). The Ra’ui of Rarotonga have also been the subject of
interdisciplinary studies focussing on coral reef health (Churcher-Hoffman 2001,
Churcher-Hoffman 2002a, 2002b). However, this is the first study of the Ra’ui on
Rarotonga that integrates habitat information with abundance and size data in a
quantitative evaluation of Ra’ui effects. Further, this study is unique as it
examines the effects of a network of temporary closures. In an attempt to
generalise MPA effects, this is also the first study of MPA effectiveness to carry
out a meta-analysis across a number of sites as part of a single study.
The overall aim of this thesis was to quantitatively evaluate the effects of
Ra’ui on fish and invertebrates in the lagoon of Rarotonga. I empirically
demonstrated that environmental heterogeneity confounds inferences of Ra’ui
effectiveness (generally applicable to MPAs). In agreement with previous studies,
I found Ra’ui to be most effective for site-attached organisms, and there was some
evidence that habitat availability may limit the abundance of an organism during
particular phases of its ontogeny. Contrary to my expectations, density and size
response of many organisms to Ra’ui were not consistent and although meta-
analyses suggested there was no island-wide effect of Ra’ui, two-factor analysis of

Chapter 6 General Discussion and Conclusions
155
covariance suggested island-wide Ra’ui effects for a number of fish and
invertebrate species (see Chapter 3). There was also some evidence supporting
inverse predator-prey relationships occurring in Ra’ui but this was not consistent
across all Ra’ui.
In this chapter I make recommendations based on my key findings from
Chapters 2 – 5 for future Ra’ui assessments. Further, some of my
recommendations more generally apply to MPA assessments.
Novel framework to remove confounding by environmental heterogeneity
In Chapter 2 I developed a novel framework to confront the problem of
environmental heterogeneity confounding the detection of MPA effects. My
framework statistically ‘removed’ the potentially confounding effects of natural
environmental variability from my assessment of Ra’ui effects. I recommended
that substrate heterogeneity be incorporated into MPA assessment designs
confounded by spatial variation (e.g., Control-Impact type assessments) when it is
not possible to carry out more robust assessments (e.g., Before-After Control-
Impact Paired Series (BACIPS)).
The collection of data to input into the novel framework developed in
Chapter 2 is straight-forward, involving only minor modifications to underwater
visual census methods using a Control-Impact assessment survey design i.e.,
habitat use data is collected concurrently with abundance and size data. Although
BACIPS survey designs are recommended, Control-Impact survey designs may be
more practical in situations where there are neither the resources (funding,
personnel), or time (other work has higher priority) to utilise recommended
survey designs such as BACIPS. My technique, as with all underwater visual
census (UVC) work is restricted by underwater visibility. Although collecting the
data for use in this new framework may prove more difficult in high density,
multi-species assemblages, it is likely efficient for sampling a select number of
indicator species (e.g., Mullidae and Serranidae on coral reefs). Further, my novel

Chapter 6 General Discussion and Conclusions
156
framework may even prove useful for BACIPS type assessment designs and
strengthen inferences if one component of environmental variation such as
substrate heterogeneity can be factored out during data analysis. In the future, a
simple computer program could be written to simplify data analysis (i.e.,
adjusting the data by habitat, then generating response ratios).
Site fidelity, Ra’ui size, and ontogenetic shifts – considerations for the design of
MPAs
A number of my findings have important implications for the design of MPAs. In
Chapters 3, 4, and 5, a number of my results support suggestions that spatial
management (e.g., MPAs) is most effective for organisms with high site fidelity
(Hastings and Botsford 1999, Hilborn et al. 2004, Botsford 2005, Parnell et al. 2005,
Blyth-Skyrme et al. 2006, Malvadkar and Hastings 2008, see Chapter 1 for
discussion). Although the Ra’ui are relatively small protected areas, they appear
to have positive effects on the size and abundance of some fish and invertebrates
which based on my findings, may be partially attributable to site-fidelity. Further,
in Chapter 5 there was a negative relationship between Ra’ui area and the
proportion of fish and invertebrates exhibiting greater size in each Ra’ui, contrary
to the conclusions of Halpern (2003) and predictions by Kramer and Chapman
(1999). In Chapter 4 I noted that the range of habitats within the Ra’ui, and MPAs
in general, may limit the abundances of fish at specific stages of their ontogeny.
The inclusion of habitats that can support all benthic life-stages of an organism’s
ontogeny is an important consideration for MPA design.
Tagging studies for some of the key fished species in the lagoon could
provide useful information on their movements in the lagoon of Rarotonga that
could strengthen any inferences regarding Ra’ui effectiveness. Further, movement
patterns of organisms need to be considered when setting up MPAs, as well as
when monitoring MPA effectiveness for both coral reef and temperate MPAs. As
most species on coral reefs are sessile / site-attached (Hastings and Botsford 1999),

Chapter 6 General Discussion and Conclusions
157
MPAs may be highly effective management tools for coral reef fish and
invertebrates if factors such as the home-range and habitat use of a species are
taken into account in the siting and design of MPAs.
Effectiveness of temporary closures such as Ra’ui
Some authors purport that temporary closures are ineffective for the goal of
conserving fish stocks and revitalising fishing grounds. However, there is
increasing recognition that community management of marine resources using
traditional measures such as periodic reef closures may be more effective due to
better community support, than the implementation of large, permanent reserves
which may receive little support from communities and consequently have lower
compliance (McClanahan et al. 2006). In Chapter 1 I suggested that short-lived or
rapidly recruiting species might need short or more frequent closures to recover
from harvests than longer-lived, slower-growing species. My results in chapter 4
indicate that Ra’ui (due to their ephemeral nature) may be more effective for
species with high growth rates (e.g., Mulloidichthys flavolineatus). Further, if the
target of Ra’ui is species-specific e.g., Ra’ui to prohibit the harvest of Trochus
niloticus, Ra’ui may still prove effective in conserving and enhancing those stocks.
Community-based marine resource management and Ra’ui effectiveness
Community based marine resource management is common throughout the
Pacific region (Johannes 2002, Aswani et al. 2007). In Rarotonga, Ra’ui were
implemented for a number of reasons including communities noting and
becoming concerned about declines in fish and invertebrate stocks (Passfield and
Tiraa 1998). Ra’ui are not legally enforced, rather they rely upon social pressures
arising from respect for the mana (power) of the traditional leaders for
compliance. Drumm (2004) suggests that legal recognition and government
support can strengthen village-based authority and marine tenure systems. On
the other hand, legislation could erode the mana of the traditional leaders (Tiraa
2006), and further legitimise Western governance frameworks.

Chapter 6 General Discussion and Conclusions
158
If Ra’ui are successful without requiring legislation, one major benefit would be
that communities would be aware that they can successfully manage their own
marine resources without the need for government intervention which could boost
community efforts to protect marine and other natural resources (Passfield and
Tiraa 1998). Community support is crucial for the success of MPAs, and impacts
on the degree of compliance with an MPA (Johannes 2002, Aswani and Weiant
2004, McClanahan et al. 2006).
One limitation of my work is the lack of specific information regarding the
level of compliance with Ra’ui and the degree of fishing in surrounding areas.
The level of compliance inside MPAs (and fishing pressure outside) can influence
MPA effectiveness (see Chapters 3, 4 and 5 for discussion). I suggest that the
degree of fishing outside MPAs, and the level of compliance within MPAs needs
to be quantified where possible in assessments of MPA effectiveness.
Education and awareness campaigns may help promote community
support for MPAs. Over 600 school students attended a highly successful
Takitumu lagoon field day held on Rarotonga in June 2008 to raise public
awareness regarding the state of the lagoon (Greig 2008). This type of educational
activity may help to engender future support for marine management
mechanisms such as the Ra’ui on Rarotonga.
Conclusions
This study is unique in its examination of the effects of a network of temporary
closures within a single, small lagoon system. The key conclusions of this thesis
are that environmental heterogeneity can confound MPA effects, and temporary
prohibitions such as Ra’ui may be more effective for some species if certain
conditions are met e.g., compliance is good, the target species have high site-
fidelity and high population growth rates. Traditional marine management
measures such as Ra’ui may also serve important socio-cultural purposes i.e.,
maintenance or revival of tradition (Johannes 2002), and consequently be better

Chapter 6 General Discussion and Conclusions
159
accepted and incorporated by the community. The socio-cultural functions of
Ra’ui may engender community support for the conservation and enhancement of
lagoon fisheries, which in turn may result in improved Ra’ui effectiveness through
better compliance. Finally, this study may provide an important point of
comparison for future studies on the Ra’ui in the lagoon surrounding Rarotonga.

160
APPENDIX A

Appendix A
161
Table 1. Common names and Cook Islands Māori names for ‘abundant’ fish and invertebrate species surveyed. Common names and Cook Islands Māori names sourced from McCormack (2007)
Family Genus and species Common Name Cook Islands Māori Name
ACANTHURIDAE Acanthurus triostegus Convict surgeonfish Manini
Ctenochaetus striatus Striped bristletooth Maito
Naso lituratus Orangespine unicornfish Ume
Naso unicornis Bluespine unicornfish Ume toro
BALISTIDAE Rhinecanthus aculeatus Picasso triggerfish Kōkiri toka
CHAETODONTIDAE Chaetodon auriga Threadfin butterflyfish Taputapu rengarenga
Chaetodon citrinellus Speckled butterflyfish Taputapu
LABRIDAE Halichoeres trimaculatus Threespot wrasse Pākoukou
Thalassoma lutescens Sunset wrasse Karore
Thalassoma purpureum Surge wrasse Karore
Stethojulis bandanensis Redshoulder wrasse Karore
MULLIDAE Mulloidichthys flavolineatus Yellowstripe goatfish Vete
Parupeneus multifasciatus Multibarred goatfish Ka'uru
POMACENTRIDAE Chrysiptera glauca Grey demoiselle Katoti
Stegastes albifasciatus Whitebar gregory Katoti
Stegastes nigricans Dusky gregory Katoti
SCARIDAE Chlororus sordidus Bullethead parrotfish Pakati
SERRANIDAE Epinenephelus hexagonatus Hexagon grouper Pātuki paru
SIGANIDAE Siganus argenteus Forktail rabbitfish Mōrava
Siganus spinus Scribbled rabbitfish Maemae
TETRAODONTIDAE Canthigaster solandri Spotted toby Ue'ue
INVERTEBRATES
DIADEMATIDAE Diadema savignyi Extreme longspine-urchin Vana
Echinothrix diadema Longspine-urchin Vana
ECHINOMETRIDAE Echinometra mathaei Pale burrowing-urchin Kina
Echinometra oblonga Black burrowing-urchin Kinakina
Heterocentrotus mamillatus Brown pencil-urchin Atuke
HOLOTHURIIDAE Actinopyga mauritiana Surf redfish Rori puakatoro
Holothuria atra Blood sea-cucumber Rori toto
Holothuria cinerascens Flower sea-cucumber Rori pua
Holothuria leucospilota Black soft-spine sea-cucumber Matu rori
OPHIDIASTERIDAE Linckia laevigata Vivid-blue starfish Etu-moana
STICHOPODIDAE Stichopus chloronotus Greenfish Rori matie
TOXOPNEUSTIDAE Tripneustes gratilla Hidden sea-urchin Avake
TRIDACNIDAE Tridacna spp. Giant clam Pa'ua
TROCHIDAE Trochus niloticus Commercial trochus Torokāti
TURBINIDAE Turbo setosus Rough turban Ariri
VERMETIDAE Dendropoma maxima Great worm-snail Ungakoa

Appendix A
162
Table 2. Categorisation of all fish species sampled in the lagoon around Rarotonga into fine-scale and broad-scale functional groups. KEY: Fine-scale; Pisc = piscivores, C = carnivores, SIF = sessile invertebrate feeders, O = omnivores, MIF = mobile invertebrate feeders, Plankt = planktivores, TH = territorial herbivores, and RH = roving herbivores. Broad-scale; C = carnivores, P/I = planktivore / invertebrate feeders, O = omnivores, H = herbivores.
Functional Group Family Scientific name Common Name
Fine-scale Broad-scale
ACANTHURIDAE Acanthurus blochii Ringtail surgeonfish RH H
Acanthurus leucopareius Whitebar surgeonfish RH H
Acanthurus nigroris Bluelined surgeonfish RH H
Acanthurus spp. Surgeonfish spp. RH H
Acanthurus triostegus Convict surgeonfish RH H
Acanthurus xanthopterus Yellowfin surgeonfish RH H
Ctenochaetus flavicauda Whitetail bristletooth RH H
Ctenochaetus striatus Striped bristletooth RH H
Naso lituratus Orangespine unicornfish RH H
Naso unicornis Bluespine unicornfish RH H
Zebrasoma veliferum Sailfin tang RH H
APOGONIDAE Apogon kallopterus Iridescent cardinalfish MIF P/I
Apogon nigrofasciatus Blackstripe cardinalfish MIF P/I
Apogon spp. Cardinalfish spp. MIF P/I
Cheilodipterus quinquelineatus Fivelined cardinalfish C C
AULOSTOMIDAE Aulostomus chinensis Trumpetfish C C
BALISTIDAE Melichthys niger Black triggerfish RH H
Rhinecanthus aculeatus Picasso triggerfish O O
Rhinecanthus rectangulus Wedge picassofish O O
BELONIDAE Platybelone argatus platyura Keeled needlefish Pisc C
BLENNIIDAE Blennidae spp. Blenny spp. TH H
Istiblennius edentulus Rippled rockskipper RH H
Istiblennius spp. Rockskipper spp. RH H
Plagiotremus tapeinosoma Scale-eating fang blennie Pisc C
BOTHIDAE Bothus mancus Peacock flounder C C
CARANGIDAE Carangoides ferdau Bar jack C C
Caranx melampygus Bluefin trevally C C
CHAETODONTIDAE Chaetodon auriga Threadfin butterflyfish O O
Chaetodon citrinellus Speckled butterflyfish O O
Chaetodon ephippium Saddled butterflyfish O O
Chaetodon lunula Racoon butterflyfish O O
Chaetodon ornatissimus Ornate butterflyfish SIF P/I
Chaetodon quadrimaculatus Fourspot butterflyfish SIF P/I
Chaetodon reticulatus Reticulated butterflyfish SIF P/I
Chaetodon trifascialis Chevroned butterflyfish SIF P/I
Chaetodon ulietensis Pacific double-saddled butterflyfish
O O
Chaetodon unimaculatus Teardrop butterflyfish O O
Chaetodon vagabundus Vagabond butterflyfish O O
Forcipiger flavissimus Longnose butterflyfish C C
Heniochus chrysostomus Pennant bannerfish SIF P/I
Heniochus monoceros Masked bannerfish SIF P/I
DIODONTIDAE Diodon hystrix Porcupine fish MIF P/I
FISTULARIIDAE Fistularia commersonii Cornetfish C C
GOBIIDAE Gobiidae spp. Goby spp. SIF P/I
Valenciennea strigata Bluestreak goby C C
HEMIRHAMPHIDAE Hemiramphidae spp. Halfbeak spp. O O
HOLOCENTRIDAE Holocentrinae spp. Squirrelfish spp. O O

Appendix A
163
Table 2 continued. Categorisation of fish sampled in the lagoon around Rarotonga into fine-scale and broad-scale functional groups. KEY: Fine-scale; Pisc = piscivores, C = carnivores, SIF = sessile invertebrate feeders, O = omnivores, MIF = mobile invertebrate feeders, Plankt = planktivores, TH = territorial herbivores, and RH = roving herbivores. Broad-scale; C = carnivores, P/I = planktivore / invertebrate feeders, O = omnivores, H = herbivores.
Functional Group
Family Scientific name Common Name
Fine-scale Broad-scale
HOLOCENTRIDAE Myripristinae spp. Soldierfish spp. Plankt P/I
Myripristis berndti Bigscale soldierfish Plankt P/I
Myripristis chryseres Yellowfinned soldierfish Plankt P/I
Myripristis kuntee Pearly soldierfish Plankt P/I
Myripristis woodsii White-spot soldierfish Plankt P/I
Sargocentron diadema Crown squirrelfish C C
Sargocentron spiniferum Long-jawed squirrelfish C C
KUHLIIDAE Kuhlia mugil Barred flagtail Plankt P/I
KYPHOSIDAE Kyphosus cinerascens Topsail drummer RH H
LABRIDAE Cheilinus chlorourus Floral wrasse MIF P/I
Cheilinus trilobatus Tripletail wrasse MIF P/I
Cheilio inermis Cigar wrasse MIF P/I
Coris aygula Clown coris MIF P/I
Gomphosus varius Bird wrasse C C
Halichoeres hortulanus Checkerboard wrasse MIF P/I
Halichoeres margaritaceus Weedy surge wrasse C C
Halichoeres marginatus Dusky wrasse MIF P/I
Halichoeres trimaculatus Threespot wrasse MIF P/I
Labridae spp. Wrasse spp. C C
Labroides bicolor Bicolour cleaner wrasse C C
Labroides dimidiatus Bluestreak cleaner wrasse C C
Macropharyngodon meleagris Leopard wrasse MIF P/I
Novaculichthys taeniourus Rockmover wrasse SIF P/I
Pseudocheilinus hexataenia Sixline wrasse MIF P/I
Stethojulis bandanensis Redshoulder wrasse MIF P/I
Thalassoma hardwicke Sixbar wrasse C C
Thalassoma lutescens Sunset wrasse MIF P/I
Thalassoma purpureum Surge wrasse C C
Thalassoma trilobatum Christmas wrasse C C
LETHRINIDAE Gnathodentex aurolineatus Yellowspot emperor MIF P/I
Lethrinus atkinsoni Pacific yellowtail emperor C C
Monotaxis grandoculis Bigeye bream MIF P/I
LUTJANIDAE Lutjanus fulvus Flametail snapper C C
Lutjanus kasmira Bluelined snapper C C
Lutjanus monostigma Onespot snapper C C
MUGILIDAE Crenimugil crenilabis Fringelip mullet RH H
Liza vaigensis Squaretail mullet RH H
MULLIDAE Mulloidichthys flavolineatus Yellowstripe goatfish MIF P/I
Mulloidichthys vanicolensis Yellowfin goatfish MIF P/I
Parupeneus barberinus Dash-and-dot goatfish MIF P/I
Parupeneus bifasciatus Twobar goatfish MIF P/I
Parupeneus ciliatus Whiteline goatfish MIF P/I
Parupeneus cyclostomus Yellowsaddle goatfish Pisc C
Parupeneus multifasciatus Multibarred goatfish MIF P/I
MURAENIDAE Echidna nebulosa Snowflake moray C C
Gymnothorax javanicus Giant moray C C
Muraenidae spp. Moray spp. C C
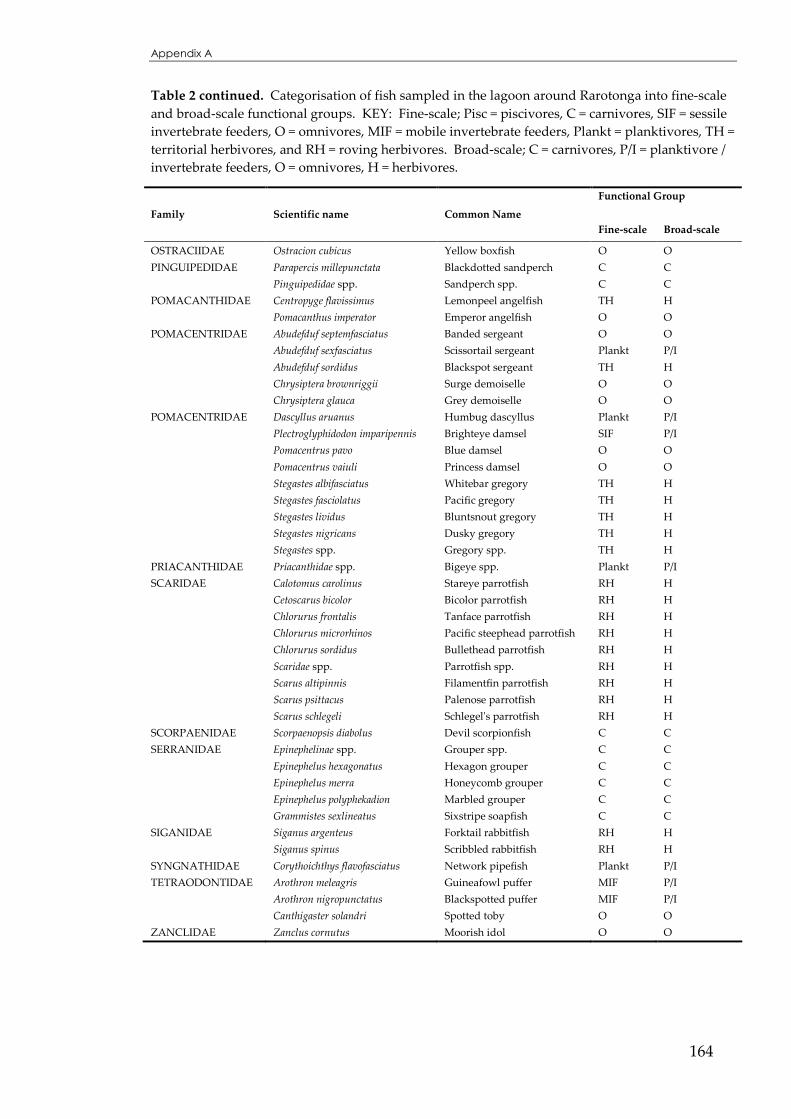
Appendix A
164
Table 2 continued. Categorisation of fish sampled in the lagoon around Rarotonga into fine-scale and broad-scale functional groups. KEY: Fine-scale; Pisc = piscivores, C = carnivores, SIF = sessile invertebrate feeders, O = omnivores, MIF = mobile invertebrate feeders, Plankt = planktivores, TH = territorial herbivores, and RH = roving herbivores. Broad-scale; C = carnivores, P/I = planktivore / invertebrate feeders, O = omnivores, H = herbivores.
Functional Group
Family Scientific name Common Name
Fine-scale Broad-scale
OSTRACIIDAE Ostracion cubicus Yellow boxfish O O
PINGUIPEDIDAE Parapercis millepunctata Blackdotted sandperch C C
Pinguipedidae spp. Sandperch spp. C C
POMACANTHIDAE Centropyge flavissimus Lemonpeel angelfish TH H
Pomacanthus imperator Emperor angelfish O O
POMACENTRIDAE Abudefduf septemfasciatus Banded sergeant O O
Abudefduf sexfasciatus Scissortail sergeant Plankt P/I
Abudefduf sordidus Blackspot sergeant TH H
Chrysiptera brownriggii Surge demoiselle O O
Chrysiptera glauca Grey demoiselle O O
POMACENTRIDAE Dascyllus aruanus Humbug dascyllus Plankt P/I
Plectroglyphidodon imparipennis Brighteye damsel SIF P/I
Pomacentrus pavo Blue damsel O O
Pomacentrus vaiuli Princess damsel O O
Stegastes albifasciatus Whitebar gregory TH H
Stegastes fasciolatus Pacific gregory TH H
Stegastes lividus Bluntsnout gregory TH H
Stegastes nigricans Dusky gregory TH H
Stegastes spp. Gregory spp. TH H
PRIACANTHIDAE Priacanthidae spp. Bigeye spp. Plankt P/I
SCARIDAE Calotomus carolinus Stareye parrotfish RH H
Cetoscarus bicolor Bicolor parrotfish RH H
Chlorurus frontalis Tanface parrotfish RH H
Chlorurus microrhinos Pacific steephead parrotfish RH H
Chlorurus sordidus Bullethead parrotfish RH H
Scaridae spp. Parrotfish spp. RH H
Scarus altipinnis Filamentfin parrotfish RH H
Scarus psittacus Palenose parrotfish RH H
Scarus schlegeli Schlegel's parrotfish RH H
SCORPAENIDAE Scorpaenopsis diabolus Devil scorpionfish C C
SERRANIDAE Epinephelinae spp. Grouper spp. C C
Epinephelus hexagonatus Hexagon grouper C C
Epinephelus merra Honeycomb grouper C C
Epinephelus polyphekadion Marbled grouper C C
Grammistes sexlineatus Sixstripe soapfish C C
SIGANIDAE Siganus argenteus Forktail rabbitfish RH H
Siganus spinus Scribbled rabbitfish RH H
SYNGNATHIDAE Corythoichthys flavofasciatus Network pipefish Plankt P/I
TETRAODONTIDAE Arothron meleagris Guineafowl puffer MIF P/I
Arothron nigropunctatus Blackspotted puffer MIF P/I
Canthigaster solandri Spotted toby O O
ZANCLIDAE Zanclus cornutus Moorish idol O O

Appendix A
165
Figure 1. Cumulative percent cover of substrate per reef-crest site by status (Ra’ui and Control). P-values at top of both charts are results from a MANOVA of Arc-sine square-root transformed proportion substrate cover for each Ra’ui and Control pair. C = live coral, D = dead coral, OA = other algae, P = pavement, R = rubble, S = sand.
0.759 0.278
0%
10%
20%
30%
40%
50%
60%
70%
80%
90%
100%
R C R C
Matavera Parliament
Site
Sub
stra
te C
over

166
APPENDIX B

Appendix B
167
Figure 1. Non-significant length-frequency distributions of each fish species pooled across Ra’ui and Control sites.
Standard length (cm)
Fre
quen
cy
0 5 10 15 20
0.0
0.1
0.2
0.3
0.4
0 5 10 15 20
0.0
0.1
0.2
0.3
0.4
0 5 10 15 20
0.00.10.20.30.40.50.6
0 5 10 15 20
0.00.10.20.30.40.50.6
0 5 10 15 20 25
0.0
0.1
0.2
0.3
0.4
0 5 10 15 20 25
0.0
0.1
0.2
0.3
0.4
0 10 20 30 40
0.0
0.1
0.2
0.3
0.4
0 10 20 30 40
0.0
0.1
0.2
0.3
0.4
Acanthurus triostegus
Ra’ui Control
Ctenochaetus striatus
Naso lituratus
Naso unicornis
Ra’ui
Ra’ui
Ra’ui
Control
Control
Control
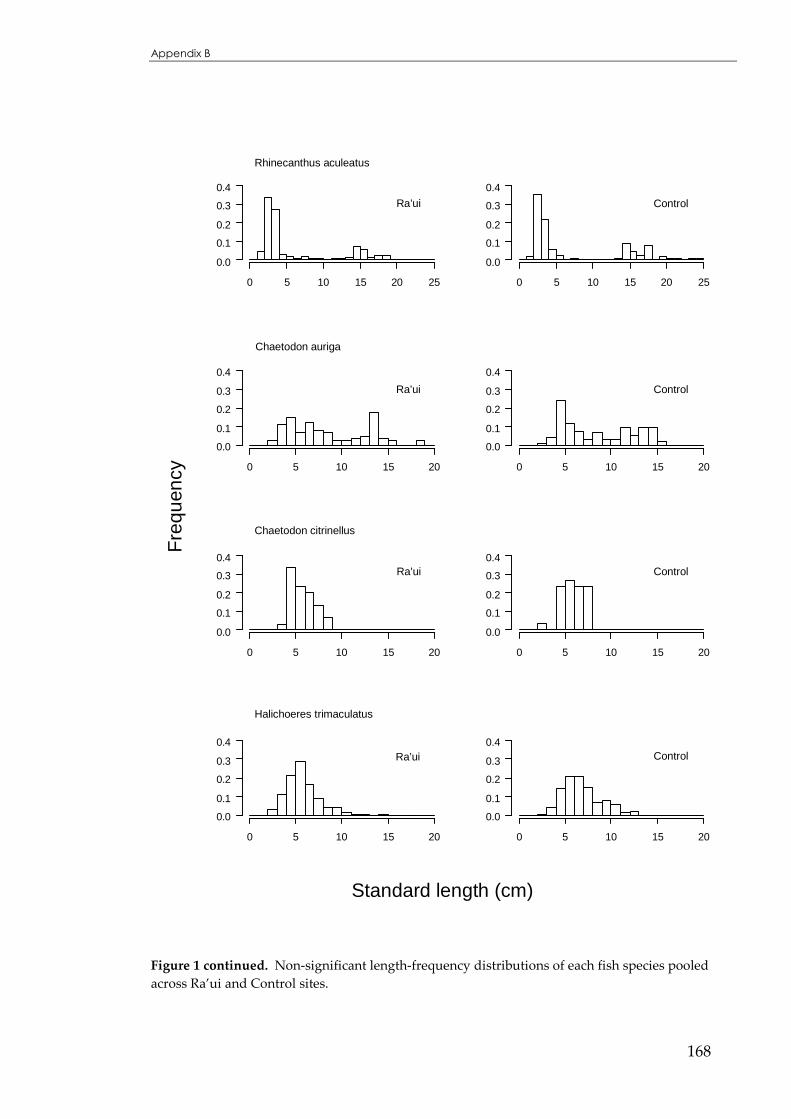
Appendix B
168
Figure 1 continued. Non-significant length-frequency distributions of each fish species pooled across Ra’ui and Control sites.
0 5 10 15 20 25
0.0
0.1
0.2
0.3
0.4
0 5 10 15 20 25
0.0
0.1
0.2
0.3
0.4
0 5 10 15 20
0.0
0.1
0.2
0.3
0.4
0 5 10 15 20
0.0
0.1
0.2
0.3
0.4
0 5 10 15 20
0.0
0.1
0.2
0.3
0.4
0 5 10 15 20
0.0
0.1
0.2
0.3
0.4
0 5 10 15 20
0.0
0.1
0.2
0.3
0.4
0 5 10 15 20
0.0
0.1
0.2
0.3
0.4
Standard length (cm)
Fre
quen
cyRhinecanthus aculeatus
Ra’ui Control
Chaetodon auriga
Chaetodon citrinellus
Halichoeres trimaculatus
Ra’ui
Ra’ui
Ra’ui
Control
Control
Control

Appendix B
169
Figure 1 continued. Non-significant length-frequency distributions of each fish species pooled across Ra’ui and Control sites.
Standard length (cm)
Fre
quen
cyStetholjus bandanensis
Ra’ui Control
Thalassoma lutescens
Thalassoma purpureum
Parupeneus multifasciatus
Ra’ui
Ra’ui
Ra’ui
Control
Control
Control
0 5 10 15 20
0.0
0.1
0.2
0.3
0.4
0 5 10 15 20
0.0
0.1
0.2
0.3
0.4
0 5 10 15 20 25
0.00
0.05
0.10
0.15
0.20
0 5 10 15 20 25
0.00
0.05
0.10
0.15
0.20
0 5 10 15 20 25
0.00
0.05
0.10
0.15
0.20
0 5 10 15 20 25
0.00
0.05
0.10
0.15
0.20
0 5 10 15 20 25 30
0.0
0.2
0.4
0.6
0.8
0 5 10 15 20 25 30
0.0
0.2
0.4
0.6
0.8

Appendix B
170
Figure 1 continued. Non-significant length-frequency distributions of each fish species pooled across Ra’ui and Control sites.
Standard length (cm)
Fre
quen
cyChrysiptera glauca
Ra’ui Control
Stegastes albifasciatus
Chlorurus sordidus
Epinephelus hexagonatus
Ra’ui
Ra’ui
Ra’ui
Control
Control
Control
0 2 4 6 8 10 12
0.00.10.20.30.40.50.6
0 2 4 6 8 10 12
0.00.10.20.30.40.50.6
0 2 4 6 8 10 12
0.00.10.20.30.40.50.6
0 2 4 6 8 10 12
0.00.10.20.30.40.50.6
0 5 10 15 20 25 30 35
0.0
0.1
0.2
0.3
0.4
0 5 10 15 20 25 30 35
0.0
0.1
0.2
0.3
0.4
0 5 10 15 20 25 30
0.0
0.1
0.2
0.3
0.4
0 5 10 15 20 25 30
0.0
0.1
0.2
0.3
0.4
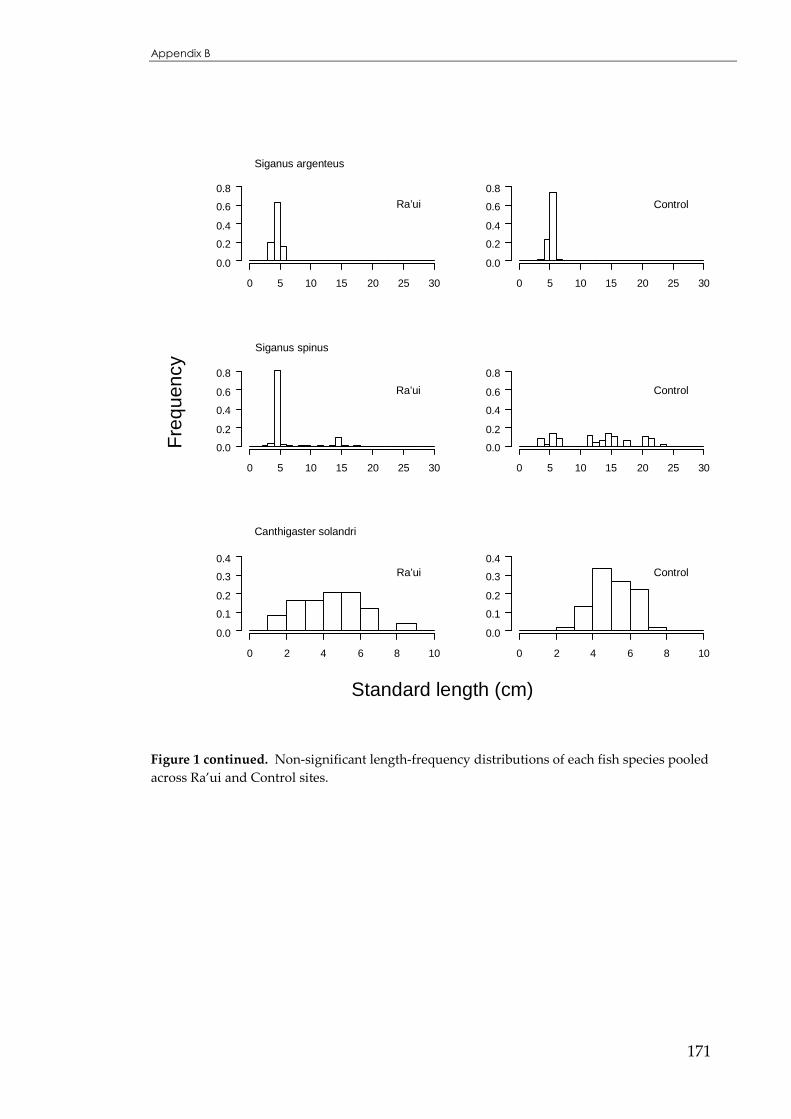
Appendix B
171
0 5 10 15 20 25 30
0.0
0.2
0.4
0.6
0.8
0 5 10 15 20 25 30
0.0
0.2
0.4
0.6
0.8
0 5 10 15 20 25 30
0.0
0.2
0.4
0.6
0.8
0 5 10 15 20 25 30
0.0
0.2
0.4
0.6
0.8
0 2 4 6 8 10
0.0
0.1
0.2
0.3
0.4
0 2 4 6 8 10
0.0
0.1
0.2
0.3
0.4
Standard length (cm)
Fre
quen
cySiganus argenteus
Ra’ui Control
Siganus spinus
Canthigaster solandri
Ra’ui
Ra’ui
Control
Control
Figure 1 continued. Non-significant length-frequency distributions of each fish species pooled across Ra’ui and Control sites.

Appendix B
172
Figure 2. Non-significant length-frequency distributions of each invertebrate species across lagoon Ra’ui and Control sites.
0 5 10 15
0.00.10.20.30.40.50.6
0 5 10 15
0.00.10.20.30.40.50.6
0 5 10 15
0.0
0.1
0.2
0.3
0.4
0 5 10 15
0.0
0.1
0.2
0.3
0.4
0 2 4 6 8 10
0.0
0.2
0.4
0.6
0.8
0 2 4 6 8 10
0.0
0.2
0.4
0.6
0.8
0 5 10 15 20 25 30
0.0
0.1
0.2
0.3
0.4
0 5 10 15 20 25 30
0.0
0.1
0.2
0.3
0.4
Standard length (cm)
Fre
quen
cyDiadema savignyi
Ra’ui Control
Echinothrix diadema
Echinometra oblonga
Actinopyga mauritiana
Ra’ui
Ra’ui
Ra’ui
Control
Control
Control
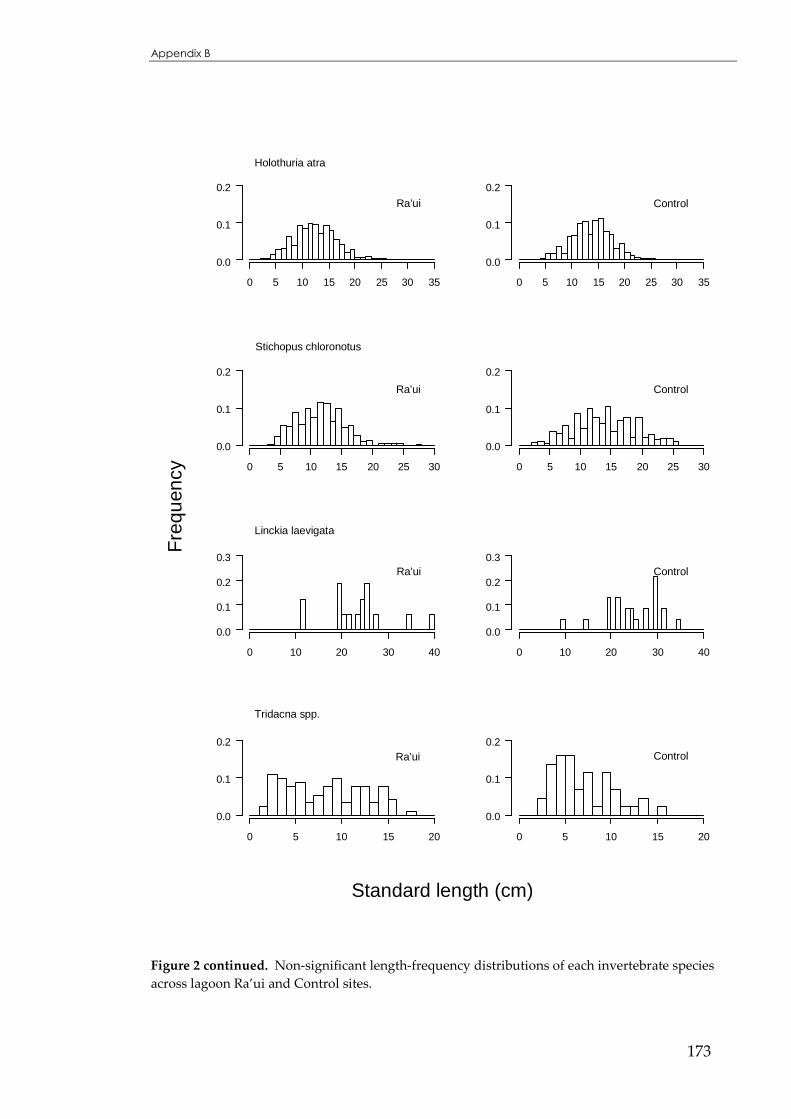
Appendix B
173
Figure 2 continued. Non-significant length-frequency distributions of each invertebrate species across lagoon Ra’ui and Control sites.
0 5 10 15 20 25 30 35
0.0
0.1
0.2
0 5 10 15 20 25 30 35
0.0
0.1
0.2
0 5 10 15 20 25 30
0.0
0.1
0.2
0 5 10 15 20 25 30
0.0
0.1
0.2
0 10 20 30 40
0.0
0.1
0.2
0.3
0 10 20 30 40
0.0
0.1
0.2
0.3
0 5 10 15 20
0.0
0.1
0.2
0 5 10 15 20
0.0
0.1
0.2
Standard length (cm)
Fre
quen
cyHolothuria atra
Ra’ui Control
Stichopus chloronotus
Linckia laevigata
Tridacna spp.
Ra’ui
Ra’ui
Ra’ui
Control
Control
Control

Appendix B
174
0 5 10 15
0.00.10.20.30.40.50.6
0 5 10 15
0.00.10.20.30.40.50.6
0 1 2 3 4 5
0.0
0.2
0.4
0.6
0.8
0 1 2 3 4 5
0.0
0.2
0.4
0.6
0.8
Fre
quen
cyTrochus niloticus
Ra’ui Control
Denropoma maxima
Ra’ui Control
Standard length (cm)
Figure 2 continued. Non-significant length-frequency distributions of each invertebrate species across lagoon Ra’ui and Control sites.

Appendix B
175
Figure 3. Non-significant length-frequency distributions of each invertebrate species across reef-crest Ra’ui and Control sites.
Standard length (cm)
Fre
quen
cyEchinometra mathaei
Ra’ui Control
Heterocentrotus mammillatus
Actinopyga mauritiana
Holothuria atra
Ra’ui
Ra’ui
Ra’ui
Control
Control
Control
0 2 4 6 8 10
0.0
0.2
0.4
0.6
0 2 4 6 8 10
0.0
0.2
0.4
0.6
0 2 4 6 8 10
0.0
0.2
0.4
0.6
0.8
0 2 4 6 8 10
0.0
0.2
0.4
0.6
0.8
0 5 10 15 20 25 30
0.0
0.1
0.2
0 5 10 15 20 25 30
0.0
0.1
0.2
0 5 10 15 20 25 30 35
0.0
0.1
0.2
0 5 10 15 20 25 30 35
0.0
0.1
0.2
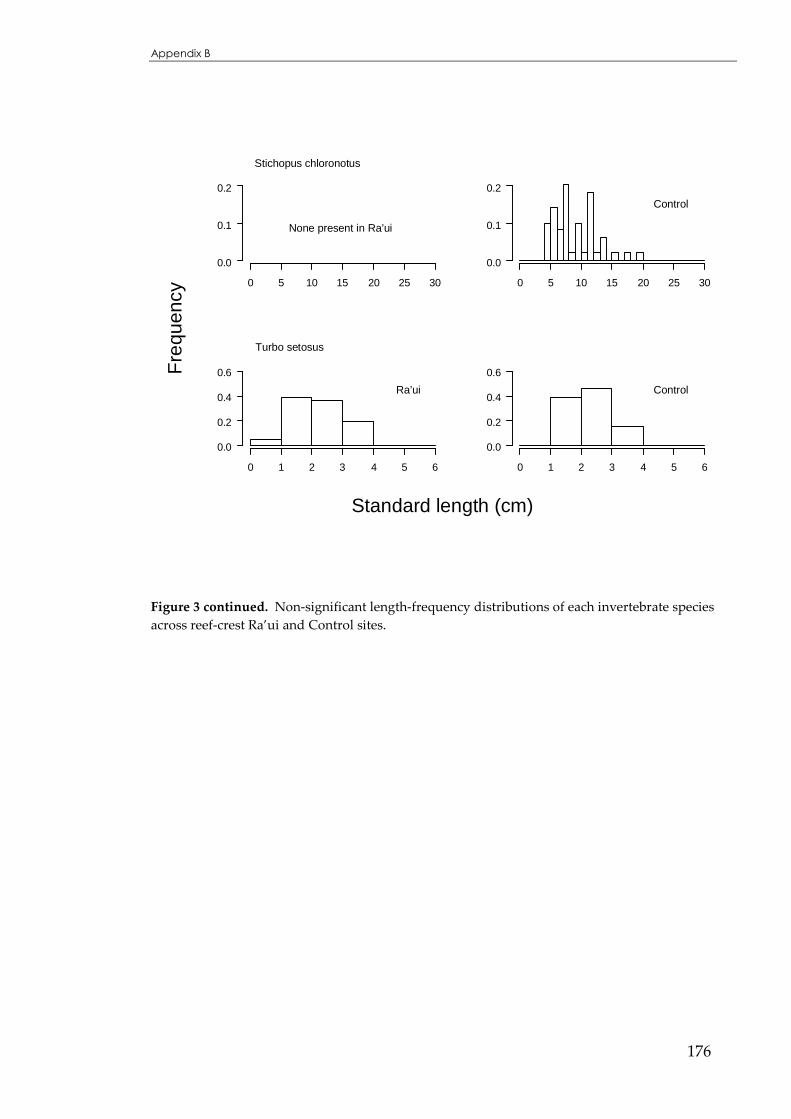
Appendix B
176
0 5 10 15 20 25 30
0.0
0.1
0.2
0 5 10 15 20 25 30
0.0
0.1
0.2
0 1 2 3 4 5 6
0.0
0.2
0.4
0.6
0 1 2 3 4 5 6
0.0
0.2
0.4
0.6
Standard length (cm)
Fre
quen
cyStichopus chloronotus
None present in Ra’ui
Control
Turbo setosus
Ra’ui Control
Figure 3 continued. Non-significant length-frequency distributions of each invertebrate species across reef-crest Ra’ui and Control sites.
177
APPENDIX C

Appendix C
178
Figure 1. Length-frequency distributions of fish species at Ra’ui and corresponding Control sites.
0 5 10 15 20
0.00.20.40.60.8
0 5 10 15 20
0.00.20.40.60.8
0 5 10 15 20
0.00.20.40.60.8
0 5 10 15 20
0.00.20.40.60.8
0 5 10 15 20
0.00.20.40.60.8
0 5 10 15 20
0.00.20.40.60.8
0 5 10 15 20
0.00.20.40.60.8
0 5 10 15 20
0.00.20.40.60.8
Standard length (cm)
Fre
quen
cyAcanthurus triostegus - Akapuao
Ra’ui Control
Acanthurus triostegus - Aroa
Acanthurus triostegus - Aroko
Acanthurus triostegus - Matavera
Ra’ui
Ra’ui
Ra’ui
Control
Control
Control

Appendix C
179
Figure 1 continued. Length-frequency distributions of fish species at Ra’ui and corresponding Control sites.
Standard length (cm)
Fre
quen
cyAcanthurus triostegus - Parliament
Ra’ui Control
Acanthurus triostegus - Tikioki
Ctenochaetus striatus - Akapuao
Ctenochaetus striatus - Aroa
Ra’ui
Ra’ui
Ra’ui
Control
Control
Control
0 5 10 15 20
0.00.20.40.60.8
0 5 10 15 20
0.00.20.40.60.8
0 5 10 15 20
0.00.20.40.60.8
0 5 10 15 20
0.00.20.40.60.8
0 5 10 15 20
0.00.20.40.60.8
0 5 10 15 20
0.00.20.40.60.8
0 5 10 15 20
0.00.20.40.60.8
0 5 10 15 20
0.00.20.40.60.8

Appendix C
180
Figure 1 continued. Length-frequency distributions of fish species at Ra’ui and corresponding Control sites.
0 5 10 15 20
0.00.20.40.60.8
0 5 10 15 20
0.00.20.40.60.8
0 5 10 15 20
0.00.20.40.60.8
0 5 10 15 20
0.00.20.40.60.8
0 5 10 15 20
0.00.20.40.60.8
0 5 10 15 20
0.00.20.40.60.8
0 5 10 15 20
0.00.20.40.60.8
0 5 10 15 20
0.00.20.40.60.8
Standard length (cm)
Fre
quen
cyCtenochaetus striatus - Aroko
Ra’ui Control
Ctenochaetus striatus - Matavera
Ctenochaetus striatus - Parliament
Ctenochaetus striatus - Tikioki
Ra’ui
Ra’ui
Ra’ui
Control
Control
Control

Appendix C
181
Figure 1 continued. Length-frequency distributions of fish species at Ra’ui and corresponding Control sites.
Standard length (cm)
Fre
quen
cyMulloidichthys flavolineatus - Akapuao
Ra’ui Control
Mulloidichthys flavolineatus - Aroa
Mulloidichthys flavolineatus - Aroko
Mulloidichthys flavolineatus - Matavera
Ra’ui
Ra’ui
Ra’ui
Control
Control
Control
0 5 10 15 20 25 30
0.00.20.40.60.8
0 5 10 15 20 25 30
0.00.20.40.60.8
0 5 10 15 20 25 30
0.00.20.40.60.8
0 5 10 15 20 25 30
0.00.20.40.60.8
0 5 10 15 20 25 30
0.00.20.40.60.8
0 5 10 15 20 25 30
0.00.20.40.60.8
0 5 10 15 20 25 30
0.00.20.40.60.8
0 5 10 15 20 25 30
0.00.20.40.60.8

Appendix C
182
Figure 1 continued. Length-frequency distributions of fish species at Ra’ui and corresponding Control sites.
Standard length (cm)
Fre
quen
cyMulloidichthys flavolineatus - Parliament
Ra’ui Control
Mulloidichthys flavolineatus - Tikioki
Chlorurus sordidus - Akapuao
Chlorurus sordidus - Aroko
Ra’ui
Ra’ui
Ra’ui
Control
Control
Control
0 5 10 15 20 25 30
0.00.20.40.60.8
0 5 10 15 20 25 30
0.00.20.40.60.8
0 5 10 15 20 25 30
0.00.20.40.60.8
0 5 10 15 20 25 30
0.00.20.40.60.8
0 5 10 15 20 25 30 35
0.00.20.40.60.8
0 5 10 15 20 25 30 35
0.00.20.40.60.8
0 5 10 15 20 25 30 35
0.00.20.40.60.81.0
0 5 10 15 20 25 30 35
0.00.20.40.60.81.0

Appendix C
183
Figure 1 continued. Length-frequency distributions of fish species at Ra’ui and corresponding Control sites.
Standard length (cm)
Fre
quen
cyChlorurus sordidus - Tikioki
Ra’ui Control
Siganus argenteus - Akapuao
Siganus argenteus - Aroa
Siganus argenteus - Aroko
Ra’ui
Ra’ui
Ra’ui
Control
Control
Control
0 5 10 15 20 25 30 35
0.00.20.40.60.8
0 5 10 15 20 25 30 35
0.00.20.40.60.8
0 5 10 15 20 25 30
0.00.20.40.60.81.0
0 5 10 15 20 25 30
0.00.20.40.60.81.0
0 5 10 15 20 25 30
0.00.20.40.60.81.0
0 5 10 15 20 25 30
0.00.20.40.60.81.0
0 5 10 15 20 25 30
0.00.20.40.60.81.0
0 5 10 15 20 25 30
0.00.20.40.60.81.0

Appendix C
184
Standard length (cm)
Fre
quen
cySiganus argenteus - Matavera
Ra’ui Control
Siganus argenteus - Parliament
Siganus argenteus - Tikioki
Ra’ui
Ra’ui
Control
Control
0 5 10 15 20 25 30
0.00.20.40.60.81.0
0 5 10 15 20 25 30
0.00.20.40.60.81.0
0 5 10 15 20 25 30
0.00.20.40.60.81.0
0 5 10 15 20 25 30
0.00.20.40.60.81.0
0 5 10 15 20 25 30
0.00.20.40.60.81.0
0 5 10 15 20 25 30
0.00.20.40.60.81.0
Figure 1 continued. Length-frequency distributions of fish species at Ra’ui and corresponding Control sites.

Appendix C
185
Figure 2. Length-frequency distributions of lagoon invertebrate species at Ra’ui and corresponding Control sites.
0 5 10 15
0.00.20.40.60.81.0
0 5 10 15
0.00.20.40.60.81.0
0 5 10 15
0.00.20.40.60.81.0
0 5 10 15
0.00.20.40.60.81.0
0 5 10 15
0.00.20.40.60.81.0
0 5 10 15
0.00.20.40.60.81.0
0 2 4 6 8 10
0.00.10.20.30.40.50.6
0 2 4 6 8 10
0.00.10.20.30.40.50.6
Fre
quen
cyDiadema savignyi - Aroa
Ra’ui Control
Echinothrix diadema - Aroa
Echinothrix diadema - Tikioki
Ra’ui
Ra’ui
Control
Control
Standard length (cm)
Echinometra mathaei - Akapuao
Ra’ui Control

Appendix C
186
Figure 2 continued. Length-frequency distributions of lagoon invertebrate species at Ra’ui and corresponding Control sites.
0 2 4 6 8 10
0.0
0.2
0.4
0.6
0 2 4 6 8 10
0.0
0.2
0.4
0.6
0 2 4 6 8 10
0.0
0.2
0.4
0.6
0 2 4 6 8 10
0.0
0.2
0.4
0.6
0 2 4 6 8 10
0.0
0.2
0.4
0.6
0 2 4 6 8 10
0.0
0.2
0.4
0.6
0 2 4 6 8 10
0.0
0.2
0.4
0.6
0 2 4 6 8 10
Fre
quen
cyEchinometra mathaei - Aroa
Ra’ui Control
Echinometra mathaei - Aroko
Echinometra mathaei - Matavera
Ra’ui
Ra’ui
Control
Control
Standard length (cm)
Echinometra mathaei - Parliament
Ra’ui Control

Appendix C
187
Figure 2 continued. Length-frequency distributions of lagoon invertebrate species at Ra’ui and corresponding Control sites.
Fre
quen
cyEchinometra mathaei - Tikioki
Ra’ui Control
Holothuria atra - Akapuao
Holothuria atra - Aroa
Ra’ui
Ra’ui
Control
Control
Standard length (cm)
Holothuria atra - Aroko
Ra’ui Control
0 2 4 6 8 10
0.0
0.2
0.4
0.6
0 2 4 6 8 10
0.0
0.2
0.4
0.6
0 5 10 15 20 25 30 35
0.00.10.20.30.4
0 5 10 15 20 25 30 35
0.00.10.20.30.4
0 5 10 15 20 25 30 35
0.00.10.20.30.4
0 5 10 15 20 25 30 35
0.00.10.20.30.4
0 5 10 15 20 25 30 35
0.00.10.20.30.4
0 5 10 15 20 25 30 35
0.00.10.20.30.4

Appendix C
188
Figure 2 continued. Length-frequency distributions of lagoon invertebrate species at Ra’ui and corresponding Control sites.
Fre
quen
cyHolothuria atra - Matavera
Ra’ui Control
Holothuria atra - Parliament
Holothuria atra - Tikioki
Ra’ui
Ra’ui
Control
Control
Standard length (cm)
Stichopus chloronotus - Aroa
Ra’ui Control
0 5 10 15 20 25 30 35
0.00.10.20.30.4
0 5 10 15 20 25 30 35
0.00.10.20.30.4
0 5 10 15 20 25 30 35
0.00.10.20.30.4
0 5 10 15 20 25 30 35
0.00.10.20.30.4
0 5 10 15 20 25 30 35
0.00.10.20.30.4
0 5 10 15 20 25 30 35
0.00.10.20.30.4
0 5 10 15 20 25 30 35
0.00.10.20.30.4
0 5 10 15 20 25 30 35
0.00.10.20.30.4

Appendix C
189
Figure 2 continued. Length-frequency distributions of lagoon invertebrate species at Ra’ui and corresponding Control sites.
Fre
quen
cyStichopus chloronotus - Matavera
Ra’ui Control
Stichopus chloronotus - Parliament
Tripneustes gratilla - Aroa
Ra’ui
Ra’ui
Control
Control
Standard length (cm)
Tridacna spp. - Akapuao
Ra’ui Control
0 5 10 15 20 25 30 35
0.00.10.20.30.4
0 5 10 15 20 25 30 35
0.00.10.20.30.4
0 5 10 15 20 25 30 35
0.00.10.20.30.4
0 5 10 15 20 25 30 35
0.00.10.20.30.4
0 5 10 15
0.00.20.40.60.81.0
0 5 10 15
0.00.20.40.60.81.0
0 5 10 15 20
0.00.20.40.60.8
0 5 10 15 20
0.00.20.40.60.8

Appendix C
190
Figure 2 continued. Length-frequency distributions of lagoon invertebrate species at Ra’ui and corresponding Control sites.
Fre
quen
cyTridacna spp. - Aroa
Ra’ui Control
Tridacna spp. - Tikioki
Trochus niloticus - Aroa
Ra’ui
Ra’ui
Control
Control
Standard length (cm)
Trochus niloticus - Aroko
Ra’ui Control
0 5 10 15 20
0.00.20.40.60.8
0 5 10 15 20
0.00.20.40.60.8
0 5 10 15 20
0.00.20.40.60.8
0 5 10 15 20
0.00.20.40.60.8
0 5 10 15
0.0
0.2
0.4
0.6
0 5 10 15
0.0
0.2
0.4
0.6
0 5 10 15
0.0
0.2
0.4
0.6
0 5 10 15
0.0
0.2
0.4
0.6

Appendix C
191
Figure 2 continued. Length-frequency distributions of lagoon invertebrate species at Ra’ui and corresponding Control sites.
Fre
quen
cyTrochus niloticus - Matavera
Ra’ui Control
Trochus niloticus - Parliament
Dendropoma maxima - Akapuao
Ra’ui
Ra’ui
Control
Control
Standard length (cm)
Dendropoma maxima - Aroa
Ra’ui Control
0 5 10 15
0.0
0.2
0.4
0.6
0 5 10 15
0.0
0.2
0.4
0.6
0 5 10 15
0.0
0.2
0.4
0.6
0 5 10 15
0.0
0.2
0.4
0.6
0 1 2 3 4 5
0.00.20.40.60.81.0
0 1 2 3 4 5
0.00.20.40.60.81.0
0 1 2 3 4 5
0.00.20.40.60.81.0
0 1 2 3 4 5
0.00.20.40.60.81.0
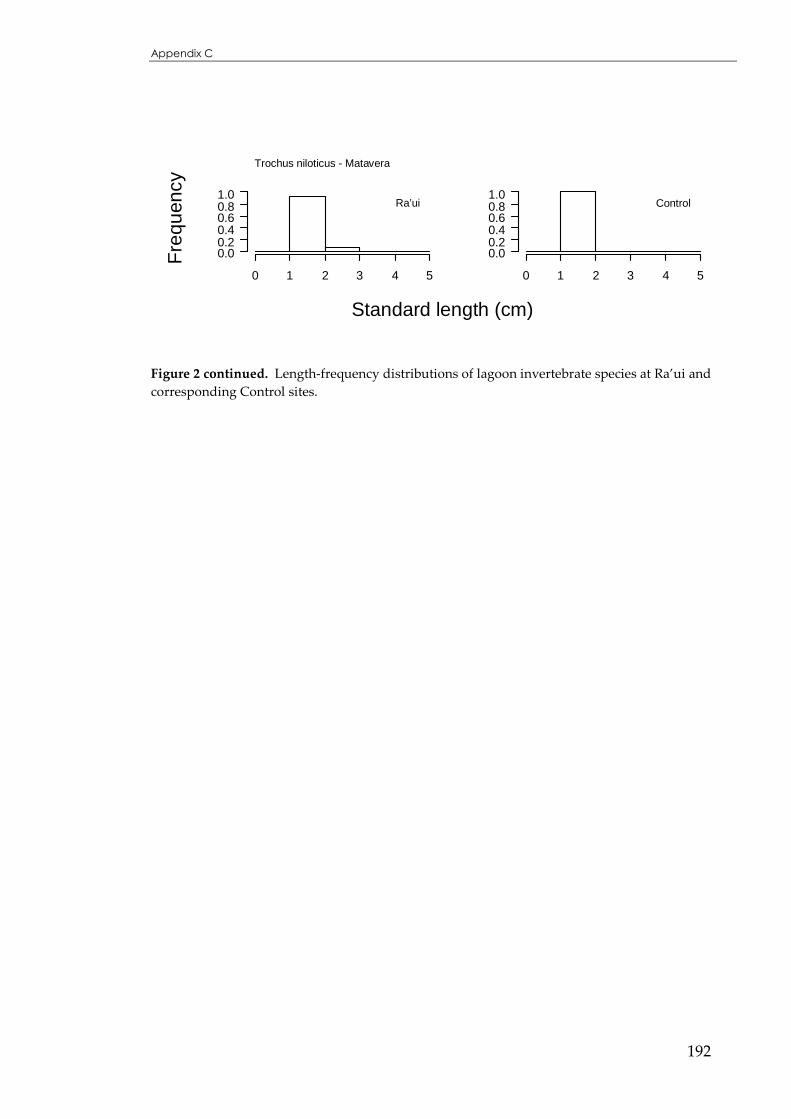
Appendix C
192
0 1 2 3 4 5
0.00.20.40.60.81.0
0 1 2 3 4 5
0.00.20.40.60.81.0
Fre
quen
cyTrochus niloticus - Matavera
Ra’ui Control
Standard length (cm)
Figure 2 continued. Length-frequency distributions of lagoon invertebrate species at Ra’ui and corresponding Control sites.

Appendix C
193
Figure 3. Length-frequency distributions of reef-crest invertebrate species at Ra’ui and corresponding Control sites.
0 5 10 15
0.00.20.40.60.81.0
0 5 10 15
0.00.20.40.60.81.0
0 2 4 6 8 10
0.00.20.40.60.81.0
0 2 4 6 8 10
0.00.20.40.60.81.0
0 2 4 6 8 10
0.00.20.40.60.81.0
0 2 4 6 8 10
0.00.20.40.60.81.0
0 2 4 6 8 10
0.00.20.40.60.81.0
0 2 4 6 8 10
0.00.20.40.60.81.0
Fre
quen
cyEchinothrix diadema - Parliament
Ra’ui Control
Echinometra mathaei - Matavera
Echinometra mathaei - Parliament
Ra’ui
Ra’ui
Control
Control
Standard length (cm)
Echinometra oblonga - Matavera
Ra’ui Control

Appendix C
194
Figure 3 continued. Length-frequency distributions of reef-crest invertebrate species at Ra’ui and corresponding Control sites.
0 2 4 6 8 10
0.00.20.40.60.81.0
0 2 4 6 8 10
0.00.20.40.60.81.0
0 5 10 15 20 25 30
0.0
0.1
0.2
0 5 10 15 20 25 30
0.0
0.1
0.2
0 5 10 15 20 25 30
0.0
0.1
0.2
0 5 10 15 20 25 30
0.0
0.1
0.2
0 5 10 15 20 25 30
0.0
0.1
0.2
0 5 10 15 20 25 30
0.0
0.1
0.2
Fre
quen
cyEchinometra oblonga - Parliament
Ra’ui Control
Actinopyga mauritiana - Matavera
Actinopyga mauritiana - Parliament
Ra’ui
Ra’ui
Control
Control
Standard length (cm)
Holothuria atra - Matavera
Ra’ui Control

Appendix C
195
Figure 3 continued. Length-frequency distributions of reef-crest invertebrate species at Ra’ui and corresponding Control sites.
0 5 10 15 20 25 30
0.0
0.1
0.2
0 5 10 15 20 25 30
0.0
0.1
0.2
0 5 10 15
0.0
0.2
0.4
0.6
0 5 10 15
0.0
0.2
0.4
0.6
0 5 10 15
0.0
0.2
0.4
0.6
0 5 10 15
0.0
0.2
0.4
0.6
0 2 4 6 8 10
0.0
0.2
0.4
0.6
0 2 4 6 8 10
0.0
0.2
0.4
0.6
Fre
quen
cyHolothuria atra - Parliament
Ra’ui Control
Trochus niloticus - Matavera
Trochus niloticus - Parliament
Ra’ui
Ra’ui
None present in Control
Control
Standard length (cm)
Turbo setosus - Matavera
Ra’ui Control

Appendix C
196
Table 1. Partial correlation coefficients computed in SPSS (SPSS Inc. 2008) while controlling for the effects of the dependent variables of Ra’ui effectiveness A. density; B. mean size; C. maximum size, to assess if there were any correlations between the predictor variables to be included in multiple regressions (Area = Ra’ui area, Crest = distance to reef crest, Pop = human population, and Fish = total fish density).
Control variables Predictor variables AREA CREST POP FISH
A: DENSITY AREA Correlation 1.000 .633 .400 .431
p-value (2-tailed) . .251 .505 .468
df 0 3 3 3
CREST Correlation .633 1.000 .298 .646
p-value (2-tailed) .251 . .626 .239
df 3 0 3 3
POP Correlation .400 .298 1.000 .800
p-value(2-tailed) .505 .626 . .104
df 3 3 0 3
FISH Correlation .431 .646 .800 1.000
p-value (2-tailed) .468 .239 .104 .
df 3 3 3 0
B: MEAN SIZE AREA Correlation 1.000 .047 -.510 -.630
p-value (2-tailed) . .941 .380 .255
df 0 3 3 3
CREST Correlation .047 1.000 -.334 .112
p-value (2-tailed) .941 . .583 .858
df 3 0 3 3
POP Correlation -.510 -.334 1.000 .419
p-value(2-tailed) .380 .583 . .483
df 3 3 0 3
FISH Correlation -.630 .112 .419 1.000
p-value (2-tailed) .255 .858 .483 .
df 3 3 3 0
C: MAXIMUM SIZE AREA Correlation 1.000 .548 -.036 -.112
p-value (2-tailed) . .339 .954 .858
df 0 3 3 3
CREST Correlation .548 1.000 .252 .549
p-value (2-tailed) .339 . .682 .337
df 3 0 3 3
POP Correlation -.036 .252 1.000 .634
p-value(2-tailed) .954 .682 . .250
df 3 3 0 3
FISH Correlation -.112 .549 .634 1.000
p-value (2-tailed) .858 .337 .250 .
df 3 3 3 0

Appendix C
197
Table 2. Multiple regression model summary output from the R statistical platform (R Development Core Team 2006) of Ra’ui characteristics (Ra’ui area, distance to reef crest, human population, and total fish density) as predictors of Ra’ui effectiveness (i.e., the proportion of fish and invertebrates exhibiting greater densities in Ra’ui than corresponding Control sites).
Model Summary
Residuals:
1 2 3 4 5 6
-0.03448 -0.03497 0.06772 -0.04361 0.15590 -0.11055
Coefficients: Estimate Standard
Error t value Pr (>\|t|)
Intercept 0.5618060 0.3675436 1.529 0.266
Distance to reef crest -0.0004406 0.0003978 -1.107 0.383
Human population -0.0003868 0.0003557 -1.087 0.390
Total fish density 0.2998765 0.2540733 1.180 0.359
Residual standard error: 0.1507 on 2 degrees of freedom
Multiple R-Squared: 0.5132 Adjusted R-
squared: -0.2169
F-statistic: 0.7029 on 3 and 2 DF p-value: 0.6323

Appendix C
198
Table 3. Multiple regression model summary output from the R statistical platform (R Development Core Team 2006) of Ra’ui characteristics (Ra’ui area, distance to reef crest, human population, and total fish density) as predictors of Ra’ui effectiveness (i.e., the proportion of fish and invertebrates exhibiting greater mean size in Ra’ui than corresponding Control sites).
Model Summary
Residuals:
1 2 3 4 5 6
-0.003510 0.002730 -0.018528 -0.038297 0.105229 -0.042164
Coefficients: Estimate Standard
Error t value Pr (>\|t|)
Intercept 0.625645 0.090947 6.879 0.00629
Ra’ui area -0.006156 0.002010 -3.063. 0.05488
Total fish density -0.199746 0.069720 -2.865 0.06432
Residual standard error: 0.06995 on 3 degrees of freedom
Multiple R-Squared: 0.9145 Adjusted R-
squared: 0.8575
F-statistic: 16.05 on 2 and 3 DF p-value: 0.02500
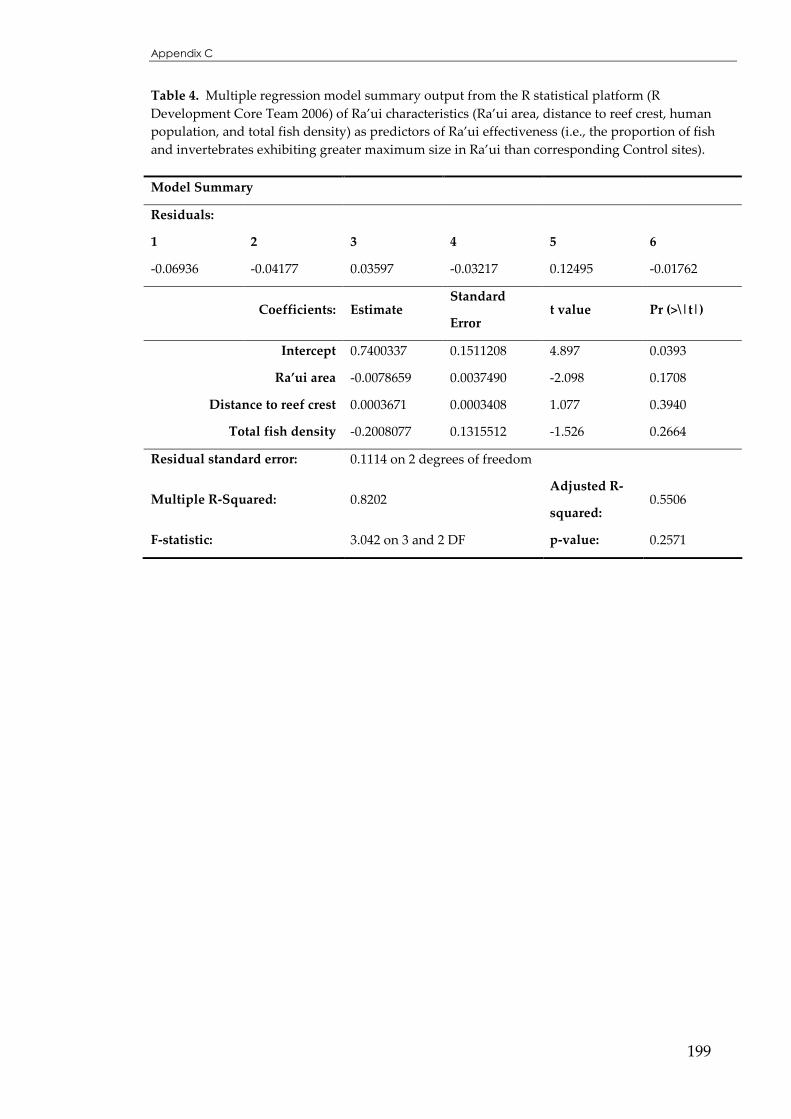
Appendix C
199
Table 4. Multiple regression model summary output from the R statistical platform (R Development Core Team 2006) of Ra’ui characteristics (Ra’ui area, distance to reef crest, human population, and total fish density) as predictors of Ra’ui effectiveness (i.e., the proportion of fish and invertebrates exhibiting greater maximum size in Ra’ui than corresponding Control sites).
Model Summary
Residuals:
1 2 3 4 5 6
-0.06936 -0.04177 0.03597 -0.03217 0.12495 -0.01762
Coefficients: Estimate Standard
Error t value Pr (>\|t|)
Intercept 0.7400337 0.1511208 4.897 0.0393
Ra’ui area -0.0078659 0.0037490 -2.098 0.1708
Distance to reef crest 0.0003671 0.0003408 1.077 0.3940
Total fish density -0.2008077 0.1315512 -1.526 0.2664
Residual standard error: 0.1114 on 2 degrees of freedom
Multiple R-Squared: 0.8202 Adjusted R-
squared: 0.5506
F-statistic: 3.042 on 3 and 2 DF p-value: 0.2571

200
REFERENCES
Adams T. (1998). The interface between traditional and modern methods of fishery
management in the Pacific Islands. Ocean & Coastal Management, 40(2-3):
127-142.
Agardy T., Bridgewater P., Crosby M., Day J., Dayton P., Kenchington R., Laffoley
D., McConney P., Murray P., Parks J. & Peau L. (2003). Dangerous targets?
Unresolved issues and ideological clashes around marine protected areas.
Aquatic Conservation: Marine and Freshwater Ecosystems, 13(4): 353-367.
Al-Jufaili S., Al-Jabri M., Al-Baluchi A., Baldwin R.M., Wilson S.C., West F. &
Matthews A.D. (1999). Human impacts on coral reefs in the Sultanate of
Oman. Estuarine, Coastal and Shelf Science, 49: 65-74.
Ama A. (2003). Maeva. Rites of passage: the highlights of family life. In:
Akono'anga Maori; Cook Islands Culture. (ed. Crocombe RM). pp. 119-125.
Institute of Pacific Studies, University of the South Pacific.
Anderson M., J. (2001). A new method for non-parametric multivariate analysis of
variance. Austral Ecology, 26: 32-46.
Andrefouet S., Pages J. & Tartinville B. (2001). Water renewal time for
classification of atoll lagoons in the Tuamotu Archipelago (French
Polynesia). Coral Reefs, 20(4): 399-408.
Ashworth J.S., Ormond R.F.G. & Sturrock H.T. (2004). Effects of reef-top gathering
and fishing on invertebrate abundance across take and no-take zones.
Journal of Experimental Marine Biology and Ecology, 303(2): 221-242.
Aswani S., Albert S., Sabetian A. & Furusawa T. (2007). Customary management
as precautionary and adaptive principles for protecting coral reefs in
Oceania. Coral Reefs, 26(4): 1009-1021.

References
201
Aswani S. & Weiant P. (2004). Scientific evaluation in women's participatory
management: Monitoring marine invertebrate refugia in the Solomon
Islands. Human Organization, 63(3): 301-319.
Bakus G.J. (1973). The biology and ecology of tropical holothurians. In: Biology
and geology of coral reefs (eds. Jones OA & Endean R). pp. 325-367.
Academic Press, New York.
Balmford A., Gravestock P., Hockley N., McClean C.J. & Roberts C.M. (2004). The
worldwide costs of marine protected areas. Proceedings of the National
Academy of Sciences of the United States of America, 101(26): 9694-9697.
Barclay R.F.R. (2001). Kaitiakitanga, raahui and ra'ui: traditional resource
management ethics in Aotearoa and the Cook Islands. Te Taarere aa Tawhaki;
Journal of the Waikato University College: 106-117.
Begg G.A., Mapstone B.D., Williams A.J., Adams S., Davies C.R. & Lou D.C.
(2005). Multivariate life-history indices of exploited coral reef fish
populations used to measure the performance of no-take zones in a marine
protected area. Canadian Journal of Fisheries and Aquatic Sciences, 62(3): 679-
692.
Bellwood D.R., Hughes T.P., Folke C. & Nystrom M. (2004). Confronting the coral
reef crisis. Nature, 429(24 June): 827-833.
Blueweiss L., Fox H., Kudzman D., Peters R. & Sams S. (1978). Relationships
between body size and some life history parameters. Oecologia, 37(257-272).
Blyth-Skyrme R.E., Kaiser M.J., Hiddink J.G., Edwards-Jones G. & Hart P.J.B.
(2006). Conservation benefits of temperate marine protected areas: variation
among fish species. Conservation Biology, 20(3): 811-820.
Boersma P.D. & Parrish J.K. (1999). Limiting abuse: marine protected areas, a
limited solution. Ecological Economics, 31(2): 287-304.
References
202
Bohnsack J.A. (1998). Application of marine reserves to reef fisheries management.
Austral Ecology, 23(3): 298-304.
Botsford L.W. (2005). Potential contributions of marine reserves to sustainable
fisheries: Recent modelling results. Bulletin of Marine Science, 76(2): 245-259.
Botsford L.W., Castilla J.C. & Peterson C.H. (1997). The Management of Fisheries
and Marine Ecosystems. Science, 277(5325): 509-515.
Botsford L.W., Hastings A. & Gaines S.D. (2001). Dependence of sustainability on
the configuration of marine reserves and larval dispersal distance. Ecology
Letters, 4(2): 144-150.
Botsford L.W., Micheli F. & Hastings A. (2003). Principles for the design of marine
reserves. Ecological Applications, 13(1 Supplement): S25-S31.
Bour W. (1990). The Fishery Resources of Pacific Island Countries. Part Three:
Trochus. FAO fisheries technical paper. Food and agriculture organisation of
the United Nations. Noumea, New Caledonia. 89 pp.
Box G.E.P. & Tiao G.C. (1975). Intervention Analysis with Applications to
Economic and Environmental Problems. Journal of the American Statistical
Association, 70(349): 70-79.
Buechner M. (1987). Conservation in insular parks: Simulation models of factors
affecting the movement of animals across park boundaries. Biological
Conservation, 41(1): 57-76.
Buse J. & Taringa R. (1996). Cook Islands Maori dictionary. Research School of
Pacific and Asian Studies, Australian National University, Canberra. 712
pp.
Buxton C.D. & Smale M.J. (1989). Abundance and Distribution Patterns of Three
Temperate Marine Reef Fish (Teleostei: Sparidae) in Exploited and
Unexploited Areas Off the Southern Cape Coast. Journal of Applied Ecology,
26(2): 441-451.

References
203
Byers J.E. & Noonburg E.G. (2007). Poaching, enforcement, and the efficacy of
marine reserves. Ecological Applications, 17: 1851-1856.
Calamia M. (1999). A methodology for incorporating traditional ecological
knowledge with geographic information systems for marine resource
management in the Pacific. SPC Traditional Marine Resource Management and
Knowledge Information Bulletin. 10. 2-12 pp.
Chapman M.R. & Kramer D.L. (1999). Gradients in coral reef fish density and size
across the Barbados Marine Reserve boundary: Effects of reserve protection
and habitat characteristics. Marine Ecology Progress Series, 181: 81-96.
Chateau O. & Wantiez L. (2005). Comparison of coral reef fish communities
between two fished and one protected reefs in New Caledonia South
Lagoon Marine Park. Cybium, 29(2): 159-174.
Chesson J. (1978). Measuring preference in selective predation. Ecology, 59: 211-
215.
Chesson J. (1983). The estimation and analysis of preference and its relationship to
foraging models. Ecology, 64(5): 1297-1304.
Chittaro P.M. (2004). Fish-habitat associations across multiple spatial scales. Coral
Reefs, 23: 235-244.
Choat J.H. & Robertson D.R. (2002). Age-based studies on coral reef fishes. In:
Coral reef fishes: dynamics and diversity in a complex ecosystem (ed. Sale
PF). pp. 57-80. Academic Press, San Diego.
Churcher-Hoffman T. (2001). Reefs of life to reefs of death: the political ecology of
coral reef health in Fiji and the Cook Islands. Doctoral Thesis. Department
of Geography. University of California. Berkeley. 333 pp.
Churcher-Hoffman T. (2002a). Coral reef health and effects of socio-economic
factors in Fiji and Cook Islands. Marine pollution bulletin, 44: 1281-1293.

References
204
Churcher-Hoffman T. (2002b). The reimplementation of the Ra'ui: coral reef
management in Rarotonga, Cook Islands. Coastal Management, 30: 401-418.
Claudet J., Osenberg C.W., Benedetti-Cecchi L., Domenici P., García-Charton J.-A.,
Perez-Ruzafa A., Badalamenti F., Bayle-Sempere J., Brito A., Bulleri F.,
Culioli J.-M., Dimech M., Falcon J.M., Guala I., Milazzo M., Sanchez-Meca
J., Somerfield P.J., Stobart B., Vandeperre F., Valle C. & Planes S. (2008).
Marine reserves: size and age do matter. Ecology Letters, 11(5): 481-489.
Claudet J., Pelletier D., Jouvenel J.Y., Bachet F. & Galzin R. (2006). Assessing the
effects of marine protected area (MPA) on a reef fish assemblage in a north-
western Mediterranean marine reserve: Identifying community-based
indicators. Biological Conservation, 130(3): 349-369.
Cole R.G., Ayling A.M. & Creese R.G. (1990). Effects of marine protection at Goat
Island, northern New Zealand. New Zealand Journal of Marine and Freshwater
Research, 24: 197-210.
Cole R.G., Syms C., Davey N.K., Gust N., Notman P., Stewart R., Radford C.A.,
Carbines G., Carr M.H. & Jeffs A.G. (2007). Does breathing apparatus affect
fish counts and observations? A comparison at three New Zealand fished
and protected areas. Marine Biology, 150: 1379–1395.
Côté I.M., Mosquera I. & Reynolds J.D. (2001). Effects of marine reserve
characteristics on the protection of fish populations: a meta-analysis. Journal
of Fish Biology, 59((Supplement A)): 178-189.
Crawley M.J. (2007). The R book. John Wiley & Sons Ltd., Chichester. 942 pp.
Cucknell M.J. (2005). Description of physical substrate and coral composition
around Rarotonga lagoon, Cook Islands. Masters Thesis. School of Ocean
Sciences University of Wales. Bangor. 130 pp.

References
205
Dahlgren C.P. & Eggleston D.B. (2001). Spatio-temporal variability in abundance,
size and microhabitat associations of early juvenile Nassau grouper
Epinephelus striatus in an off-reef nursery system. Marine Ecology-Progress
Series, 217: 145-156.
Diamant A. (1989). Ecology of the acanthocephalan Sclerocollum rubrimaris Schmidt
and Paperna, 1978 (Rhadinorhynchidae: Gorgorhynchinae) from wild
populations of rabbitfish (genus Siganus) in the northern Red Sea. Journal of
Fish Biology, 34(3): 387-397.
Diamond J. (1975). The island dilemma: lessons of modern biogeographic studies
for the design of natural reserves. Biological Conservation, 7: 129-146.
Dominici-Arosemena A. & Wolff M. (2005). Reef fish community structure in
Bocas del Toro (Caribbean, Panama): Gradients in habitat complexity and
exposure. Caribbean Journal of Science, 41(3): 613-637.
Drumm D.J. (2004). Habitats and macroinvertebrate fauna of the reef-top of
Rarotonga, Cook Islands: implications for fisheries and conservation
management. Doctoral Thesis. Marine Science Department. University of
Otago. Dunedin. 277 pp.
Dudas S.E., McGaw I.J. & Dower J.F. (2005). Selective crab predation on native and
introduced bivalves in British Columbia. Journal of Experimental Marine
Biology and Ecology, 325(1): 8-17.
Dufour V., Jouvenel J.Y. & Galzin R. (1995). Study of a Mediterranean reef fish
assemblage - Comparisons of population-distributions between depths in
protected and unprotected areas over one decade. Aquatic Living Resources,
8(1): 17-25.
Dugan J.E. & Davis G.E. (1993). Applications of marine refugia to coastal fisheries
management. Canadian Journal of Fisheries and Aquatic Sciences, 50(9): 2029-
2042.

References
206
Dulvy N.K., Freckleton R.P. & Polunin N.V. (2004a). Coral reef cascades and the
indirect effects of predator removal by exploitation. Ecology Letters, 7: 410-
416.
Dulvy N.K., Polunin N.V.C., Mill A.C. & Graham N.A.J. (2004b). Size structural
change in lightly exploited coral reef fish communities: evidence for weak
indirect effects. Canadian Journal of Fisheries and Aquatic Sciences, 61(3): 466.
Edgar G.J. & Barrett N.S. (1997). Short term monitoring of biotic change in
Tasmanian marine reserves. Journal of Experimental Marine Biology and
Ecology, 213(2): 261-279.
Edgar G.J. & Barrett N.S. (1999). Effects of the declaration of marine reserves on
Tasmanian reef fishes, invertebrates and plants. Journal of Experimental
Marine Biology and Ecology, 242(1): 107-144.
Edgar G.J., Bustamante R.H., Farina J.M., Calvopina M., Martinez C. & Toral-
Granda M.V. (2004). Bias in evaluating the effects of marine protected areas:
the importance of baseline data for the Galapagos Marine Reserve.
Environmental Conservation, 31(3): 212-218.
Edgar G.J., Samson C.R. & Barrett N.S. (2005). Species extinction in the marine
environment: Tasmania as a regional Example of overlooked losses in
biodiversity. Conservation Biology, 19(4): 1294-1300.
Egerton J. (2005). The abundance, distribution, and biomass of coral reef fish
around the Rarotongan lagoon, Cook Islands. Masters Thesis. School of
Ocean Sciences University of Wales. Bangor. 135 pp.
English S., Wilkinson C.R. & Baker V. (eds.) (1997). Survey manual for tropical
marine resources. Australian Institute of Marine Science, Townsville. 390 pp.
Engqvist L. (2005). The mistreatment of covariate interaction terms in linear model
analyses of behavioural and evolutionary ecology studies. Animal Behaviour,
70(4): 967-971.

References
207
Evans R.D. & Russ G.R. (2004). Larger biomass of targeted reef fish in no-take
marine reserves on the Great Barrier Reef, Australia. Aquatic Conservation:
Marine and Freshwater Ecosystems, 14: 505-519.
Fernandez-Duque E. (1997). Comparing and Combining Data across Studies:
Alternatives to Significance Testing. Oikos, 79(3): 616-618.
Fernandez-Duque E. & Valeggia C. (1994). Meta-Analysis: A valuable tool in
conservation research. Conservation Biology, 8(2): 555-561.
Floeter S.R., Halpern B.S. & Ferreira C.E.L. (2006). Effects of fishing and protection
on Brazilian reef fishes. Biological Conservation, 128: 391-402.
Forrester G.E. (1990). Factors influencing the juvenile demography of a coral reef
fish. Ecology, 71(5): 1666-1681.
Francour P., Harmelin J.G., Pollard D. & Sartoretto S. (2001). A review of marine
protected areas in the north-western Mediterranean region: siting, usage,
zonation and management. Aquatic Conservation-Marine and Freshwater
Ecosystems, 11(3): 155-188.
Friedlander A.M., Brown E. & Monaco M.E. (2007). Defining reef fish habitat
utilization patterns in Hawaii: comparisons between marine protected areas
and areas open to fishing. Marine Ecology Progress Series, 351: 221-233.
Friedlander A.M., Brown E.K., Jokiel P.L., Smith W.R. & Rodgers K.S. (2003).
Effects of habitat, wave exposure, and marine protected area status on coral
reef fish assemblages in the Hawaiian archipelago. Coral Reefs, 22(3): 291-
305.
Friedlander A.M. & DeMartini E.E. (2002). Contrasts in density, size, and biomass
of reef fishes between the north-western and the main Hawaiian islands:
the effects of fishing down apex predators. Marine Ecology Progress Series,
230: 253-264.

References
208
Froese R. & Pauly D. (eds.) (2008). FishBase. Online at http://www.fishbase.org.
version (04/2008).
García-Charton J.A. & Perez Ruzafa A. (1999). Ecological heterogeneity and the
evaluation of the effects of marine reserves. Fisheries Research (Amsterdam),
42: 1-20.
Garcia S.M. & Newton C. (1997). Current situation, trends, and prospects in World
capture fisheries. In: Global trends: fisheries management. (eds. Pikitch EK,
Huppert DD & Sissenwine MP). pp. 3-27. American Fisheries Society
Symposium 20, Bethesda.
Gell F. & Roberts C. (2002). The fishery effects of marine reserves and fishery
closures. World Wildlife Fund - United States. 89 pp.
(http://www.worldwildlife.org/oceans/fishery_effects.pdf)
Gerber L.R., Kareiva P.M. & Bascompte J. (2002). The influence of life history
attributes and fishing pressure on the efficacy of marine reserves. Biological
Conservation, 106: 11-18.
Gerber L.R., Botsford L.W., Hastings A., Possingham H.P., Gaines S.D., Palumbi
S.R. & Andelman S. (2003). Population models for marine reserve design: A
retrospective and prospective synthesis. Ecological Applications, 13(1): S47-
S64.
Gibbs P.E., Stoddart D.R. & Vevers H.G. (1971). Coral reefs and associated
communities in the Cook Islands. Royal Society of New Zealand Bulletin,
8(Cook Bicentenary Expedition in the South-West Pacific): 91-105.
Gillanders B., M. , Able K., W. , Brown J., A. , Eggleston D., B. & Sheridan P., F.
(2003). Evidence of connectivity between juvenile and adult habitats for
mobile marine fauna: an important component of nurseries. Marine Ecology
Progress Series, 247: 281-295.

References
209
Glynn P.W. (1973). Ecology of a Caribbean coral reef - Porites reef-flat biotope. II.
Plankton Community with evidence for depletion. Marine Biology, 22(1): 1-
21.
Goni R. (1998). Ecosystem effects of marine fisheries: an overview. Ocean & Coastal
Management, 40(1): 37-64.
Graham N.A.J., Dulvy N.K., Jennings S. & Polunin N.V.C. (2005). Size-spectra as
indicators of the effects of fishing on coral reef fish assemblages. Coral Reefs,
24(1): 118.
Graham N.A.J., Evans R.D. & Russ G.R. (2003). The effects of marine reserve
protection on the trophic relationships of reef fishes on the Great Barrier
Reef. Environmental Conservation, 30(2): 200-208.
Gratwicke B., Petrovic C. & Speight M.R. (2006). Fish distribution and ontogenetic
habitat preferences in non-estuarine lagoons and adjacent reefs.
Environmental Biology of Fishes, 76(2-4): 191-210.
Green R.H. (1979). Sampling design and statistical methods for environmental
biologists. Wiley and Sons, New York. 257 pp.
Greig H. (2008). Students make Takitumu Lagoon Day a success. 11 June 2008. In:
Cook Islands News. Rarotonga, Cook Islands.
Grigg R.W. (1994). Effects of sewage discharge, fishing pressure and habitat
complexity on coral reef ecosystems and reef fishes in Hawaii. Marine
Ecology Progress Series, 103: 25-34.
Guidetti P., Milazzo M., Bussotti S., Molinari A., Murenu M., Pais A., Spanò N.,
Balzano R., Agardy T., Boero F., Carrada G., Cattaneo-Vietti R., Cau A.,
Chemello R., Greco S., Manganaro A., Notarbartolo di Sciara G., Russo G.F.
& Tunesi L. (2008). Italian marine reserve effectiveness: Does enforcement
matter? Biological Conservation, 141(3): 699-709.

References
210
Guidetti P. & Sala E. (2007). Community-wide effects of marine reserves in the
Mediterranean Sea. Marine Ecology Progress Series, 335: 43-56.
Gust N., Choat J.H. & McCormick M.I. (2001). Spatial variability in reef fish
distribution, abundance, size and biomass: a multi-scale analysis. Marine
Ecology-Progress Series, 214: 237.
Gust N. (2004). Variation in the population biology of protogynous coral reef
fishes over tens of kilometres. Canadian Journal of Fisheries and Aquatic
Sciences, 61(2): 205-218.
Hairston N.G., Smith F.E. & Slobodkin L.B. (1960). Community Structure,
Population Control, and Competition. The American Naturalist, 94(879): 421-
425.
Halpern B.S. (2003). The impact of marine reserves: Do reserves work and does
reserve size matter? Ecological Applications, 13(1): S117-S137.
Halpern B.S., Gaines S.D. & Warner R.R. (2004). Confounding effects of the export
of production and the displacement of fishing effort from marine reserves.
Ecological Applications, 14(4): 1248-1256.
Halpern B.S. & Warner R.R. (2002). Marine reserves have rapid and lasting effects.
Ecology Letters, 5(3): 361-366.
Halpern B.S. & Warner R.R. (2003). Matching marine reserve design to reserve
objectives. Proceedings of the Royal Society B-Biological Sciences, 270: 1871-
1878.
Hamner W.M., Colin P.L. & Hamner P.P. (2007). Export-import dynamics of
zooplankton on a coral reef in Palau. Marine Ecology-Progress Series, 334: 83-
92.
Hastings A. & Botsford L.W. (1999). Equivalence in yield from marine reserves
and traditional fisheries management. Science, 284(5419): 1537-8.

References
211
Hastings A. & Botsford L.W. (2003). Comparing designs of marine reserves for
fisheries and for biodiversity. Ecological Applications, 13(1): S65-S70.
Hawkins J.P., Roberts C.M., Dytham C., Schelten C. & Nugues M.M. (2006). Effects
of habitat characteristics and sedimentation on performance of marine
reserves in St. Lucia. Biological Conservation, 127: 487-499.
Hedges L.V., Gurevitch J. & Curtis P.S. (1999). The meta-analysis of response
ratios in experimental ecology. Ecology, 80(4): 1150-1156.
Hedges L.V. & Olkin I. (1985). Statistical methods for meta-analysis. Academic
Press Inc, San Diego. 369 pp.
Hilborn R., Stokes K., Maguire J.J., Smith T., Botsford L.W., Mangel M., Orensanz
J., Parma A., Rice J., Bell J., Cochrane K.L., Garcia S., Hall S.J., Kirkwood
G.P., Sainsbury K., Stefansson G. & Walters C. (2004). When can marine
reserves improve fisheries management? Ocean & Coastal Management, 47(3-
4): 197-205.
Holden B. (1992a). Circulation and flushing Ngatangiia Harbour and Muri
Lagoon, Rarotonga, Cook Islands. SOPAC Technical Report. 52 pp.
Holden B. (1992b). Ocean currents and circulation, Avarua - Motutoa, Rarotonga,
Cook Islands. . SOPAC Technical Report 143. 49 pp.
Holland K.N., Peterson J.D., Lowe C.G. & Wetherbee B.M. (1993). Movements,
distribution and growth rates of the white goatfish Mulloides flavolineatus in
a fisheries conservation zone. Bulletin of Marine Science, 52(3): 982-992.
Huedo-Medina T.B., Sanchez-Meca J., Marin-Martinez F. & Botella J. (2006).
Assessing heterogeneity in meta-analysis: Q statistic or I-2 index?
Psychological Methods, 11(2): 193-206.
Hughes T.P. (1994). Catastrophes, Phase-Shifts, and Large-Scale Degradation of a
Caribbean Coral-Reef. Science, 265(5178): 1547.
References
212
Ivlev V.S. (1961). Experimental ecology of the feeding of fishes. Yale University
Press, New Haven. 302 pp.
Jennings S., Boulle D.P. & Polunin N.V.C. (1996a). Habitat correlates of the
distribution and biomass of Seychelles' reef fishes. Environmental Biology of
Fishes, 46: 15-25.
Jennings S., Marshall S.S. & Polunin N.V.C. (1996b). Seychelles' marine protected
areas: Comparative structure and status of reef fish communities. Biological
Conservation, 75(3): 201.
Jennings S. & Polunin N.V. (1997). Impacts of predator depletion by fishing on the
biomass and diversity of non-target reef fish communities. Coral Reefs, 16:
71-82.
Jennings S. & Polunin N.V.C. (1996a). Effects of fishing effort and catch rate upon
the structure and biomass of Fijian reef fish communities. Journal of Applied
Ecology, 33(2): 400.
Jennings S. & Polunin N.V.C. (1996b). Impacts of fishing on tropical reef
ecosystems. Ambio, 25(1): 44-49.
Jennings S., Reynolds J.D. & Polunin N.V.C. (1999). Predicting the vulnerability of
tropical reef fishes to exploitation with phylogenies and life histories.
Conservation Biology, 13(6): 1466-1475.
Johannes R.E. (1994). Pacific Island Peoples' Science and Marine Resource
Management. In: Science of Pacific Island Peoples (eds. Morrison J,
Geraghty P & Crowl L). pp. 81-89. Institute of Pacific Studies, Suva.
Johannes R.E. (1998). The case for data-less marine resource management:
examples from tropical nearshore finfisheries. Trends in Ecology & Evolution,
13(6): 243-246.

References
213
Johannes R.E. (2002). The renaissance of community-based marine resource
management in Oceania. Annual Review of Ecology and Systematics, 33: 317-
340.
Jones G.P. (1986). Food availability affects growth in a coral reef fish. Oecologia,
70(1): 136-139.
Jones G.P. (1988). Experimental evaluation of the effects of habitat structure and
competitive interactions on the juveniles of 2 coral-reef fishes. Journal of
Experimental Marine Biology and Ecology, 123(2): 115-126.
Jones G.P., Ferrell D.J. & Sale P.F. (1991). Fish predation and its impact on the
invertebrates of coral reefs and adjacent sediments. In: The ecology of fishes
on coral reefs (ed. Sale PF). pp. 156-179. Academic Press, San Diego.
Jones G.P. (1991). Post-recruitment processes in the ecology of coral reef fish
populations: a multifactorial perspective. In: The ecology of fishes on coral
reefs (ed. Sale PF). pp. 294-328. Academic Press, San Diego.
Kramer D.L. & Chapman M.R. (1999). Implications of fish home range size and
relocation for marine reserve function. Environmental Biology of Fishes, 55(1-
2): 65-79.
Kritzer J.P. (2004). Effects of noncompliance on the success of alternative designs
of marine protected-area networks for conservation and fisheries
management. Conservation Biology, 18(4): 1021-1031.
Kulbicki M., Sarramegna S., Letourneur Y., Wantiez L., Galzin R., Mou-Tham G.,
Chauvet C. & Thollot P. (2007). Opening of an MPA to fishing: Natural
variations in the structure of a coral reef fish assemblage obscure changes
due to fishing. Journal of Experimental Marine Biology and Ecology, 353(2): 145-
163.

References
214
La Mesa G., Di Muccio S. & Vacchi M. (2006). Structure of a Mediterranean
cryptobenthic fish community and its relationships with habitat
characteristics. Marine Biology, 149(2): 149-167.
Langlois T., Anderson M., Babcock R. & Kato S. (2006). Marine reserves
demonstrate trophic interactions across habitats. Oecologia, 147(1): 134-140.
Lassig B.R. (1983). The effects of a cyclonic storm on coral reef fish assemblages.
Environmental Biology of Fishes, 9(1): 55-63.
Lawton J.H. (1994). What Do Species Do in Ecosystems? Oikos, 71(3): 367-374.
Lecchini D. & Galzin R. (2005). Spatial repartition and ontogenetic shifts in habitat
use by coral reef fishes (Moorea, French Polynesia). Marine Biology, 147(1):
47-58.
Legendre P. (2001). Model II regression – User’s guide. Département de sciences
biologiques, Université de Montréal.
Leslie D.M. (1980). Soils of Rarotonga, Cook Islands. New Zealand Soil Survey
Report. 49. 68 pp.
Lessios H.A. (1988). Mass Mortality of Diadema Antillarum in the Caribbean:
What Have We Learned? Annual Review of Ecology and Systematics, 19(1):
371-393.
Lewis J.B. (1977). Processes of organic production on coral reefs. Biological Reviews,
52(3): 305-347.
Lieske E. & Myers R. (2002). Coral reef fishes. First revised edition. Princeton
University Press, Princeton, New Jersey. 400 pp.
Light P.R. & Jones G.P. (1997). Habitat preference in newly settled coral trout
(Plectropomus leopardus, Serranidae). Coral Reefs, 16(2): 117-126.

References
215
Lincoln-Smith M.P., Pitt K.A., Bell J.D. & Mapstone B.D. (2006). Using impact
assessment methods to determine the effects of a marine reserve on
abundances and sizes of valuable tropical invertebrates. Canadian Journal of
Fisheries and Aquatic Sciences, 63(6): 1251-1266.
Lockwood D.R., Hastings A. & Botsford L.W. (2002). The effects of dispersal
patterns on marine reserves: does the tail wag the dog? Theoretical
Population Biology, 61(3): 297-309.
Macpherson E. (1998). Ontogenetic shifts in habitat use and aggregation in
juvenile sparid fishes. Journal of Experimental Marine Biology and Ecology,
220(1): 127-150.
Malvadkar U. & Hastings A. (2008). Persistence of mobile species in marine
protected areas. Fisheries Research, 91(1): 69-78.
Manarangi-Trott L. (2000). Maito (Ctenochaetus striatus): its age and growth
characteristics and the effects of fishing pressure in Rarotonga, Cook
Islands. Honours Thesis. School of Biological, Earth and Environmental
Sciences. University of New South Wales. Sydney. 30 pp.
Manly B.F.J. (1974). A model for certain types of selection experiments. Biometrics,
30: 281-294.
Manly B.F.J. (1993). Comments on design and analysis of multiple-choice feeding-
preference experiments. Oecologia, 93: 149-152.
Manly B.F.J., McDonald L.L., Thomas D.L., McDonald T.L. & Erickson W.P. (2002).
Resource selection by animals: statistical design and analysis for field
studies. 2nd edn. Kluwer Academic Publishers, Dordrecht, Netherlands.
221 pp.

References
216
Martell S.J.D., Essington T.E., Lessard B. & Kitchell J.F. (2005). Interactions of
productivity, predation risk, and fishing effort in the efficacy of marine
protected areas for the central Pacific. Canadian Journal of Fisheries and
Aquatic Sciences, 62(6): 1320.
Matthews E., Veitayaki J. & Bidesi V.R. (1998). Fijian villagers adapt to changes in
local fisheries. Ocean and Coastal Management, 38(3): 207-224.
May J.J. (2005). The distribution and abundance of key invertebrate species in the
Rarotonga lagoon, Cook Islands. School of Ocean Sciences University of
Wales. Bangor. 66 pp.
McArdle B.H. & Anderson M.J. (2001). Fitting multivariate models to community
data: a comment on distance-based redundancy analysis. Ecology, 82: 290-
297.
McClanahan T.R. (1994). Kenyan coral reef lagoon fish: Effects of fishing, substrate
complexity, and sea urchins. Coral Reefs, 13(4): 231-241.
McClanahan T.R. & Arthur R. (2001). The effect of marine reserves and habitat on
populations of east African coral reef fishes. Ecological Applications, 11(2):
559-569.
McClanahan T.R., Graham N., A. J., Calnan J., M. & MacNeil M.A. (2007). Toward
pristine biomass: reef fish recovery in coral reef marine protected areas in
Kenya. Ecological Applications, 17(4): 1055-1067.
McClanahan T.R., Marnane M.J., Cinner J.E. & Kiene W.E. (2006). A comparison of
marine protected areas and alternative approaches to coral-reef
management. Current Biology, 16(14): 1408-1413.
McClanahan T.R., Muthiga N.A., Kamukuru A.T., Machano H. & Kiambo R.W.
(1999). The effects of marine parks and fishing on coral reefs of northern
Tanzania. Biological Conservation, 89(2): 161-182.

References
217
McCormack G. (2007). Cook Islands Biodiversity Database. Version 2007.2. Cook
Islands Natural Heritage Trust, Rarotonga. Online at
http://cookislands.bishopmuseum.org. Date accessed: 18th April 2008.
Mead S.M. (ed.) (1984). Customary concepts of the Maori: a source book for Maori
Studies students. Victoria University of Wellington, Wellington.
Meester G.A., Mehrotra A., Ault J.S. & Baker E.K. (2004). Designing marine
reserves for fishery management. Management Science, 50(8): 1031-1043.
Meyer C.G. (2003). An empirical evaluation of the design and function of a small
marine reserve (Waikiki Marine Life Conservation District). Doctoral
dissertation. Zoology Department. University of Hawai'i at Manoa. 143 pp.
Meyer C.G. & Holland K.N. (2005). Movement patterns, home range size and
habitat utilization of the bluespine unicornfish, Naso unicornis
(Acanthuridae) in a Hawaiian marine reserve. Environmental Biology of
Fishes, 73(2): 201-210.
Meyer J., Steinhauser J., Jeltsch F. & Brandl R. (2007). Large trees, acacia shrubs,
and the density of Thallomys nigricauda in the Thornveld savannah of South
Africa. Journal of Arid Environments, 68(3): 363-370.
Micheli F., Benedetti-Cecchi L., Gambaccini S., Bertocci I., Borsini C., Osio G.C. &
Roman F. (2005). Cascading human impacts, marine protected areas, and
the structure of Mediterranean reef assemblages. Ecological Monographs,
75(1): 81-102.
Micheli F., Halpern B.S., Botsford L.W. & Warner R.R. (2004). Trajectories and
correlates of community change in no-take marine reserves. Ecological
Applications, 14(6): 1709-1723.
Milazzo M., Badalamenti F., Vega Fernandez T. & Chemello R. (2005). Effects of
fish feeding by snorkellers on the density and size distribution of fishes in a
Mediterranean marine protected area. Marine Biology, 146: 1213-1222.

References
218
Moberg F. & Folke C. (1999). Ecological goods and services of coral reef
ecosystems. Ecological Economics, 29(2): 215-233.
Moore J. (2006). Seafood consumption survey: Rarotonga. Diploma in Marine
Studies Year Two Marine Reporting Projects. Bay of Plenty Polytechnic. 32
pp.
Mosquera I., Côté I.M., Jennings S. & Reynolds J.D. (2000). Conservation benefits
of marine reserves for fish populations. Animal Conservation, 3: 321-332.
Munro J.L. & Williams D.M. (1985). Assessment and management of coral reef
fisheries: biological, environmental and socio-economic aspects. In: Vol. 4,
Proceedings of the Fifth International Coral Reef Congress. pp. 545-572.
Antenne Museum, Tahiti, French Polynesia.
Murty V.S. (2002). Marine ornamental fish resources of Lakshadweep. CMFRI
Indian Council for Agricultural Research, India Cochin. 384pp.
Myers R.A. & Worm B. (2003). Rapid worldwide depletion of predatory fish
communities. Nature, 423(6937): 280-283.
Myers R.F. (1999). Micronesian reef fishes: a comprehensive guide to the coral reef
fishes of Micronesia. Coral Graphics, Guam. 522 pp.
Nakagawa S. & Cuthill I.C. (2007). Effect size, confidence interval and statistical
significance: a practical guide for biologists. Biological Reviews, 82(4): 591-
605.
Nardi K., Jones G.P., Moran M.J. & Cheng Y.W. (2004). Contrasting effects of
marine protected areas on the abundance of two exploited reef fishes at the
sub-tropical Houtman Abrolhos Islands, Western Australia. Environmental
Conservation, 31(2): 160-168.
Neu C., Byers C. & Peek J. (1974). A technique for analysis of utilization-
availability data. Journal of Wildlife Management, 38: 541-5.
References
219
Neubert M.G. (2003). Marine reserves and optimal harvesting. Ecology Letters, 6:
843-849.
Ojeda-Martinez C., Bayle-Sempere J., Sánchez-Jerez P., Forcada A. & Valle C.
(2007). Detecting conservation benefits in spatially protected fish
populations with meta-analysis of long-term monitoring data. Marine
Biology, 151(3): 1153-1161.
Osenberg C.W., Bolker B.M., White J.S., St Mary C.M. & Shima J.S. (2006).
Statistical issues and study design in ecological restorations: lessons
learned from marine reserves. In: Foundations of Restoration Ecology (eds.
Falk DA, Palmer MA & Zedler JB). pp. 280-302. Island Press.
Osenberg C.W., Sarnelle O., Cooper S.D. & Holt R.D. (1999). Resolving ecological
questions through meta-analysis: goals, metrics and models. Ecology, 80(4):
1105-1117.
Osenberg C.W. & Schmitt R.J. (1996). Detecting ecological impacts caused by
human activities. In: Detecting ecological impacts: concepts and
applications in coastal habitats (eds. Schmitt RJ & Osenberg CW). pp. 3-16.
Academic Press, San Diego.
Osenberg C.W., Schmitt R.J., Holbrook S.J., Abu-Saba K.E. & Flegal A.R. (1996).
Detection of environmental impacts. In: Detecting ecological impacts:
concepts and applications in coastal habitats (eds. Schmitt RJ & Osenberg
CW). pp. 83-108. Academic Press, San Diego.
Overton J. & Thaman R.R. (1999). Resources and the Environment. In: Strategies
for Sustainable Development: Experiences from the Pacific (eds. Overton J
& Scheyvens R). pp. 19-32. University of New South Wales Press, Sydney.
Palumbi S.R. (2001). The ecology of marine protected areas. In: Marine community
ecology (eds. Bertness MD, Gaines SD & Hay ME). pp. 509-530. Sinauer
Associates Inc., Sunderland, Massachusetts.

References
220
Palumbi S.R. (2004). Marine reserves and ocean neighborhoods: The spatial scale
of marine populations and their management. Annual Review of Environment
and Resources, 29: 31-68.
Parnell P.E., Dayton P.K., Lennert-Cody C.E., Rasmussen L.L. & Leichter J.J.
(2006). Marine reserve design: optimal size, habitats, species affinities,
diversity, and ocean microclimate. Ecological Applications, 16(3): 945-962.
Parnell P.E., Lennert-Cody C.E., Geelen L., Stanley L.D. & Dayton P.K. (2005).
Effectiveness of a small marine reserve in southern California. Marine
Ecology Progress Series, 296: 39-52.
Parrish J.D. (1989). Fish communities of interacting shallow-water habitats in
tropical oceanic regions. Marine Ecology Progress Series, 58(1-2): 143-160.
Passfield K. & Tiraa A. (1998). Management Plan for a Ra'ui in Avana-Aroko-
Nukupure. Koutu Nui. Rarotonga.
Pauly D., Christensen V., Dalsgaard J., Froese R. & Torres F.J. (1998). Fishing down
marine food webs. Science, 279: 860-863.
Pauly D., Christensen V., Guenette S., Pitcher T.J., Sumaila U.R., Walters C.J.,
Watson R. & Zeller D. (2002). Towards sustainability in world fisheries.
Nature, 418: 689-695.
Pinnegar J.K., Polunin N.V.C., Francour P., Badalamenti F., Chemello R.,
Harmelin-Vivien M.L., Hereu B., Milazzo M., Zabala M., D'Anna G. &
Pipitone C. (2000). Trophic cascades in benthic marine ecosystems: lessons
for fisheries and protected-area management. Environmental Conservation,
27(2): 179-200.
PISCO (2007). The science of marine reserves. Partnership for interdisciplinary
studies of coastal oceans. (2nd Edition, United States Version). 22pp.
Pitcher T.J. (2001). Fisheries managed to rebuild ecosystems? Reconstructing the
past to salvage the future. Ecological Applications, 11(2): 601-617.

References
221
Pledger S., Geange S., Hoare J. & Pérez Matus A. (2007). Resource selection: tests
and estimation using null models. Research Report Series, School of
Mathematics, Statistics and Computer Science. Victoria University of
Wellington. Wellington. 22 pp. (Access at
http://www.mcs.vuw.ac.nz/research/publications/reports/mscs/mscs07-
04.pdf)
Polunin N.V.C. & Roberts C.M. (1993). Greater biomass and value of target coral-
reef fishes in two small Carribean marine reserves. Marine Ecology Progress
Series, 100: 167-176.
Ponia B. & Raumea K. (1998). Rarotonga marine reserve baseline assessment:
Nikao ra'ui, Aroko ra'ui, Matavera ra'ui, Tikioki ra'ui and Rutaki ra'ui.
Ministry of Marine Resources, Government of the Cook Islands.
Miscellaneous Report. 98/05. 18 pp.
Ponia B., Raumea K. & Turua T. (1998). 1st monitoring survey of the Rarotonga
Ra'ui. Ministry of Marine Resources, Government of the Cook Islands.
Miscellaneous report. 99/18. 27 pp.
Popham E. (1944). A study of the changes in an aquatic insect population using
minnows as the predators. Proceedings of the Zoological Society of London,
A114: 74-81.
Quinn G.P. & Keough M.J. (2002). Experimental design and data analysis for
biologists. Cambridge University Press, Cambridge. 537 pp.
R Development Core Team (2006). R: a language and environment for statistical
computing. R Foundation for Statistical Computing Vienna, Austria.
http://www.R-project.org.
Randall J.E. (1965). Food habits of reef fishes of the West Indies. In: International
conference on tropical oceanography. pp. 665-847. University of Miami
Institute of Marine Sciences, Miami Beach, Florida.

References
222
Randall J.E. (2005). Reef and shore fishes of the South Pacific. New Caledonia to
Tahiti and the Pitcairn Islands. University of Hawaii Press, Honolulu. 707
pp.
Raumea K., Turua T., Makikiriti N., Marurai J. & Ponia B. (2000a). Rarotonga
marine reserve baseline assessment of Aroa Ra'ui. Ministry of Marine
Resources, Government of the Cook Islands.
Raumea K., Turua T., Makikiriti N., Rongo T., Roi N. & Ponia B. (2000b). 2nd
monitoring survey of the Rarotonga Ra'ui. Ministry of Marine Resources,
Government of the Cook Islands. Miscellaneous report. 27 pp.
Roberts C.M. (1995a). Effects of fishing on the ecosystem structure of coral reefs.
Conservation Biology, 9(5): 988-995.
Roberts C.M. (1995b). Rapid Build-up of Fish Biomass in a Caribbean Marine
Reserve. Conservation Biology, 9(4): 815-826.
Roberts C.M. (1997). Connectivity and management of Caribbean coral reefs.
Science, 278: 1454-1457.
Roberts C.M., Bohnsack J.A., Gell F., Hawkins J.P. & Goodridge R. (2001). Effects
of marine reserves on adjacent fisheries. Science, 294(5548): 1920-1923.
Roberts C.M. & Polunin N.V.C. (1991). Are marine reserves effective in
management of reef fisheries? Reviews in Fish Biology and Fisheries, 1(1): 65-
91.
Roberts C.M. & Polunin N.V.C. (1992). Effects of marine reserve protection on
Northern Red Sea fish populations. In: Proceedings of the seventh
international coral reef symposium 22-27 June 1992 (ed. Richmond RH). pp.
969-977, Guam, Micronesia.
Roberts C.M. & Polunin N.V.C. (1993). Marine reserves: Simple solutions to
managing complex fisheries? Ambio, 22(6): 363-368.

References
223
Rochet M.-J. (1998). Short-term effects of fishing on life history traits of fishes. ICES
Journal of Marine Science, 55(3): 371-391.
Rochet M.-J. & Trenkel V.M. (2003). Which community indicators can measure the
impact of fishing? A review and proposals. Canadian Journal of Fisheries and
Aquatic Sciences, 60(1): 86.
Roughgarden J., Gaines S. & Possingham H. (1988). Recruitment dynamics in
complex life cycles. Science, 241(4872): 1460-1466.
Rowley R.J. (1994). Marine reserves in fisheries management. Aquatic Conservation:
Marine and Freshwater Ecosystems, 4(3): 233-254.
Russ G.R. (2002). Yet another review of marine reserves as reef fishery
management tools. In: Coral reef fishes; dynamics and diversity in a
complex ecosystem (ed. Sale PF). pp. 421-443. Academic Press.
Russ G.R. & Alcala A.C. (1996). Marine Reserves: Rates and Patterns of Recovery
and Decline of Large Predatory Fish. Ecological Applications, 6(3): 947-961.
Russ G.R. & Alcala A.C. (1998a). Natural fishing experiments in marine reserves
1983-1993: community and trophic responses. Coral Reefs, 17(4): 383-397.
Russ G.R. & Alcala A.C. (1998b). Natural fishing experiments in marine reserves
1983-1993: roles of life history and fishing intensity in family responses.
Coral Reefs, 17(4): 399-416.
Sala E., Aburto-Oropeza O., Paredes G., Parra I., Barrera J.C. & Dayton P.K. (2002).
A general model for designing networks of marine reserves. Science,
298(5600): 1991-3.
Sale P.F. (2002). The science we need to develop for more effective management.
In: Coral Reef Fishes; Dynamics and Diversity in a Complex Ecosystem (ed.
Sale PF). pp. 361-376. Academic Press, San Diego.

References
224
Sale P.F., Cowen R.K., Danilowicz B.S., Jones G.P., Kritzer J.P., Lindeman K.C.,
Planes S., Polunin N.V., Russ G.R. & Sadovy Y.J. (2005). Critical science
gaps impede use of no-take fishery reserves. Trends in Ecology and Evolution,
20(2): 74-80.
Salomon A.K., Waller N.P., McIlhagga C., Yung R.L. & Walters C. (2002).
Modeling the trophic effects of marine protected area zoning policies: A
case study. Aquatic Ecology, 36(1): 85-95.
Samoilys M. (1988). Abundance and species richness of coral reef fish on the
Kenyan coast: the effects of protective management and fishing. In:
Proceedings of the 6th International Coral Reef Symposium (eds. Choat JH,
D. Barnes, MA. Borowitzka, J.C. Coll, P.J.Davies, P. Flood, B.G. Hatcher, D.
Hopley, P.A. Hutchings, D. Kinsey, G.R. Orme, M. Pichon, P.F. Sale, P.
Sammarco, C.C. Wallace, C. Wilkinson, Wolanski E & Bellwood O). pp. 261-
266, Townsville, Australia.
Samoilys M.A. & Carlos G. (2000). Determining methods of underwater visual
census for estimating the abundance of coral reef fishes. Environmental
Biology of Fishes, 57(3): 289-304.
Samoilys M.A., Martin-Smith K.M., Giles B.G., Cabrera B., Anticamara J.A., Brunio
E.O. & Vincent A.C.J. (2007). Effectiveness of five small Philippines' coral
reef reserves for fish populations depends on site-specific factors,
particularly enforcement history. Biological Conservation, 136(4): 584-601.
Samou S. (1999). Marine Resources. In: Strategies for Sustainable Development:
Experiences from the Pacific (eds. Overton J & Scheyvens R). pp. 142-154.
University of New South Wales Press, Sydney.
Sanchez-Lizaso J.L., Goni R., Renones O., García Charton J.A., Galzin R., Bayle J.T.,
Sanchez Jerez P., Perez Ruzafa A. & Ramos A.A. (2000). Density
Dependence in marine protected populations: a review. Environmental
Conservation, 27(2): 144-158.

References
225
Saywood A., Turua T. & Makikiriti N. (2002). 3rd monitoring survey of the
Rarotonga Ra'ui. Ministry of Marine Resources, Government of the Cook
Islands. Miscellaneous Report. 2002/01. 29 pp.
Searcy S.P., Eggleston D.B. & Hare J.A. (2007). Environmental influences on the
relationship between juvenile and larval growth of Atlantic croaker
Micropogonias undulatus. Marine Ecology-Progress Series, 349: 81-88.
Shaddish W.R. & Haddock C.K. (1994). Combining estimates of effect size. In: The
handbook of research synthesis (eds. Cooper H & Hedges LV). pp. 261-281.
Russell Sage Foundation, New York.
Shears N. & Babcock R. (2003). Continuing trophic cascade effects after 25 years of
no-take marine reserve protection. Marine Ecology Progress Series, Vol. 246:
1-16.
Shears N.I. & Babcock R.C. (2002). Marine reserves demonstrate top-down control
of community structure on temperate reefs. Oecologia, 132(1): 131-142.
Shears N.T., Grace R.V., Usmar N.R., Kerr V. & Babcock R.C. (2006). Long-term
trends in lobster populations in a partially protected vs. no-take Marine
Park. Biological Conservation, 132(2): 222-231.
Shepherd S.A. & Brook J.B. (2007). Distribution and ontogenetic shifts in habitat
and abundance of the temperate western blue groper, Achoerodus gouldii
(Richardson). Journal of Fish Biology, 71(5): 1457-1478.
Siegel S. & Castellan N.J. (1988). Nonparametric statistics for the behavioural
sciences. McGraw Hill, New York. 399 pp.
Sosa-Lopez A., Mouillot D., Do Chi T. & Ramos-Miranda J. (2005). Ecological
indicators based on fish biomass distribution along trophic levels: an
application to the Terminos coastal lagoon, Mexico. ICES Journal of Marine
Science, 62(3): 453-458.

References
226
SPC (2007). Reef fisheries observatory: fieldwork and surveys in the Cook Islands.
In: Fisheries Newsletter, pp. 2-7.
SPREP (2001). Outcomes of the WSSD Pacific Regional Multi-stakeholder
consultation, 5-7 September 2001. Pacific Region Submission to the World
Wide Summit on Sustainable Development.
SPSS Inc. (2008). SPSS for Windows. Release 16.0.0. SPSS Inc. Chicago.
Statistics Office, Cook Islands (2006). Rarotonga total population by census
districts and age groups. Online at
http://www.stats.gov.ck/Statistics/CensusSurveys/census06/Cen06-
Tab6.pdf. Date accessed: May 31 2008.
Stearns S.C. & Crandall R.E. (1984). Plasiticity for age and size at sexual maturity:
a life-history response to unavoidable stress. In: Fish reproduction:
strategies and tactics (eds. Potts GW & Wootton RJ). pp. 13-33. Academic
Press, London.
Stewart-Oaten A., Murdoch W.W. & Parker K.R. (1986). Environmental Impact
Assessment: "Pseudoreplication" in Time? Ecology, 67(4): 929-940.
Sumaila U.R., Guenette S., Alder J. & Chuenpagdee R. (2000). Addressing
ecosystem effects of fishing using marine protected areas. ICES Journal of
Marine Science, 57(3): 752-760.
Taniera T. (1994). Traditional fisheries in Kiribati: survival and sustainability. In:
Science of Pacific Island Peoples (eds. Morrison J, Geraghty P & Crowl L).
pp. 113-120. Institute of Pacific Studies.
Tiraa A. (2006). Ra'ui in the Cook Islands - today's context in Rarotonga. SPC
Traditional Marine Resource Management and Knowledge Information Bulletin,
19: 11-15.

References
227
Tuya F.C., García-Diez C., Espino F. & Haroun R.J. (2006). Assessment of the
effectiveness of two marine reserves in the Canary Islands (eastern
Atlantic). Ciencias Marinas, 32(3): 505–522.
Tuya F.C., Soboil M.L. & Kido J. (2000). An assessment of the effectiveness of
Marine Protected Areas in the San Juan Islands, Washington, USA. ICES
Journal of Marine Science, 57(4): 1218-1226.
Uiblein F. (2007). Goatfishes (Mullidae) as indicators in tropical and temperate
coastal habitat monitoring and management. Marine Biology Research, 3(5):
275-288.
Uthicke S. & Benzie J.A.H. (2000). Effect of beche-de-mer fishing on densities and
size structure of Holothuria nobilis (Echinodermata: Holothuroidea)
populations on the Great Barrier Reef). Coral Reefs, 19: 271-276.
Veitayaki J. (1998). Traditional and community-based marine resources
management system in Fiji: An evolving integrated process. Coastal
Management, 26(1): 47-60.
Walsh W.J. (1983). Stability of a coral reef fish community following a catastrophic
storm. Coral Reefs, 2(1): 49-63.
Wantiez L., Thollot P. & Kulbicki M. (1997). Effects of marine reserves on coral reef
fish communities from five islands in New Caledonia. Coral Reefs, 16(4):
215-224.
Warner R.R. (1991). The use of phenotypic plasticity in coral reef fishes as tests of
theory in evolutionary ecology. In: The ecology of fishes on coral reefs (ed.
Sale PF). pp. 387-398. Academic Press, San Diego.
Watson D.L., Harvey E.S., Kendrick G.A., Nardi K. & Anderson M.J. (2007).
Protection from fishing alters the species composition of fish assemblages in
a temperate-tropical transition zone. Marine Biology, 152(5): 1197-1206.

References
228
Watson R. & Pauly D. (2001). Systematic distortions in world fisheries catch
trends. Nature, 414: 534-536.
Westera M., Lavery P. & Hyndes G. (2003). Differences in recreationally targeted
fishes between protected and fished areas of a coral reef marine park.
Journal of Experimental Marine Biology and Ecology, 294(2): 145-168.
Williams D.M. & Sale P.F. (1981). Spatial and temporal patterns of recruitment of
juvenile coral-reef fishes to coral habitats within One Tree Lagoon, Great
Barrier Reef. Marine Biology, 65(3): 245-253.
Williams G.C. (1966). Adaptation and natural selection. A critique of some current
evolutionary thought. Princeton University Press, Princeton. 307 pp.
Williamson D.H., Russ G.R. & Ayling A.M. (2004). No-take marine reserves
increase abundance and biomass of reef fish on inshore fringing reefs of the
Great Barrier Reef. Environmental Conservation, 31(2): 149-159.
Willis T.J. & Anderson M., J. (2003). Structure of cryptic reef fish assemblages:
relationships with habitat characteristics and predator density. Marine
Ecology Progress Series, 257: 209-221.
Willis T.J., Millar R.B., Babcock R.C. & Tolimieri N. (2003). Burdens of evidence
and the benefits of marine reserves: putting Descartes before des horse?
Environmental Conservation, 30(2): 97-103.
Wolanski E. & Delesalle B. (1995). Upwelling by internal waves, Tahiti, French
Polynesia. Continental shelf research, 15(2-3): 357-368.
Wood B.L., Hay R.F. & Brothers R.N. (1970). Geology of the Cook Islands. 103 pp.
Young E. (2004). Taboos could save the seas. In: New Scientist, 17 April 2004. p. 9.
Zeller D., Stoute S.L. & Russ G.R. (2003). Movements of reef fishes across marine
reserve boundaries: Effects of manipulating a density gradient. Marine
Ecology Progress Series, 254: 269-280.


![Qualitative and Quantitative Analysis of Major ...€¦ · widely performed in the analysis of traditional Chinese medicine (TCM) [19]. The ultra-performance liquid chromatography](https://static.fdocuments.us/doc/165x107/5f05b1da7e708231d4143ce2/qualitative-and-quantitative-analysis-of-major-widely-performed-in-the-analysis.jpg)