A Quantitative Approach, Fifth Editionmenasce/cs465/slides/CAQA5e_ch6.pdf · Computer Architecture...
71
1 Copyright © 2012, Elsevier Inc. All rights reserved. Chapter 6 Warehouse-Scale Computers to Exploit Request-Level and Data-Level Parallelism: Computer Architecture A Quantitative Approach, Fifth Edition
Transcript of A Quantitative Approach, Fifth Editionmenasce/cs465/slides/CAQA5e_ch6.pdf · Computer Architecture...
1 Copyright © 2012, Elsevier Inc. All rights reserved.
Chapter 6
Warehouse-Scale Computers to Exploit Request-Level and Data-Level Parallelism:
Computer Architecture A Quantitative Approach, Fifth Edition
2 Copyright © 2012, Elsevier Inc. All rights reserved.
Introduction Warehouse-scale computer (WSC)
Provides Internet services Search, social networking, online maps, video sharing, online
shopping, email, cloud computing, etc. Differences with HPC “clusters”:
Clusters have higher performance processors and network Clusters emphasize thread-level parallelism, WSCs
emphasize request-level parallelism Differences with datacenters:
Datacenters consolidate different machines and software into one location
Datacenters emphasize virtual machines and hardware heterogeneity in order to serve varied customers
Introduction
3 Copyright © 2012, Elsevier Inc. All rights reserved.
WSC Design Factors (I) Cost-performance (i.e., work done/$)
A WSC infrastructure can cost $150 M A 10% reduction in capital cost saves $15 M
Small savings add up.
Energy efficiency Affects power distribution and cooling Work done per joule
Dependability via redundancy: At least 99.99% availability: down less than one hour/year Multiple WSCs
Network I/O: Inter and intra WSC Interactive and batch processing workloads (e.g., MapReduce)
Introduction

4 Copyright © 2012, Elsevier Inc. All rights reserved.
WSC Design Factors (II) Ample computational parallelism is not important
Most jobs are totally independent (e.g., billions of Web pages from a Web crawl)
Software as a Service: millions of independent users “Request-level parallelism”: little need to coordinate or
synchronize. Operational costs count
Power consumption is a primary, not secondary, constraint when designing system
Energy, power distribution, and cooling: more than 30% of cost over 10 years.
Scale and its opportunities and problems Can afford to build customized systems since WSC
require volume purchase Flipside: failures.
Introduction
5 Copyright © 2012, Elsevier Inc. All rights reserved.
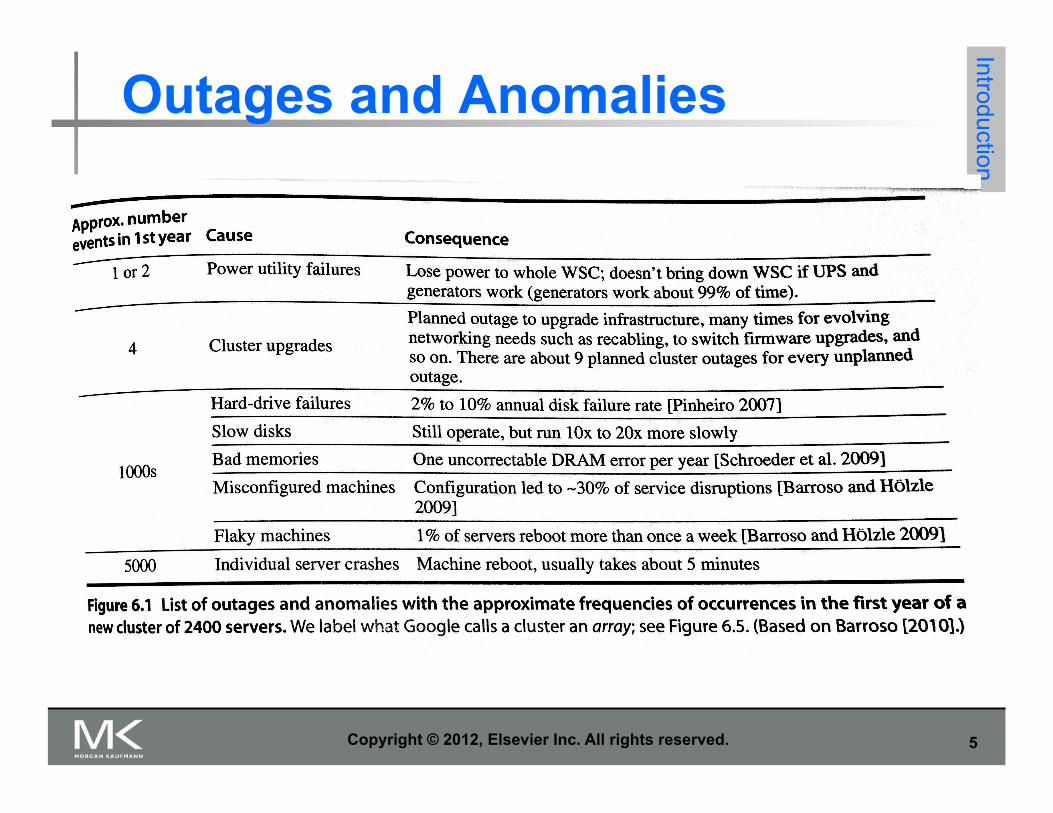
Outages and Anomalies Introduction

6 Copyright © 2012, Elsevier Inc. All rights reserved.
Outages and Anomalies Example Introduction
Calculate the availability of a service running the 2400 servers of the previous table. Assume: • service cannot tolerate software of hardware failures (unrealistic) • Reboot time= 5 minutes • Hardware repair time= 1 hour • Ignore slow disks • All events have equal probability
Hours outage= (4+250+250+250)x1hr+(250+5000)x5min Availability=(365x24-1192)/8760=86%
7 Copyright © 2012, Elsevier Inc. All rights reserved.
Prgrm’g Models and Workloads Batch processing framework: MapReduce
Map: applies a programmer-supplied function to each logical input record
Runs on thousands of computers Provides new set of key-value pairs as intermediate values
Reduce: collapses values using another programmer-supplied function
Program
ming M
odels and Workloads for W
SC
s

8 Copyright © 2012, Elsevier Inc. All rights reserved.
Popularity of MapReduce at Google P
rogramm
ing Models and W
orkloads for WS
Cs
9
Big Data: Use for MapReduce Size of the data becomes part of the
computational solution. Complex structured and unstructured data. Heterogeneous and continuously generated
data. Data generated from a variety of sources:
sensors, cameras, scientific instruments, records of transactions, etc.
Applications: intelligence, health-care, business analytics, disease prevention, crime prevention, etc.

10
Big Data The federal government has
announced a $200 million/yr Big Data initiative for research and development into technologies to “access, store, visualize, massive and complicated data sets.”
Paradigm for BigData computation: MapReduce (introduced by Google):
data and processing parallelism Hadoop: open source implementation of
MapReduce.
11 Copyright © 2012, Elsevier Inc. All rights reserved.
Prgrm’g Models and Workloads MapReduce runtime environment schedules
map and reduce task to WSC nodes
Availability: Use replicas of data across different servers Use relaxed consistency:
No need for all replicas to always agree
Workload demands Often vary considerably
Program
ming M
odels and Workloads for W
SC
s

12
Hadoop: MapReduce Open Source Hadoop jobs consist of two types of tasks:
Map and Reduce tasks. Reduce tasks can only start when all map tasks have
finished. Hadoop cluster:
Compute nodes: where map and reduce tasks execute
Each compute node has a number of slots for the execution of map and reduce tasks.
Each compute node has a TaskTracker daemon that monitors the execution of map and reduce tasks.

13

14
15
WordCount Example
Goal: count the number of occurrences of each word in a large file.
Approach: File is broken down into a large number of chunks. Each map task takes an input line from the file and
breaks it into words and emits a (key, value) pair consisting of the word and a value of “1”.
The reduce tasks add the number of “1”s for each word and output the word and the sum.

16

17
WordCount Example: Map task

18
WordCount Example: Reduce task

19
MapReduce Model
M: number of map tasks of a job n: total number of map slots in the worker nodes c: number of compute nodes
Assume that the n slots are equally distributed among the c compute nodes: n = k x c, where k is the number of map slots per node.

20
MapReduce Model
Node 1
n = k x c concurrent tasks
k slots . . . Node 2 Node c
k slots k slots

21
MapReduce Model
Node 1 k tasks
n tasks
. . .
. . .
n’ tasks
Key observation: all k tasks that run concurrently in a node compete for CPU and I/O resources => queuing has to be considered.
k tasks k tasks
Node c k tasks . . . k tasks k tasks
n tasks n tasks
22
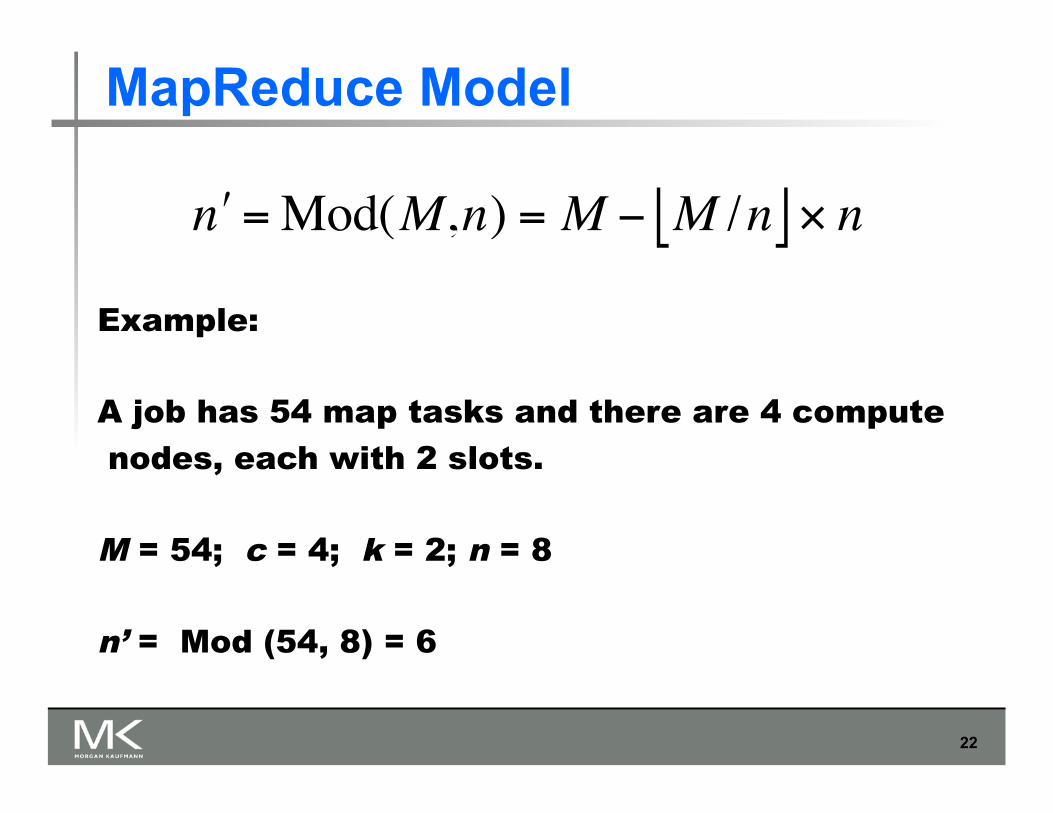
MapReduce Model
€
′ n =Mod(M,n) = M − M /n × n
Example:
A job has 54 map tasks and there are 4 compute nodes, each with 2 slots.
M = 54; c = 4; k = 2; n = 8
n’ = Mod (54, 8) = 6
23
Experimental Parameters Size of input file: 5 MB Number of map slots set by varying the input
split size between 100K and 600K: E.g., Split size of 200 KB => 26 map slots
No reduce tasks

24
Avg. execution time vs. no. slots for 54 map tasks: experiments
25
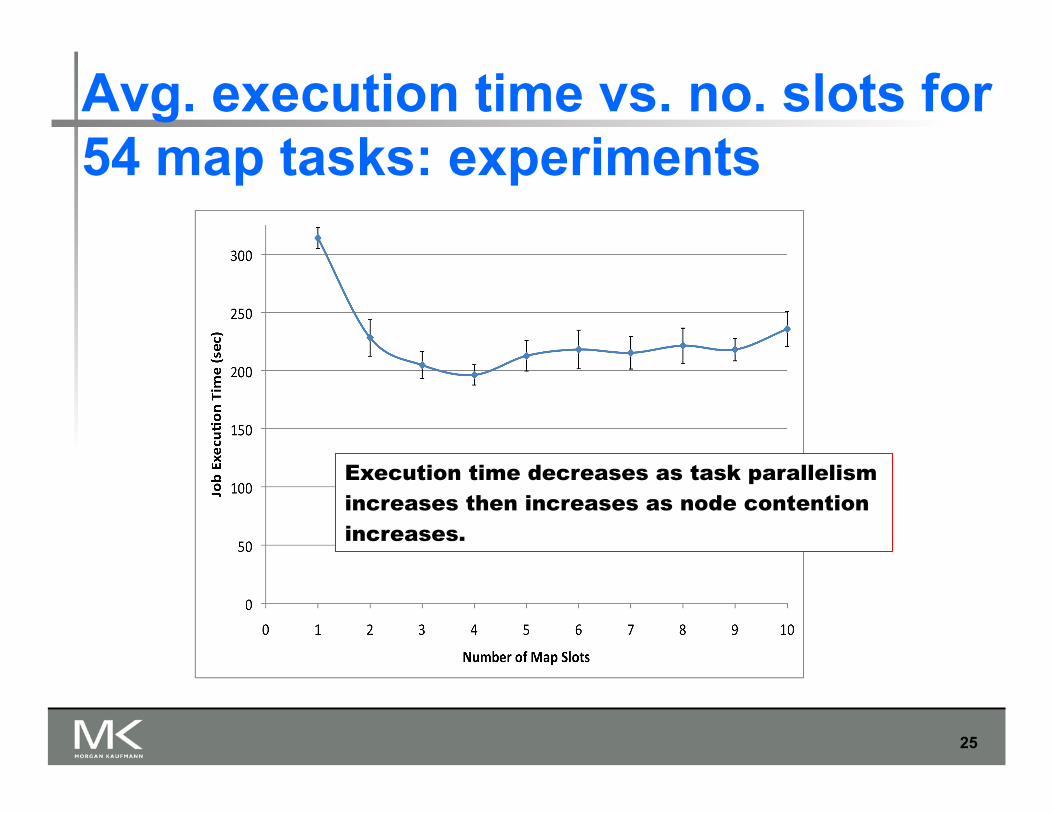
Avg. execution time vs. no. slots for 54 map tasks: experiments
Execution time decreases as task parallelism increases then increases as node contention increases.
26
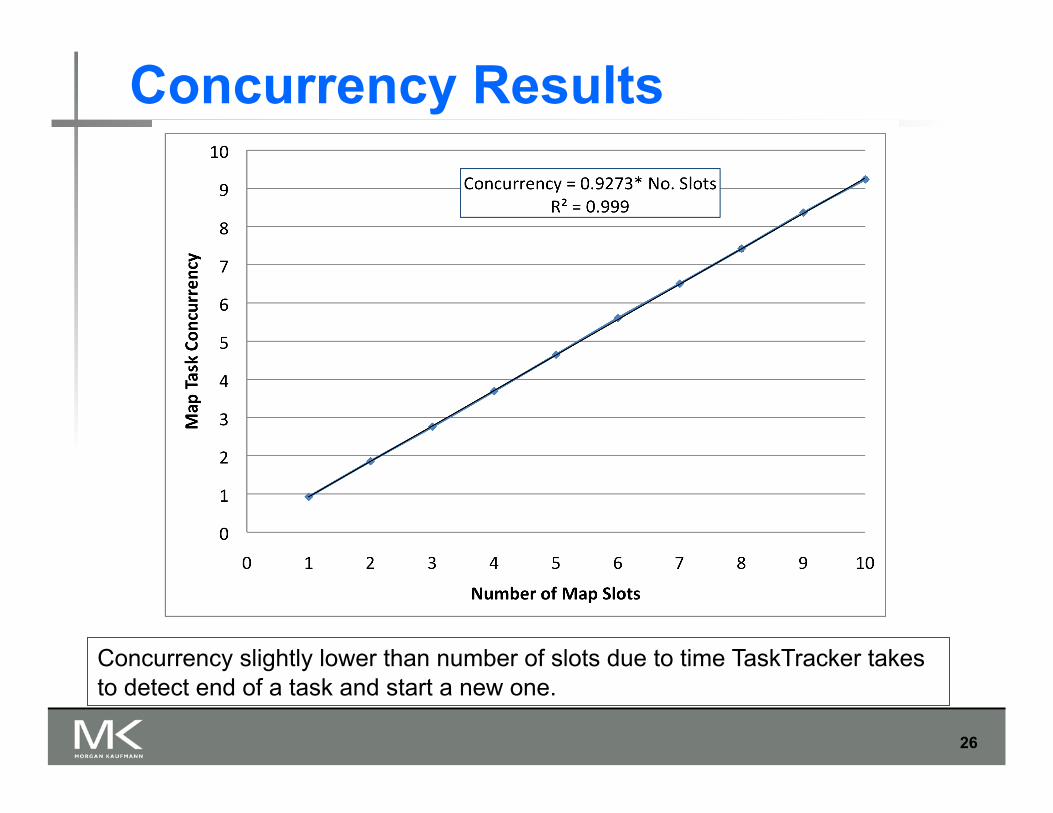
Concurrency Results
Concurrency slightly lower than number of slots due to time TaskTracker takes to detect end of a task and start a new one.

27
Execution time vs. no. slots for different map tasks
28
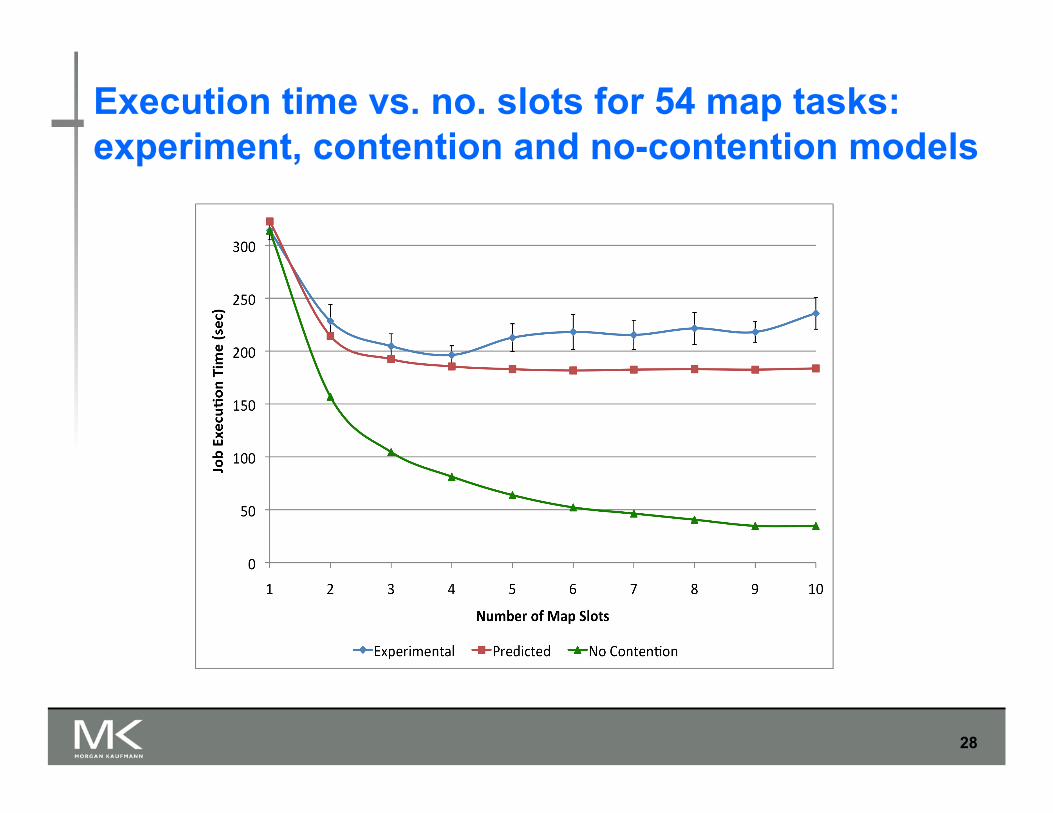
Execution time vs. no. slots for 54 map tasks: experiment, contention and no-contention models

29 Copyright © 2012, Elsevier Inc. All rights reserved.
Computer Architecture of WSC WSC often use a hierarchy of networks for
interconnection Each 19” rack holds 48 1U servers connected
to a rack switch Rack switches are uplinked to switch higher
in hierarchy Uplink has 48 / n times lower bandwidth, where n
= # of uplink ports “Oversubscription”
Goal is to maximize locality of communication relative to the rack
Com
puter Ar4chitecture of W
SC
30 Copyright © 2012, Elsevier Inc. All rights reserved.
Storage Storage options:
Use disks inside the servers, or Network attached storage through Infiniband
WSCs generally rely on local disks Google File System (GFS) uses local disks and
maintains at least three replicas
Com
puter Ar4chitecture of W
SC

31 Copyright © 2012, Elsevier Inc. All rights reserved.
Array Switch Switch that connects an array of racks
Array switch should have 10 X the bisection bandwidth⌘ of a rack switch
Cost of n-port switch grows as n2
Often utilize content addressable memory chips and FPGAs to support high-speed packet inspection.
⌘ worst-case internal bandwidth
Com
puter Ar4chitecture of W
SC
32 Copyright © 2012, Elsevier Inc. All rights reserved.
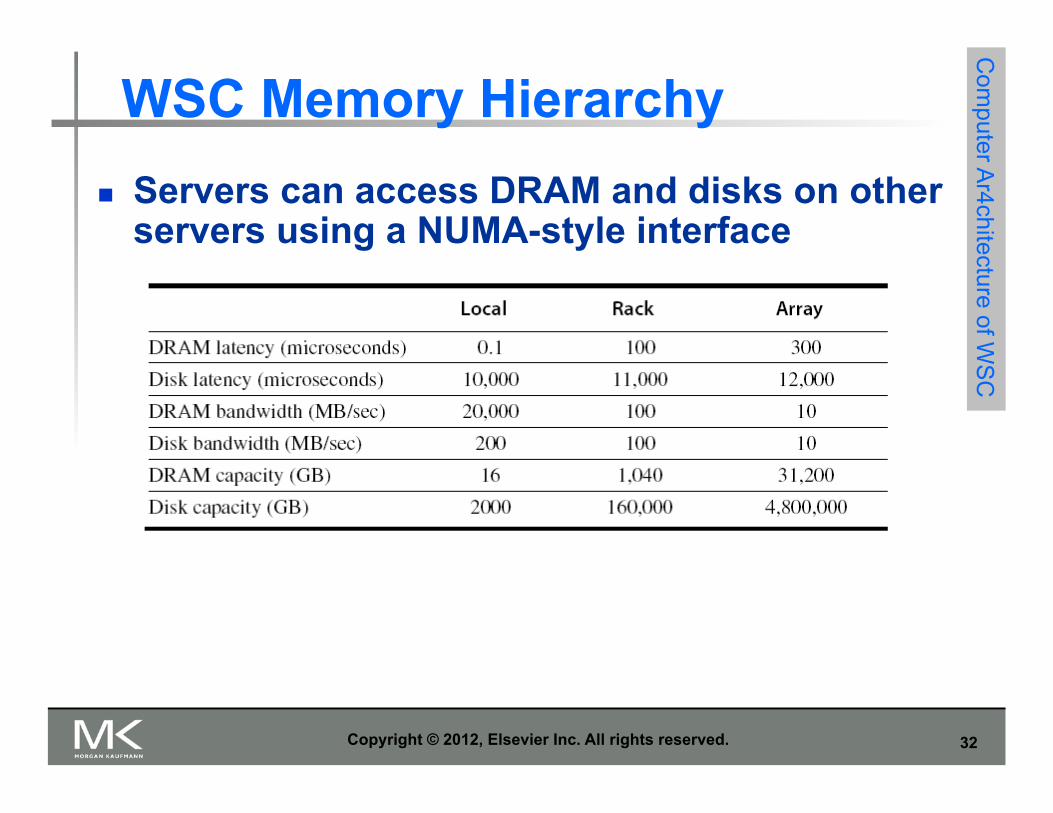
WSC Memory Hierarchy Servers can access DRAM and disks on other
servers using a NUMA-style interface
Com
puter Ar4chitecture of W
SC

33 Copyright © 2012, Elsevier Inc. All rights reserved.
WSC Memory Hierarchy – Example I
What is the average latency assuming that 90% of accesses are local to the server, 9% are outside the server but local to the rack , and 1% are outside the rack but within the array?
(90%x0.1)+(9%100)+(1%x300)=12.09 msec
Com
puter Ar4chitecture of W
SC

34 Copyright © 2012, Elsevier Inc. All rights reserved.
WSC Memory Hierarchy – Example II How long does it take to transfer 1000MB
between disks within the server, between servers in the rack, and between servers in different racks of an array? Within server: 1000/200=5 sec Within rack: 1000/100=10 sec Within array: 1000/10= 100 sec
Com
puter Ar4chitecture of W
SC
35 Copyright © 2012, Elsevier Inc. All rights reserved.
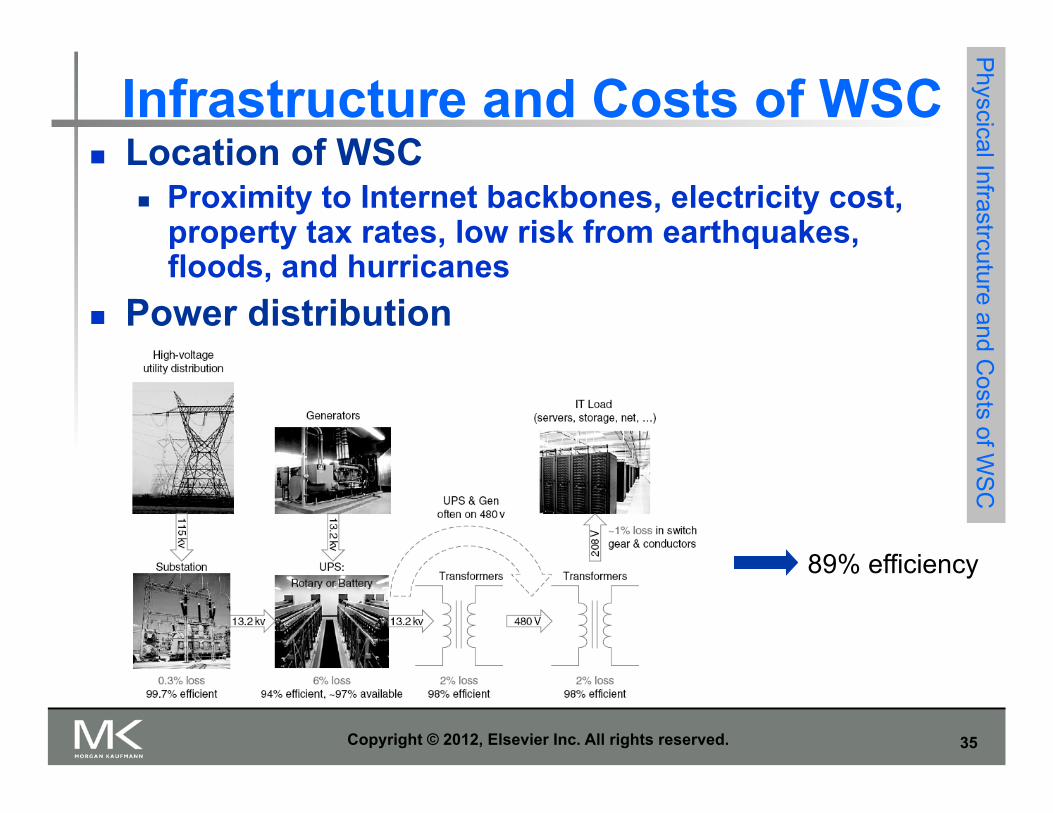
Infrastructure and Costs of WSC Location of WSC
Proximity to Internet backbones, electricity cost, property tax rates, low risk from earthquakes, floods, and hurricanes
Power distribution
Physcical Infrastrcuture and C
osts of WS
C
89% efficiency

36 Copyright © 2012, Elsevier Inc. All rights reserved.
Infrastructure and Costs of WSC Cooling
Air conditioning used to cool server room 64 F – 71 F
Keep temperature higher (closer to 71 F) Cooling towers can also be used
Minimum temperature is “wet bulb temperature”
Physcical Infrastrcuture and C
osts of WS
C

37 Copyright © 2012, Elsevier Inc. All rights reserved.
Infrastructure and Costs of WSC Cooling system also uses water (evaporation and
spills) E.g. 70,000 to 200,000 gallons per day for an 8 MW facility
Power cost breakdown: Chillers: 30-50% of the power used by the IT equipment Air conditioning: 10-20% of the IT power, mostly due to fans
How many servers can a WSC support? Each server:
“Nameplate power rating” gives maximum power consumption To get actual, measure power under actual workloads
Oversubscribe cumulative server power by 40%, but monitor power closely
Physcical Infrastrcuture and C
osts of WS
C
38 Copyright © 2012, Elsevier Inc. All rights reserved.
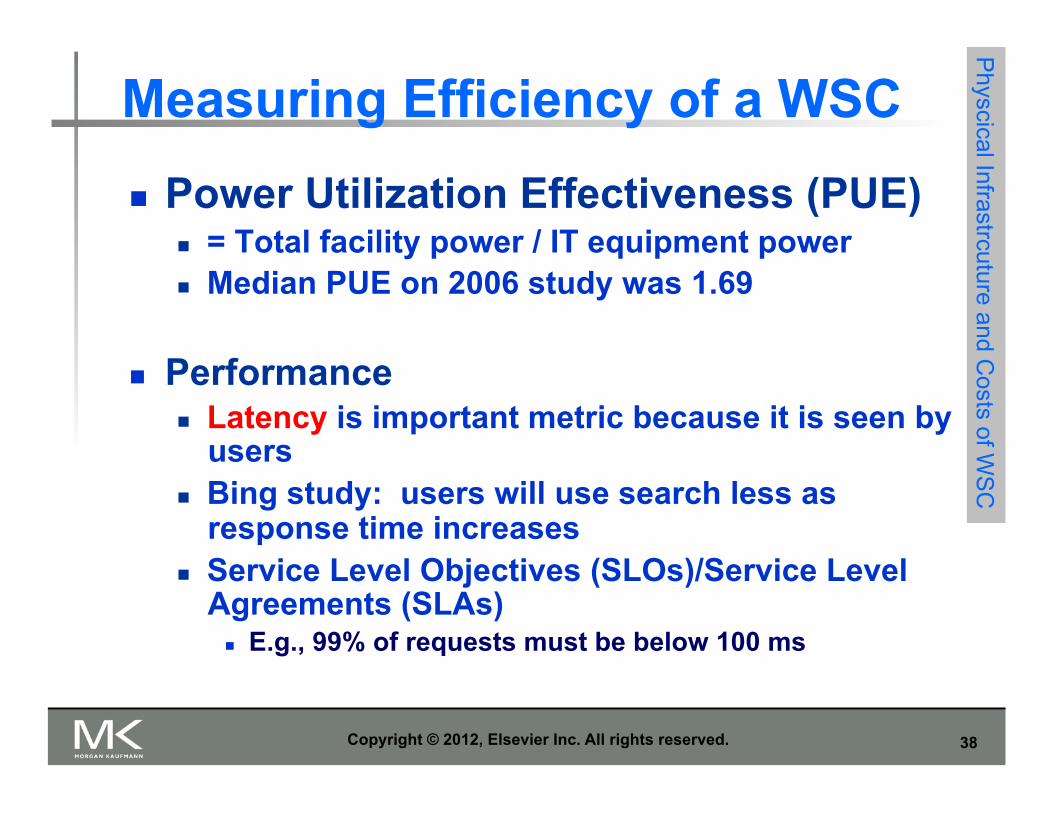
Measuring Efficiency of a WSC Power Utilization Effectiveness (PUE)
= Total facility power / IT equipment power Median PUE on 2006 study was 1.69
Performance Latency is important metric because it is seen by
users Bing study: users will use search less as
response time increases Service Level Objectives (SLOs)/Service Level
Agreements (SLAs) E.g., 99% of requests must be below 100 ms
Physcical Infrastrcuture and C
osts of WS
C

39 Copyright © 2012, Elsevier Inc. All rights reserved.
Negative Impact of Delays at Bing P
hyscical Infrastrcuture and Costs of W
SC

40 Copyright © 2012, Elsevier Inc. All rights reserved.
Cost of a WSC Capital expenditures (CAPEX)
Cost to build a WSC Example:
8 MW facility 46,000 servers $88 M for facility $67M for servers $13M for networking equipment PUE: 1.45
Operational expenditures (OPEX) Cost to operate a WSC
Physcical Infrastrcuture and C
osts of WS
C

41 Copyright © 2012, Elsevier Inc. All rights reserved.
Cloud Computing WSCs offer economies of scale that cannot
be achieved with a datacenter: 5.7 times reduction in storage costs 7.1 times reduction in administrative costs 7.3 times reduction in networking costs This has given rise to cloud services such as
Amazon Web Services “Utility Computing” Based on using open source virtual machine and
operating system software
Cloud C
omputing

42
What is Cloud Computing?
A modality of computing characterized by on demand availability of resources in a dynamic and scalable fashion. resource = infrastructure, platforms, software,
services, or storage. The cloud provider is responsible to make the
resources available on demand to the cloud users. the cloud provider must manage its resources in
an efficient way so that the user needs can be met when needed at the desired QoS level.
43
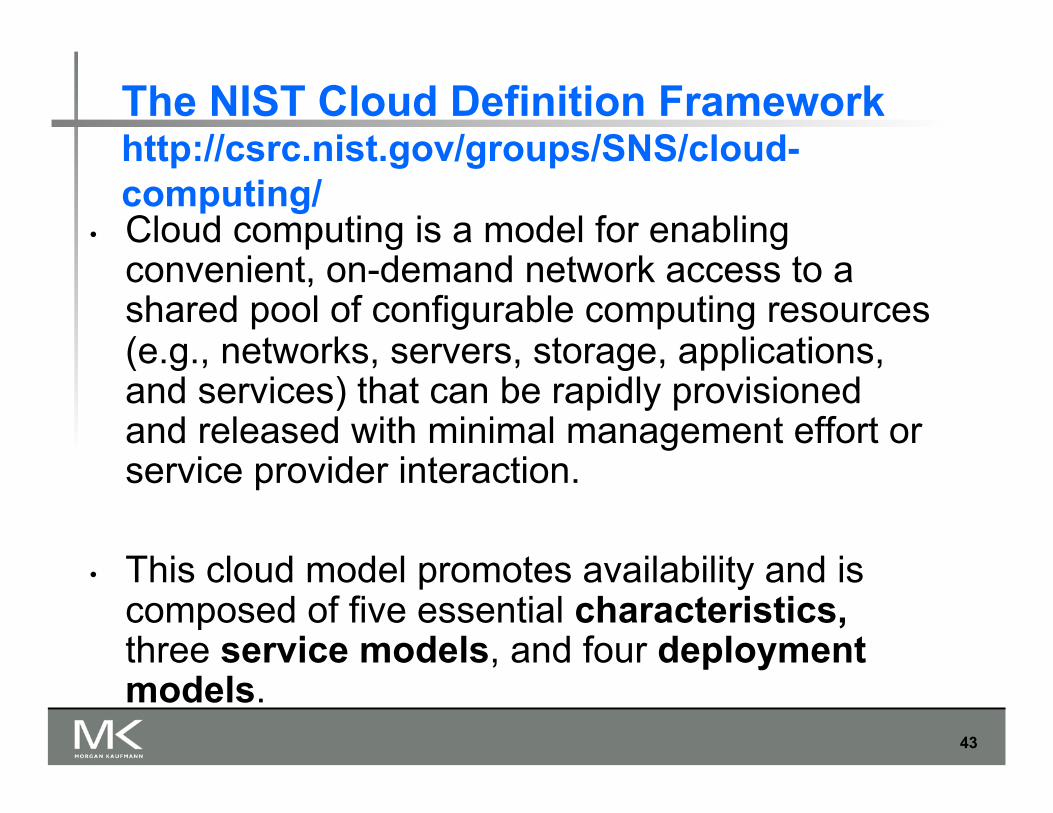
The NIST Cloud Definition Framework http://csrc.nist.gov/groups/SNS/cloud-computing/
• Cloud computing is a model for enabling convenient, on-demand network access to a shared pool of configurable computing resources (e.g., networks, servers, storage, applications, and services) that can be rapidly provisioned and released with minimal management effort or service provider interaction.
• This cloud model promotes availability and is composed of five essential characteristics, three service models, and four deployment models.

44
NIST Cloud Conceptual Reference Model http://www.nist.gov/itl/cloud/upload/SP_500_293_volumeII.pdf
45
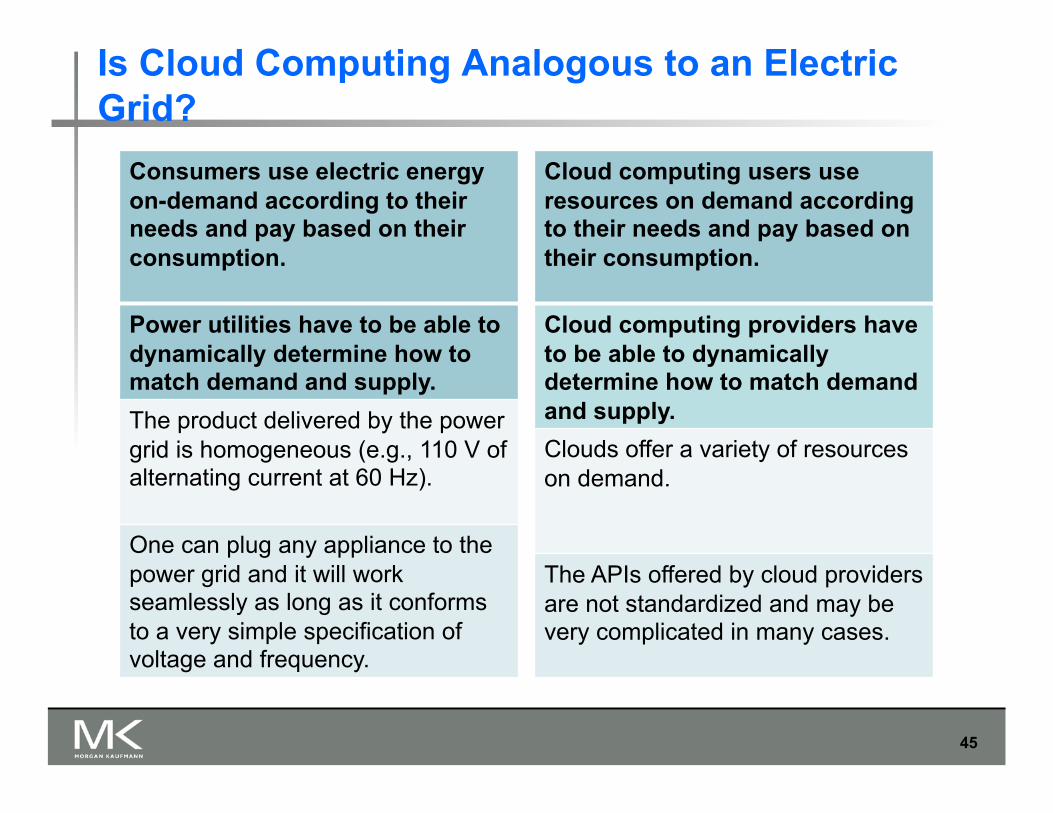
Is Cloud Computing Analogous to an Electric Grid?
Consumers use electric energy on-demand according to their needs and pay based on their consumption.
Power utilities have to be able to dynamically determine how to match demand and supply. The product delivered by the power grid is homogeneous (e.g., 110 V of alternating current at 60 Hz).
One can plug any appliance to the power grid and it will work seamlessly as long as it conforms to a very simple specification of voltage and frequency.
Cloud computing users use resources on demand according to their needs and pay based on their consumption.
Cloud computing providers have to be able to dynamically determine how to match demand and supply. Clouds offer a variety of resources on demand.
The APIs offered by cloud providers are not standardized and may be very complicated in many cases.
46
Advantages of Cloud Computing
Pay as you go.
No need to provision for peak loads.
Time to market.
Consistent performance and availability.
47
Potential Drawbacks of Cloud Computing
Privacy and security.
External dependency for mission critical applications.
Disaster recovery.
Monitoring and Enforcement of SLAs.

48
Example: PlanetLab - www.planet-lab.org

49
Examples: PlanetLab 550 active sites with 1170 nodes scattered over
40 countries. Shared resources include CPU cycles, storage,
and memory. PlanetLab Central API allow users to create
automated scripts to monitor node availability. See http://www.planet-lab.org/doc/plc_api
50
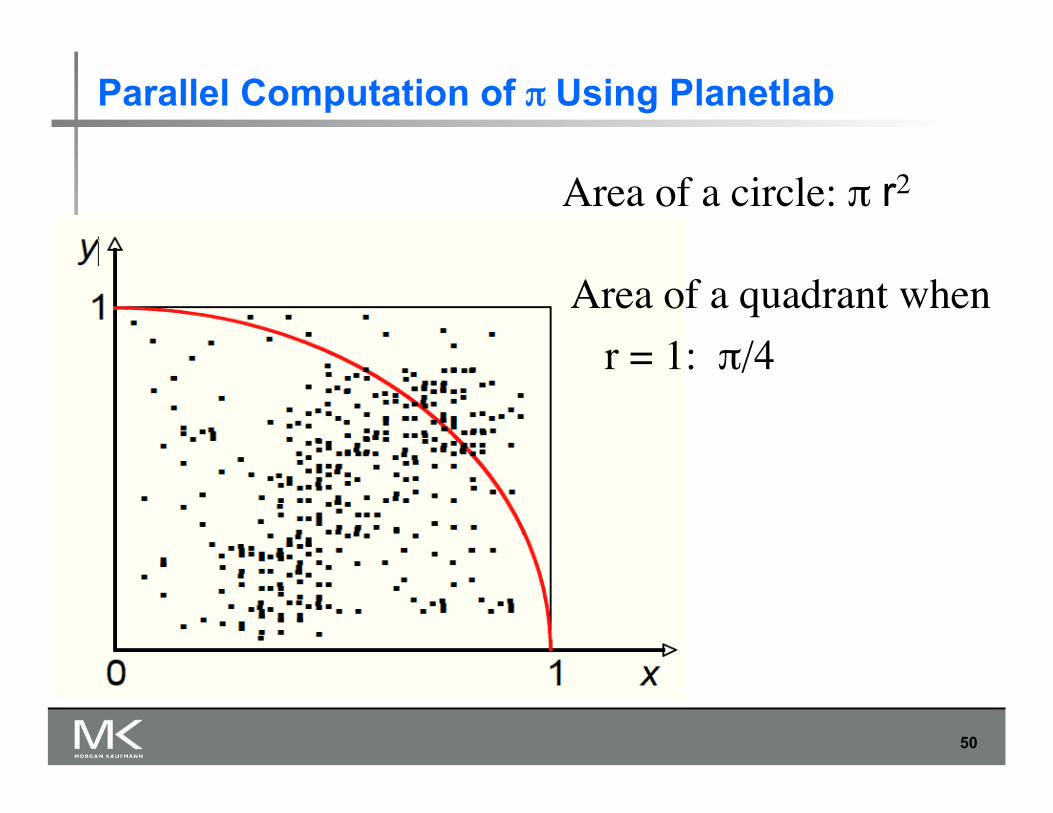
Parallel Computation of π Using Planetlab
Area of a circle: π r2
Area of a quadrant when r = 1: π/4
51
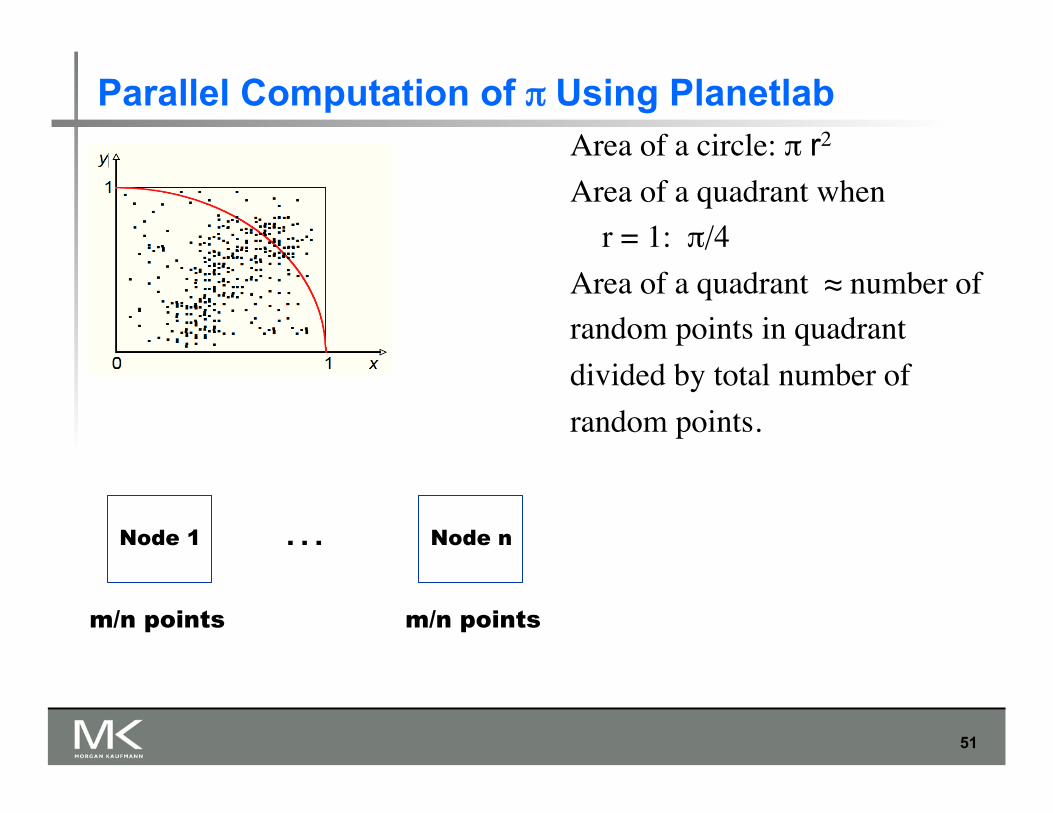
Parallel Computation of π Using Planetlab Area of a circle: π r2
Area of a quadrant when r = 1: π/4
Area of a quadrant ≈ number of random points in quadrant divided by total number of random points.
Node 1 Node n
m/n points m/n points
. . .

52
Parallel Computation of π Using Planetlab

53
All nodes: 2 Intel Core 2 Duo E6550 Processor @ 2.44 GHz with 3.44GB memory.
Parallel Computation of π Using Planetlab

54
m = 1 billion
Parallel Computation of π Using Planetlab

55
€
S =E1En
m = 1 billion
Parallel Computation of π Using Planetlab

56
Example: Amazon’s Elastic Computing Cloud (EC2)
http://aws.amazon.com/ec2/ Virtual site farm Users request the number and type of
compute instances they need: Standard High-memory High-CPU.
Payment: by instance-hour One EC2 compute unit provides the
equivalent of the CPU capacity of a 1.0-1.2 GHz 2007 Opteron or 2007 Xeon processor.

57
Examples: Amazon’s Elastic Computing Cloud (EC2)
EC2’s Auto Scaling allows users to determine when to scale up or down their EC2 usage according to user-defined conditions. Saves money
EC2’s CloudWatch aggregates and reports metrics for CPU utilization, data transfer, and disk usage and activity for each EC2 instance.

58
Amazon’s EC2 Compute Instances

59
Amazon’s EC2 Pricing

60
MapReduce at Amazon’s EC2 Short video on using Amazon’s EC2 to run
MapReduce jobs.
http://s3.amazonaws.com/awsVideos/AmazonElasticMapReduce/AmazonElasticMapReduce.html
Copyright © 2012, Elsevier Inc. All rights reserved.

61
Examples: Google’s App Engine
Web applications can be deployed on Google’s infrastructures.
Applications can run in Java or Python run-time environments.
Free startup: all applications can use up to 500 MB of storage and enough CPU and bandwidth to support an efficient app serving around 5 million page views a month for free. After that, pay according to resource usage.
62
Examples: Google’s App Engine
App Engine provides a powerful distributed data storage service that features a query engine and transactions.
Applications may include: dynamic web serving persistent storage automatic scaling and load balancing user authentication task queues scheduled tasks
63
Capacity Planning for the Cloud: from the consumer’s point of view
Problems for consumers: How to select SLAs for various QoS metrics in a
way that maximizes a utility function for the consumer subject to cost-constraints?

64
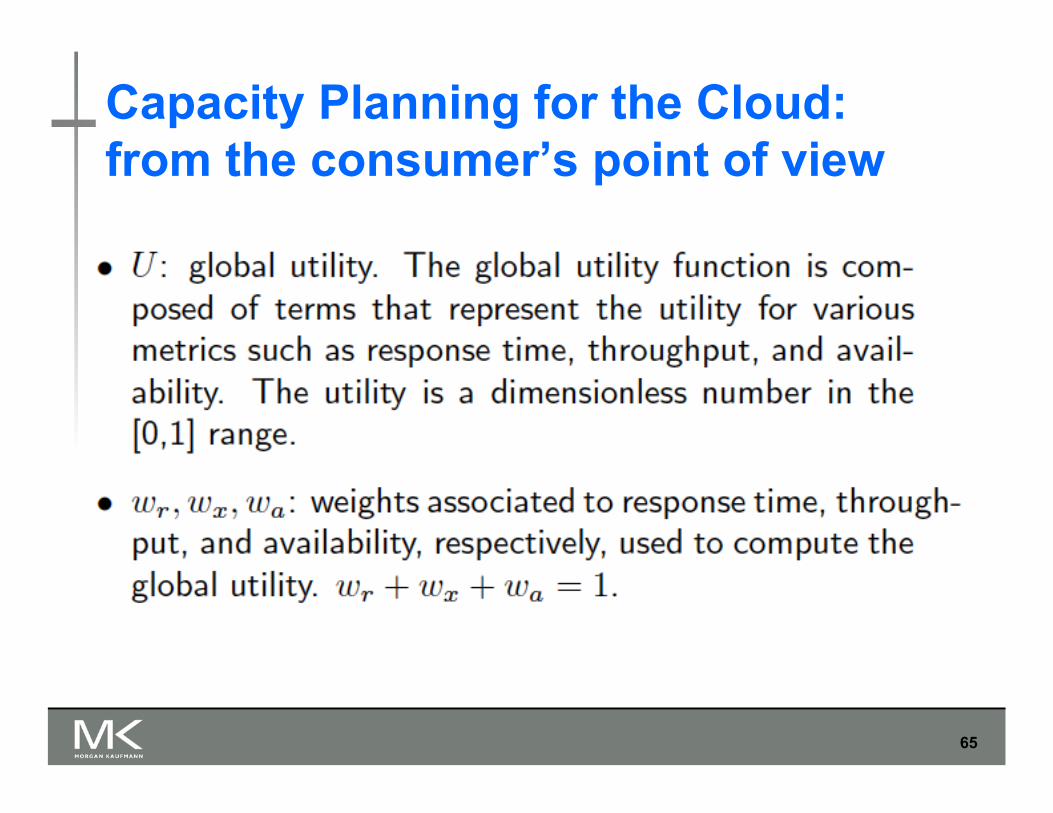
Capacity Planning for the Cloud: from the consumer’s point of view
65
Capacity Planning for the Cloud: from the consumer’s point of view

66
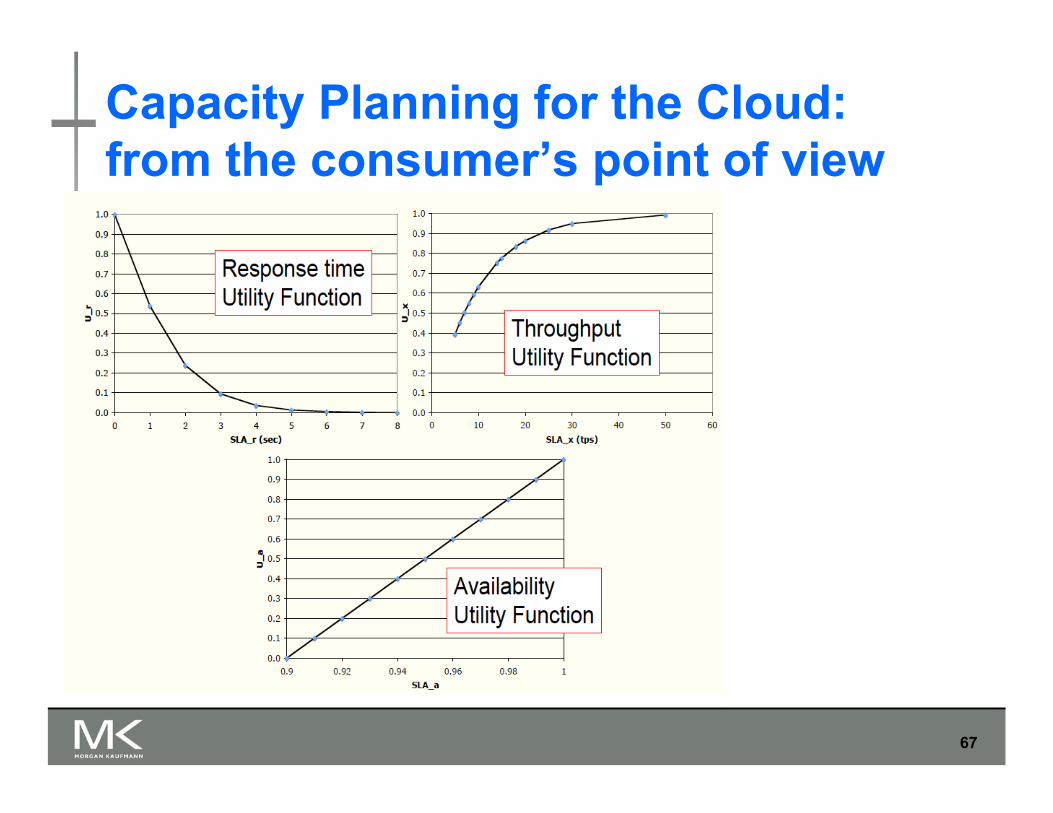
Capacity Planning for the Cloud: from the consumer’s point of view
67
Capacity Planning for the Cloud: from the consumer’s point of view

68
Capacity Planning for the Cloud: from the consumer’s point of view

69
Solvers: • NEOS: http://neos.mcs.anl.gov • MS Excel’s Solver (see Tools menu)
Capacity Planning for the Cloud: from the consumer’s point of view

70 © 2009 D.A. Menascé and Paul Ngo. All Rights Reserved.
wr = 0.4; wx = 0.3; wa = 0.3
Capacity Planning for the Cloud: from the consumer’s point of view

71
Providers have to deal with: Large and complex infrastructures Hard to predict and time-varying workloads
Providers need to implement autonomic computing techniques that are capable to dynamically shift resources without human intervention to cope with negotiated SLAs.
Capacity Planning for the Cloud: from the provider’s point of view