A prospective study on the geothermal potential in the EU€¦ · The sole responsibility for the...
97
The sole responsibility for the content of this publication etc.lies with the authors. It does not necessarily reflect the opinion of the European Union. Neither the EACI nor the European Commission are responsible for any use that may be made of the information contained therein. Deliverable n° 2.5 Date : November 2013 A prospective study on the geothermal potential in the EU
Transcript of A prospective study on the geothermal potential in the EU€¦ · The sole responsibility for the...
The sole responsibility for the content of this publication etc.lies with the authors. It does not necessarily reflect the opinion of the European Union. Neither the EACI nor the European Commission are responsible for any use that may be made of the information contained therein.
Deliverable n° 2.5Date : November 2013
A prospective study on the geothermal potential in the EU
1
Executive summary .......................................................................................................................... 3
Introduction ....................................................................................................................................... 5
1. Resource Assessment: Definitions and Best practises ......................................................... 10
2. Resource assessment methodology in GEOELEC ................................................................. 16
3. Overview of Geothermal electricity potential in Europe ......................................................... 25
Country Outlook.............................................................................................................................. 29
Austria .............................................................................................................................................. 30
Belgium ............................................................................................................................................ 32
Bulgaria ............................................................................................................................................ 34
Croatia .............................................................................................................................................. 36
Czech Republic ............................................................................................................................... 38
Denmark ........................................................................................................................................... 40
Estonia ............................................................................................................................................. 42
France .............................................................................................................................................. 44
Germany .......................................................................................................................................... 46
Greece .............................................................................................................................................. 49
Hungary ........................................................................................................................................... 52
Ireland .............................................................................................................................................. 55
Italy ................................................................................................................................................... 57
Latvia ................................................................................................................................................ 60
Lithuania .......................................................................................................................................... 62
Luxemburg ...................................................................................................................................... 64
Poland .............................................................................................................................................. 66
Portugal ........................................................................................................................................... 68
Romania ........................................................................................................................................... 70
Slovakia ........................................................................................................................................... 72
Slovenia ........................................................................................................................................... 74
Spain ................................................................................................................................................ 76
2
The Netherlands .............................................................................................................................. 78
United Kingdom .............................................................................................................................. 80
Iceland .............................................................................................................................................. 83
Switzerland ...................................................................................................................................... 85
Turkey .............................................................................................................................................. 87
Recommendations for policy-makers: How to realise the geothermal electricity potential in
Europe .............................................................................................................................................. 89
ANNEX I: Modelling results - 2030 ................................................................................................ 93
ANNEX II: Modelling results - 2050 ............................................................................................... 94
ANNEX III: Geothermal Share in the electricity mix .................................................................... 95
ANNEX IV THE GEOELEC CONSORTIUM .................................................................................... 96
AUTHORS: Jan-Diederik van Wees, Thijs Boxem (TNO), Luca Angelino, Philippe Dumas (European Geothermal
Energy Council)
List of main abbreviations and acronyms used
AGEA Australia Geothermal Energy Association CanGEA Canadian Geothermal Energy Association CHP Combined Heat and Power EGEC European Geothermal Energy Council EGRIF European Geothermal Risk Insurance Fund EGS Enhanced Geothermal Systems HIP Heat in Place HSA Hot Sedimentary Aquifer LCoE Levelised Cost of Energy NREAPs: National Renewable Energy Action Plans ORC Organic Rankine Cycle TC Theoretical Capacity TP Technical Potential TPLCoE_p Economic Technical Potential
3
Executive summary
Geothermal power generation has its roots in Europe, where the first test in 1904 and the
real beginning of power generation in 1913 took place in Italy. Since then, the development
of geothermal technology has been slow but continuous.
Since a decade, thanks to the optimisation of the new binary system technology,
geothermal electricity can be produced using lower temperatures. Moreover, with
Enhanced Geothermal Systems (EGS), a breakthrough technology proven since 2007,
geothermal power can in theory be produced anywhere in Europe.
According to the trajectories set out in the National Renewable Energy Action Plans
(NREAPs) of the EU Member States, the capacity will grow from 0.9 GWe installed in 2013 to
1.4 GWe in 2020. The production of geothermal electricity in 2020 is planned to be 11 TWh.
These are very conservative targets as the actual potential is much larger. Indeed,
information about geothermal potential is not always available (no geological data below 2-
3 km from previous exploration campaign for oil, gas etc.) or it is scattered in different
ministries, universities, national institutes, oil & gas companies and various private entities.
For this reason many policy-makers are simply not aware they stand on a frequently
untapped source of local renewable energy. And this is also why geothermal power is not
always taken sufficiently into consideration in some NREAPs and other strategic documents
on the future electricity mix.
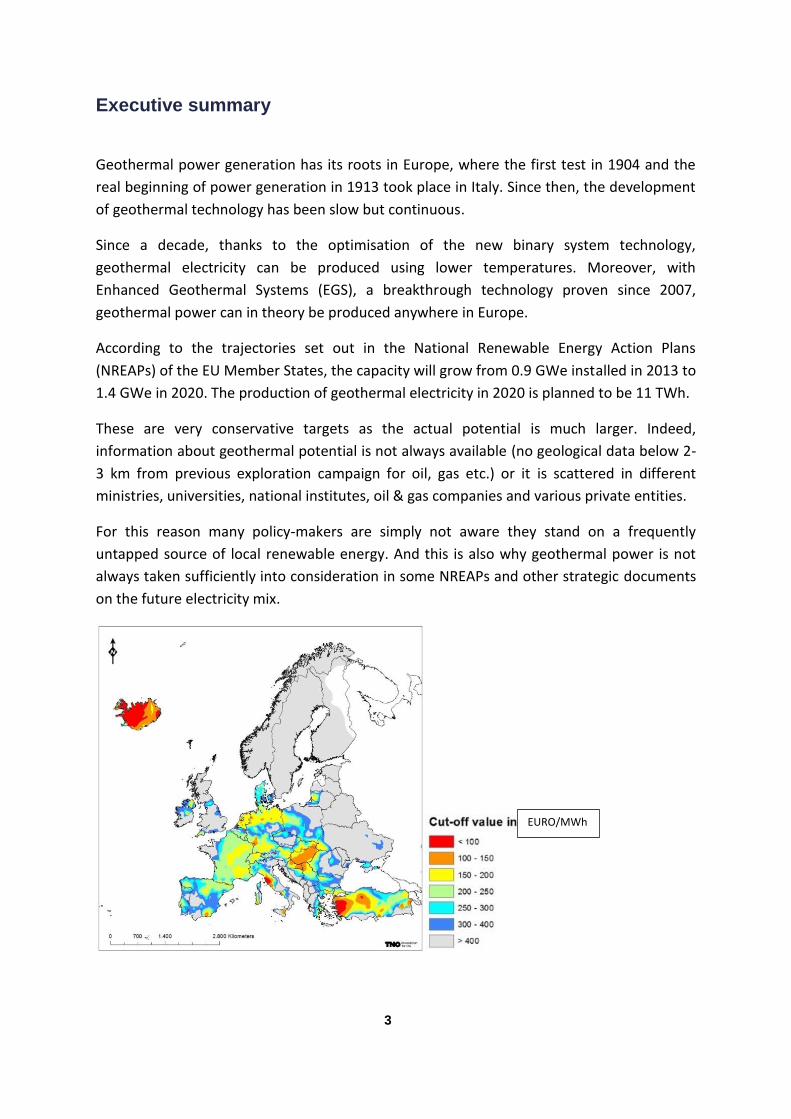
EURO/MWh
4
Minimum levelised costs of Energy in 2030 (in EUR/MWh)
The present GEOELEC study makes a first step to fill the existing gap. It provides an outlook
of the potential by country; the resource assessment is the product of the integration and
interpretation of existing data and a newly defined methodology building on Canadian,
Australian, and American methodology.
The geological potential (heat in place) for geothermal power has been translated to an
economical potential, using a Levelised Cost of Energy (LCoE) value of less than 150
EUR/MWh for the 2030 scenario and less than 100 EUR/MWh for the 2050 scenario:
The total geothermal electricity potential in the EU-28 is 21,2 TWh for the year
2020;
In 2030 this amounts to 34 TWh or 1% of the projected total electricity production
in the EU;
Thanks to economies of scale, innovative drilling concepts and substantial cost
reduction, the economic potential in the EU grows to approximately 2570 TWh in
2050 potentially covering as much as 50% of the projected electricity produced in
the EU) and more than 4000 TWh including Iceland, Turkey and Switzerland.
5
Introduction
What is geothermal electricity? Until little over a century ago, the exploitation of geothermal resources was primarily for
leisure purposes; hot springs and geothermal baths. It was at the beginning of the 20th
century that the active development of geothermal resources for electricity supply began.
Successful production of electricity from geothermal heat was first achieved in Larderello,
Italy, in 1904.
Since then, the production of geothermal electricity has steadily increased. The methods by
which hydrothermal resources are developed for electricity production can be divided in
two categories: conventional (dry steam and flash steam turbines) and low temperature
(binary) geothermal electricity.
Conventional geothermal electricity: dry steam and flash steam turbines
Operating with large hydrothermal reservoirs at high temperature, i.e. above 150°C, such as
those found in Tuscany (Italy) and Iceland, this technology has 100 years of history and is
fully competitive today with a full cost of about 0.07 EUR/kWh including systems costs and
externalities. Regrettably, it is very unlikely that new large geothermal reservoirs will be
discovered in Europe. Therefore new projects need to be adapted to smaller and cooler
resources.
Low temperature, hydrothermal geothermal electricity: Binary: ORC and Kalina Cycle
Binary, known also as Organic Rankine Cycle (ORC) or Kalina Cycle, plants operate usually
with waters in the 100°C to 180°C temperature range. Working fluid selection, in
cooperation with beneficial conditions such as access to effective cooling, may allow power
production from as low temperatures as 80°C.
In a binary system, the heat of water is transferred to a separate liquid with a lower boiling
temperature. The separate liquid is called a ‘working fluid’. When the hot geothermal water
is brought to surface from deep underground, it is run through a ‘heat exchanger’ which
transfers the heat from the geothermal water to the liquid working fluid. Because the
working fluid boils at a low temperature, it vaporises readily with less geothermal heat, and
this vaporisation produces enough pressure to drive a turbine. What makes a binary system
unique is that it operates a two closed-loops (hence, binary); neither the geothermal water
nor the working fluid are exposed to the surface environment. All the water that is brought
to surface has to be re-injected, and after vaporising, the working fluid is cooled to its liquid
state, so it may repeat the process. There are no-emissions in the binary geothermal cycle.
6
Beyond Hydrothermal: Enhanced Geothermal Systems – EGS
Geothermal energy has the potential to make a more significant contribution to the
European electricity mix through the development of advanced technologies, especially the
development of hot rock resources using EGS techniques that would enable thermal energy
recovery from outside of traditionally favourable regions. An EGS is an underground
reservoir that has been created or improved artificially.
The EGS concept is going to greatly increase geothermal potential as it allows for the
production of geothermal electricity nearly anywhere in Europe with medium and low
temperature.
This concept involves:
• Using the natural fracture systems in basement rocks • Enlarging permeability through stimulation
• Installing a multi-well system
• Through pumping and lifting, forcing the water to migrate through the fracture
system of enhanced permeability ("reservoir") and use the heat for power
production.
Main benefits of geothermal electricity
A base load and flexible renewable energy source (no intermittency)…
Geothermal energy has many obvious qualities. A remarkable one is that it is not dependent
on climate conditions as wind or solar energy may be. As a result, base load can be
provided. This makes geothermal one of the most reliable amongst all renewable energies,
as plants are able to operate up to 95 per cent of the time. Such a load factor makes some
geothermal plants already competitive with fossil fuel and nuclear power plants. But
geothermal electricity is also flexible as it can be ramped up or down on demand, thereby
contributing to the stability of the grid.
Ensuring price stability and increasing security of supply…
Developing and utilising geothermal resources for electricity can help to protect against
volatile and rising electricity from fossil fuels. As a renewable and domestic resource,
geothermal enables a diversification of the electricity mix. Making use of this local source of
energy reduces the amount of fuel that countries have to import and thereby increases their
security of supply.
Providing Clean Electricity…
All human activity has an impact on nature, but compared to other energy sources,
Geothermal has a negligible environmental footprint (see GEOLEC report “Environmental
study on geothermal power”). Indeed, Geothermal power systems emit only a small amount
of greenhouse gases; if one takes CO2 as a benchmark, then geothermal closed-loop-binary
7
plants emit 0 CO2. Furthermore, Geothermal power plants produce only a small amount of
air emissions compared to conventional fossil fuels, and unlike other renewable energies
such as solar or biomass, have very small land-use footprint.
Or Combined Heat and Power…
In a combined process the geothermal resources can be used to generate electricity and
heat. Producing heat and electricity means optimising the efficiency factor of the energy
production and upgrading cash flows.
… And Supporting Local and Sustainable Economic Development
Using geothermal resources can provide economic opportunities for countries in the form of
taxes, royalties, technology export and jobs. Because of specific geological conditions, these
jobs require a thorough knowledge of the local conditions and cannot be exported.
Therefore, investments in geothermal power can boost local economies and improve urban
environment conditions alike.
Tackling the first barrier: Lack of awareness and data
Geothermal energy can be a key source in helping EU Member States to achieve their 2020
targets for renewable energy as well as their long-term decarbonisation objectives.
According to the trajectories set out in the National Renewable Energy Action Plans
(NREAPs) of the EU Member States, the capacity will grow from 0.9 GWe installed in 2013 to
1.4 GWe in 2020. The production of geothermal electricity in 2020 is planned to increase
from the current 6 TWh to 11 TWh. However, the actual potential is much larger.
Whilst some Member States acknowledge the possibility of developing geothermal power in
their NREAPs, many others simply did not carry out any studies to assess the geothermal
potential. Indeed, information is not always available, for example where there was no
previous exploration campaign for oil, gas, etc. Where information for locating and
estimating the geothermal resource does exist, it is scattered about in different ministries,
universities, national institutes, oil & gas companies and various private entities. This has
resulted in very conservative targets for geothermal power.
With this study the GEOELEC project aims to take the first step in filling the existing gap and
providing an input for the national energy strategies of European countries, with a focus on
the 2020, 2030, and 2050 horizons. The resource assessment is the product of the
integration and interpretation of existing data provided by most of the EU-28 countries
(data was not available for Cyprus, Finland, and Malta) plus Iceland, Switzerland and Turkey,
and a newly defined methodology building on Canadian, Australian, and American
methodology.
8
Structure of this report
The first part of this report is dedicated to providing the reader with a quick overview of
basic definitions and best practises for resource assessment (Chapter 1), and to present the
methodology and assumptions used for the resource assessment in GEOELEC (Chapter 2).
The second part of the report presents the results of the GEOELEC resource assessment,
both at an EU and national level. For each country covered, this report provides some
background information on the geological conditions and on the market development.
Looking at the 2020 horizon, it compares potential with national targets for 2020 as set out
in the National Renewable Energy Action Plans (NREAPs). Where significant differences or
gaps in terms of regulatory framework emerge, recommendations for the amendment of
the NREAPs are put forward.
Each country outlook also analyses the longer-term economic potential, i.e. in 2030-2050
for the deployment of geothermal electricity and compare such a potential with the
projected demand in each country. This can feed the current debate on the long-term
energy strategies ongoing in many countries in Europe.
Finally, this Prospective Study puts forward a set of recommendations for policy-makers on
how to establish favourable conditions so as to concretely realise the geothermal potential.
Sources and methodology
Data and information in this report stem from different sources. To begin with the supply
side, current information on geological conditions and market development are mainly
extrapolated from the Country Update Reports submitted for the European Geothermal
Congress 2013 and EUROSTAT. In addition, figures for the calculation of the economic
potential for geothermal power in 2030-2050 are calculated according to the methodology
laid down in Chapter 2 and entirely reported in Annexes, I, II, and III. Finally, national targets
for geothermal electricity are taken from the NREAPs submitted to the European
Commission1.
As far as the total projected electricity production in 2050, the cumulative figures for the
EU-27 are taken from the Current Policy Initiatives Scenario of the Energy Roadmap 2050.
Regarding the projected electricity production per each EU-27 country, we have broken
down at national level the average trend observed at EU level between 2010 and 2030 and
between 2030 and 2050. It should be noted here that the projected electricity demand is
not available for non-EU countries (Iceland, Switzerland, and Turkey) and for Croatia, which
1 Available online: http://ec.europa.eu/energy/renewables/action_plan_en.htm .

9
was not yet a member of the EU in December 2011 (date of publication of the Energy
Roadmap 2050).
10
1. Resource Assessment: Definitions and Best practises
This chapter gives a definition for resource assessment and is a basis for a pan-European
map showing the resources which could be developed in 2020, 2030, and 2050. The
GEOELEC resource assessment protocol is based on resource assessment concepts
developed in the oil and gas industry, which have been adopted in an adjusted form for
geothermal resource assessment and reporting. This protocol has been based on the
following work:
Beardsmore et al., 2010. A protocol for estimating and mapping the global EGS
potential.
AGEA, 2010. Australian code for reporting of exploration results, geothermal
resources and geothermal reserves: the geothermal reporting code
CanGEA, 2010. The Canadian geothermal code for public reporting
These documents describe a protocol to classify and estimate geothermal reserves and
resources. Further, input from resource classification approaches developed in the oil and
gas industry (Etherington et al., 2007) were used.
1.1 Basic definitions
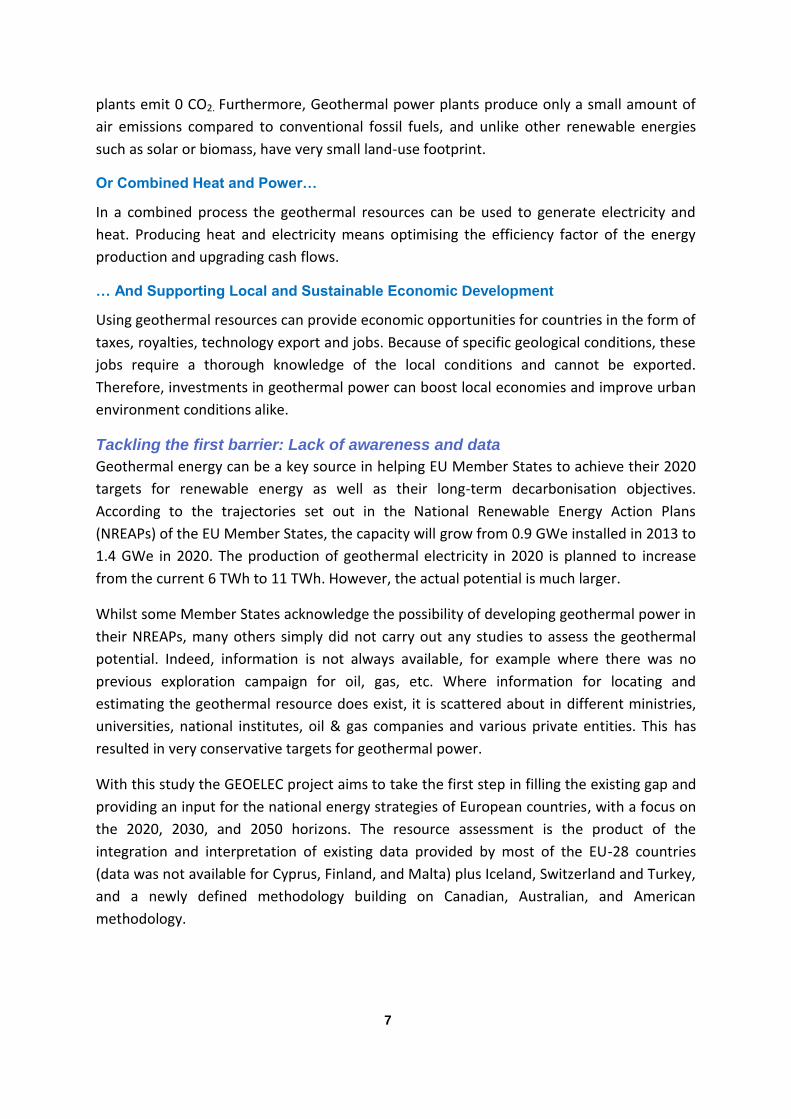
McKelvey (Figure 1) and project approach: Key to resource assessment and classification is
the concept of the McKelvey diagram, and a project oriented approach in which resources
develop progressively from being inferred at an early exploration stage towards becoming
discovered after drilling and finally economically recoverable at the production stage. In the
exploration the transition from an inferred (undiscovered) to a discovered resource is
determined by drilling the reservoir, which is can prove the presence of the resource and to
appraise the productivity.
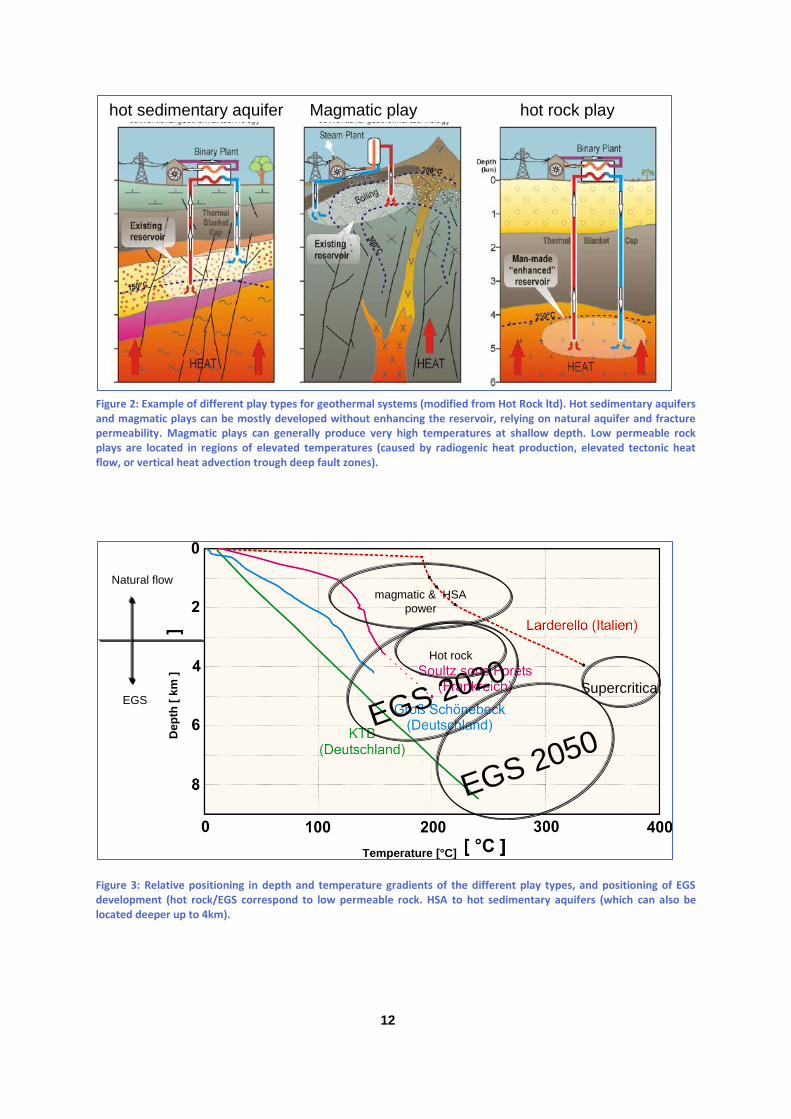
Plays, leads and prospects (Figure 2): In the geothermal exploration workflow prior to
drilling, the identification of a prospective reservoir location starts off with a so-called play
concept. A geothermal play is a geographically (and in depth) delimited area where specific
subsurface conditions allow the obtaining of a sufficiently high flow rate of a sufficiently high
temperature, with suitable pressure and chemical conditions. A lead is a particular
subsurface reservoir which has been identified by surface exploration studies (e.g. MT). A
prospect is a location which has been studied thoroughly by surface exploration and has
been earmarked to be drilled.
11
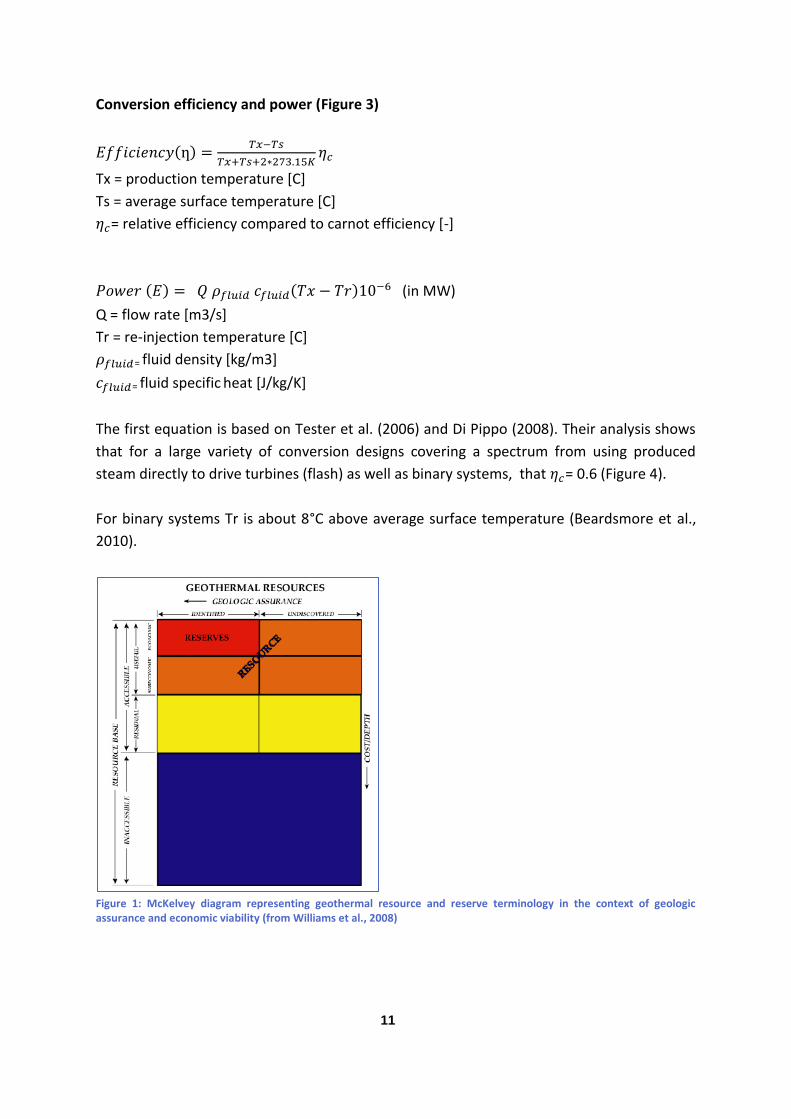
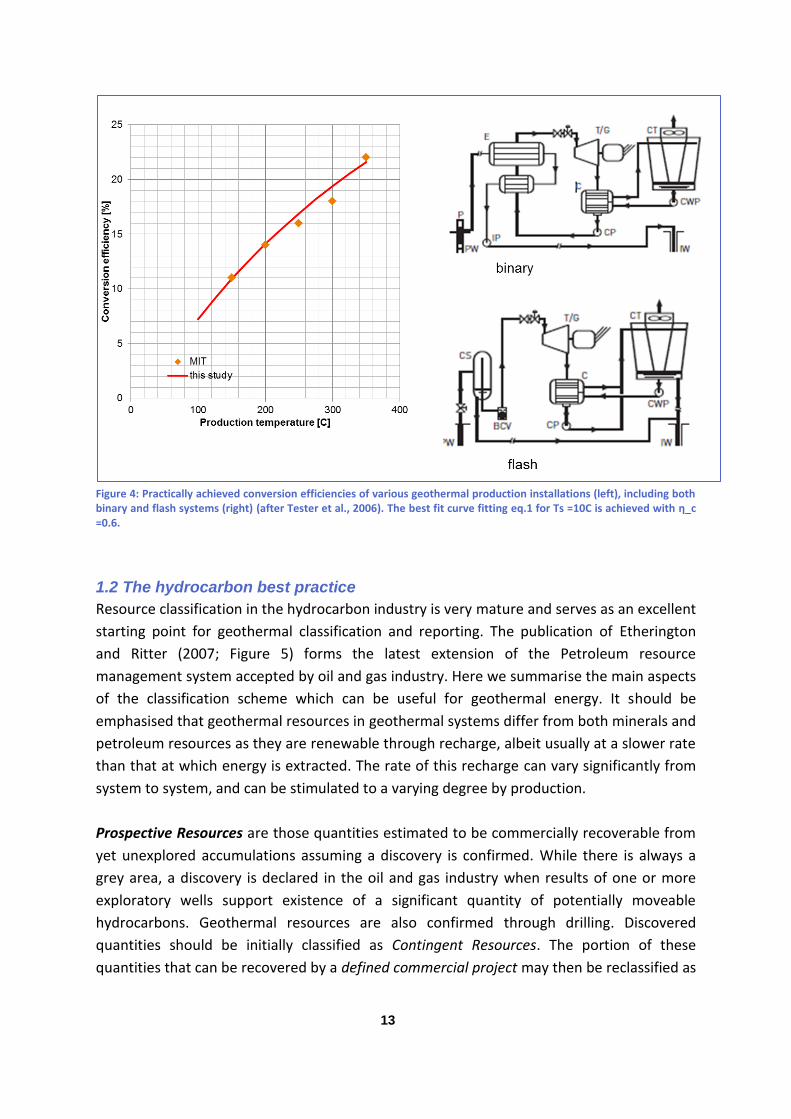
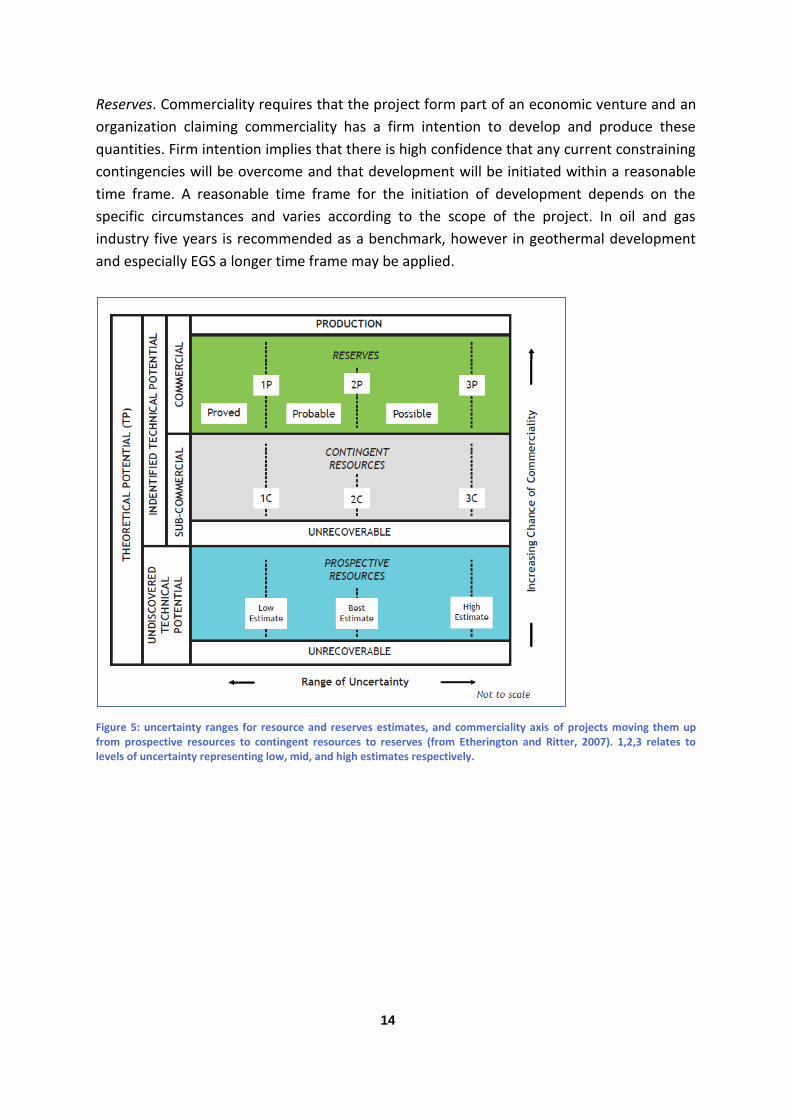
Conversion efficiency and power (Figure 3)
( )
Tx = production temperature [C]
Ts = average surface temperature [C]
= relative efficiency compared to carnot efficiency [-]
( ) ( ) (in MW)
Q = flow rate [m3/s]
Tr = re-injection temperature [C]
= fluid density [kg/m3]
= fluid specific heat [J/kg/K]
The first equation is based on Tester et al. (2006) and Di Pippo (2008). Their analysis shows
that for a large variety of conversion designs covering a spectrum from using produced
steam directly to drive turbines (flash) as well as binary systems, that = 0.6 (Figure 4).
For binary systems Tr is about 8°C above average surface temperature (Beardsmore et al.,
2010).
Figure 1: McKelvey diagram representing geothermal resource and reserve terminology in the context of geologic assurance and economic viability (from Williams et al., 2008)
12
Figure 2: Example of different play types for geothermal systems (modified from Hot Rock ltd). Hot sedimentary aquifers and magmatic plays can be mostly developed without enhancing the reservoir, relying on natural aquifer and fracture permeability. Magmatic plays can generally produce very high temperatures at shallow depth. Low permeable rock plays are located in regions of elevated temperatures (caused by radiogenic heat production, elevated tectonic heat flow, or vertical heat advection trough deep fault zones).
Figure 3: Relative positioning in depth and temperature gradients of the different play types, and positioning of EGS development (hot rock/EGS correspond to low permeable rock. HSA to hot sedimentary aquifers (which can also be located deeper up to 4km).
hot rock playhot sedimentary aquifer Magmatic play
Temperature [°C]
EGS 2020
De
pth
[ k
m ]
Supercritica;
magmatic & HSA
power
EGS
Natural flow
EGS 2050
Hot rock
13
Figure 4: Practically achieved conversion efficiencies of various geothermal production installations (left), including both binary and flash systems (right) (after Tester et al., 2006). The best fit curve fitting eq.1 for Ts =10C is achieved with η_c =0.6.
1.2 The hydrocarbon best practice
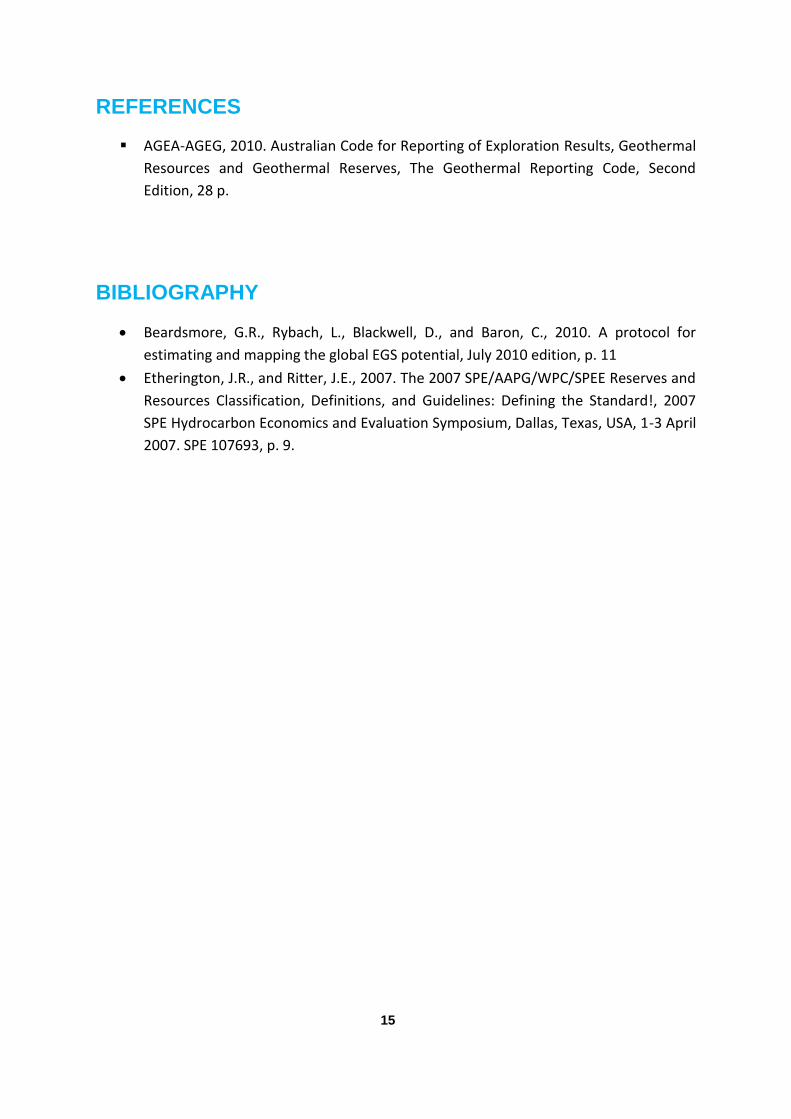
Resource classification in the hydrocarbon industry is very mature and serves as an excellent
starting point for geothermal classification and reporting. The publication of Etherington
and Ritter (2007; Figure 5) forms the latest extension of the Petroleum resource
management system accepted by oil and gas industry. Here we summarise the main aspects
of the classification scheme which can be useful for geothermal energy. It should be
emphasised that geothermal resources in geothermal systems differ from both minerals and
petroleum resources as they are renewable through recharge, albeit usually at a slower rate
than that at which energy is extracted. The rate of this recharge can vary significantly from
system to system, and can be stimulated to a varying degree by production.
Prospective Resources are those quantities estimated to be commercially recoverable from
yet unexplored accumulations assuming a discovery is confirmed. While there is always a
grey area, a discovery is declared in the oil and gas industry when results of one or more
exploratory wells support existence of a significant quantity of potentially moveable
hydrocarbons. Geothermal resources are also confirmed through drilling. Discovered
quantities should be initially classified as Contingent Resources. The portion of these
quantities that can be recovered by a defined commercial project may then be reclassified as
14
Reserves. Commerciality requires that the project form part of an economic venture and an
organization claiming commerciality has a firm intention to develop and produce these
quantities. Firm intention implies that there is high confidence that any current constraining
contingencies will be overcome and that development will be initiated within a reasonable
time frame. A reasonable time frame for the initiation of development depends on the
specific circumstances and varies according to the scope of the project. In oil and gas
industry five years is recommended as a benchmark, however in geothermal development
and especially EGS a longer time frame may be applied.
Figure 5: uncertainty ranges for resource and reserves estimates, and commerciality axis of projects moving them up from prospective resources to contingent resources to reserves (from Etherington and Ritter, 2007). 1,2,3 relates to levels of uncertainty representing low, mid, and high estimates respectively.
15
REFERENCES
AGEA-AGEG, 2010. Australian Code for Reporting of Exploration Results, Geothermal
Resources and Geothermal Reserves, The Geothermal Reporting Code, Second
Edition, 28 p.
BIBLIOGRAPHY
Beardsmore, G.R., Rybach, L., Blackwell, D., and Baron, C., 2010. A protocol for
estimating and mapping the global EGS potential, July 2010 edition, p. 11
Etherington, J.R., and Ritter, J.E., 2007. The 2007 SPE/AAPG/WPC/SPEE Reserves and
Resources Classification, Definitions, and Guidelines: Defining the Standard!, 2007
SPE Hydrocarbon Economics and Evaluation Symposium, Dallas, Texas, USA, 1-3 April
2007. SPE 107693, p. 9.
16
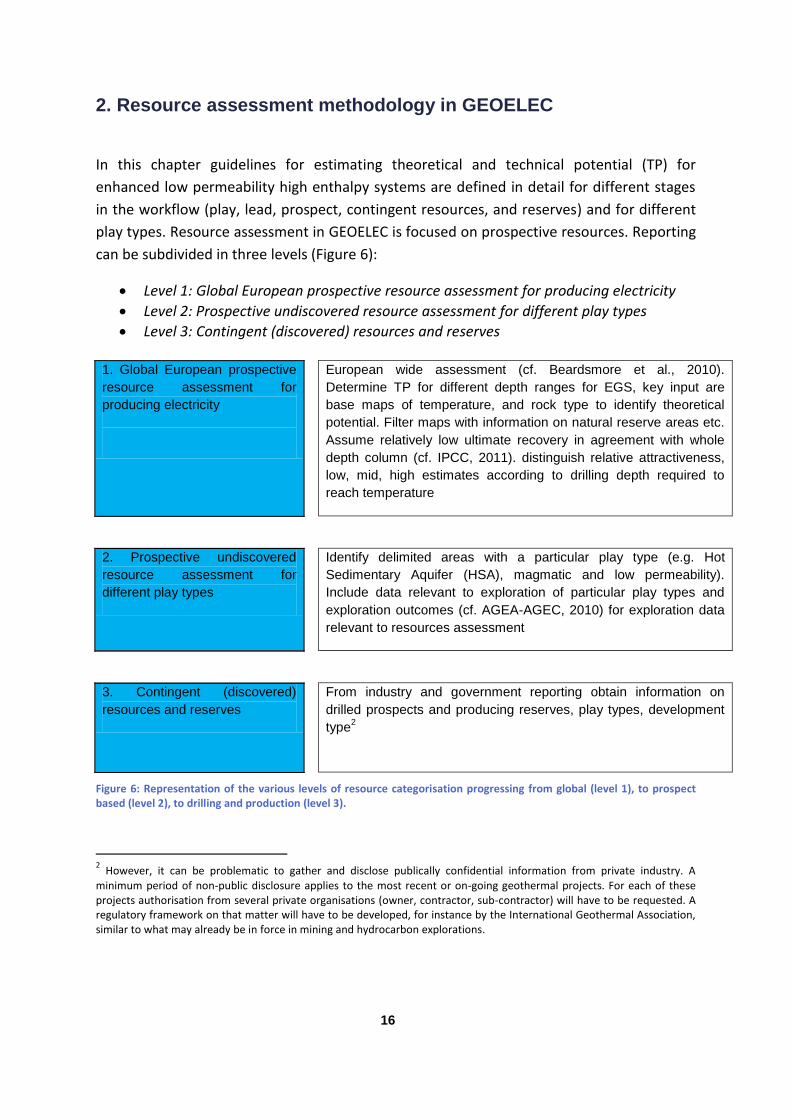
2. Resource assessment methodology in GEOELEC
In this chapter guidelines for estimating theoretical and technical potential (TP) for
enhanced low permeability high enthalpy systems are defined in detail for different stages
in the workflow (play, lead, prospect, contingent resources, and reserves) and for different
play types. Resource assessment in GEOELEC is focused on prospective resources. Reporting
can be subdivided in three levels (Figure 6):
Level 1: Global European prospective resource assessment for producing electricity
Level 2: Prospective undiscovered resource assessment for different play types
Level 3: Contingent (discovered) resources and reserves
1. Global European prospective
resource assessment for
producing electricity
European wide assessment (cf. Beardsmore et al., 2010).
Determine TP for different depth ranges for EGS, key input are
base maps of temperature, and rock type to identify theoretical
potential. Filter maps with information on natural reserve areas etc.
Assume relatively low ultimate recovery in agreement with whole
depth column (cf. IPCC, 2011). distinguish relative attractiveness,
low, mid, high estimates according to drilling depth required to
reach temperature
2. Prospective undiscovered
resource assessment for
different play types
Identify delimited areas with a particular play type (e.g. Hot
Sedimentary Aquifer (HSA), magmatic and low permeability).
Include data relevant to exploration of particular play types and
exploration outcomes (cf. AGEA-AGEC, 2010) for exploration data
relevant to resources assessment
3. Contingent (discovered)
resources and reserves
From industry and government reporting obtain information on
drilled prospects and producing reserves, play types, development
type2
Figure 6: Representation of the various levels of resource categorisation progressing from global (level 1), to prospect based (level 2), to drilling and production (level 3).
2 However, it can be problematic to gather and disclose publically confidential information from private industry. A
minimum period of non-public disclosure applies to the most recent or on-going geothermal projects. For each of these projects authorisation from several private organisations (owner, contractor, sub-contractor) will have to be requested. A regulatory framework on that matter will have to be developed, for instance by the International Geothermal Association, similar to what may already be in force in mining and hydrocarbon explorations.
17
In depth the resource assessment is limited to 5 or 6.5 km for present developments, but
may increase in the future. The development of two timelines is therefore proposed, one
based on 7 km for 2020 and 2030, one based on 10 km for 2050.
A global Level 1 was conducted by GEOELEC assessment. The information gathering for the
assessment was accomplished through data workshops and a data request sheet. It was
concluded that insufficient data was available for a level 2 or 3 assessment, none was
conducted. The level 1 resource assessment has been performed on a regular 3D hexahedral
grid with a horizontal resolution of 20 km and a vertical resolution of 250 m. The areas
covered by this voxet cover the EU-28 countries including various other countries in Eastern
Europe. The area is delineated in Figure below showing the temperature model.
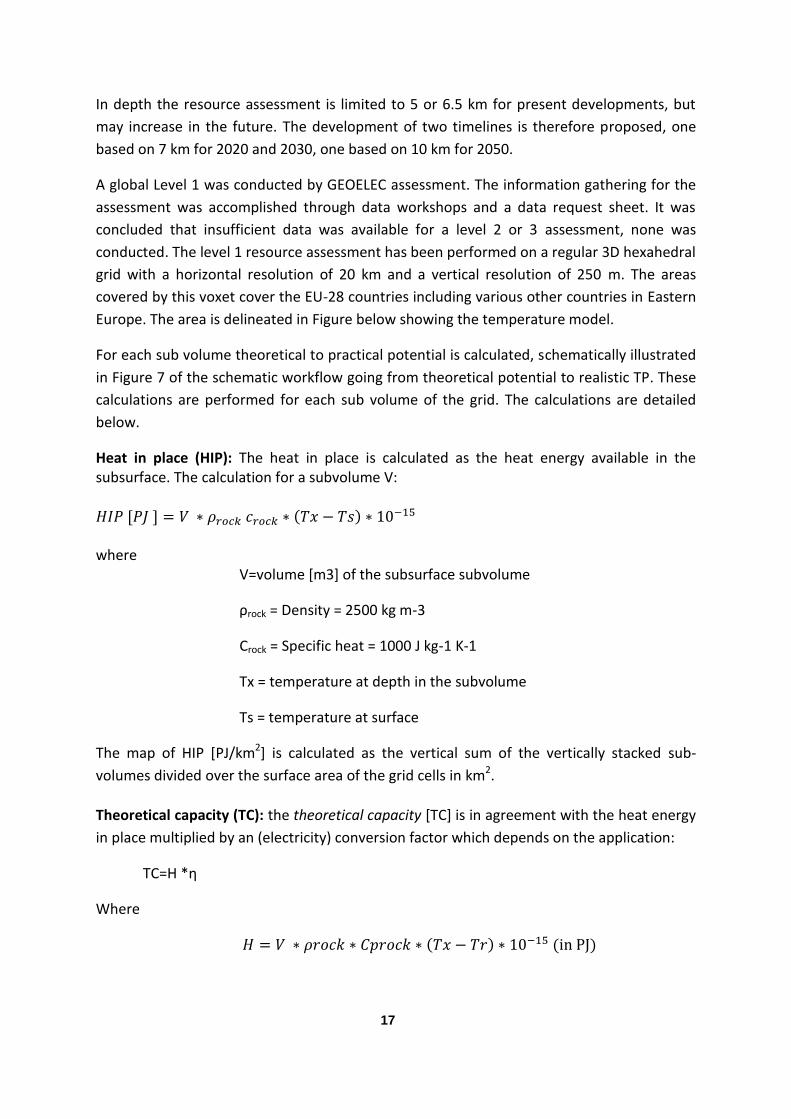
For each sub volume theoretical to practical potential is calculated, schematically illustrated
in Figure 7 of the schematic workflow going from theoretical potential to realistic TP. These
calculations are performed for each sub volume of the grid. The calculations are detailed
below.
Heat in place (HIP): The heat in place is calculated as the heat energy available in the subsurface. The calculation for a subvolume V: ( ) where
V=volume [m3] of the subsurface subvolume
ρrock = Density = 2500 kg m-3
Crock = Specific heat = 1000 J kg-1 K-1
Tx = temperature at depth in the subvolume
Ts = temperature at surface
The map of HIP [PJ/km2] is calculated as the vertical sum of the vertically stacked sub-
volumes divided over the surface area of the grid cells in km2.
Theoretical capacity (TC): the theoretical capacity [TC] is in agreement with the heat energy
in place multiplied by an (electricity) conversion factor which depends on the application:
TC=H *ƞ
Where
( ) ( )
18
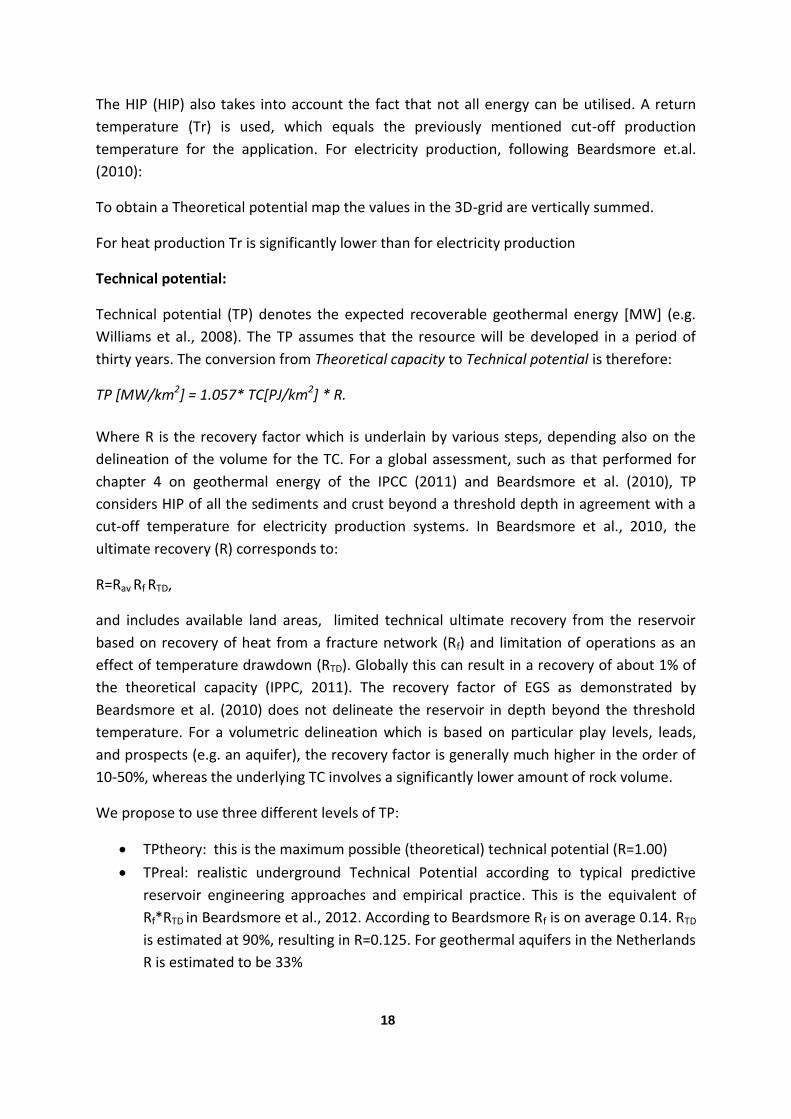
The HIP (HIP) also takes into account the fact that not all energy can be utilised. A return
temperature (Tr) is used, which equals the previously mentioned cut-off production
temperature for the application. For electricity production, following Beardsmore et.al.
(2010):
To obtain a Theoretical potential map the values in the 3D-grid are vertically summed.
For heat production Tr is significantly lower than for electricity production
Technical potential:
Technical potential (TP) denotes the expected recoverable geothermal energy [MW] (e.g.
Williams et al., 2008). The TP assumes that the resource will be developed in a period of
thirty years. The conversion from Theoretical capacity to Technical potential is therefore:
TP [MW/km2] = 1.057* TC[PJ/km2] * R.
Where R is the recovery factor which is underlain by various steps, depending also on the
delineation of the volume for the TC. For a global assessment, such as that performed for
chapter 4 on geothermal energy of the IPCC (2011) and Beardsmore et al. (2010), TP
considers HIP of all the sediments and crust beyond a threshold depth in agreement with a
cut-off temperature for electricity production systems. In Beardsmore et al., 2010, the
ultimate recovery (R) corresponds to:
R=Rav Rf RTD,
and includes available land areas, limited technical ultimate recovery from the reservoir
based on recovery of heat from a fracture network (Rf) and limitation of operations as an
effect of temperature drawdown (RTD). Globally this can result in a recovery of about 1% of
the theoretical capacity (IPPC, 2011). The recovery factor of EGS as demonstrated by
Beardsmore et al. (2010) does not delineate the reservoir in depth beyond the threshold
temperature. For a volumetric delineation which is based on particular play levels, leads,
and prospects (e.g. an aquifer), the recovery factor is generally much higher in the order of
10-50%, whereas the underlying TC involves a significantly lower amount of rock volume.
We propose to use three different levels of TP:
TPtheory: this is the maximum possible (theoretical) technical potential (R=1.00)
TPreal: realistic underground Technical Potential according to typical predictive
reservoir engineering approaches and empirical practice. This is the equivalent of
Rf*RTD in Beardsmore et al., 2012. According to Beardsmore Rf is on average 0.14. RTD
is estimated at 90%, resulting in R=0.125. For geothermal aquifers in the Netherlands
R is estimated to be 33%
19
TPbm: Technical Potential according to Beardsmore et al., 2010 (R=0.01)
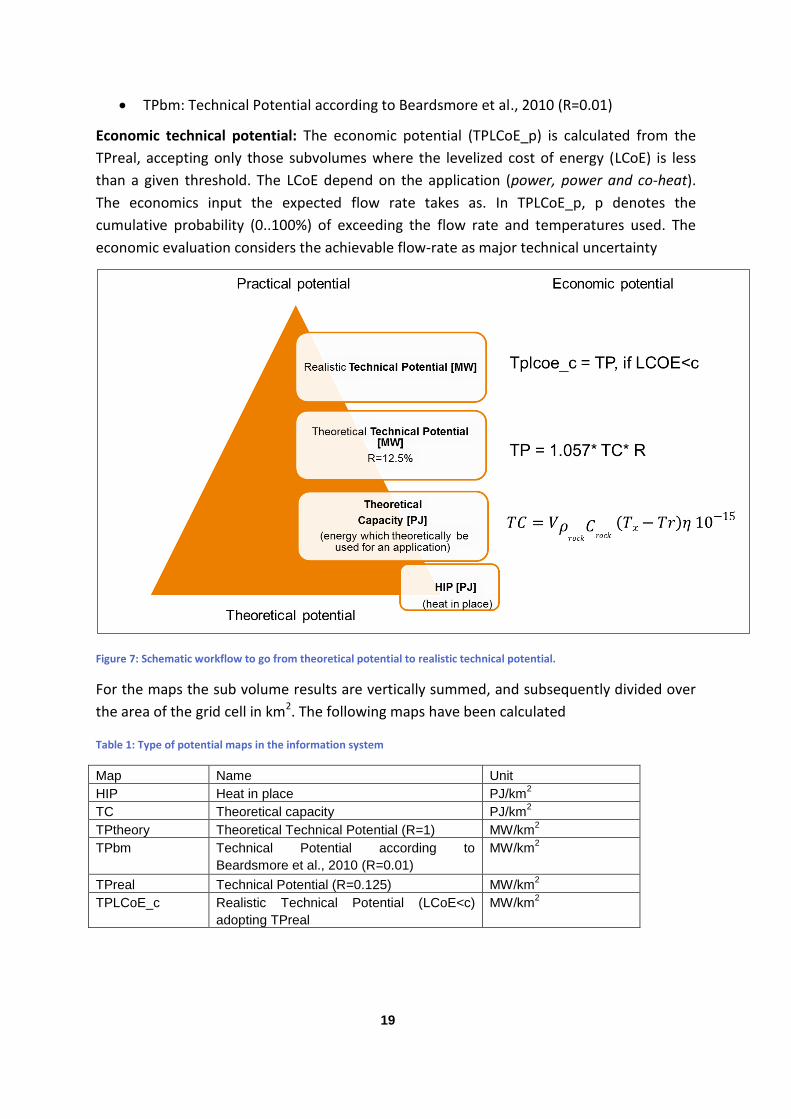
Economic technical potential: The economic potential (TPLCoE_p) is calculated from the
TPreal, accepting only those subvolumes where the levelized cost of energy (LCoE) is less
than a given threshold. The LCoE depend on the application (power, power and co-heat).
The economics input the expected flow rate takes as. In TPLCoE_p, p denotes the
cumulative probability (0..100%) of exceeding the flow rate and temperatures used. The
economic evaluation considers the achievable flow-rate as major technical uncertainty
Figure 7: Schematic workflow to go from theoretical potential to realistic technical potential.
For the maps the sub volume results are vertically summed, and subsequently divided over
the area of the grid cell in km2. The following maps have been calculated
Table 1: Type of potential maps in the information system
Map Name Unit
HIP Heat in place PJ/km2
TC Theoretical capacity PJ/km2
TPtheory Theoretical Technical Potential (R=1) MW/km2
TPbm Technical Potential according to
Beardsmore et al., 2010 (R=0.01)
MW/km2
TPreal Technical Potential (R=0.125) MW/km2
TPLCoE_c Realistic Technical Potential (LCoE<c)
adopting TPreal
MW/km2
20
Table 2: Additional maps based on the 3D grid calculations
Map Name Unit
LCoE Minimum LCoE in a vertical stack of the 3D
grid
EUR/MWh
LCoEDEPTH Depth of the Minimum LCoE in a vertical
stack of the 3D grid
km
For the country outlooks it is assumed that 25% of the economic (realistic technical)
potential in MWe can be installed on a country basis, due to restrictions in land use. For the
conversion from installed capacity to TWh a load factor of 90% is adopted.
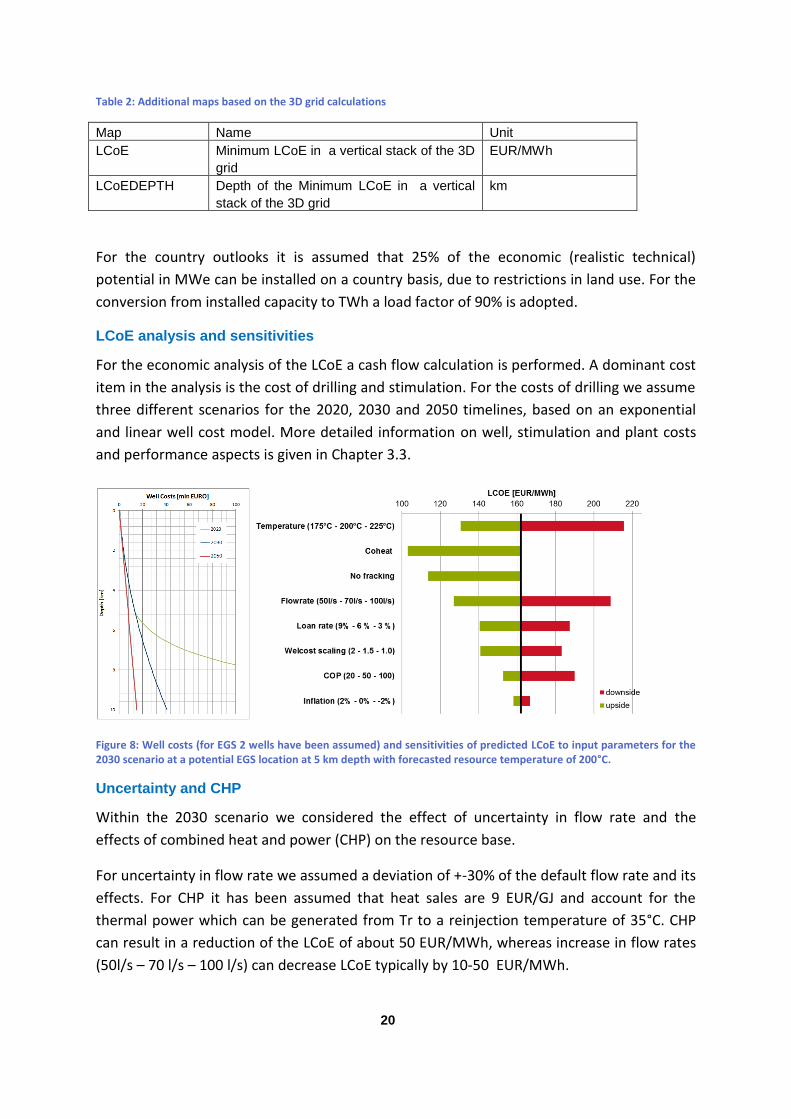
LCoE analysis and sensitivities
For the economic analysis of the LCoE a cash flow calculation is performed. A dominant cost
item in the analysis is the cost of drilling and stimulation. For the costs of drilling we assume
three different scenarios for the 2020, 2030 and 2050 timelines, based on an exponential
and linear well cost model. More detailed information on well, stimulation and plant costs
and performance aspects is given in Chapter 3.3.
Figure 8: Well costs (for EGS 2 wells have been assumed) and sensitivities of predicted LCoE to input parameters for the 2030 scenario at a potential EGS location at 5 km depth with forecasted resource temperature of 200°C.
Uncertainty and CHP
Within the 2030 scenario we considered the effect of uncertainty in flow rate and the
effects of combined heat and power (CHP) on the resource base.
For uncertainty in flow rate we assumed a deviation of +-30% of the default flow rate and its
effects. For CHP it has been assumed that heat sales are 9 EUR/GJ and account for the
thermal power which can be generated from Tr to a reinjection temperature of 35°C. CHP
can result in a reduction of the LCoE of about 50 EUR/MWh, whereas increase in flow rates
(50l/s – 70 l/s – 100 l/s) can decrease LCoE typically by 10-50 EUR/MWh.
21
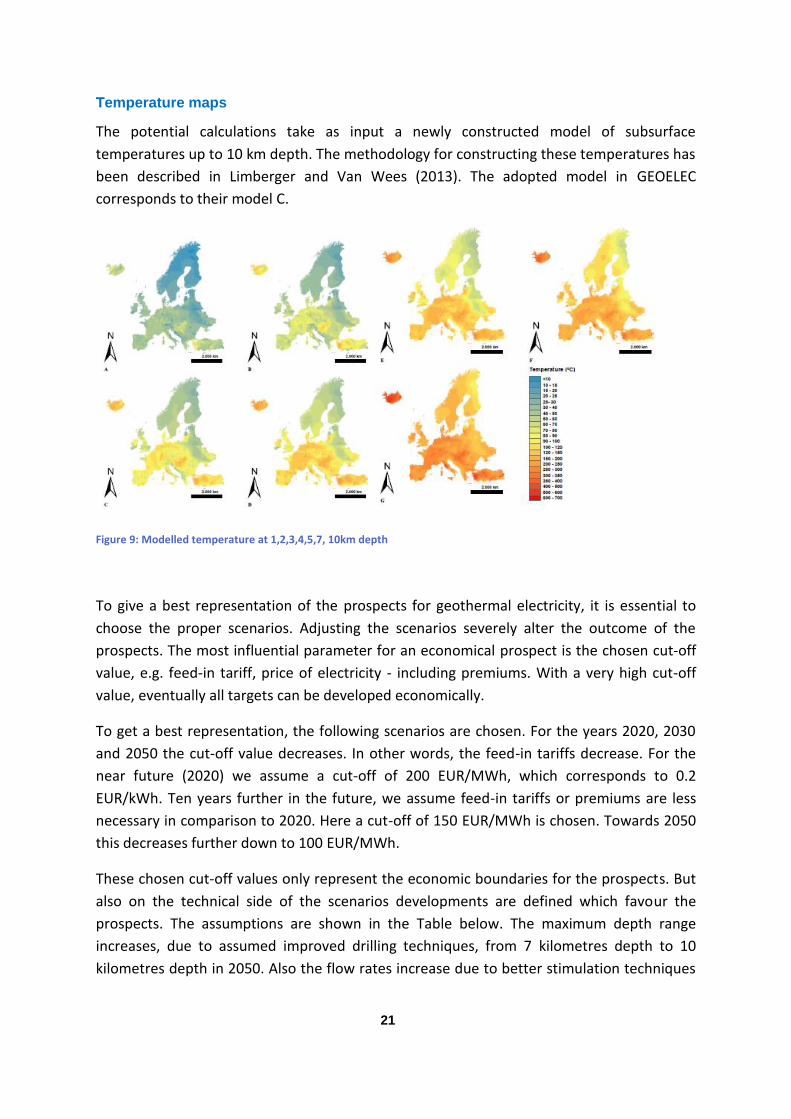
Temperature maps
The potential calculations take as input a newly constructed model of subsurface
temperatures up to 10 km depth. The methodology for constructing these temperatures has
been described in Limberger and Van Wees (2013). The adopted model in GEOELEC
corresponds to their model C.
Figure 9: Modelled temperature at 1,2,3,4,5,7, 10km depth
To give a best representation of the prospects for geothermal electricity, it is essential to
choose the proper scenarios. Adjusting the scenarios severely alter the outcome of the
prospects. The most influential parameter for an economical prospect is the chosen cut-off
value, e.g. feed-in tariff, price of electricity - including premiums. With a very high cut-off
value, eventually all targets can be developed economically.
To get a best representation, the following scenarios are chosen. For the years 2020, 2030
and 2050 the cut-off value decreases. In other words, the feed-in tariffs decrease. For the
near future (2020) we assume a cut-off of 200 EUR/MWh, which corresponds to 0.2
EUR/kWh. Ten years further in the future, we assume feed-in tariffs or premiums are less
necessary in comparison to 2020. Here a cut-off of 150 EUR/MWh is chosen. Towards 2050
this decreases further down to 100 EUR/MWh.
These chosen cut-off values only represent the economic boundaries for the prospects. But
also on the technical side of the scenarios developments are defined which favour the
prospects. The assumptions are shown in the Table below. The maximum depth range
increases, due to assumed improved drilling techniques, from 7 kilometres depth to 10
kilometres depth in 2050. Also the flow rates increase due to better stimulation techniques
22
from 50 L/s to 100 L/s in 2050. As the effect of stimulation increases in flow rate, the costs
for stimulation of a project remain the same: EUR 10 Mio. To reach the maximum drilling
depths, improvements in drilling techniques lead to a different, more beneficial well cost
model. Where the well cost model increases exponential with depth in 2020, it is assumed
to be less depth dependent in 2050, resulting in a more linear relation. The efficiency in
both the system and in conversion increases. The coefficient of performance increases from
30 in 2020 to 50 in 2030 and 1000 in 2050. The relative Carnot efficiency3 increases from
60% in the near future to 70% in 2050. In addition the use of heat to convert to electricity is
more efficient and the CHP outlet remains equal.
Table 3: Assumptions for the prospective study (COP = Coefficient of Performance | CHP = Combined Heat and Power)
Parameter Unit 2020 2030 2050
Maximum Depth km 7 7 10
Flow Rate L/s 50 70 100
COP - 30 50 1000
Well Cost Model - Wellcost Scaling 1.5 + Exponential
Wellcost Scaling 1.5 Linear 1500 EUR/m
Stimulation Costs EUR Mio.
10 10 10
Relative Carnot Efficiency - 0.6 0.6 0.7
Tinc for Tr (Tr=Tsurface + Tinc)
⁰C 80 80 50
CHP outlet ⁰C 35 35 35
The cut-off values, e.g. feed-in tariffs, may change per country and be adapted to national
circumstances and according to the maturity of the technology and/or the market.
Therefore more than one cut-off value is represented. Also Table 3.4 displaying a range of
cut-off values, stacking the gained potential with increasing cut-off values:
Table 4: Overview of cut-off values for the defined scenarios
SCENARIO Cut-off range Steps
2020 Less than 100 EUR/MWh to a maximum of 300 EUR/MWh
100 – 150 – 200 – 300
2030 & 2050 Less than 50 EUR/MWh to a maximum of 200 EUR/MWh
50 – 100 – 150 – 200
The cut-offs apply for power-only, and do not include CHP. Finally the economic geothermal
potential for electricity production is presented as maps of the LCoE and at which these cut-
off values can be reached. See below an overview of all available maps and scenarios:
3 A theoretical thermodynamic cycle proposed by Nicolas Léonard Sadi Carnot in 1823. It can be shown that it
is the most efficient cycle for converting a given amount of thermal energy into work. A relative carnot efficiency is a percentage compared to the carnot efficiency with around 150 °C
23
Table 5: Overview of available maps in the report (for all maps produced in this project, go to www.thermogis.nl/geoelec (TP = Technical Potential)
Scenario 2020 2030 2050
Maps LCoE LCoE LCoE
LCoEDEPTH LCoEDEPTH LCoEDEPTH
TP for cut-off lower than
300 EUR/MWh
TP for cut-off lower than
200 EUR/MWh
TP for cut-off lower than
150 EUR/MWh
TP for cut-off lower than
200 EUR/MWh
TP for cut-off lower than
100 EUR/MWh
TP for cut-off lower than
100 EUR/MWh
TP for cut-off lower than
100 EUR/MWh
TP for cut-off lower than
50 EUR/MWh
TP for cut-off lower than
50 EUR/MWh
REFERENCES
AGEA-AGEG, 2008. Australian Code for Reporting of Exploration Results, Geothermal
Resources and Geothermal Reserves, The Geothermal Reporting Code, 2008 Edition,
26 p.
AGEA-AGEG, 2010. Australian Code for Reporting of Exploration Results, Geothermal
Resources and Geothermal Reserves, The Geothermal Reporting Code, Second
Edition, 28 p.
CanGEA, 2010. The Canadian Geothermal Code for Public Reporting, Reporting of
Exploration Results, Geothermal Resources and Geothermal Reserves, 2010 Edition,
32 p.
IPCC, 2011. IPCC Special Report on Renewable Energy Sources and Climate Change
Mitigation – Geothermal Energy, Intergovernmental Panel on Climate Change (IPCC),
Working Group III – Mitigation of Climate Change, 50 p.
BIBLIOGRAPHY
Beardsmore, G.R., Rybach, L., Blackwell, D., and Baron, C., 2010. A protocol for
estimating and mapping the global EGS potential, July 2010 edition, 11 p.
Cloetingh, S., v. Wees, J.D., Ziegler, P.A., Lenkey, L., Beekman, F., Tesauro, M.,
Förster, A., Norden, B., Kaban, M., Hardebol, N., Bonté, D., Genter, A., Guillou-
Frottier, L. Voorde, M.T., Sokoutis,, D. Willingshofer, E., Cornu, T., and Worum, G.,
2010. Lithosphere tectonics and thermo-mechanical properties: An integrated
modelling approach for Enhanced Geothermal Systems exploration in Europe. Earth-
Science Reviews, vol. 102, p. 159-206.
Davies, J.H. and Davies, D.R., 2010. Earth’s surface heat flux. Solid Earth, 1, 5–24.
24
Etherington, J.R., and Ritter, J.E., 2007. The 2007 SPE/AAPG/WPC/SPEE Reserves and
Resources Classification, Definitions, and Guidelines: Defining the Standard!, 2007
SPE Hydrocarbon Economics and Evaluation Symposium, Dallas, Texas, USA, 1-3 April
2007. SPE 107693, 9 p.
Hurtig, E., Cermak, V., Haenel, R., and Zui, V.(eds.), 1992. Geothermal Atlas of
Europe, International Association for Seismology and Physics of the Earth's Interior,
International Heat Flow Commission, Central Institute for Physics of the Earth, Scale
1:2,500,000.
Williams, C.F., Reed, M.J., and Mariner, R.H., 2008. A Review of Methods Applied by
the U.S. Geological Survey in the Assesment of Identified Geothermal Resources, U.S.
Department of the Interior, U.S. Geological Survey, Open-File Report 2008-1296,
p.27
Williams, A.F., Lawless, J.V., Ward, M.A., Holgate, F.L., and Larking, A., 2010. A code
for geothermal resources and reserves reporting, Proceedings World Geothermal
Congress 2010, Bali, Indonesia, 25-29 April 2010, 7 p.
World Petroleum Council. Petroleum Resources Managment System, SPE-AAPG-
WPC-SPEE, p.47
25
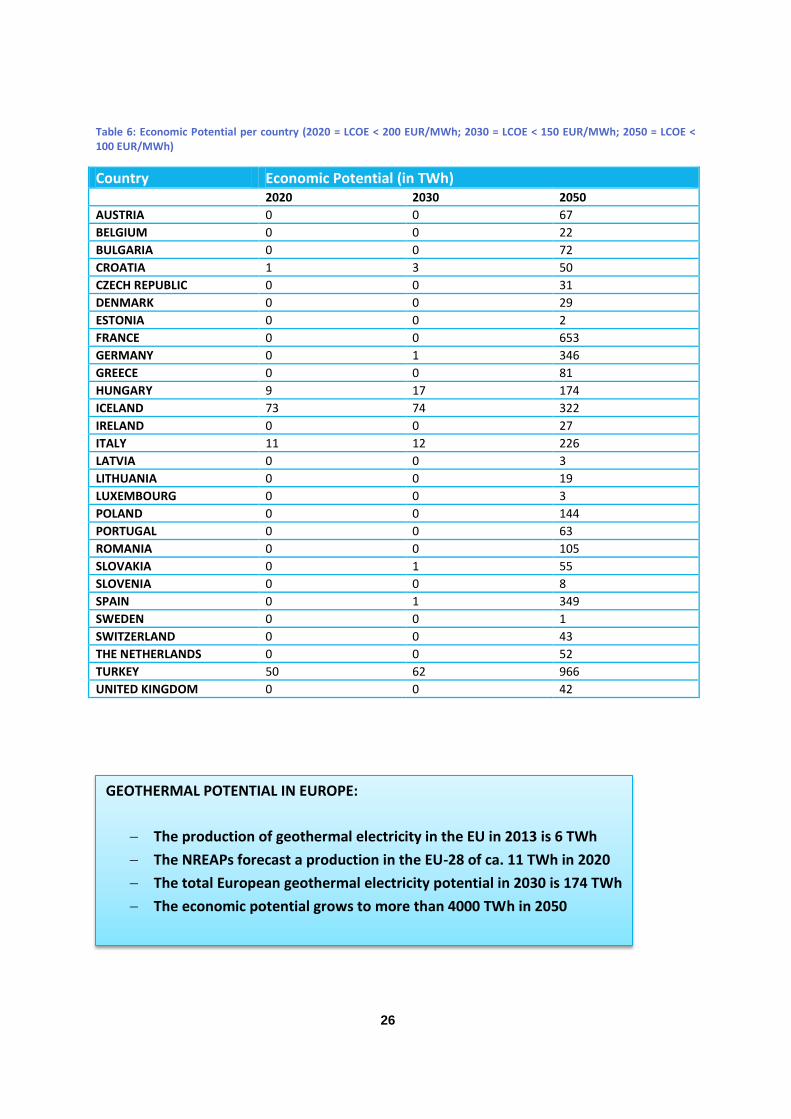
3. Overview of Geothermal electricity potential in Europe
At this point the scenarios are described and the maps of Europe presented. The question
which logically may arise is what that means per country. In this and in the following
sections we present the outlook per country. The table below shows the potential per
country in TWh for the 2020, 2030 and 2050 scenarios. This is the economic potential based
on the above mentioned assumptions and no application of co-heat (for the effects of the
application of co-heat, see next chapter). For the chosen scenarios we assume an LCoE of
less than 200 EUR/MWh for 2020, of less than 150 EUR/MWh for the 2030 scenario of less
than 100 EUR/MWh and for 2050.
As the current and projected financial support may differ per country, below the economic
geothermal potential is presented in stacked potential of all assessed cut-off values. The
ranges are shown in Table 3.6. A very low cut-off value results in a minimal economic
potential, whereas very high cut-off values make more geothermal resources within
economic reach.
In the previous chapter you can find a sensitivity diagram showing the effects of different
variables on the LCoE. The majority of the parameters have both a positive and negative
effect; e.g. the required temperature can be both lower and higher. A higher required
temperature means a well at greater depths, hence higher drilling costs resulting in a higher
LCoE. Two elements can indisputably lower the LCoE: when no stimulation is needed or
when co-heat is applied.
The application of co-heat involves a cascading system of first electricity generation using
the high temperature geothermal source, followed by the use of lower temperature residual
heat for the use of direct heat (spatial heating, greenhouses, etc.).
The sensitivity diagram shows in a best case scenario a lowering of the LCoE by EUR 50. In
the diagram the LCoE drops from 160 EUR/MWh to approximately 110 EUR/MWh. This
same principal can be applied to the country outlooks and the maps. Assuming a co-heat
scenario may increase the potential in each country from the < 150 EUR/MWh scenario to a
< 100 EUR/MWh scenario.
26
Table 6: Economic Potential per country (2020 = LCOE < 200 EUR/MWh; 2030 = LCOE < 150 EUR/MWh; 2050 = LCOE < 100 EUR/MWh)
Country Economic Potential (in TWh) 2020 2030 2050
AUSTRIA 0 0 67
BELGIUM 0 0 22
BULGARIA 0 0 72
CROATIA 1 3 50
CZECH REPUBLIC 0 0 31
DENMARK 0 0 29
ESTONIA 0 0 2
FRANCE 0 0 653
GERMANY 0 1 346
GREECE 0 0 81
HUNGARY 9 17 174
ICELAND 73 74 322
IRELAND 0 0 27
ITALY 11 12 226
LATVIA 0 0 3
LITHUANIA 0 0 19
LUXEMBOURG 0 0 3
POLAND 0 0 144
PORTUGAL 0 0 63
ROMANIA 0 0 105
SLOVAKIA 0 1 55
SLOVENIA 0 0 8
SPAIN 0 1 349
SWEDEN 0 0 1
SWITZERLAND 0 0 43
THE NETHERLANDS 0 0 52
TURKEY 50 62 966
UNITED KINGDOM 0 0 42
GEOTHERMAL POTENTIAL IN EUROPE:
The production of geothermal electricity in the EU in 2013 is 6 TWh
The NREAPs forecast a production in the EU-28 of ca. 11 TWh in 2020
The total European geothermal electricity potential in 2030 is 174 TWh
The economic potential grows to more than 4000 TWh in 2050
27
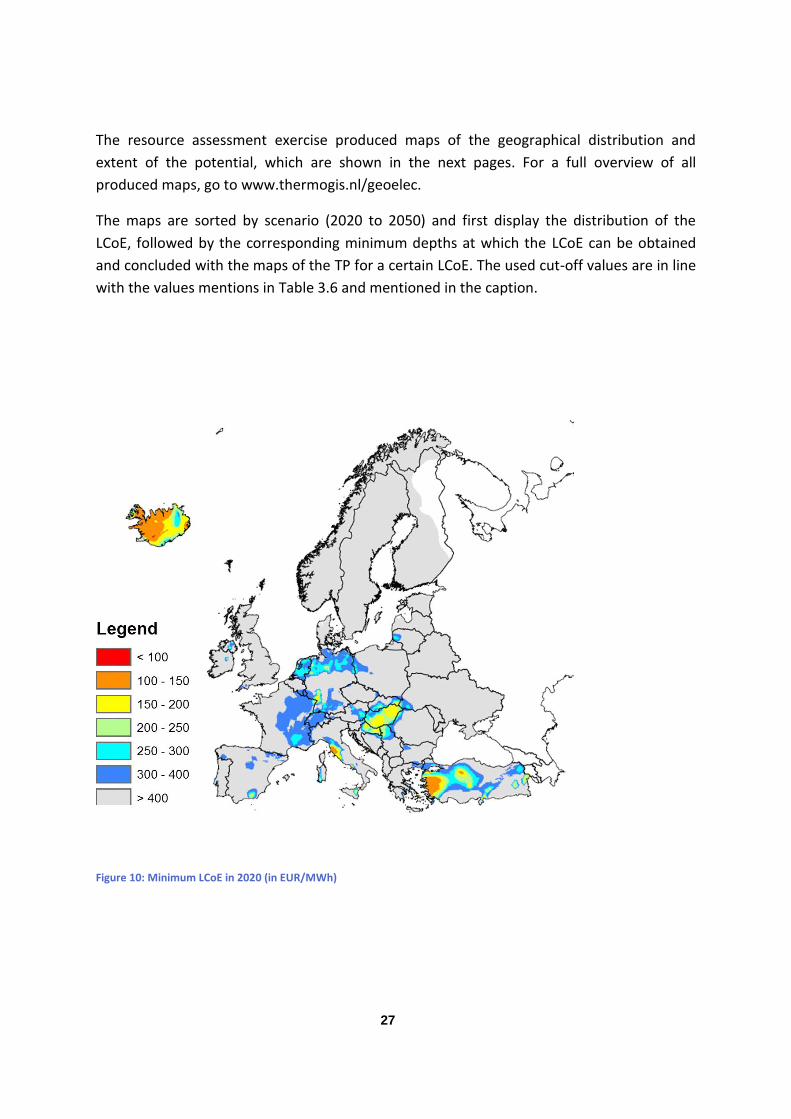
The resource assessment exercise produced maps of the geographical distribution and
extent of the potential, which are shown in the next pages. For a full overview of all
produced maps, go to www.thermogis.nl/geoelec.
The maps are sorted by scenario (2020 to 2050) and first display the distribution of the
LCoE, followed by the corresponding minimum depths at which the LCoE can be obtained
and concluded with the maps of the TP for a certain LCoE. The used cut-off values are in line
with the values mentions in Table 3.6 and mentioned in the caption.
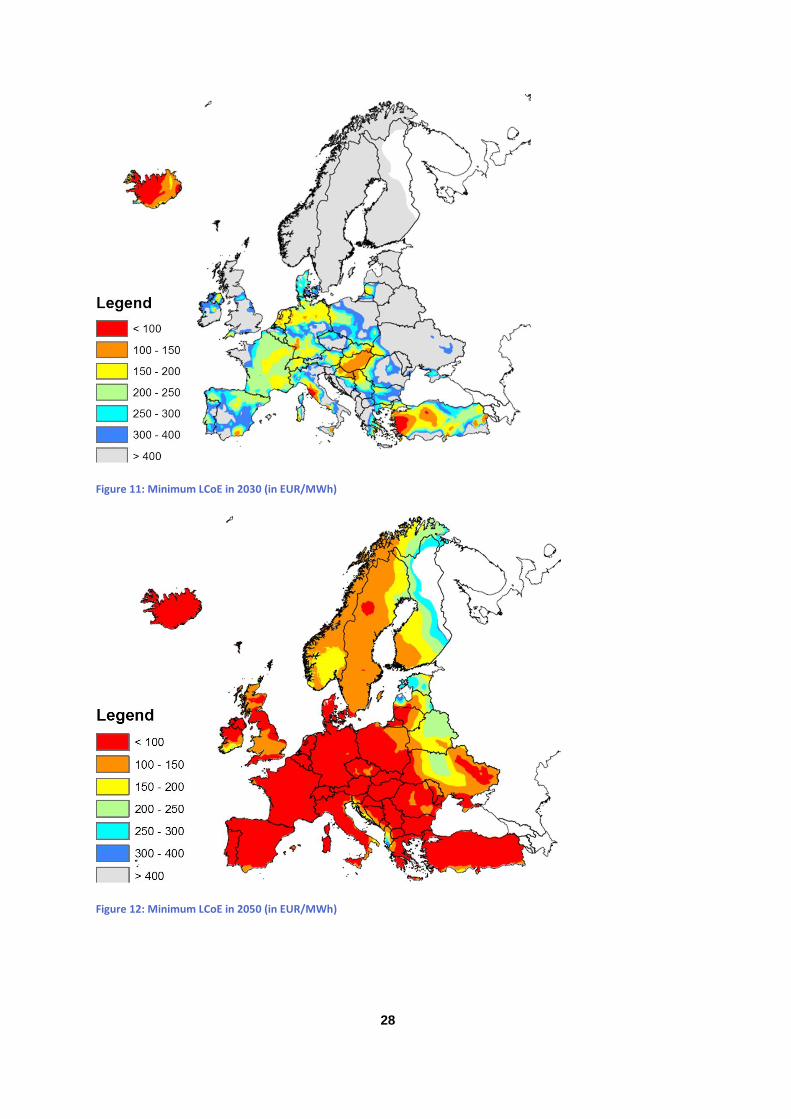
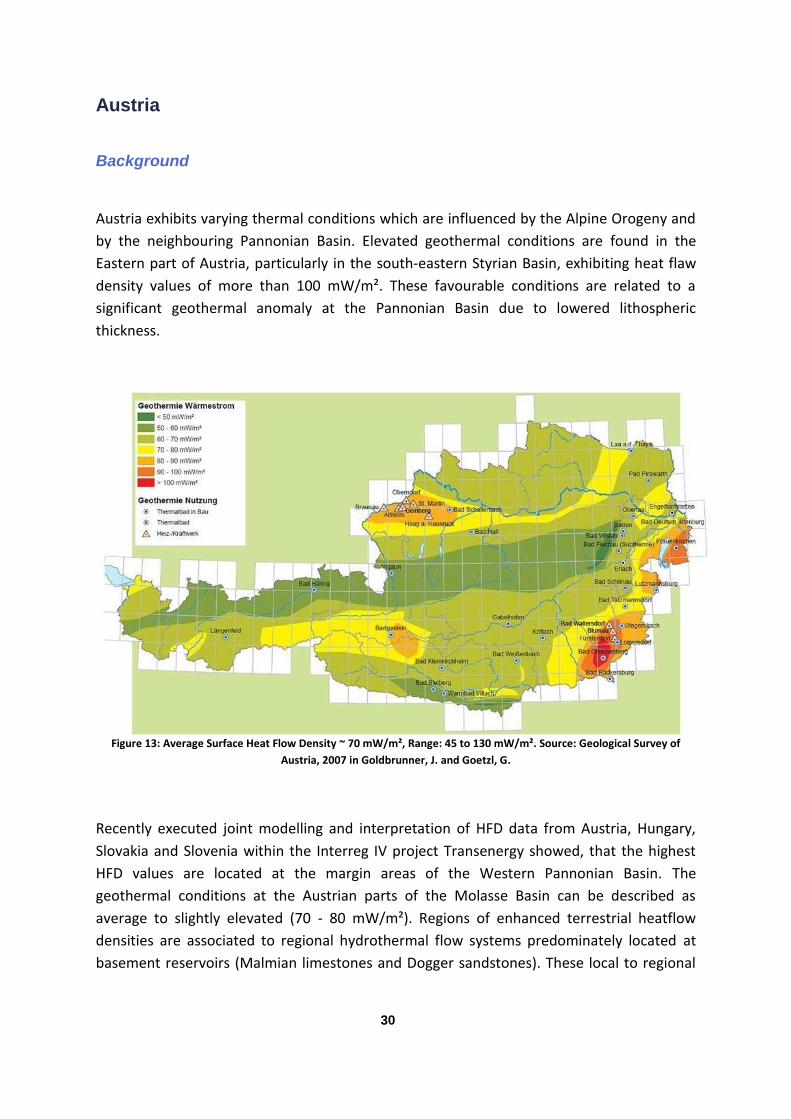
Figure 10: Minimum LCoE in 2020 (in EUR/MWh)
28
Figure 11: Minimum LCoE in 2030 (in EUR/MWh)
Figure 12: Minimum LCoE in 2050 (in EUR/MWh)

29
Country Outlook
30
Austria
Background
Austria exhibits varying thermal conditions which are influenced by the Alpine Orogeny and
by the neighbouring Pannonian Basin. Elevated geothermal conditions are found in the
Eastern part of Austria, particularly in the south-eastern Styrian Basin, exhibiting heat flaw
density values of more than 100 mW/m². These favourable conditions are related to a
significant geothermal anomaly at the Pannonian Basin due to lowered lithospheric
thickness.
Figure 13: Average Surface Heat Flow Density ~ 70 mW/m², Range: 45 to 130 mW/m². Source: Geological Survey of
Austria, 2007 in Goldbrunner, J. and Goetzl, G.
Recently executed joint modelling and interpretation of HFD data from Austria, Hungary,
Slovakia and Slovenia within the Interreg IV project Transenergy showed, that the highest
HFD values are located at the margin areas of the Western Pannonian Basin. The
geothermal conditions at the Austrian parts of the Molasse Basin can be described as
average to slightly elevated (70 - 80 mW/m²). Regions of enhanced terrestrial heatflow
densities are associated to regional hydrothermal flow systems predominately located at
basement reservoirs (Malmian limestones and Dogger sandstones). These local to regional
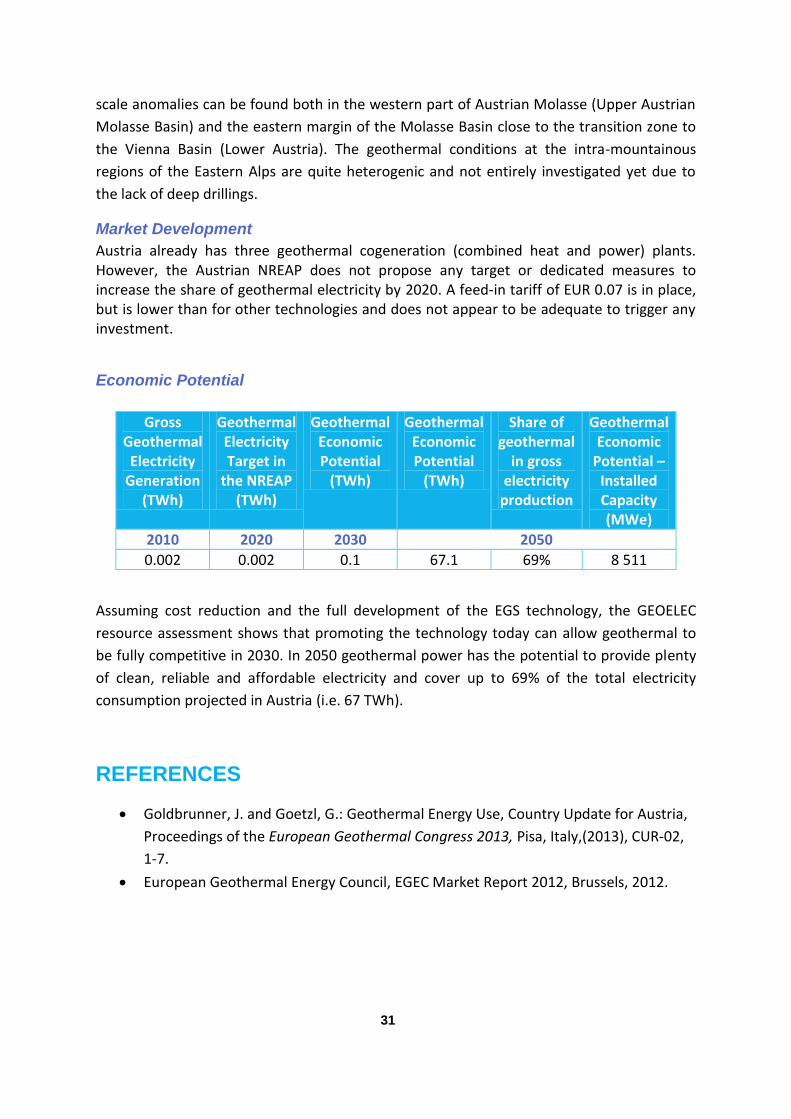
31
scale anomalies can be found both in the western part of Austrian Molasse (Upper Austrian
Molasse Basin) and the eastern margin of the Molasse Basin close to the transition zone to
the Vienna Basin (Lower Austria). The geothermal conditions at the intra-mountainous
regions of the Eastern Alps are quite heterogenic and not entirely investigated yet due to
the lack of deep drillings.
Market Development
Austria already has three geothermal cogeneration (combined heat and power) plants. However, the Austrian NREAP does not propose any target or dedicated measures to increase the share of geothermal electricity by 2020. A feed-in tariff of EUR 0.07 is in place, but is lower than for other technologies and does not appear to be adequate to trigger any investment.
Economic Potential
Gross Geothermal Electricity
Generation (TWh)
Geothermal Electricity Target in
the NREAP (TWh)
Geothermal Economic Potential
(TWh)
Geothermal Economic Potential
(TWh)
Share of geothermal
in gross electricity
production
Geothermal Economic
Potential – Installed Capacity (MWe)
2010 2020 2030 2050
0.002 0.002 0.1 67.1 69% 8 511
Assuming cost reduction and the full development of the EGS technology, the GEOELEC
resource assessment shows that promoting the technology today can allow geothermal to
be fully competitive in 2030. In 2050 geothermal power has the potential to provide plenty
of clean, reliable and affordable electricity and cover up to 69% of the total electricity
consumption projected in Austria (i.e. 67 TWh).
REFERENCES
Goldbrunner, J. and Goetzl, G.: Geothermal Energy Use, Country Update for Austria,
Proceedings of the European Geothermal Congress 2013, Pisa, Italy,(2013), CUR-02,
1-7.
European Geothermal Energy Council, EGEC Market Report 2012, Brussels, 2012.
32
Belgium
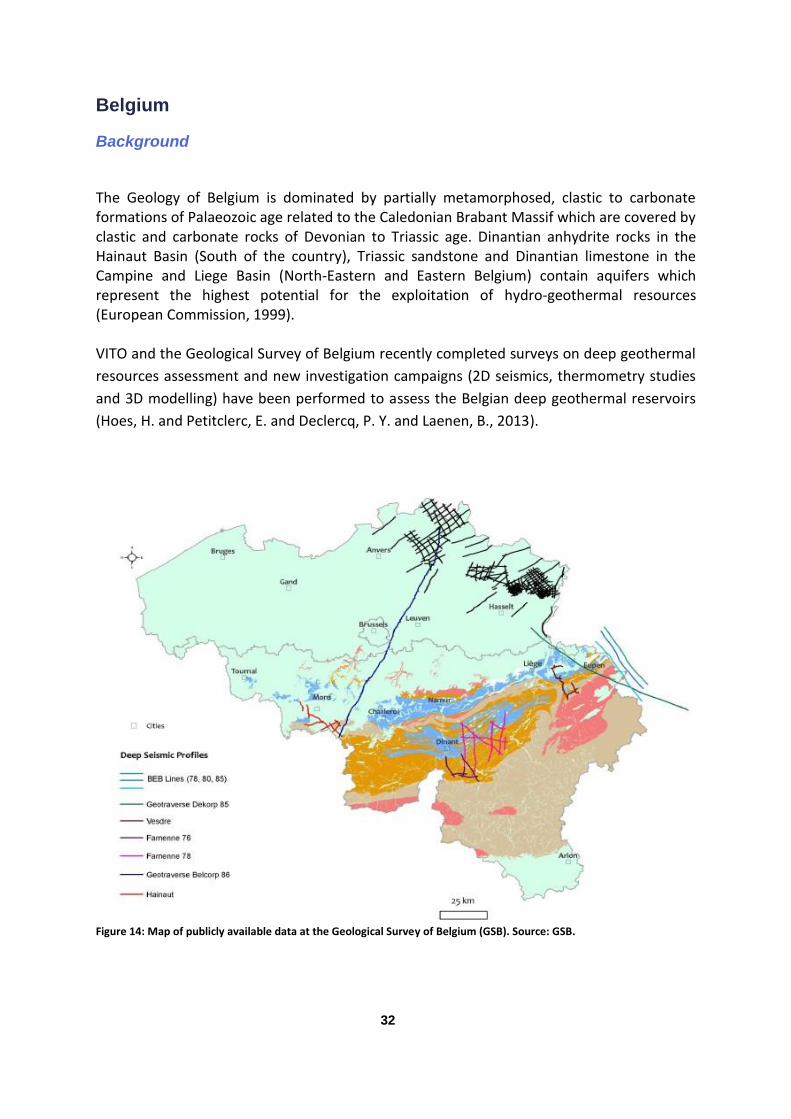
Background
The Geology of Belgium is dominated by partially metamorphosed, clastic to carbonate formations of Palaeozoic age related to the Caledonian Brabant Massif which are covered by clastic and carbonate rocks of Devonian to Triassic age. Dinantian anhydrite rocks in the Hainaut Basin (South of the country), Triassic sandstone and Dinantian limestone in the Campine and Liege Basin (North-Eastern and Eastern Belgium) contain aquifers which represent the highest potential for the exploitation of hydro-geothermal resources (European Commission, 1999). VITO and the Geological Survey of Belgium recently completed surveys on deep geothermal
resources assessment and new investigation campaigns (2D seismics, thermometry studies
and 3D modelling) have been performed to assess the Belgian deep geothermal reservoirs
(Hoes, H. and Petitclerc, E. and Declercq, P. Y. and Laenen, B., 2013).
Figure 14: Map of publicly available data at the Geological Survey of Belgium (GSB). Source: GSB.
33
Market Development
There is no geothermal power plant in Belgium. However, the recent investigations on deep
geothermal potential have resulted in two projects currently under development in Balmatt
(Flanders) and in the Mons basin (Wallonia).
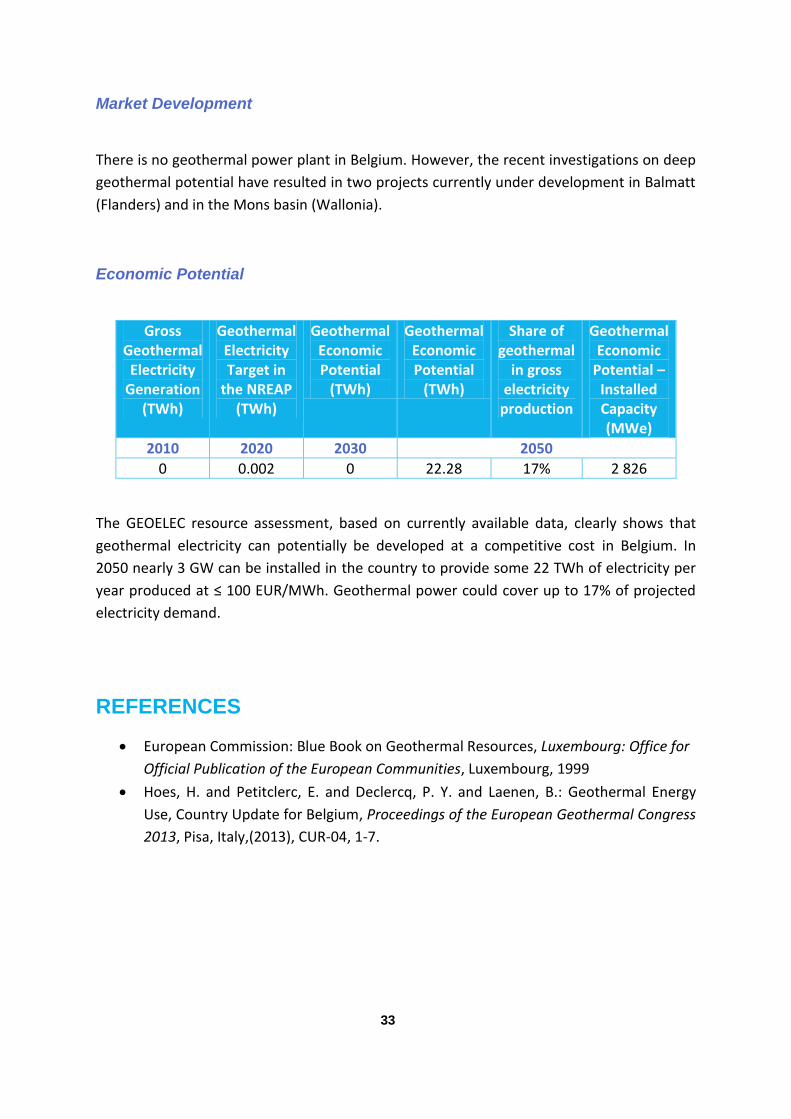
Economic Potential
Gross Geothermal Electricity
Generation (TWh)
Geothermal Electricity Target in
the NREAP (TWh)
Geothermal Economic Potential
(TWh)
Geothermal Economic Potential
(TWh)
Share of geothermal
in gross electricity
production
Geothermal Economic
Potential – Installed Capacity (MWe)
2010 2020 2030 2050
0 0.002 0 22.28 17% 2 826
The GEOELEC resource assessment, based on currently available data, clearly shows that
geothermal electricity can potentially be developed at a competitive cost in Belgium. In
2050 nearly 3 GW can be installed in the country to provide some 22 TWh of electricity per
year produced at ≤ 100 EUR/MWh. Geothermal power could cover up to 17% of projected
electricity demand.
REFERENCES
European Commission: Blue Book on Geothermal Resources, Luxembourg: Office for
Official Publication of the European Communities, Luxembourg, 1999
Hoes, H. and Petitclerc, E. and Declercq, P. Y. and Laenen, B.: Geothermal Energy
Use, Country Update for Belgium, Proceedings of the European Geothermal Congress
2013, Pisa, Italy,(2013), CUR-04, 1-7.
34
Bulgaria
Background
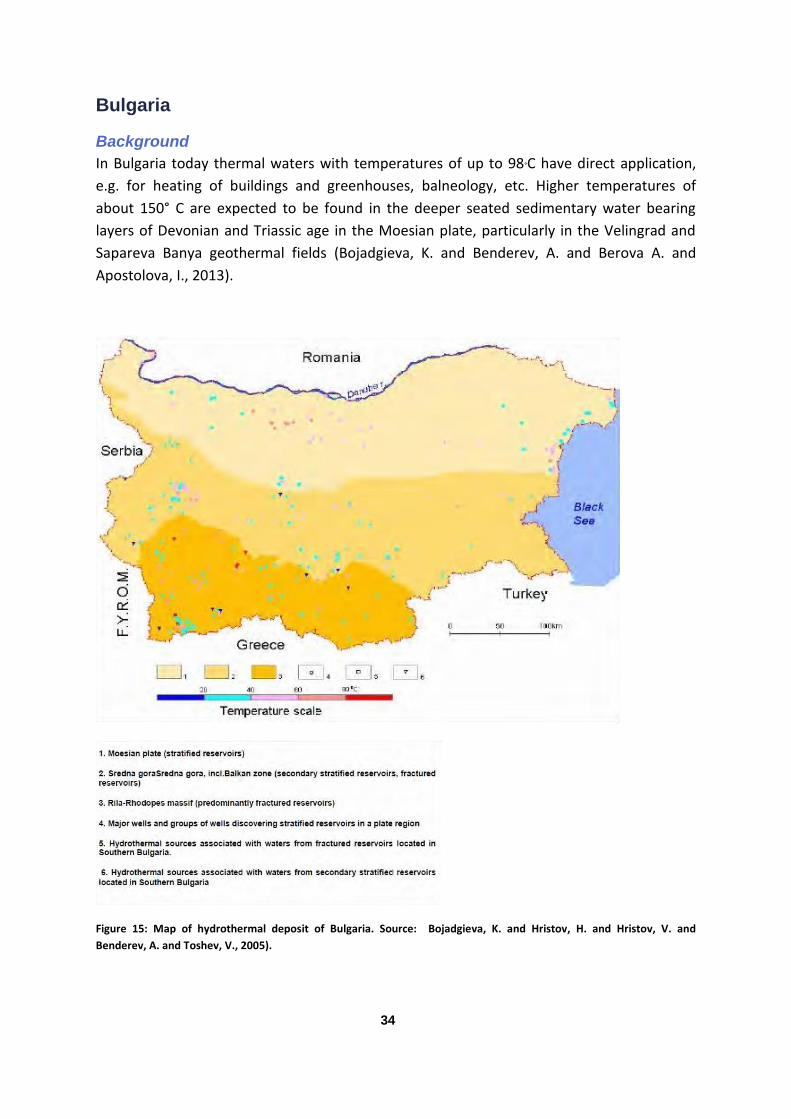
In Bulgaria today thermal waters with temperatures of up to 98°C have direct application,
e.g. for heating of buildings and greenhouses, balneology, etc. Higher temperatures of
about 150° C are expected to be found in the deeper seated sedimentary water bearing
layers of Devonian and Triassic age in the Moesian plate, particularly in the Velingrad and
Sapareva Banya geothermal fields (Bojadgieva, K. and Benderev, A. and Berova A. and
Apostolova, I., 2013).
Figure 15: Map of hydrothermal deposit of Bulgaria. Source: Bojadgieva, K. and Hristov, H. and Hristov, V. and
Benderev, A. and Toshev, V., 2005).
35
Market Development
No electricity is produced from geothermal resources in Bulgaria. This is due to a lack of
data from drilling activities and to the relatively low temperature of geothermal waters
discovered.
Bulgaria did not propose any target for geothermal electricity in its NREAP; although a feed-
in tariff exists, this is not applicable in practice. Indeed the climate for developing
geothermal and other renewable energy sources is not favourable. In 2012 the State Energy
and Water Regulatory Commission implemented retroactive measures for producers of
electricity from renewable sources, which will significantly hamper any further
development. The grid connection of projects with preliminary contracts was postponed
until 2016, while a moratorium on new projects was adopted.
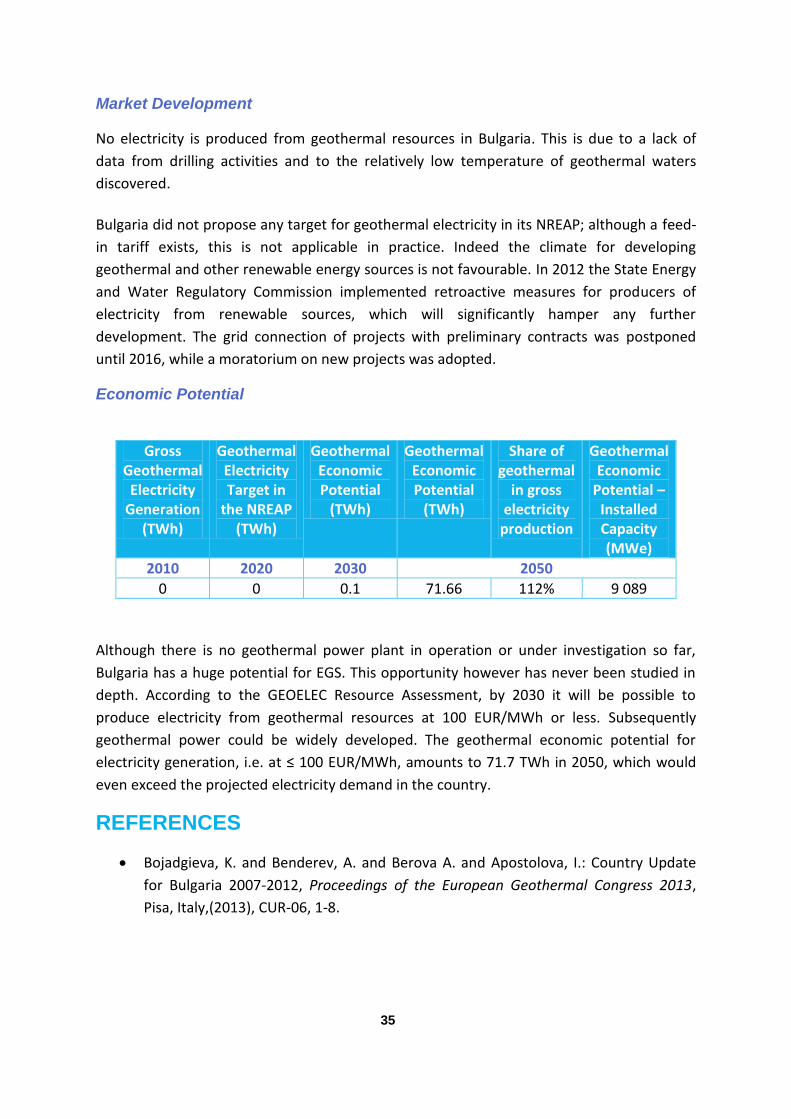
Economic Potential
Gross Geothermal Electricity
Generation (TWh)
Geothermal Electricity Target in
the NREAP (TWh)
Geothermal Economic Potential
(TWh)
Geothermal Economic Potential
(TWh)
Share of geothermal
in gross electricity
production
Geothermal Economic
Potential – Installed Capacity (MWe)
2010 2020 2030 2050
0 0 0.1 71.66 112% 9 089
Although there is no geothermal power plant in operation or under investigation so far,
Bulgaria has a huge potential for EGS. This opportunity however has never been studied in
depth. According to the GEOELEC Resource Assessment, by 2030 it will be possible to
produce electricity from geothermal resources at 100 EUR/MWh or less. Subsequently
geothermal power could be widely developed. The geothermal economic potential for
electricity generation, i.e. at ≤ 100 EUR/MWh, amounts to 71.7 TWh in 2050, which would
even exceed the projected electricity demand in the country.
REFERENCES
Bojadgieva, K. and Benderev, A. and Berova A. and Apostolova, I.: Country Update
for Bulgaria 2007-2012, Proceedings of the European Geothermal Congress 2013,
Pisa, Italy,(2013), CUR-06, 1-8.
36
Croatia
Background
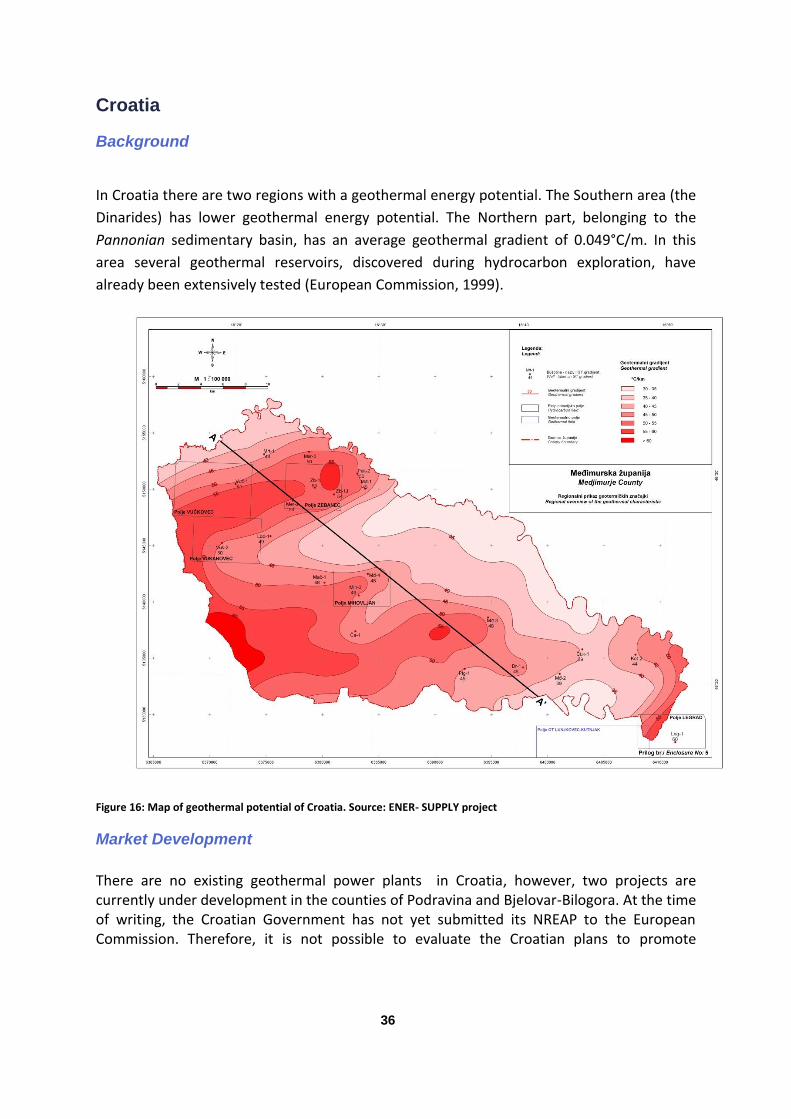
In Croatia there are two regions with a geothermal energy potential. The Southern area (the
Dinarides) has lower geothermal energy potential. The Northern part, belonging to the
Pannonian sedimentary basin, has an average geothermal gradient of 0.049°C/m. In this
area several geothermal reservoirs, discovered during hydrocarbon exploration, have
already been extensively tested (European Commission, 1999).
Figure 16: Map of geothermal potential of Croatia. Source: ENER- SUPPLY project
Market Development
There are no existing geothermal power plants in Croatia, however, two projects are currently under development in the counties of Podravina and Bjelovar-Bilogora. At the time of writing, the Croatian Government has not yet submitted its NREAP to the European Commission. Therefore, it is not possible to evaluate the Croatian plans to promote
37
geothermal power in order to achieve their 20% national target for renewable energy by 2020. Nevertheless, a relatively stable feed-in tariff, amounting to HRK 1.20 (approx. €ct15.9 per
kWh) is in force. Additionally, all plant operators are eligible for a bonus of up to an extra
15% on top of the tariff, based on the plant’s contribution to the local economy and quality
of life.
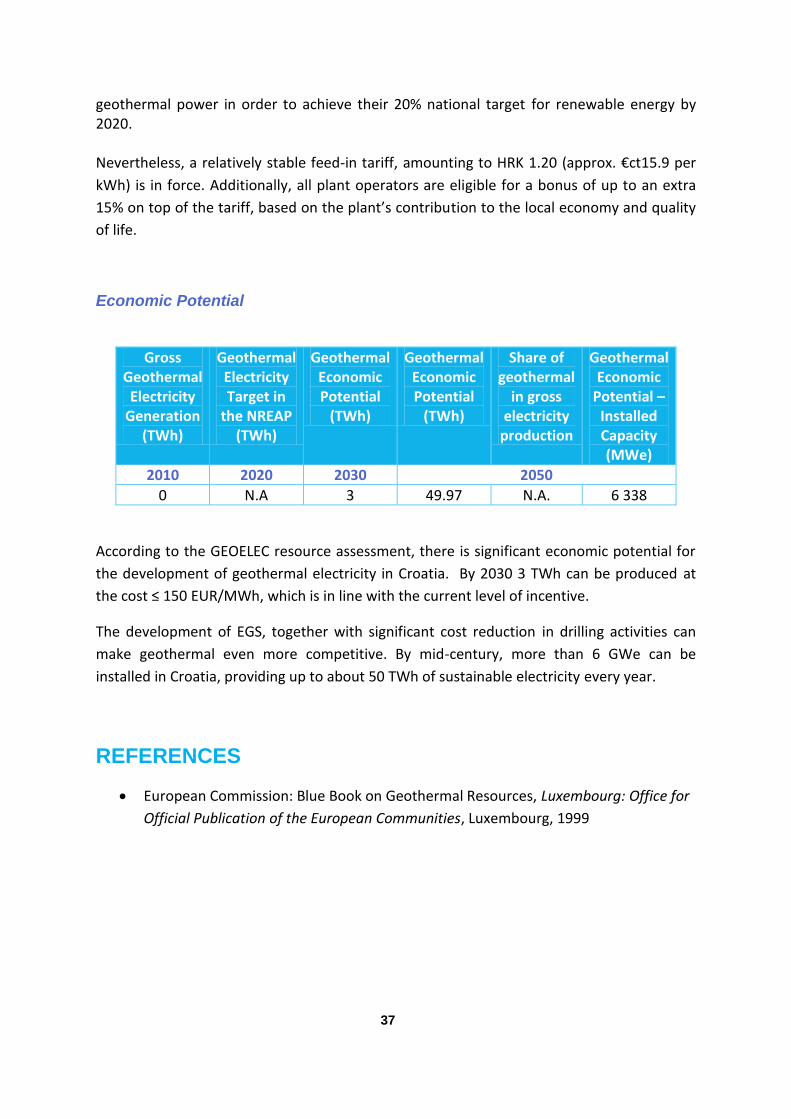
Economic Potential
Gross Geothermal Electricity
Generation (TWh)
Geothermal Electricity Target in
the NREAP (TWh)
Geothermal Economic Potential
(TWh)
Geothermal Economic Potential
(TWh)
Share of geothermal
in gross electricity
production
Geothermal Economic
Potential – Installed Capacity (MWe)
2010 2020 2030 2050
0 N.A 3 49.97 N.A. 6 338
According to the GEOELEC resource assessment, there is significant economic potential for
the development of geothermal electricity in Croatia. By 2030 3 TWh can be produced at
the cost ≤ 150 EUR/MWh, which is in line with the current level of incentive.
The development of EGS, together with significant cost reduction in drilling activities can
make geothermal even more competitive. By mid-century, more than 6 GWe can be
installed in Croatia, providing up to about 50 TWh of sustainable electricity every year.
REFERENCES
European Commission: Blue Book on Geothermal Resources, Luxembourg: Office for
Official Publication of the European Communities, Luxembourg, 1999
38
Czech Republic
Background
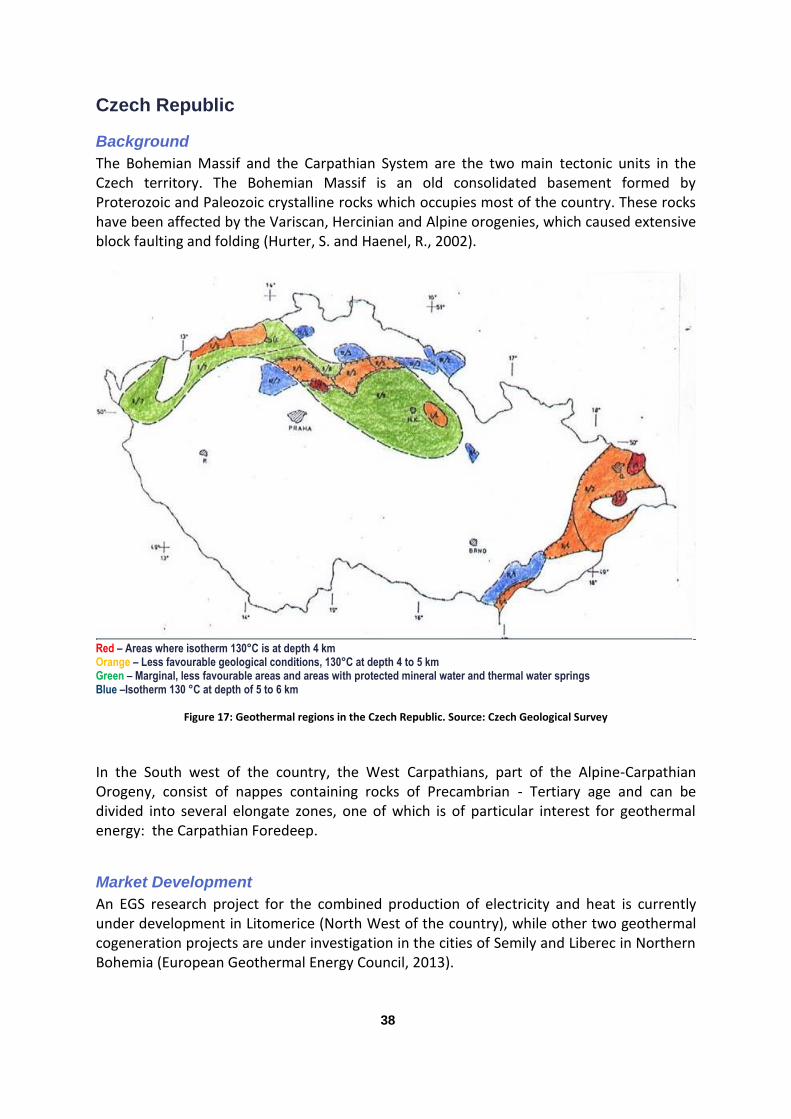
The Bohemian Massif and the Carpathian System are the two main tectonic units in the Czech territory. The Bohemian Massif is an old consolidated basement formed by Proterozoic and Paleozoic crystalline rocks which occupies most of the country. These rocks have been affected by the Variscan, Hercinian and Alpine orogenies, which caused extensive block faulting and folding (Hurter, S. and Haenel, R., 2002).
Red – Areas where isotherm 130°C is at depth 4 km Orange – Less favourable geological conditions, 130°C at depth 4 to 5 km Green – Marginal, less favourable areas and areas with protected mineral water and thermal water springs Blue –Isotherm 130 °C at depth of 5 to 6 km
Figure 17: Geothermal regions in the Czech Republic. Source: Czech Geological Survey
In the South west of the country, the West Carpathians, part of the Alpine-Carpathian Orogeny, consist of nappes containing rocks of Precambrian - Tertiary age and can be divided into several elongate zones, one of which is of particular interest for geothermal energy: the Carpathian Foredeep.
Market Development
An EGS research project for the combined production of electricity and heat is currently under development in Litomerice (North West of the country), while other two geothermal cogeneration projects are under investigation in the cities of Semily and Liberec in Northern Bohemia (European Geothermal Energy Council, 2013).
39
The Czech NREAP only takes into account the project under development in Litomerice, for which an installed capacity of 4.4 MWe and a production of only 18,4 GWh (availability: 4181
h/y) is assumed. Such a low level of electricity generation, however, does not however correspond to the reality of a geothermal power plant which is base load as it usually runs some 8700 hours a year.
In terms of incentive schemes, a hybrid feed-in tariff / feed-in premium system is in place guaranteeing CZK 4.50 per kWh (approx.€ct 18 per kWh) or a bonus of CZK 3.45 per kWh (approx. €ct 14 per kWh) on top of the electricity price. This scheme is likely to trigger the development of other projects.
Economic Potential
Gross Geothermal Electricity
Generation (TWh)
Geothermal Electricity Target in
the NREAP (TWh)
Geothermal Economic Potential
(TWh)
Geothermal Economic Potential
(TWh)
Share of geothermal
in gross electricity
production
Geothermal Economic
Potential – Installed Capacity (MWe)
2010 2020 2030 2050
0 0.002 0.04 30.68 26% 3 891
The Czech Republic has the potential to develop low temperature power and EGS plants. The
GEOELEC Resource Assessment shows the economic potential of geothermal power in the
country: by 2030 it will be possible to produce 40 GWh at ≤150 EUR/MWh, while nearly 4
GWe could be installed by mid-century, producing some 31 TWh and covering ¼ of the
projected electricity production.
In order to achieve that, other measures should also be adopted, such as a clear geothermal
regulatory framework, ensure security of rights for the licensee, and a risk insurance
scheme to reduce the cost to manage the geological risk.
REFERENCES
Hurter, S. and Haenel, R. (ed.), Atlas of Geothermal Resources in Europe, Office for
Official Publications of the European Communities, Luxembourg, (2002)
European Geothermal Energy Council, EGEC Market Report 2013/14, Brussels, 2013
40
Denmark
Background
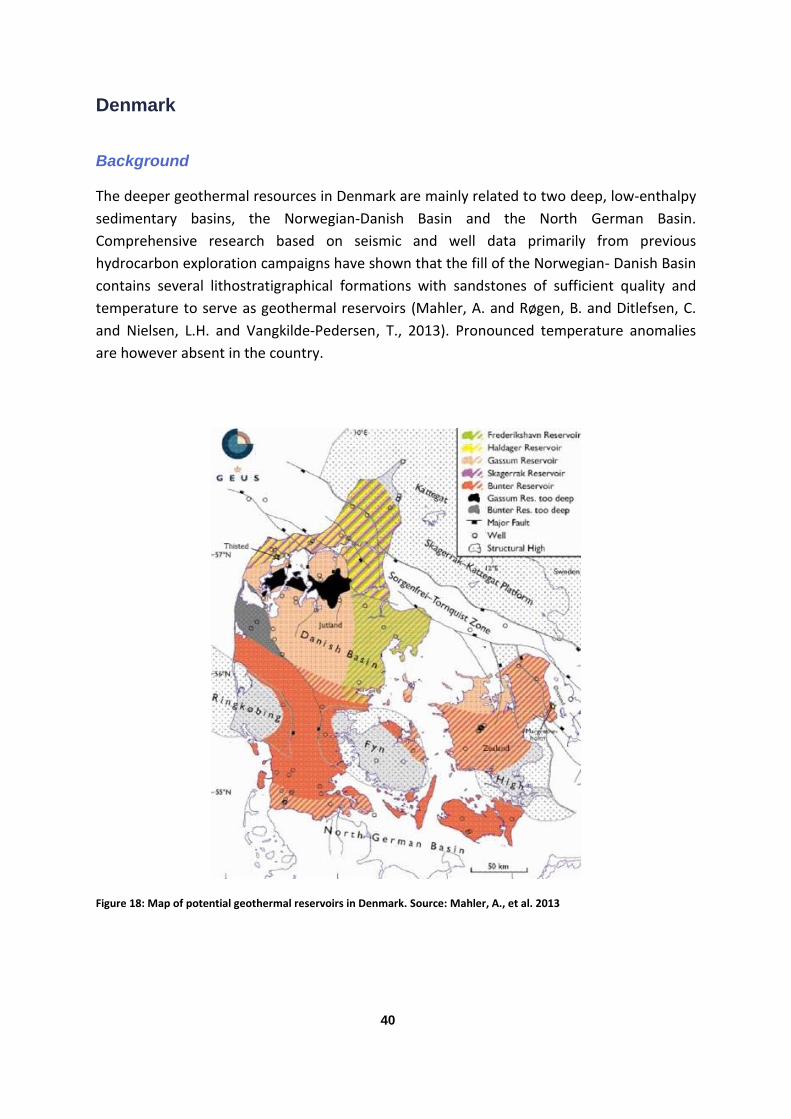
The deeper geothermal resources in Denmark are mainly related to two deep, low-enthalpy
sedimentary basins, the Norwegian-Danish Basin and the North German Basin.
Comprehensive research based on seismic and well data primarily from previous
hydrocarbon exploration campaigns have shown that the fill of the Norwegian- Danish Basin
contains several lithostratigraphical formations with sandstones of sufficient quality and
temperature to serve as geothermal reservoirs (Mahler, A. and Røgen, B. and Ditlefsen, C.
and Nielsen, L.H. and Vangkilde‐Pedersen, T., 2013). Pronounced temperature anomalies
are however absent in the country.
Figure 18: Map of potential geothermal reservoirs in Denmark. Source: Mahler, A., et al. 2013
41
Market Development
Denmark presents moderate temperature gradients, but widespread geothermal aquifers
around many towns that can be developed primarily for covering heat demand through
district heating networks. Three geothermal heat plants are already in operation using
absorption heat pumps, while 12 other plants are under investigation.
The Danish legal framework is in place and there is an increasing interest in geothermal
energy among district heating companies and municipalities. Geothermal plants receive no
funding, but high taxes on fuels and the focusing on CO2 makes it attractive to substitute the
burning of fossil fuels in CHP plants with wind turbine power and geothermal heat.
Economic Potential
Gross Geothermal Electricity
Generation (TWh)
Geothermal Electricity Target in
the NREAP (TWh)
Geothermal Economic Potential
(TWh)
Geothermal Economic Potential
(TWh)
Share of geothermal
in gross electricity
production
Geothermal Economic
Potential – Installed Capacity (MWe)
2010 2020 2030 2050
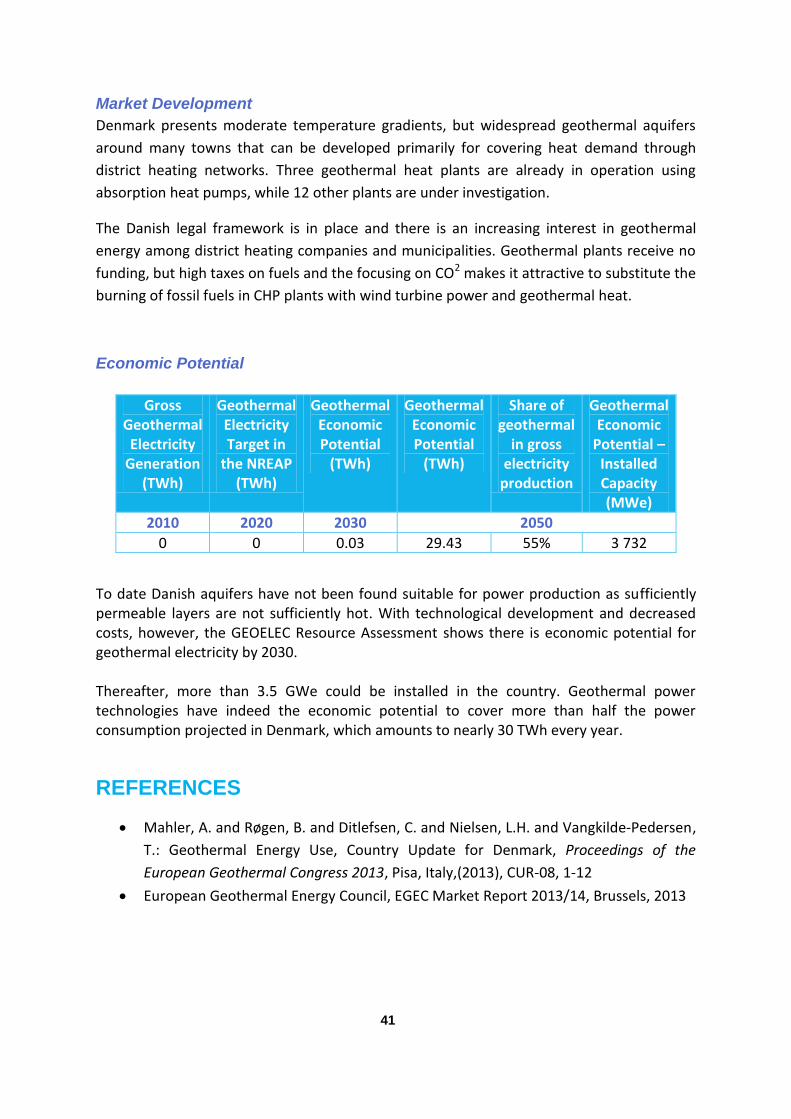
0 0 0.03 29.43 55% 3 732
To date Danish aquifers have not been found suitable for power production as sufficiently permeable layers are not sufficiently hot. With technological development and decreased costs, however, the GEOELEC Resource Assessment shows there is economic potential for geothermal electricity by 2030. Thereafter, more than 3.5 GWe could be installed in the country. Geothermal power technologies have indeed the economic potential to cover more than half the power consumption projected in Denmark, which amounts to nearly 30 TWh every year.
REFERENCES
Mahler, A. and Røgen, B. and Ditlefsen, C. and Nielsen, L.H. and Vangkilde‐Pedersen,
T.: Geothermal Energy Use, Country Update for Denmark, Proceedings of the
European Geothermal Congress 2013, Pisa, Italy,(2013), CUR-08, 1-12
European Geothermal Energy Council, EGEC Market Report 2013/14, Brussels, 2013
42
Estonia
Background
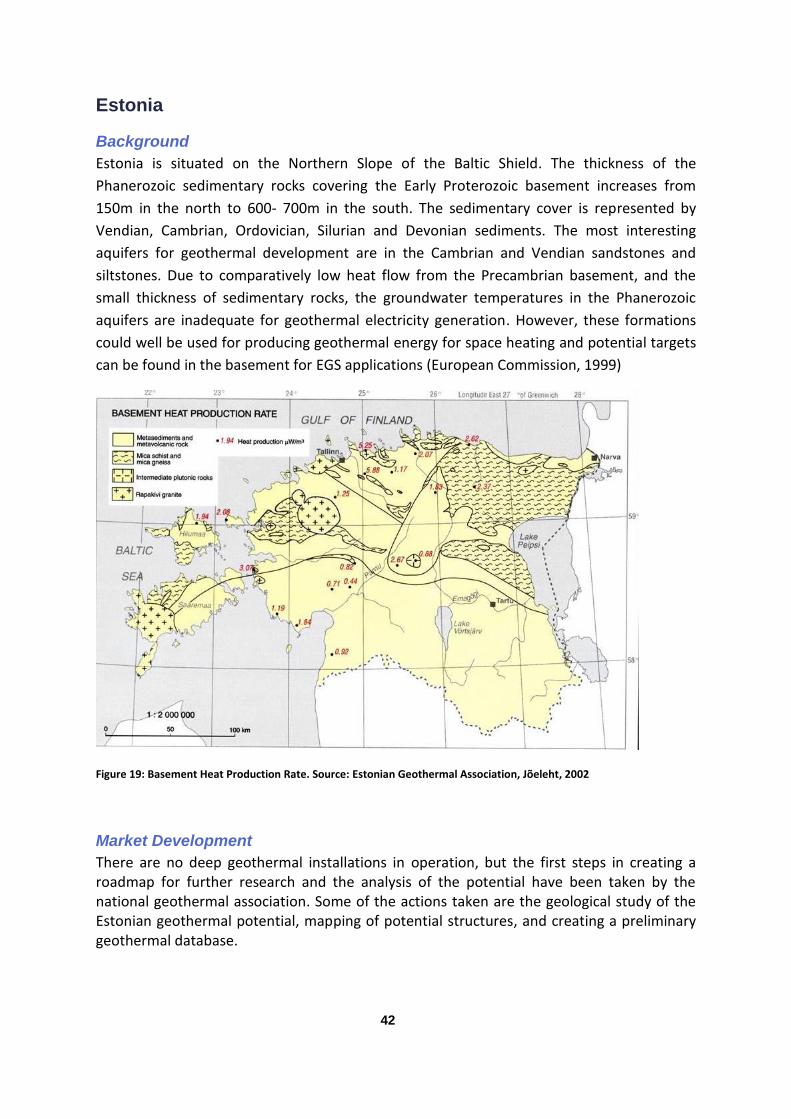
Estonia is situated on the Northern Slope of the Baltic Shield. The thickness of the
Phanerozoic sedimentary rocks covering the Early Proterozoic basement increases from
150m in the north to 600- 700m in the south. The sedimentary cover is represented by
Vendian, Cambrian, Ordovician, Silurian and Devonian sediments. The most interesting
aquifers for geothermal development are in the Cambrian and Vendian sandstones and
siltstones. Due to comparatively low heat flow from the Precambrian basement, and the
small thickness of sedimentary rocks, the groundwater temperatures in the Phanerozoic
aquifers are inadequate for geothermal electricity generation. However, these formations
could well be used for producing geothermal energy for space heating and potential targets
can be found in the basement for EGS applications (European Commission, 1999)
Figure 19: Basement Heat Production Rate. Source: Estonian Geothermal Association, Jõeleht, 2002
Market Development
There are no deep geothermal installations in operation, but the first steps in creating a roadmap for further research and the analysis of the potential have been taken by the national geothermal association. Some of the actions taken are the geological study of the Estonian geothermal potential, mapping of potential structures, and creating a preliminary geothermal database.
43
It is also crucial to define geothermal energy in the Estonian legislation according to the definition set out in Article 2 of Directive 2009/28/EC as well as to work out economic stimulus packages for promoting the interest of the private sector (Soesoo, A. and Sukles, U., 2013).
Economic Potential
Gross Geothermal Electricity
Generation (TWh)
Geothermal Electricity Target in
the NREAP (TWh)
Geothermal Economic Potential
(TWh)
Geothermal Economic Potential
(TWh)
% of geothermal
in gross electricity
production
Geothermal Economic
Potential – Installed Capacity (MWe)
2010 2020 2030 2050
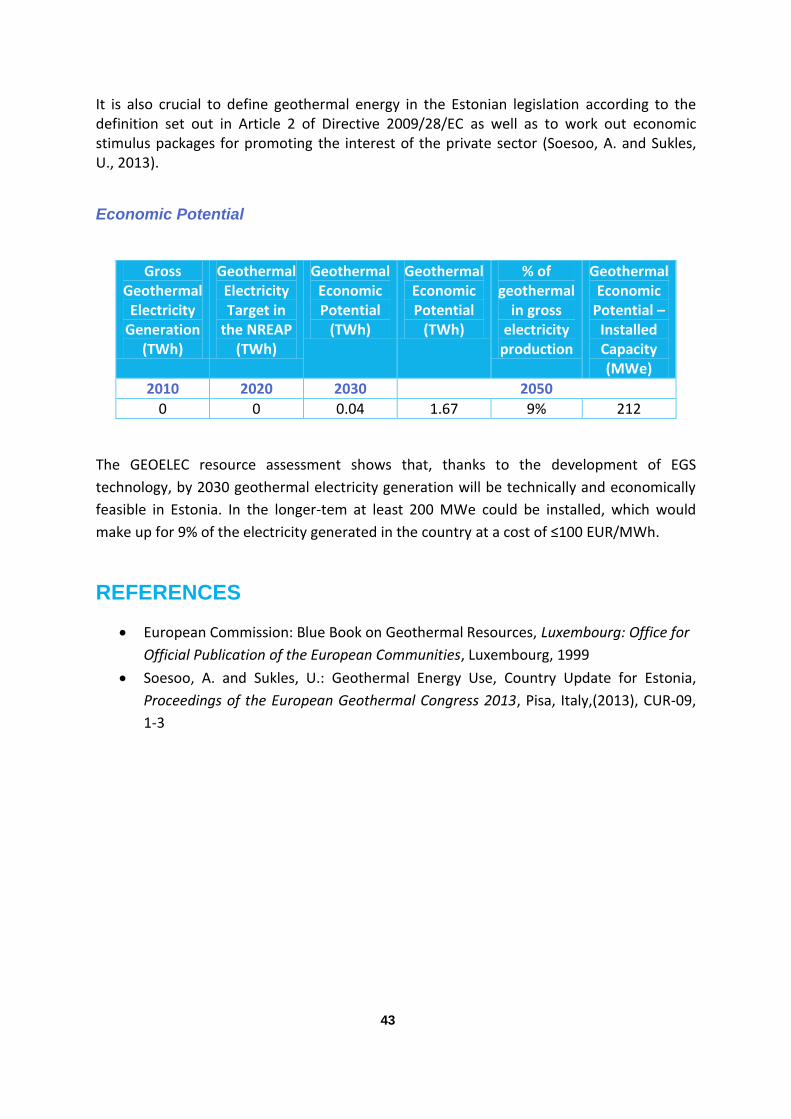
0 0 0.04 1.67 9% 212
The GEOELEC resource assessment shows that, thanks to the development of EGS
technology, by 2030 geothermal electricity generation will be technically and economically
feasible in Estonia. In the longer-tem at least 200 MWe could be installed, which would
make up for 9% of the electricity generated in the country at a cost of ≤100 EUR/MWh.
REFERENCES
European Commission: Blue Book on Geothermal Resources, Luxembourg: Office for
Official Publication of the European Communities, Luxembourg, 1999
Soesoo, A. and Sukles, U.: Geothermal Energy Use, Country Update for Estonia,
Proceedings of the European Geothermal Congress 2013, Pisa, Italy,(2013), CUR-09,
1-3
44
France
Background
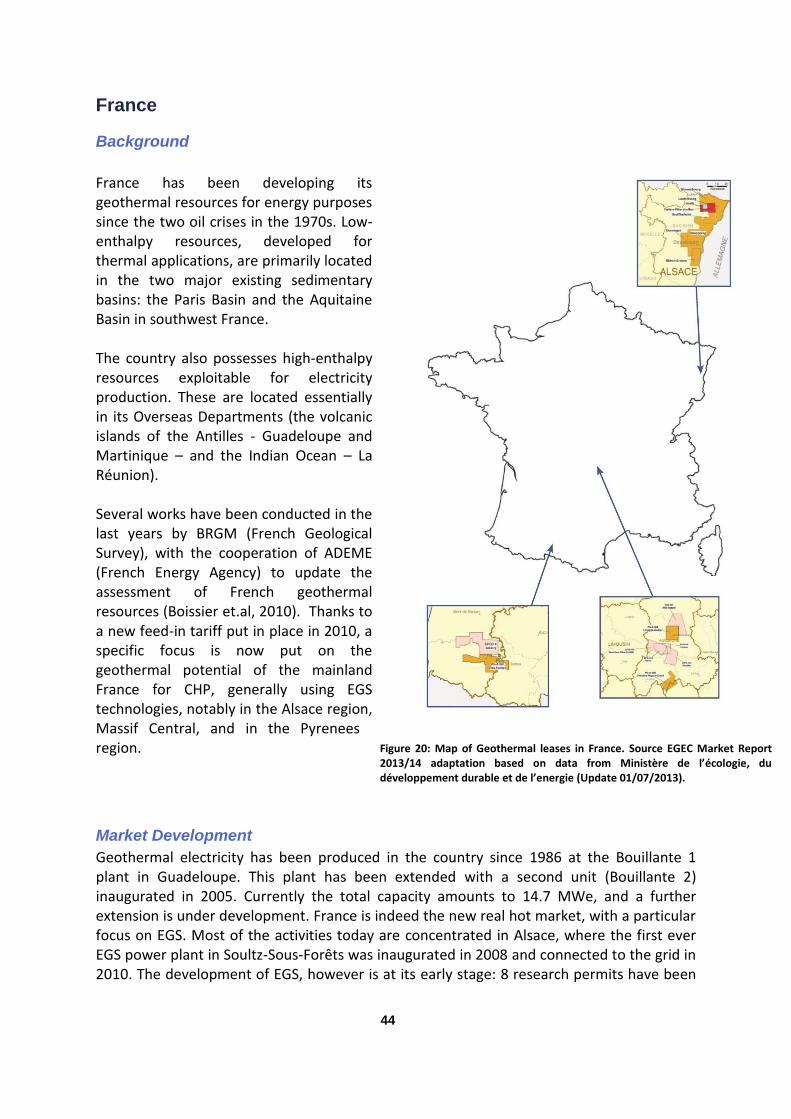
France has been developing its geothermal resources for energy purposes since the two oil crises in the 1970s. Low-enthalpy resources, developed for thermal applications, are primarily located in the two major existing sedimentary basins: the Paris Basin and the Aquitaine Basin in southwest France. The country also possesses high-enthalpy resources exploitable for electricity production. These are located essentially in its Overseas Departments (the volcanic islands of the Antilles - Guadeloupe and Martinique – and the Indian Ocean – La Réunion). Several works have been conducted in the last years by BRGM (French Geological Survey), with the cooperation of ADEME (French Energy Agency) to update the assessment of French geothermal resources (Boissier et.al, 2010). Thanks to a new feed-in tariff put in place in 2010, a specific focus is now put on the geothermal potential of the mainland France for CHP, generally using EGS technologies, notably in the Alsace region, Massif Central, and in the Pyrenees region.
Market Development
Geothermal electricity has been produced in the country since 1986 at the Bouillante 1 plant in Guadeloupe. This plant has been extended with a second unit (Bouillante 2) inaugurated in 2005. Currently the total capacity amounts to 14.7 MWe, and a further extension is under development. France is indeed the new real hot market, with a particular focus on EGS. Most of the activities today are concentrated in Alsace, where the first ever EGS power plant in Soultz-Sous-Forêts was inaugurated in 2008 and connected to the grid in 2010. The development of EGS, however is at its early stage: 8 research permits have been
Figure 20: Map of Geothermal leases in France. Source EGEC Market Report 2013/14 adaptation based on data from Ministère de l’écologie, du développement durable et de l’energie (Update 01/07/2013).
45
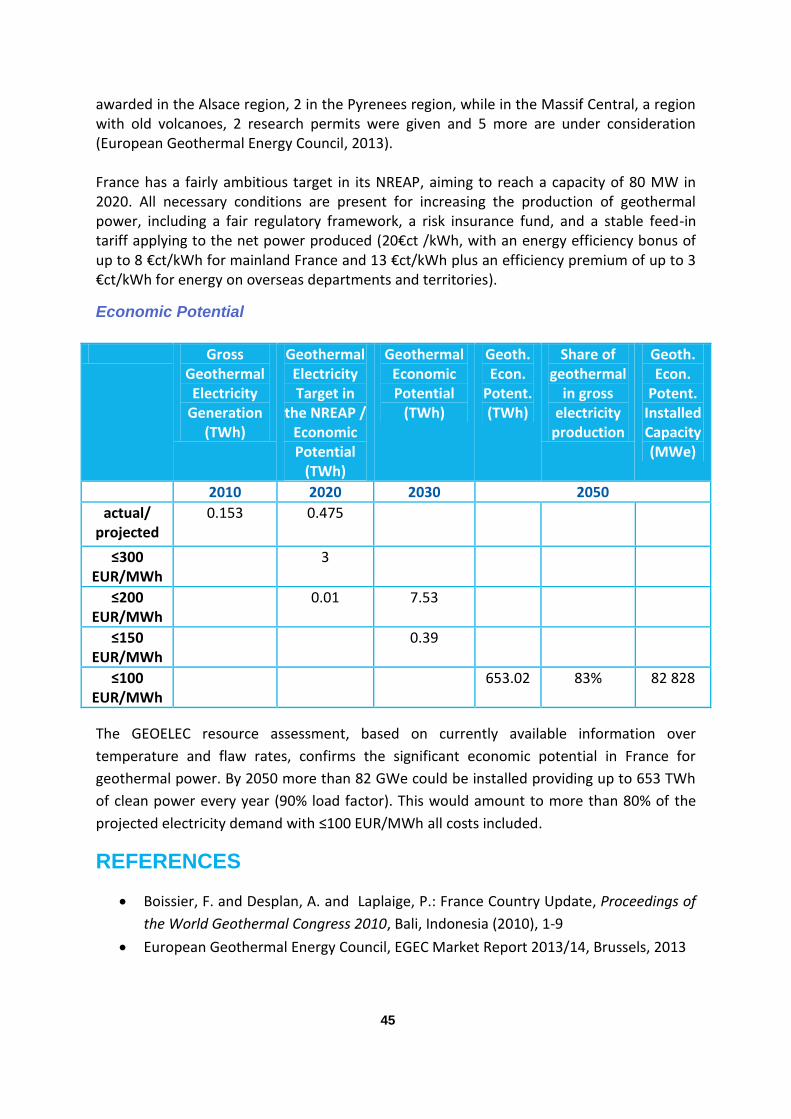
awarded in the Alsace region, 2 in the Pyrenees region, while in the Massif Central, a region with old volcanoes, 2 research permits were given and 5 more are under consideration (European Geothermal Energy Council, 2013). France has a fairly ambitious target in its NREAP, aiming to reach a capacity of 80 MW in 2020. All necessary conditions are present for increasing the production of geothermal power, including a fair regulatory framework, a risk insurance fund, and a stable feed-in tariff applying to the net power produced (20€ct /kWh, with an energy efficiency bonus of up to 8 €ct/kWh for mainland France and 13 €ct/kWh plus an efficiency premium of up to 3 €ct/kWh for energy on overseas departments and territories).
Economic Potential
Gross Geothermal Electricity
Generation (TWh)
Geothermal Electricity Target in
the NREAP / Economic Potential
(TWh)
Geothermal Economic Potential
(TWh)
Geoth. Econ.
Potent. (TWh)
Share of geothermal
in gross electricity
production
Geoth. Econ.
Potent. Installed Capacity (MWe)
2010 2020 2030 2050
actual/ projected
0.153 0.475
≤300 EUR/MWh
3
≤200 EUR/MWh
0.01 7.53
≤150 EUR/MWh
0.39
≤100 EUR/MWh
653.02 83% 82 828
The GEOELEC resource assessment, based on currently available information over
temperature and flaw rates, confirms the significant economic potential in France for
geothermal power. By 2050 more than 82 GWe could be installed providing up to 653 TWh
of clean power every year (90% load factor). This would amount to more than 80% of the
projected electricity demand with ≤100 EUR/MWh all costs included.
REFERENCES
Boissier, F. and Desplan, A. and Laplaige, P.: France Country Update, Proceedings of
the World Geothermal Congress 2010, Bali, Indonesia (2010), 1-9
European Geothermal Energy Council, EGEC Market Report 2013/14, Brussels, 2013
46
Germany
Background
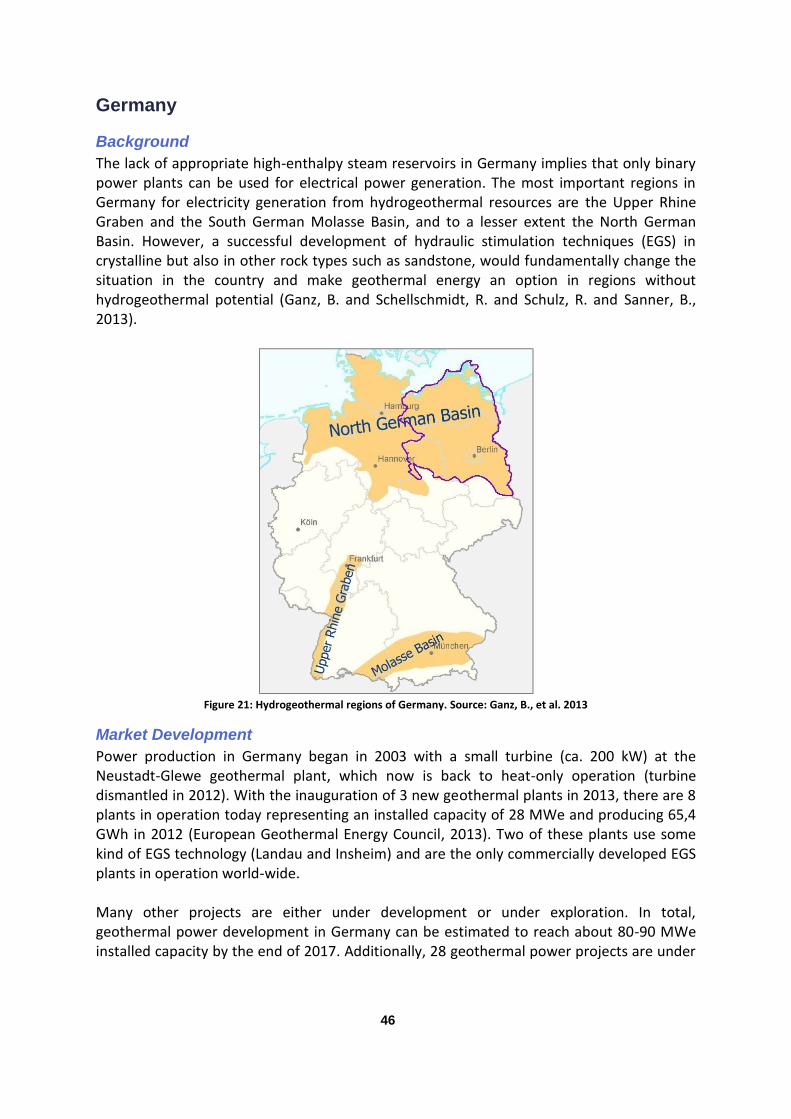
The lack of appropriate high-enthalpy steam reservoirs in Germany implies that only binary power plants can be used for electrical power generation. The most important regions in Germany for electricity generation from hydrogeothermal resources are the Upper Rhine Graben and the South German Molasse Basin, and to a lesser extent the North German Basin. However, a successful development of hydraulic stimulation techniques (EGS) in crystalline but also in other rock types such as sandstone, would fundamentally change the situation in the country and make geothermal energy an option in regions without hydrogeothermal potential (Ganz, B. and Schellschmidt, R. and Schulz, R. and Sanner, B., 2013).
Figure 21: Hydrogeothermal regions of Germany. Source: Ganz, B., et al. 2013
Market Development
Power production in Germany began in 2003 with a small turbine (ca. 200 kW) at the Neustadt-Glewe geothermal plant, which now is back to heat-only operation (turbine dismantled in 2012). With the inauguration of 3 new geothermal plants in 2013, there are 8 plants in operation today representing an installed capacity of 28 MWe and producing 65,4 GWh in 2012 (European Geothermal Energy Council, 2013). Two of these plants use some kind of EGS technology (Landau and Insheim) and are the only commercially developed EGS plants in operation world-wide. Many other projects are either under development or under exploration. In total, geothermal power development in Germany can be estimated to reach about 80-90 MWe installed capacity by the end of 2017. Additionally, 28 geothermal power projects are under
47
investigation, including 4 EGS plants (Krefeld, Bietigheim, Lohmen, Rülzheim), representing an additional capacity of more than 100 MWe. The framework for developing projects appears to be favourable. Geological data on deep geothermal is available, although it is often not free of charge. The German Federal Mining Law (BBergG) includes geothermal use and is the pivotal law for the approval of geothermal projects. Moreover, § 28 of the EEG Law proposes a Feed-in Tariff of 25 €ct/kWh plus a bonus for the use of petrothermal technology (i.e. EGS) of 5 €ct/kWh, for a period of 20 years, applied to the produced gross power. However, the EEG Law is subject to changes in 2014; it is likely that this will involve the removal of the petrothermal bonus and thus a worsening of the investment climate.
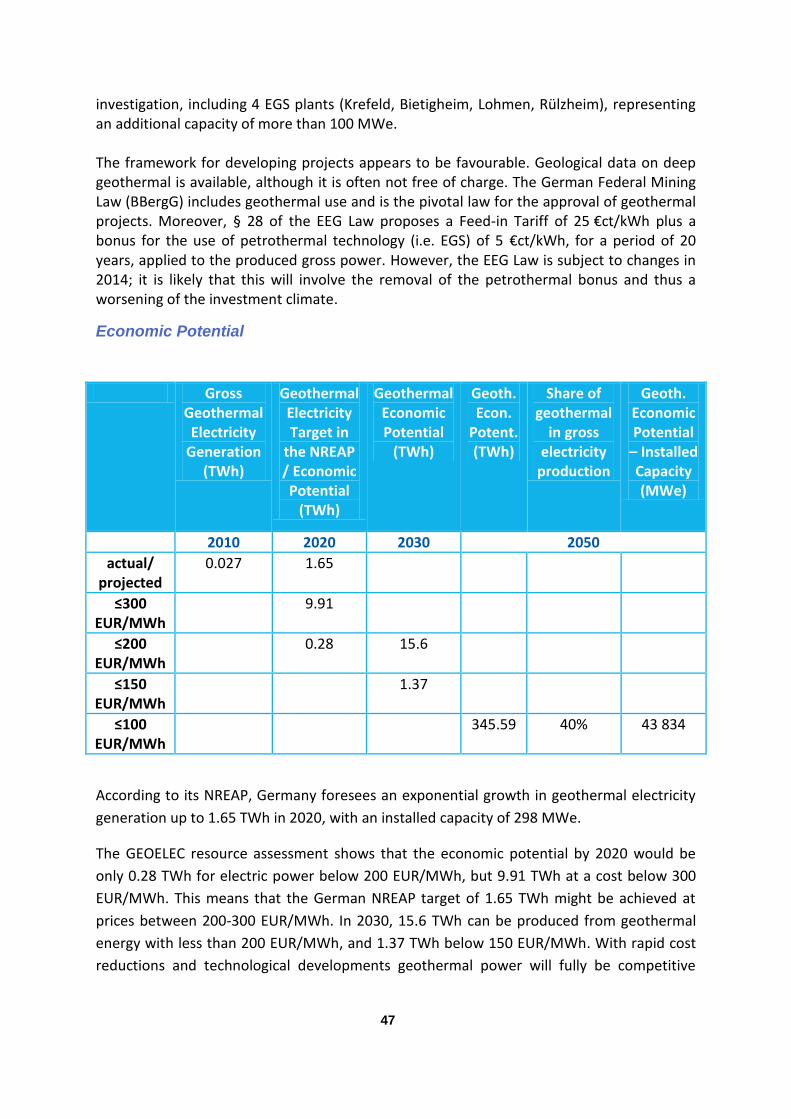
Economic Potential
Gross Geothermal Electricity
Generation (TWh)
Geothermal Electricity Target in
the NREAP / Economic Potential
(TWh)
Geothermal Economic Potential
(TWh)
Geoth. Econ.
Potent. (TWh)
Share of geothermal
in gross electricity
production
Geoth. Economic Potential
– Installed Capacity (MWe)
2010 2020 2030 2050
actual/ projected
0.027 1.65
≤300 EUR/MWh
9.91
≤200 EUR/MWh
0.28 15.6
≤150 EUR/MWh
1.37
≤100 EUR/MWh
345.59 40% 43 834
According to its NREAP, Germany foresees an exponential growth in geothermal electricity
generation up to 1.65 TWh in 2020, with an installed capacity of 298 MWe.
The GEOELEC resource assessment shows that the economic potential by 2020 would be
only 0.28 TWh for electric power below 200 EUR/MWh, but 9.91 TWh at a cost below 300
EUR/MWh. This means that the German NREAP target of 1.65 TWh might be achieved at
prices between 200-300 EUR/MWh. In 2030, 15.6 TWh can be produced from geothermal
energy with less than 200 EUR/MWh, and 1.37 TWh below 150 EUR/MWh. With rapid cost
reductions and technological developments geothermal power will fully be competitive
48
thereafter. In 2050 geothermal electricity can provide 346 TWh per year from about 44
GWe of installed capacity, or 40% of the projected electricity demand at 100 EUR/MWh or
less.
The geothermal industry in Germany is well developed in all relevant sectors, from
geophysics through drilling to power plant construction. This is backed by R&D-work in
several high-class research centres and universities (e.g. GFZ, LIAG, KIT). With experience
from plants in operation, and in particular with experience on EGS, the German industry is
well placed to work not only in the country, but also to take a decent share of the
geothermal export to other countries.
REFERENCES
Ganz, B. and Schellschmidt, R. and Schulz, R. and Sanner, B.: Geothermal Energy Use,
Country Update for Germany, Proceedings of the European Geothermal Congress
2013, Pisa, Italy,(2013), CUR-13, 1-16
European Geothermal Energy Council, EGEC Market Report 2013/14, Brussels, 2013.
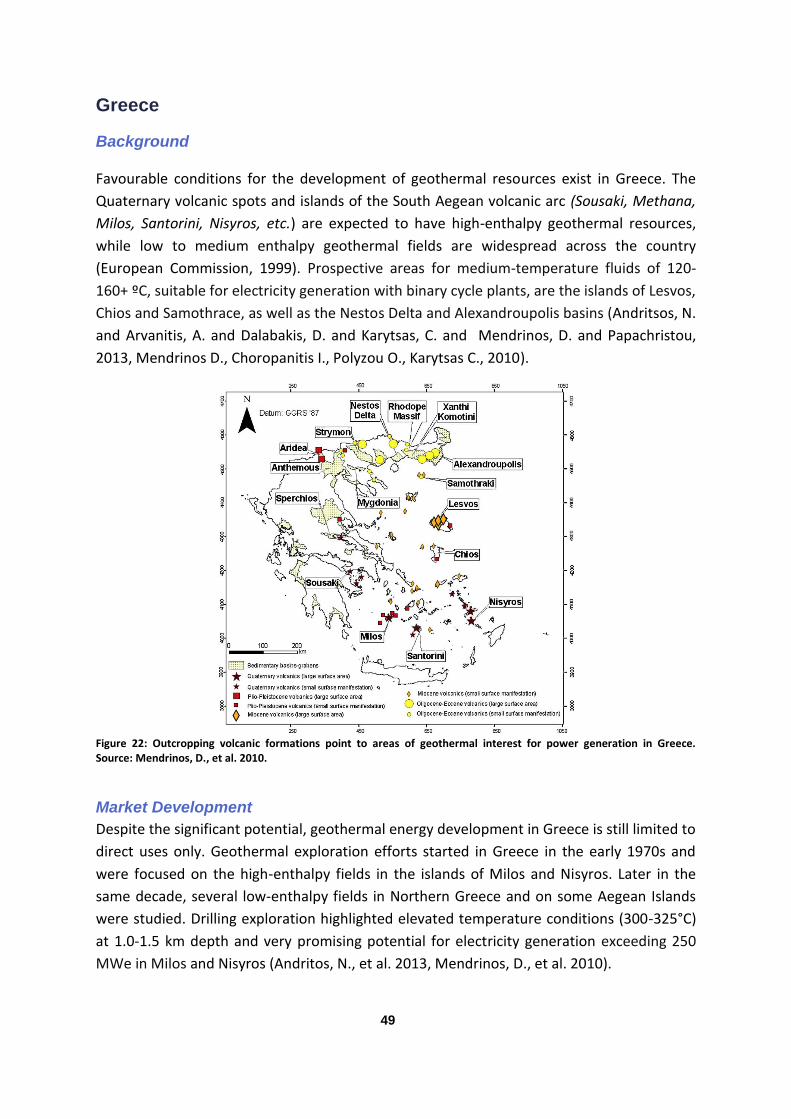
49
Greece
Background
Favourable conditions for the development of geothermal resources exist in Greece. The
Quaternary volcanic spots and islands of the South Aegean volcanic arc (Sousaki, Methana,
Milos, Santorini, Nisyros, etc.) are expected to have high-enthalpy geothermal resources,
while low to medium enthalpy geothermal fields are widespread across the country
(European Commission, 1999). Prospective areas for medium-temperature fluids of 120-
160+ ºC, suitable for electricity generation with binary cycle plants, are the islands of Lesvos,
Chios and Samothrace, as well as the Nestos Delta and Alexandroupolis basins (Andritsos, N.
and Arvanitis, A. and Dalabakis, D. and Karytsas, C. and Mendrinos, D. and Papachristou,
2013, Mendrinos D., Choropanitis I., Polyzou O., Karytsas C., 2010).
Figure 22: Outcropping volcanic formations point to areas of geothermal interest for power generation in Greece. Source: Mendrinos, D., et al. 2010.
Market Development
Despite the significant potential, geothermal energy development in Greece is still limited to
direct uses only. Geothermal exploration efforts started in Greece in the early 1970s and
were focused on the high-enthalpy fields in the islands of Milos and Nisyros. Later in the
same decade, several low-enthalpy fields in Northern Greece and on some Aegean Islands
were studied. Drilling exploration highlighted elevated temperature conditions (300-325°C)
at 1.0-1.5 km depth and very promising potential for electricity generation exceeding 250
MWe in Milos and Nisyros (Andritos, N., et al. 2013, Mendrinos, D., et al. 2010).
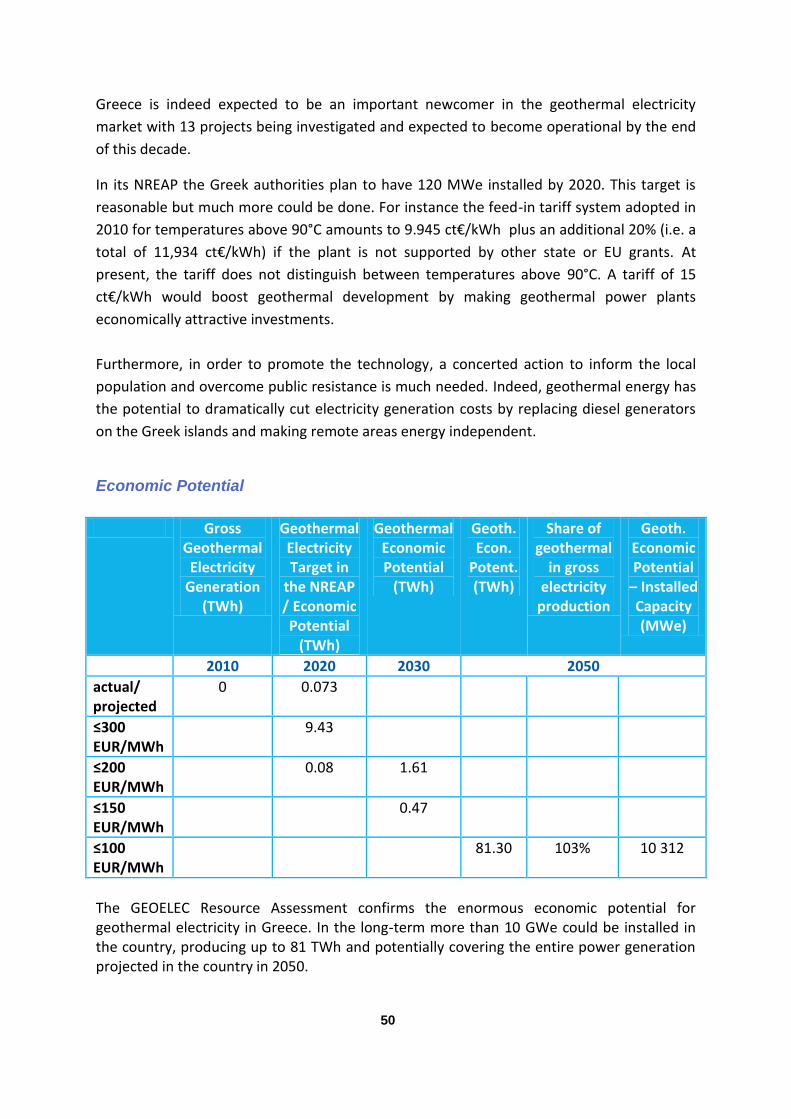
50
Greece is indeed expected to be an important newcomer in the geothermal electricity
market with 13 projects being investigated and expected to become operational by the end
of this decade.
In its NREAP the Greek authorities plan to have 120 MWe installed by 2020. This target is
reasonable but much more could be done. For instance the feed-in tariff system adopted in
2010 for temperatures above 90°C amounts to 9.945 ct€/kWh plus an additional 20% (i.e. a
total of 11,934 ct€/kWh) if the plant is not supported by other state or EU grants. At
present, the tariff does not distinguish between temperatures above 90°C. A tariff of 15
ct€/kWh would boost geothermal development by making geothermal power plants
economically attractive investments.
Furthermore, in order to promote the technology, a concerted action to inform the local
population and overcome public resistance is much needed. Indeed, geothermal energy has
the potential to dramatically cut electricity generation costs by replacing diesel generators
on the Greek islands and making remote areas energy independent.
Economic Potential
Gross Geothermal Electricity
Generation (TWh)
Geothermal Electricity Target in
the NREAP / Economic Potential
(TWh)
Geothermal Economic Potential
(TWh)
Geoth. Econ.
Potent. (TWh)
Share of geothermal
in gross electricity
production
Geoth. Economic Potential
– Installed Capacity (MWe)
2010 2020 2030 2050
actual/ projected
0 0.073
≤300 EUR/MWh
9.43
≤200 EUR/MWh
0.08 1.61
≤150 EUR/MWh
0.47
≤100 EUR/MWh
81.30 103% 10 312
The GEOELEC Resource Assessment confirms the enormous economic potential for geothermal electricity in Greece. In the long-term more than 10 GWe could be installed in the country, producing up to 81 TWh and potentially covering the entire power generation projected in the country in 2050.
51
REFERENCES
Mendrinos D., Choropanitis I., Polyzou O., Karytsas C., 2010: “Exploring for
Geothermal Resources in Greece”, Geothermics, Vol. 39, pp 124–137.
Andritsos, N. and Arvanitis, A. and Dalabakis, D. and Karytsas, C. and Mendrinos, D.
and Papachristou, M.: Geothermal Energy Use, Country Update for Greece,
Proceedings of the European Geothermal Congress 2013, Pisa, Italy,(2013), CUR-14,
1-10
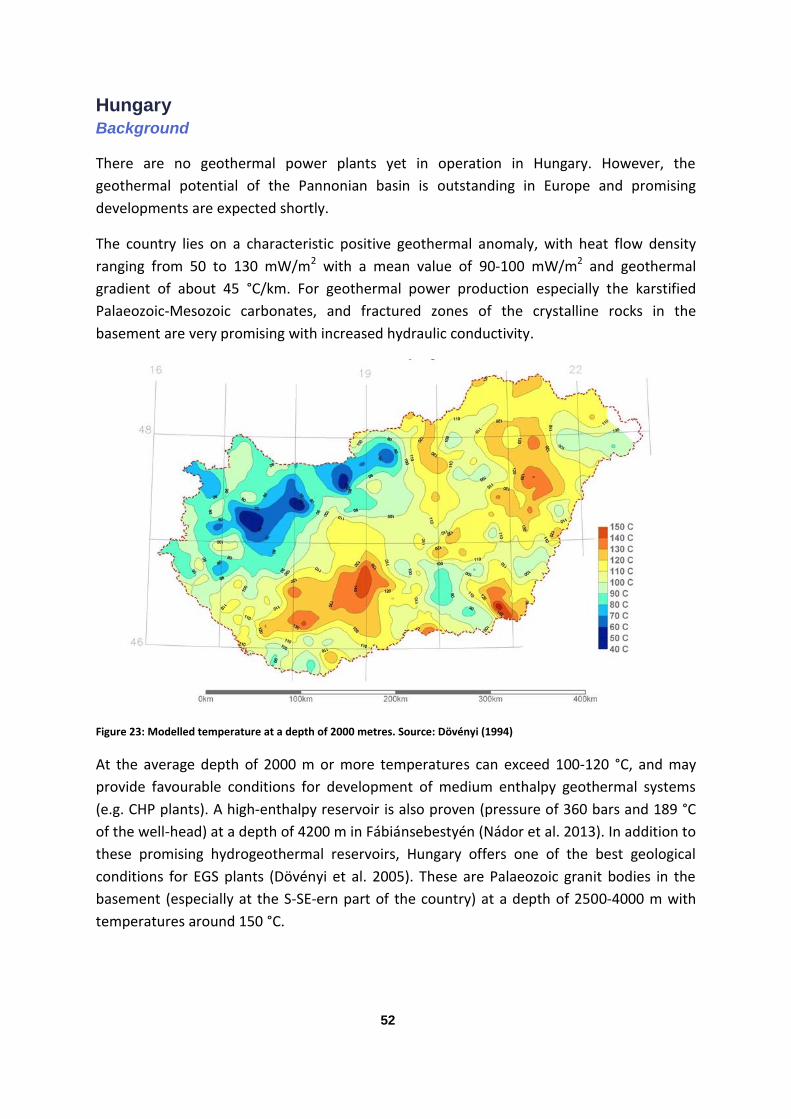
52
Hungary
Background
There are no geothermal power plants yet in operation in Hungary. However, the
geothermal potential of the Pannonian basin is outstanding in Europe and promising
developments are expected shortly.
The country lies on a characteristic positive geothermal anomaly, with heat flow density
ranging from 50 to 130 mW/m2 with a mean value of 90-100 mW/m2 and geothermal
gradient of about 45 °C/km. For geothermal power production especially the karstified
Palaeozoic-Mesozoic carbonates, and fractured zones of the crystalline rocks in the
basement are very promising with increased hydraulic conductivity.
Figure 23: Modelled temperature at a depth of 2000 metres. Source: Dövényi (1994)
At the average depth of 2000 m or more temperatures can exceed 100-120 °C, and may
provide favourable conditions for development of medium enthalpy geothermal systems
(e.g. CHP plants). A high-enthalpy reservoir is also proven (pressure of 360 bars and 189 °C
of the well-head) at a depth of 4200 m in Fábiánsebestyén (Nádor et al. 2013). In addition to
these promising hydrogeothermal reservoirs, Hungary offers one of the best geological
conditions for EGS plants (Dövényi et al. 2005). These are Palaeozoic granit bodies in the
basement (especially at the S-SE-ern part of the country) at a depth of 2500-4000 m with
temperatures around 150 °C.
53
Market Development
Geothermal energy development in Hungary is still limited to direct uses only. In the mid
80’s during hydrocarbon exploration drilling a high-enthalpy geopressured reservoir was
observed in the area of Fábiánsebestyén. Since then studies of several areas in Hungary
have indicated significant temperatures and yield, presumably suitable for electricity
production. In the last thirty years numerous studies and plans have dealt with the further
development of geothermal resources for electricity production. Although several tests have
been made, and wells constructed, there is still no finalised well for geothermal electricity
production.
Hungary is one of the few Member States planning to develop geothermal electricity to
achieve its 2020 target for renewable energy. Its NREAP mentions support measures and the
installation of 57 MWe and the production of 410 GWh by the end of this decade.
Several geothermal power plant models have been developed during the last few years
show that it is feasible to fulfil the objectives of NREAP. There is already an EGS project
under preparation in Hungary supported by the NER 300 scheme. If this would be a
successful project, the power plant will be up and running before 2020.
The intention of State to support the geothermal industry is obvious, but somehow there
are ambivalent results. However, there still three main barriers impeding investment in the
country, namely:
a) The feed-in tariff system is under revision. The takeover price of the electricity
produced from geothermal energy was about 10 €ct/kWh, but it is presently
suspended;
b) The legal framework for geothermal energy use is rather complicated and needs to
be simplified; the mining, energy, environmental protection and water management
authorities share competences regarding regulations and licensing procedures. Legal
contradictions and time-consuming licensing procedures are still in place.
c) According to a new regulation, exploration and exploitation of geothermal energy
below -2500 m takes places in the frame of concessions. The first calls have been
launched in the summer of 2013, but this requirement has hindered the progress of
development of electricity production in the last couple of years.
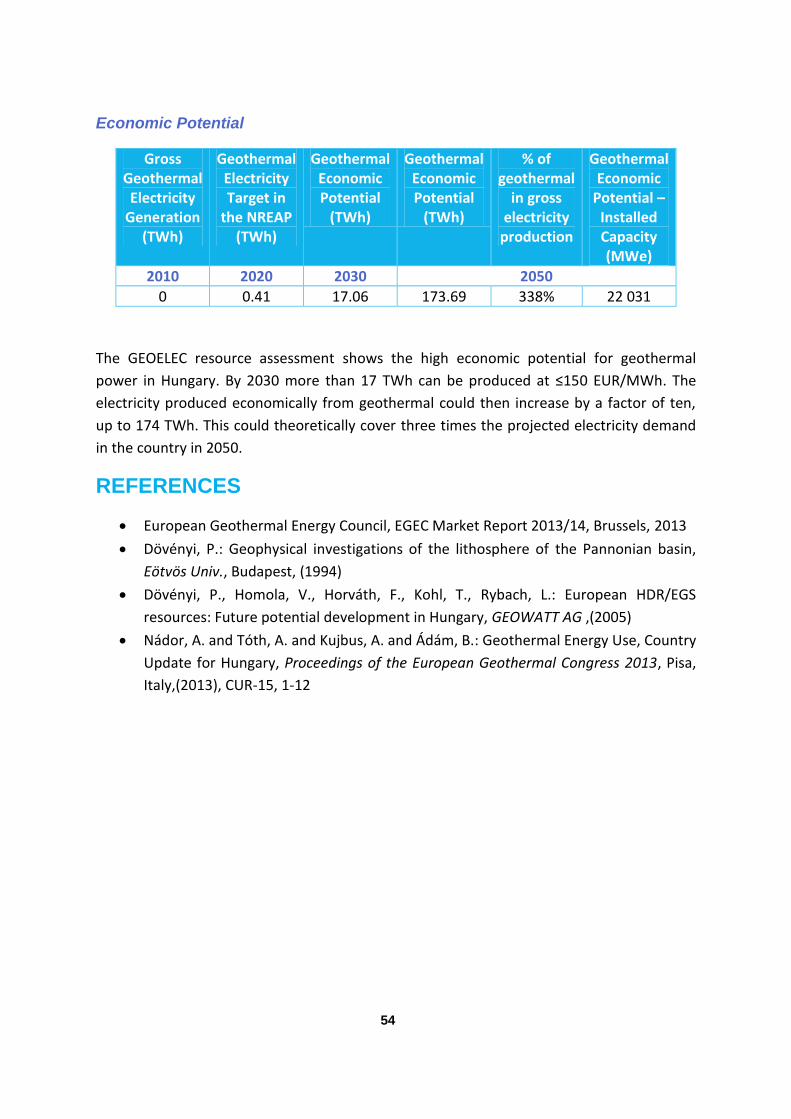
54
Economic Potential
Gross Geothermal Electricity
Generation (TWh)
Geothermal Electricity Target in
the NREAP (TWh)
Geothermal Economic Potential
(TWh)
Geothermal Economic Potential
(TWh)
% of geothermal
in gross electricity
production
Geothermal Economic
Potential – Installed Capacity (MWe)
2010 2020 2030 2050
0 0.41 17.06 173.69 338% 22 031
The GEOELEC resource assessment shows the high economic potential for geothermal
power in Hungary. By 2030 more than 17 TWh can be produced at ≤150 EUR/MWh. The
electricity produced economically from geothermal could then increase by a factor of ten,
up to 174 TWh. This could theoretically cover three times the projected electricity demand
in the country in 2050.
REFERENCES
European Geothermal Energy Council, EGEC Market Report 2013/14, Brussels, 2013
Dövényi, P.: Geophysical investigations of the lithosphere of the Pannonian basin,
Eötvös Univ., Budapest, (1994)
Dövényi, P., Homola, V., Horváth, F., Kohl, T., Rybach, L.: European HDR/EGS
resources: Future potential development in Hungary, GEOWATT AG ,(2005)
Nádor, A. and Tóth, A. and Kujbus, A. and Ádám, B.: Geothermal Energy Use, Country
Update for Hungary, Proceedings of the European Geothermal Congress 2013, Pisa,
Italy,(2013), CUR-15, 1-12
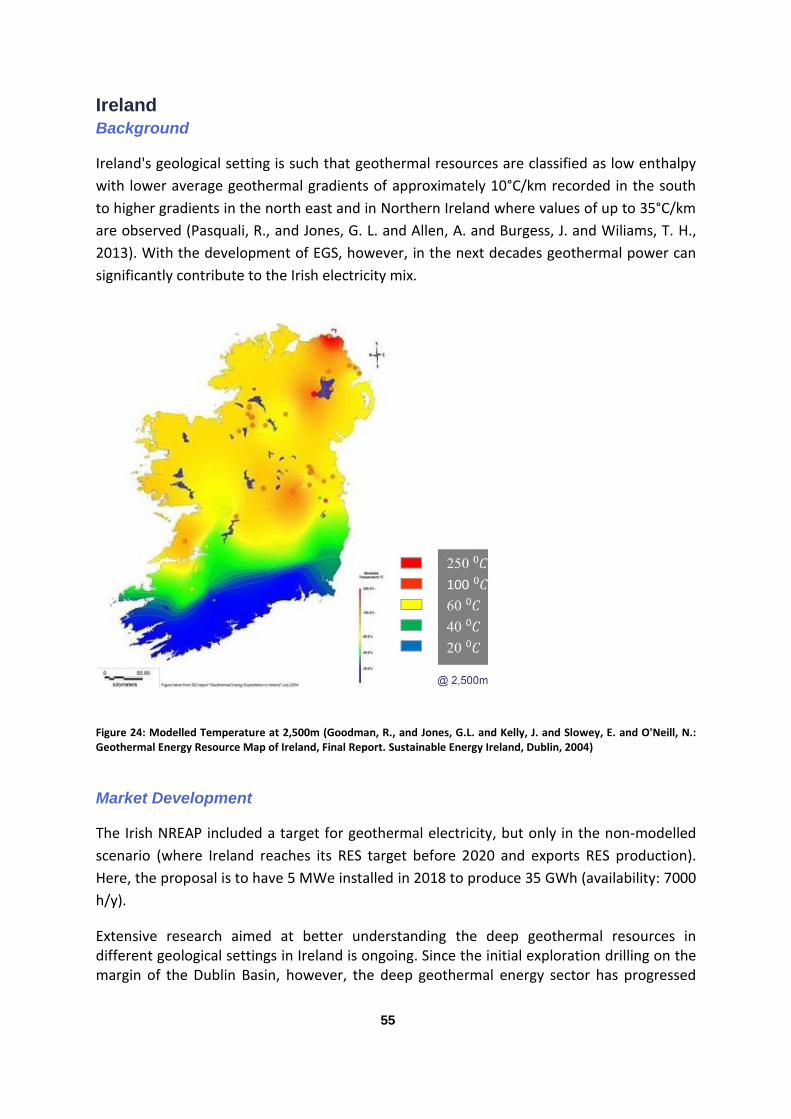
55
Ireland
Background
Ireland's geological setting is such that geothermal resources are classified as low enthalpy
with lower average geothermal gradients of approximately 10°C/km recorded in the south
to higher gradients in the north east and in Northern Ireland where values of up to 35°C/km
are observed (Pasquali, R., and Jones, G. L. and Allen, A. and Burgess, J. and Wiliams, T. H.,
2013). With the development of EGS, however, in the next decades geothermal power can
significantly contribute to the Irish electricity mix.
Figure 24: Modelled Temperature at 2,500m (Goodman, R., and Jones, G.L. and Kelly, J. and Slowey, E. and O'Neill, N.: Geothermal Energy Resource Map of Ireland, Final Report. Sustainable Energy Ireland, Dublin, 2004)
Market Development
The Irish NREAP included a target for geothermal electricity, but only in the non-modelled
scenario (where Ireland reaches its RES target before 2020 and exports RES production).
Here, the proposal is to have 5 MWe installed in 2018 to produce 35 GWh (availability: 7000
h/y).
Extensive research aimed at better understanding the deep geothermal resources in different geological settings in Ireland is ongoing. Since the initial exploration drilling on the margin of the Dublin Basin, however, the deep geothermal energy sector has progressed
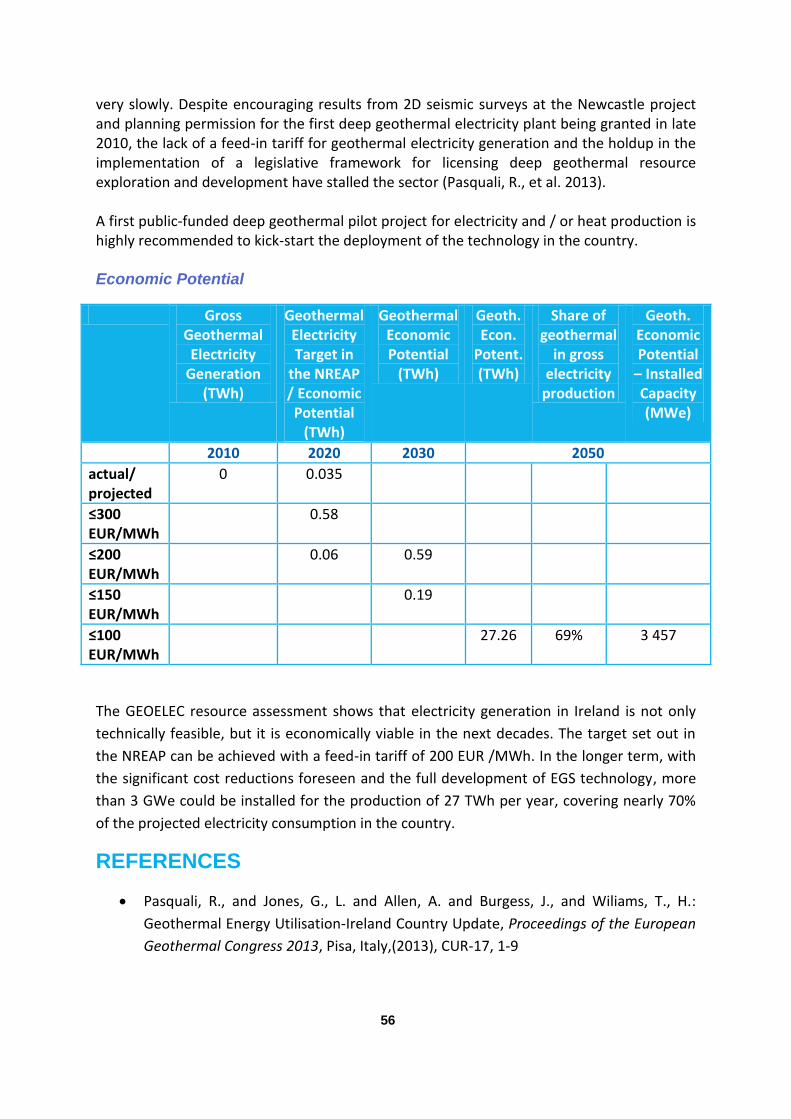
56
very slowly. Despite encouraging results from 2D seismic surveys at the Newcastle project and planning permission for the first deep geothermal electricity plant being granted in late 2010, the lack of a feed-in tariff for geothermal electricity generation and the holdup in the implementation of a legislative framework for licensing deep geothermal resource exploration and development have stalled the sector (Pasquali, R., et al. 2013). A first public-funded deep geothermal pilot project for electricity and / or heat production is highly recommended to kick-start the deployment of the technology in the country. Economic Potential
Gross Geothermal Electricity
Generation (TWh)
Geothermal Electricity Target in
the NREAP / Economic Potential
(TWh)
Geothermal Economic Potential
(TWh)
Geoth. Econ.
Potent. (TWh)
Share of geothermal
in gross electricity
production
Geoth. Economic Potential
– Installed Capacity (MWe)
2010 2020 2030 2050
actual/ projected
0 0.035
≤300 EUR/MWh
0.58
≤200 EUR/MWh
0.06 0.59
≤150 EUR/MWh
0.19
≤100 EUR/MWh
27.26 69% 3 457
The GEOELEC resource assessment shows that electricity generation in Ireland is not only
technically feasible, but it is economically viable in the next decades. The target set out in
the NREAP can be achieved with a feed-in tariff of 200 EUR /MWh. In the longer term, with
the significant cost reductions foreseen and the full development of EGS technology, more
than 3 GWe could be installed for the production of 27 TWh per year, covering nearly 70%
of the projected electricity consumption in the country.
REFERENCES
Pasquali, R., and Jones, G., L. and Allen, A. and Burgess, J., and Wiliams, T., H.:
Geothermal Energy Utilisation-Ireland Country Update, Proceedings of the European
Geothermal Congress 2013, Pisa, Italy,(2013), CUR-17, 1-9
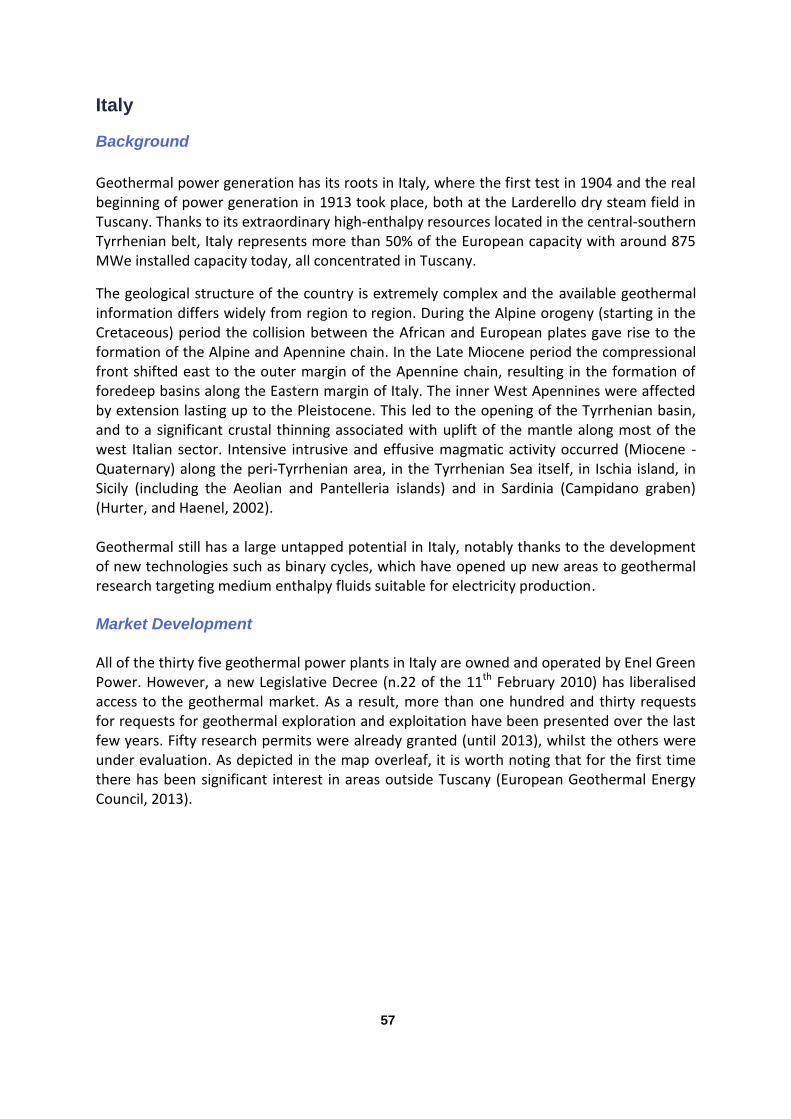
57
Italy
Background
Geothermal power generation has its roots in Italy, where the first test in 1904 and the real beginning of power generation in 1913 took place, both at the Larderello dry steam field in Tuscany. Thanks to its extraordinary high-enthalpy resources located in the central-southern Tyrrhenian belt, Italy represents more than 50% of the European capacity with around 875 MWe installed capacity today, all concentrated in Tuscany.
The geological structure of the country is extremely complex and the available geothermal information differs widely from region to region. During the Alpine orogeny (starting in the Cretaceous) period the collision between the African and European plates gave rise to the formation of the Alpine and Apennine chain. In the Late Miocene period the compressional front shifted east to the outer margin of the Apennine chain, resulting in the formation of foredeep basins along the Eastern margin of Italy. The inner West Apennines were affected by extension lasting up to the Pleistocene. This led to the opening of the Tyrrhenian basin, and to a significant crustal thinning associated with uplift of the mantle along most of the west Italian sector. Intensive intrusive and effusive magmatic activity occurred (Miocene - Quaternary) along the peri-Tyrrhenian area, in the Tyrrhenian Sea itself, in Ischia island, in Sicily (including the Aeolian and Pantelleria islands) and in Sardinia (Campidano graben) (Hurter, and Haenel, 2002). Geothermal still has a large untapped potential in Italy, notably thanks to the development of new technologies such as binary cycles, which have opened up new areas to geothermal research targeting medium enthalpy fluids suitable for electricity production. Market Development All of the thirty five geothermal power plants in Italy are owned and operated by Enel Green Power. However, a new Legislative Decree (n.22 of the 11th February 2010) has liberalised access to the geothermal market. As a result, more than one hundred and thirty requests for requests for geothermal exploration and exploitation have been presented over the last few years. Fifty research permits were already granted (until 2013), whilst the others were under evaluation. As depicted in the map overleaf, it is worth noting that for the first time there has been significant interest in areas outside Tuscany (European Geothermal Energy Council, 2013).
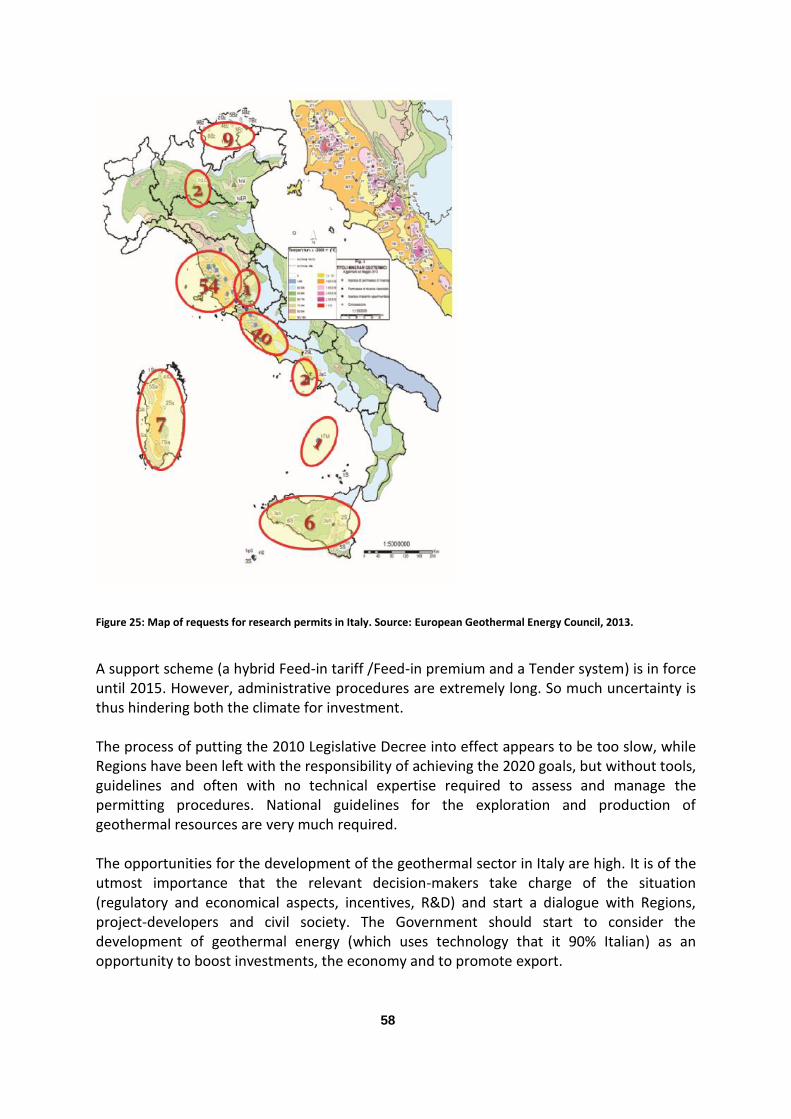
58
Figure 25: Map of requests for research permits in Italy. Source: European Geothermal Energy Council, 2013.
A support scheme (a hybrid Feed-in tariff /Feed-in premium and a Tender system) is in force until 2015. However, administrative procedures are extremely long. So much uncertainty is thus hindering both the climate for investment. The process of putting the 2010 Legislative Decree into effect appears to be too slow, while Regions have been left with the responsibility of achieving the 2020 goals, but without tools, guidelines and often with no technical expertise required to assess and manage the permitting procedures. National guidelines for the exploration and production of geothermal resources are very much required. The opportunities for the development of the geothermal sector in Italy are high. It is of the utmost importance that the relevant decision-makers take charge of the situation (regulatory and economical aspects, incentives, R&D) and start a dialogue with Regions, project-developers and civil society. The Government should start to consider the development of geothermal energy (which uses technology that it 90% Italian) as an opportunity to boost investments, the economy and to promote export.
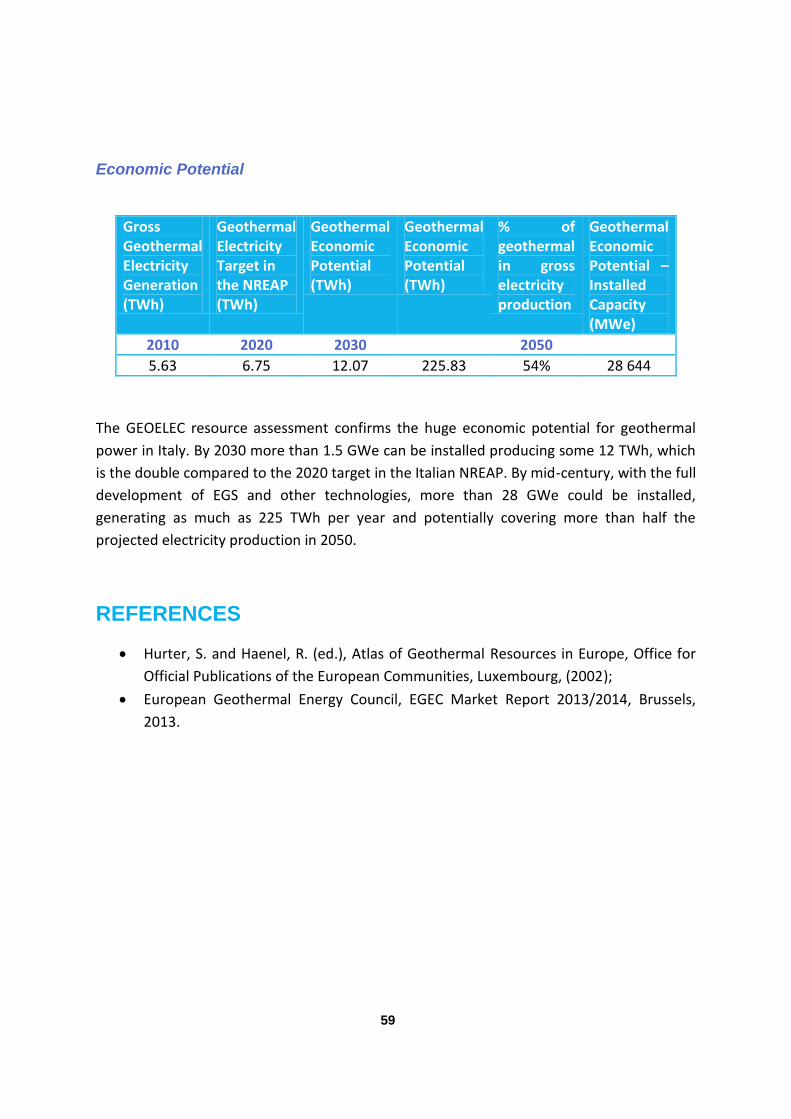
59
Economic Potential
Gross Geothermal Electricity Generation (TWh)
Geothermal Electricity Target in the NREAP (TWh)
Geothermal Economic Potential (TWh)
Geothermal Economic Potential (TWh)
% of geothermal in gross electricity production
Geothermal Economic Potential – Installed Capacity (MWe)
2010 2020 2030 2050
5.63 6.75 12.07 225.83 54% 28 644
The GEOELEC resource assessment confirms the huge economic potential for geothermal
power in Italy. By 2030 more than 1.5 GWe can be installed producing some 12 TWh, which
is the double compared to the 2020 target in the Italian NREAP. By mid-century, with the full
development of EGS and other technologies, more than 28 GWe could be installed,
generating as much as 225 TWh per year and potentially covering more than half the
projected electricity production in 2050.
REFERENCES
Hurter, S. and Haenel, R. (ed.), Atlas of Geothermal Resources in Europe, Office for
Official Publications of the European Communities, Luxembourg, (2002);
European Geothermal Energy Council, EGEC Market Report 2013/2014, Brussels,
2013.
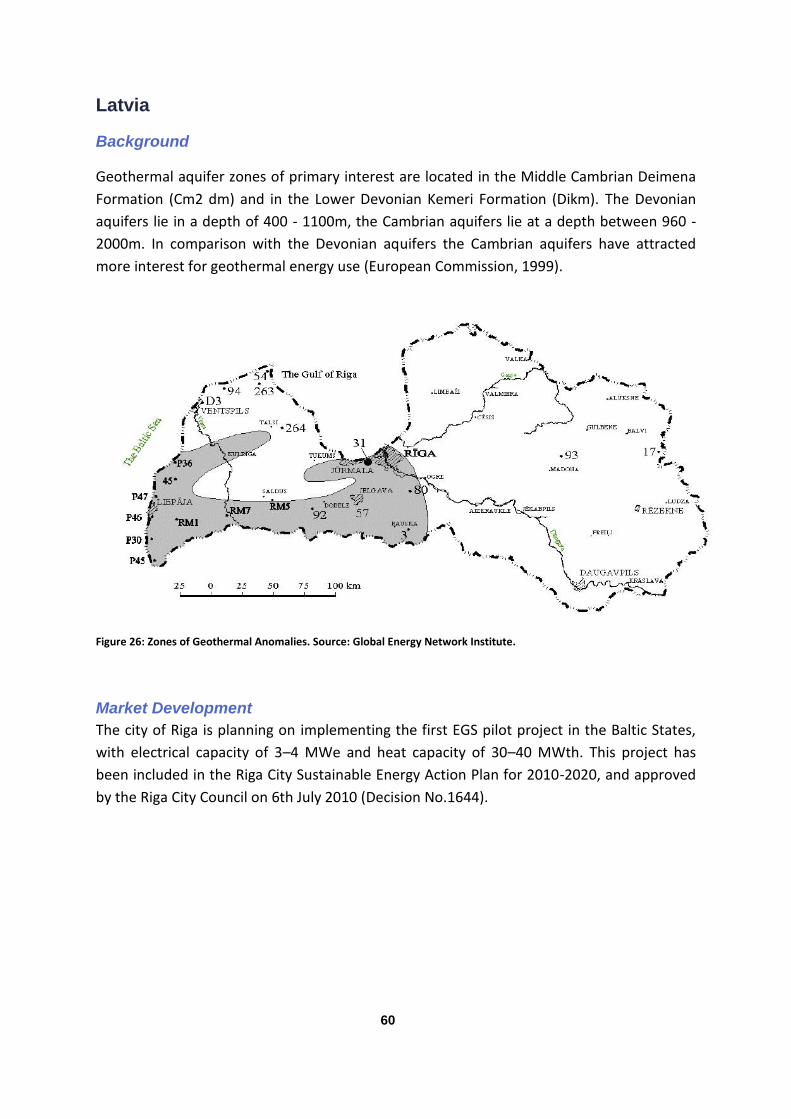
60
Latvia
Background
Geothermal aquifer zones of primary interest are located in the Middle Cambrian Deimena
Formation (Cm2 dm) and in the Lower Devonian Kemeri Formation (Dikm). The Devonian
aquifers lie in a depth of 400 - 1100m, the Cambrian aquifers lie at a depth between 960 -
2000m. In comparison with the Devonian aquifers the Cambrian aquifers have attracted
more interest for geothermal energy use (European Commission, 1999).
Figure 26: Zones of Geothermal Anomalies. Source: Global Energy Network Institute.
Market Development
The city of Riga is planning on implementing the first EGS pilot project in the Baltic States,
with electrical capacity of 3–4 MWe and heat capacity of 30–40 MWth. This project has
been included in the Riga City Sustainable Energy Action Plan for 2010-2020, and approved
by the Riga City Council on 6th July 2010 (Decision No.1644).
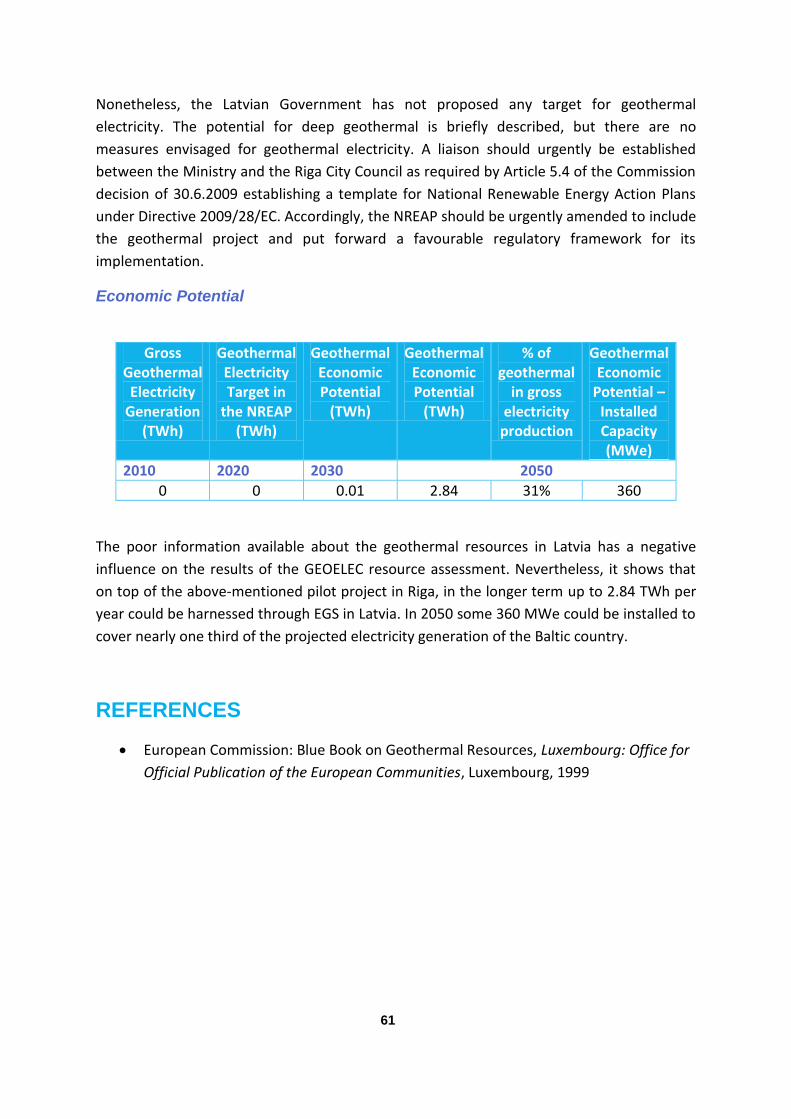
61
Nonetheless, the Latvian Government has not proposed any target for geothermal
electricity. The potential for deep geothermal is briefly described, but there are no
measures envisaged for geothermal electricity. A liaison should urgently be established
between the Ministry and the Riga City Council as required by Article 5.4 of the Commission
decision of 30.6.2009 establishing a template for National Renewable Energy Action Plans
under Directive 2009/28/EC. Accordingly, the NREAP should be urgently amended to include
the geothermal project and put forward a favourable regulatory framework for its
implementation.
Economic Potential
Gross Geothermal Electricity
Generation (TWh)
Geothermal Electricity Target in
the NREAP (TWh)
Geothermal Economic Potential
(TWh)
Geothermal Economic Potential
(TWh)
% of geothermal
in gross electricity
production
Geothermal Economic
Potential – Installed Capacity (MWe)
2010 2020 2030 2050
0 0 0.01 2.84 31% 360
The poor information available about the geothermal resources in Latvia has a negative
influence on the results of the GEOELEC resource assessment. Nevertheless, it shows that
on top of the above-mentioned pilot project in Riga, in the longer term up to 2.84 TWh per
year could be harnessed through EGS in Latvia. In 2050 some 360 MWe could be installed to
cover nearly one third of the projected electricity generation of the Baltic country.
REFERENCES
European Commission: Blue Book on Geothermal Resources, Luxembourg: Office for
Official Publication of the European Communities, Luxembourg, 1999
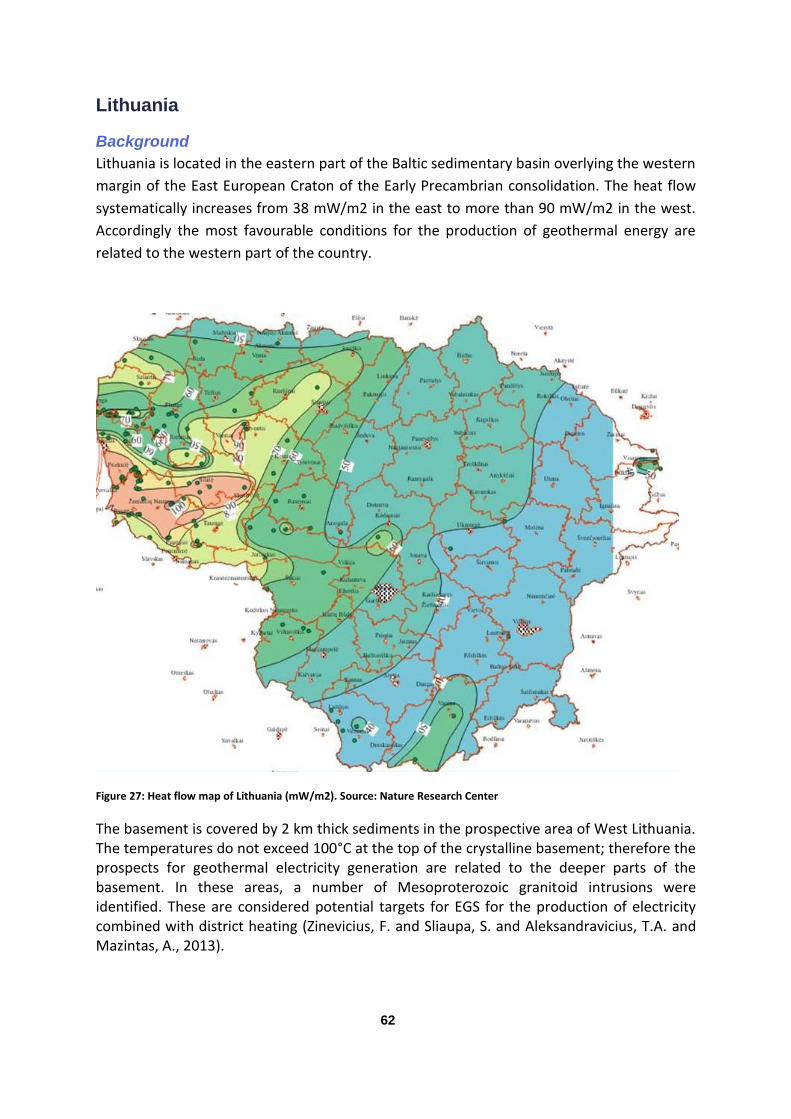
62
Lithuania
Background
Lithuania is located in the eastern part of the Baltic sedimentary basin overlying the western
margin of the East European Craton of the Early Precambrian consolidation. The heat flow
systematically increases from 38 mW/m2 in the east to more than 90 mW/m2 in the west.
Accordingly the most favourable conditions for the production of geothermal energy are
related to the western part of the country.
Figure 27: Heat flow map of Lithuania (mW/m2). Source: Nature Research Center
The basement is covered by 2 km thick sediments in the prospective area of West Lithuania. The temperatures do not exceed 100°C at the top of the crystalline basement; therefore the prospects for geothermal electricity generation are related to the deeper parts of the basement. In these areas, a number of Mesoproterozoic granitoid intrusions were identified. These are considered potential targets for EGS for the production of electricity combined with district heating (Zinevicius, F. and Sliaupa, S. and Aleksandravicius, T.A. and Mazintas, A., 2013).
63
Market Development
Deep geothermal is not new in Lithuania. A geothermal heat plant has been operating in Klaipeda since 2004, while a first 3-MW geothermal power project is under evaluation in Silute. Although the Lithuanian NREAP indicates the wish to promote electricity and heating production from geothermal energy utilising the potential of Western Lithuania, a target for geothermal electricity was not set out. The Lithuanian Geological Survey prepared a plan for 2011–2015 in order to determine the possibilities of using renewable and non-traditional resources of the earth’s interior. It is part of the National strategy 2010-2015 yet, regrettably, is not reported in the NREAP. The high exploration risk is considered as the main barrier for developing a geothermal project in Lithuania. In addition, while a feed-in tariff scheme is in force for RES, there is no dedicated tariff for geothermal.
Economic Potential
Gross Geothermal Electricity
Generation (TWh)
Geothermal Electricity Target in
the NREAP (TWh)
Geothermal Economic Potential
(TWh)
Geothermal Economic Potential
(TWh)
% of geothermal
in gross electricity
production
Geothermal Economic
Potential – Installed Capacity (MWe)
2010 2020 2030 2050
0 0 0.04 18.71 236% 2 374
Geothermal electricity production in Lithuania can be economically viable after 2020. With
the full deployment of the EGS technology, in the longer-term, geothermal can potentially
provide more than twice the total projected electricity consumption in the country. More
than 2 GWe could be installed producing some 18 TWh of renewable electricity per year by
2050.
REFERENCES
Zinevicius, F. and Sliaupa, S. and Aleksandravicius, T.A. and Mazintas, A.: Country
Update Geothermal Energy Use, Country Update for Lithuania, Proceedings of the
European Geothermal Congress 2013, Pisa, Italy,(2013), CUR-19, 1-12
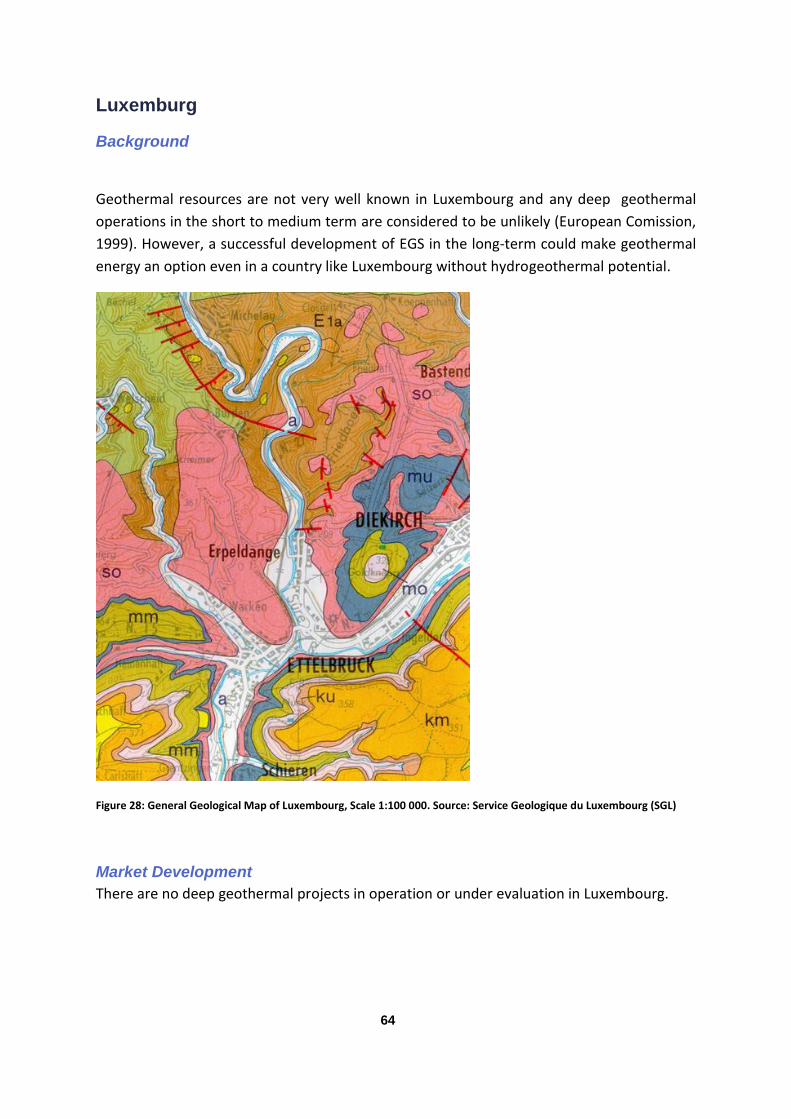
64
Luxemburg
Background
Geothermal resources are not very well known in Luxembourg and any deep geothermal
operations in the short to medium term are considered to be unlikely (European Comission,
1999). However, a successful development of EGS in the long-term could make geothermal
energy an option even in a country like Luxembourg without hydrogeothermal potential.
Figure 28: General Geological Map of Luxembourg, Scale 1:100 000. Source: Service Geologique du Luxembourg (SGL)
Market Development
There are no deep geothermal projects in operation or under evaluation in Luxembourg.
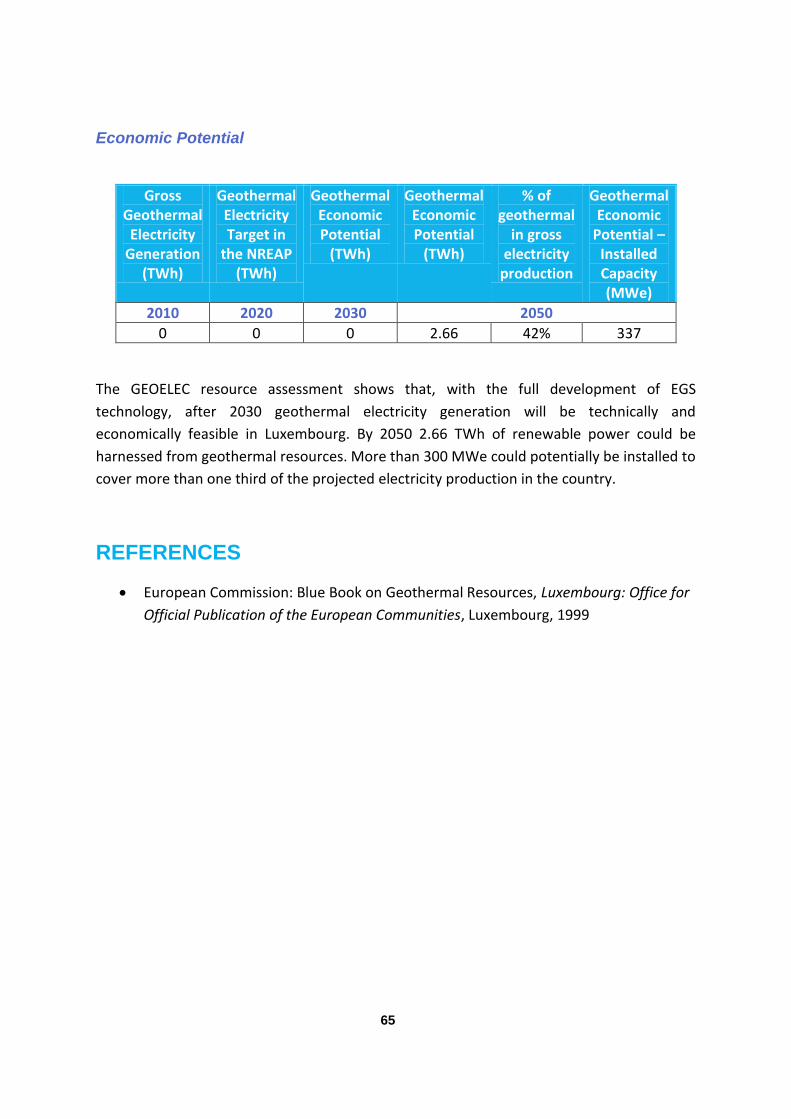
65
Economic Potential
Gross Geothermal Electricity
Generation (TWh)
Geothermal Electricity Target in
the NREAP (TWh)
Geothermal Economic Potential
(TWh)
Geothermal Economic Potential
(TWh)
% of geothermal
in gross electricity
production
Geothermal Economic
Potential – Installed Capacity (MWe)
2010 2020 2030 2050
0 0 0 2.66 42% 337
The GEOELEC resource assessment shows that, with the full development of EGS
technology, after 2030 geothermal electricity generation will be technically and
economically feasible in Luxembourg. By 2050 2.66 TWh of renewable power could be
harnessed from geothermal resources. More than 300 MWe could potentially be installed to
cover more than one third of the projected electricity production in the country.
REFERENCES
European Commission: Blue Book on Geothermal Resources, Luxembourg: Office for
Official Publication of the European Communities, Luxembourg, 1999
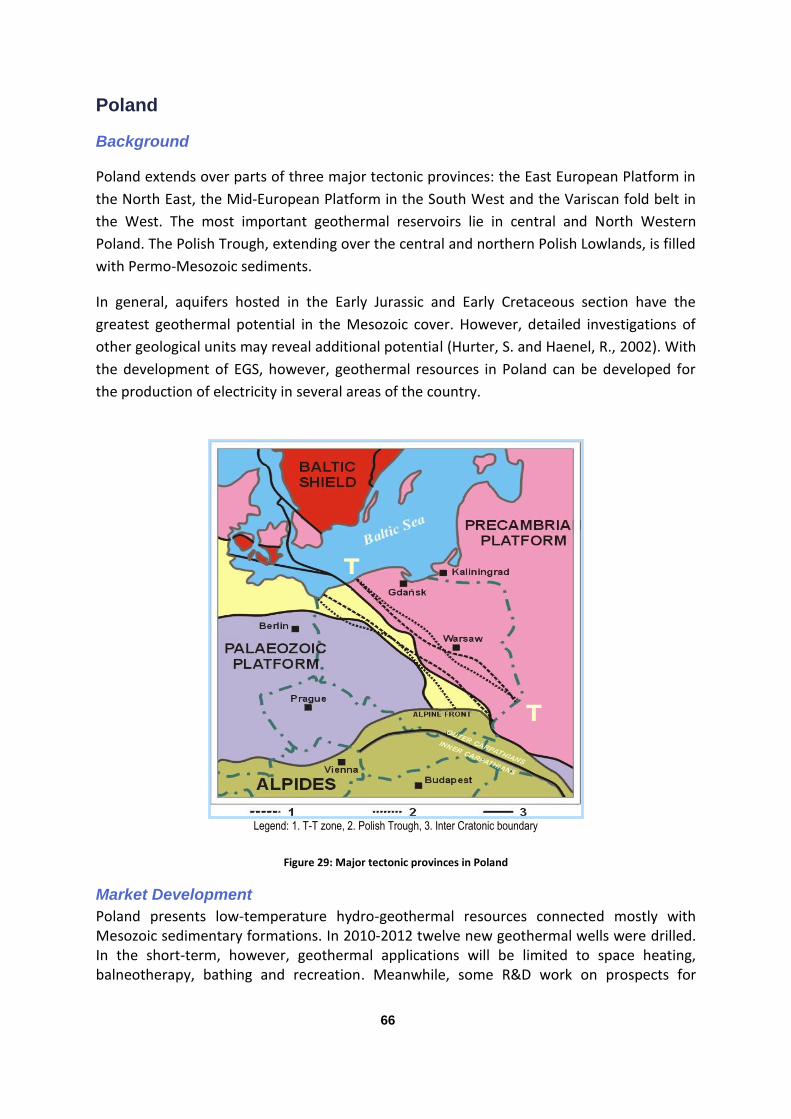
66
Poland
Background
Poland extends over parts of three major tectonic provinces: the East European Platform in
the North East, the Mid-European Platform in the South West and the Variscan fold belt in
the West. The most important geothermal reservoirs lie in central and North Western
Poland. The Polish Trough, extending over the central and northern Polish Lowlands, is filled
with Permo-Mesozoic sediments.
In general, aquifers hosted in the Early Jurassic and Early Cretaceous section have the
greatest geothermal potential in the Mesozoic cover. However, detailed investigations of
other geological units may reveal additional potential (Hurter, S. and Haenel, R., 2002). With
the development of EGS, however, geothermal resources in Poland can be developed for
the production of electricity in several areas of the country.
Legend: 1. T-T zone, 2. Polish Trough, 3. Inter Cratonic boundary
Figure 29: Major tectonic provinces in Poland
Market Development
Poland presents low-temperature hydro-geothermal resources connected mostly with Mesozoic sedimentary formations. In 2010-2012 twelve new geothermal wells were drilled. In the short-term, however, geothermal applications will be limited to space heating, balneotherapy, bathing and recreation. Meanwhile, some R&D work on prospects for
T
T
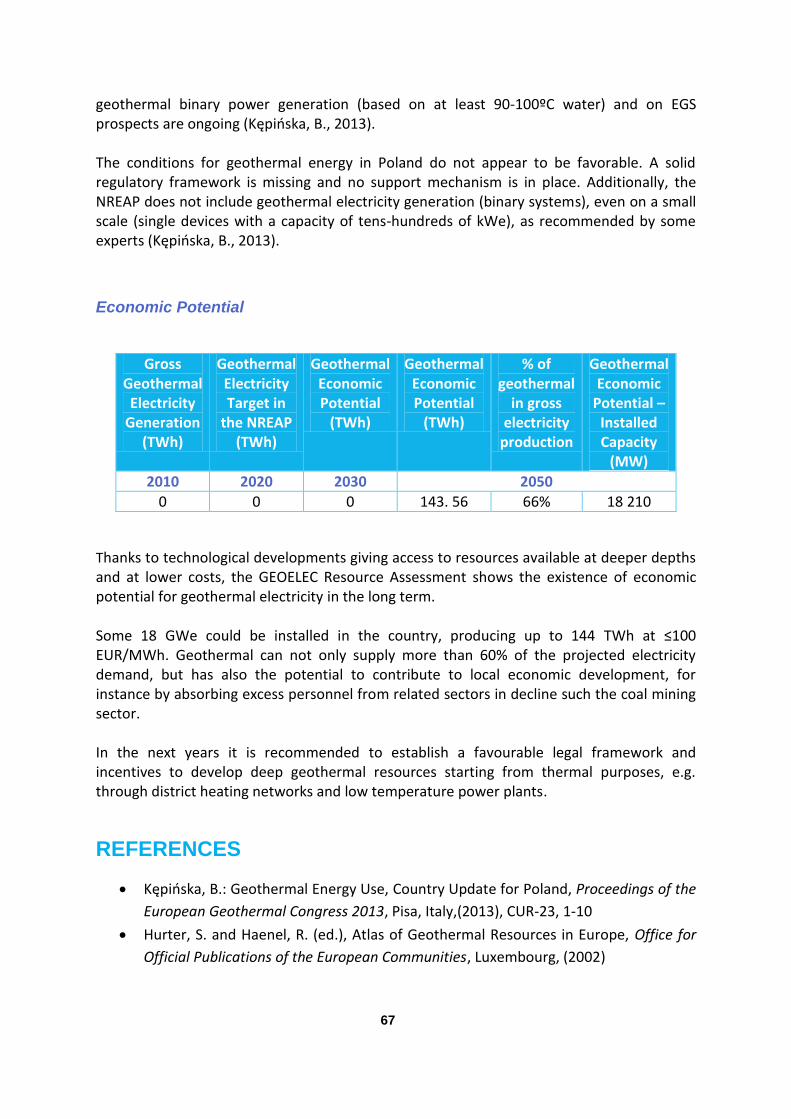
67
geothermal binary power generation (based on at least 90-100ºC water) and on EGS prospects are ongoing (Kępińska, B., 2013). The conditions for geothermal energy in Poland do not appear to be favorable. A solid regulatory framework is missing and no support mechanism is in place. Additionally, the NREAP does not include geothermal electricity generation (binary systems), even on a small scale (single devices with a capacity of tens-hundreds of kWe), as recommended by some experts (Kępińska, B., 2013).
Economic Potential
Gross Geothermal Electricity
Generation (TWh)
Geothermal Electricity Target in
the NREAP (TWh)
Geothermal Economic Potential
(TWh)
Geothermal Economic Potential
(TWh)
% of geothermal
in gross electricity
production
Geothermal Economic
Potential – Installed Capacity
(MW)
2010 2020 2030 2050
0 0 0 143. 56 66% 18 210
Thanks to technological developments giving access to resources available at deeper depths and at lower costs, the GEOELEC Resource Assessment shows the existence of economic potential for geothermal electricity in the long term. Some 18 GWe could be installed in the country, producing up to 144 TWh at ≤100 EUR/MWh. Geothermal can not only supply more than 60% of the projected electricity demand, but has also the potential to contribute to local economic development, for instance by absorbing excess personnel from related sectors in decline such the coal mining sector. In the next years it is recommended to establish a favourable legal framework and incentives to develop deep geothermal resources starting from thermal purposes, e.g. through district heating networks and low temperature power plants.
REFERENCES
Kępińska, B.: Geothermal Energy Use, Country Update for Poland, Proceedings of the
European Geothermal Congress 2013, Pisa, Italy,(2013), CUR-23, 1-10
Hurter, S. and Haenel, R. (ed.), Atlas of Geothermal Resources in Europe, Office for
Official Publications of the European Communities, Luxembourg, (2002)
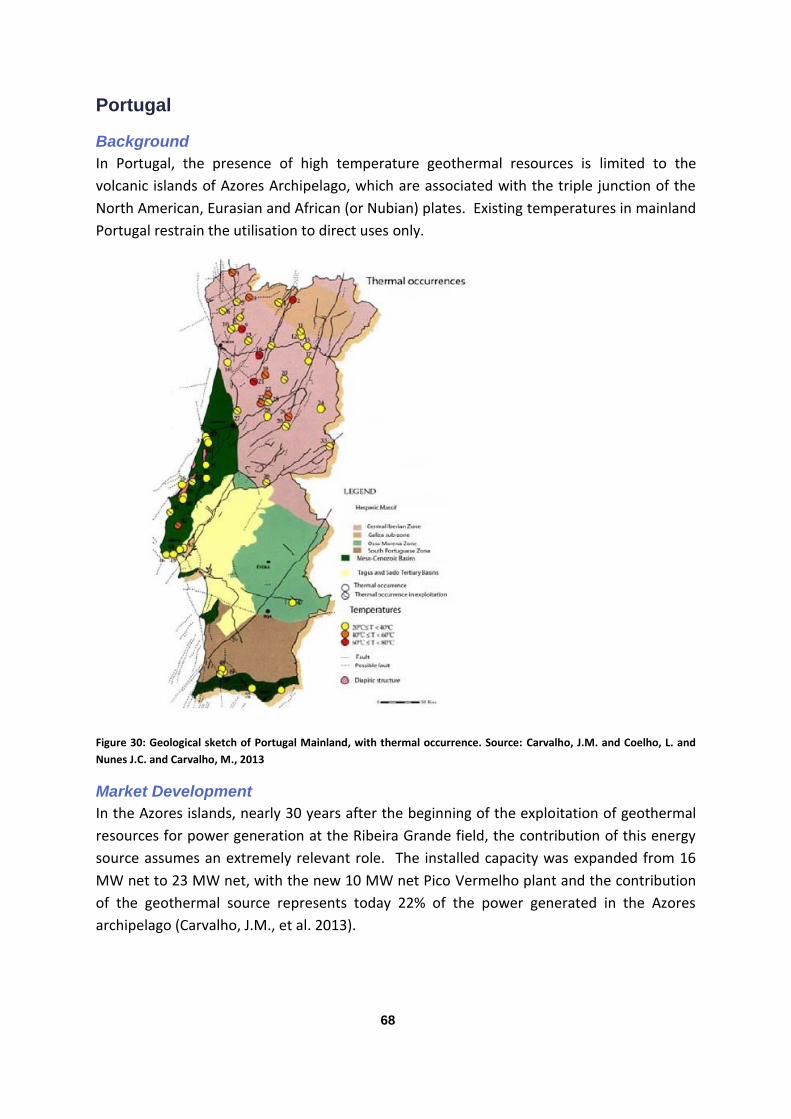
68
Portugal
Background
In Portugal, the presence of high temperature geothermal resources is limited to the
volcanic islands of Azores Archipelago, which are associated with the triple junction of the
North American, Eurasian and African (or Nubian) plates. Existing temperatures in mainland
Portugal restrain the utilisation to direct uses only.
Figure 30: Geological sketch of Portugal Mainland, with thermal occurrence. Source: Carvalho, J.M. and Coelho, L. and
Nunes J.C. and Carvalho, M., 2013
Market Development
In the Azores islands, nearly 30 years after the beginning of the exploitation of geothermal
resources for power generation at the Ribeira Grande field, the contribution of this energy
source assumes an extremely relevant role. The installed capacity was expanded from 16
MW net to 23 MW net, with the new 10 MW net Pico Vermelho plant and the contribution
of the geothermal source represents today 22% of the power generated in the Azores
archipelago (Carvalho, J.M., et al. 2013).
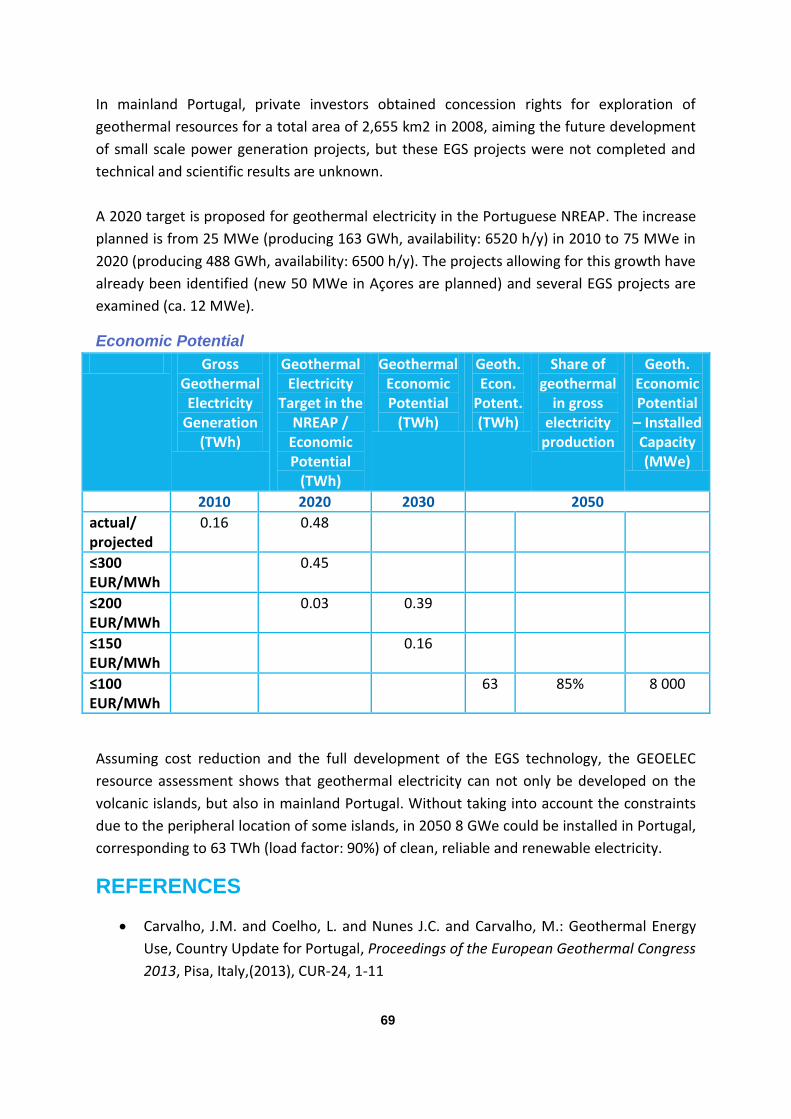
69
In mainland Portugal, private investors obtained concession rights for exploration of
geothermal resources for a total area of 2,655 km2 in 2008, aiming the future development
of small scale power generation projects, but these EGS projects were not completed and
technical and scientific results are unknown.
A 2020 target is proposed for geothermal electricity in the Portuguese NREAP. The increase
planned is from 25 MWe (producing 163 GWh, availability: 6520 h/y) in 2010 to 75 MWe in
2020 (producing 488 GWh, availability: 6500 h/y). The projects allowing for this growth have
already been identified (new 50 MWe in Açores are planned) and several EGS projects are
examined (ca. 12 MWe).
Economic Potential
Gross Geothermal Electricity
Generation (TWh)
Geothermal Electricity
Target in the NREAP /
Economic Potential
(TWh)
Geothermal Economic Potential
(TWh)
Geoth. Econ.
Potent. (TWh)
Share of geothermal
in gross electricity
production
Geoth. Economic Potential
– Installed Capacity (MWe)
2010 2020 2030 2050
actual/ projected
0.16 0.48
≤300 EUR/MWh
0.45
≤200 EUR/MWh
0.03 0.39
≤150 EUR/MWh
0.16
≤100 EUR/MWh
63 85% 8 000
Assuming cost reduction and the full development of the EGS technology, the GEOELEC
resource assessment shows that geothermal electricity can not only be developed on the
volcanic islands, but also in mainland Portugal. Without taking into account the constraints
due to the peripheral location of some islands, in 2050 8 GWe could be installed in Portugal,
corresponding to 63 TWh (load factor: 90%) of clean, reliable and renewable electricity.
REFERENCES
Carvalho, J.M. and Coelho, L. and Nunes J.C. and Carvalho, M.: Geothermal Energy
Use, Country Update for Portugal, Proceedings of the European Geothermal Congress
2013, Pisa, Italy,(2013), CUR-24, 1-11
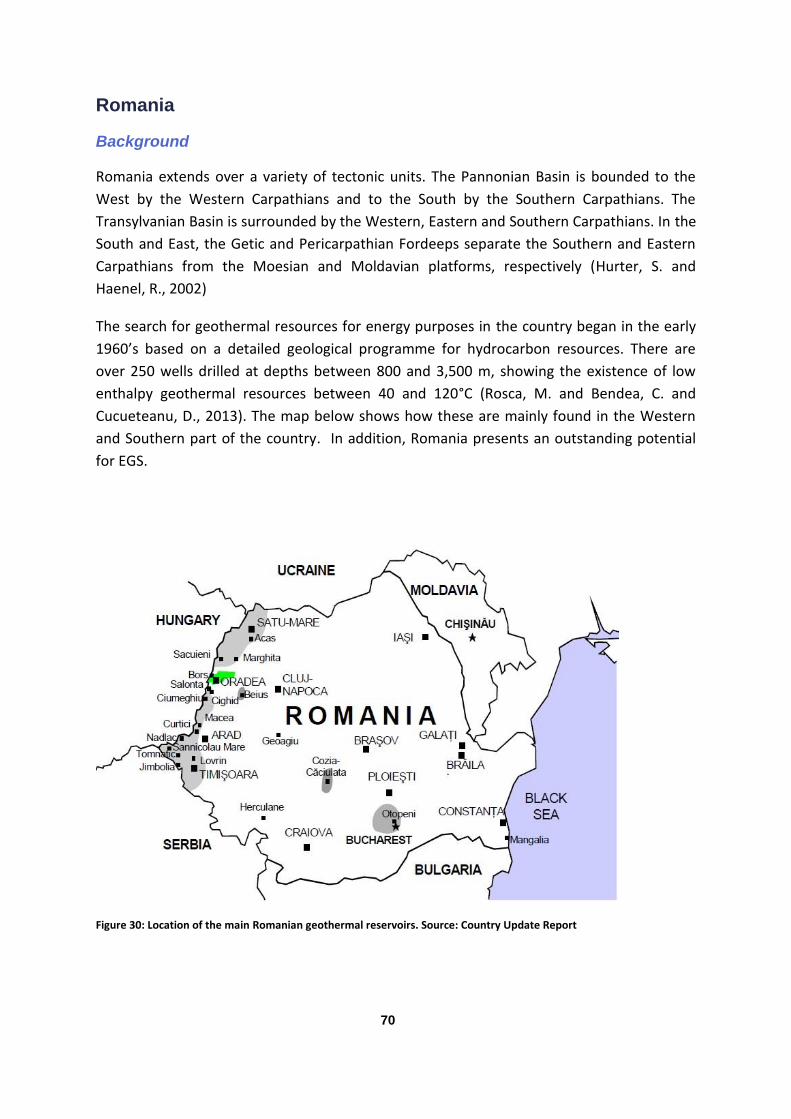
70
Romania
Background
Romania extends over a variety of tectonic units. The Pannonian Basin is bounded to the
West by the Western Carpathians and to the South by the Southern Carpathians. The
Transylvanian Basin is surrounded by the Western, Eastern and Southern Carpathians. In the
South and East, the Getic and Pericarpathian Fordeeps separate the Southern and Eastern
Carpathians from the Moesian and Moldavian platforms, respectively (Hurter, S. and
Haenel, R., 2002)
The search for geothermal resources for energy purposes in the country began in the early
1960’s based on a detailed geological programme for hydrocarbon resources. There are
over 250 wells drilled at depths between 800 and 3,500 m, showing the existence of low
enthalpy geothermal resources between 40 and 120°C (Rosca, M. and Bendea, C. and
Cucueteanu, D., 2013). The map below shows how these are mainly found in the Western
and Southern part of the country. In addition, Romania presents an outstanding potential
for EGS.
Figure 30: Location of the main Romanian geothermal reservoirs. Source: Country Update Report
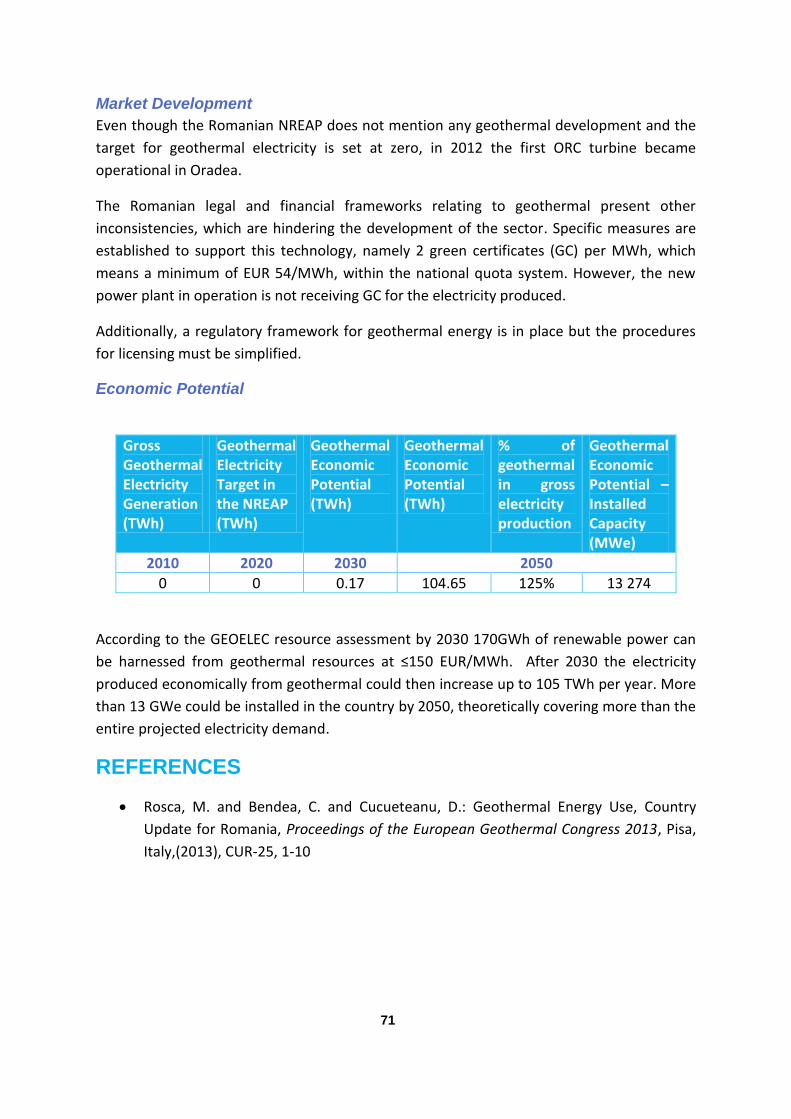
71
Market Development
Even though the Romanian NREAP does not mention any geothermal development and the
target for geothermal electricity is set at zero, in 2012 the first ORC turbine became
operational in Oradea.
The Romanian legal and financial frameworks relating to geothermal present other
inconsistencies, which are hindering the development of the sector. Specific measures are
established to support this technology, namely 2 green certificates (GC) per MWh, which
means a minimum of EUR 54/MWh, within the national quota system. However, the new
power plant in operation is not receiving GC for the electricity produced.
Additionally, a regulatory framework for geothermal energy is in place but the procedures
for licensing must be simplified.
Economic Potential
Gross Geothermal Electricity Generation (TWh)
Geothermal Electricity Target in the NREAP (TWh)
Geothermal Economic Potential (TWh)
Geothermal Economic Potential (TWh)
% of geothermal in gross electricity production
Geothermal Economic Potential – Installed Capacity (MWe)
2010 2020 2030 2050
0 0 0.17 104.65 125% 13 274
According to the GEOELEC resource assessment by 2030 170GWh of renewable power can
be harnessed from geothermal resources at ≤150 EUR/MWh. After 2030 the electricity
produced economically from geothermal could then increase up to 105 TWh per year. More
than 13 GWe could be installed in the country by 2050, theoretically covering more than the
entire projected electricity demand.
REFERENCES
Rosca, M. and Bendea, C. and Cucueteanu, D.: Geothermal Energy Use, Country
Update for Romania, Proceedings of the European Geothermal Congress 2013, Pisa,
Italy,(2013), CUR-25, 1-10
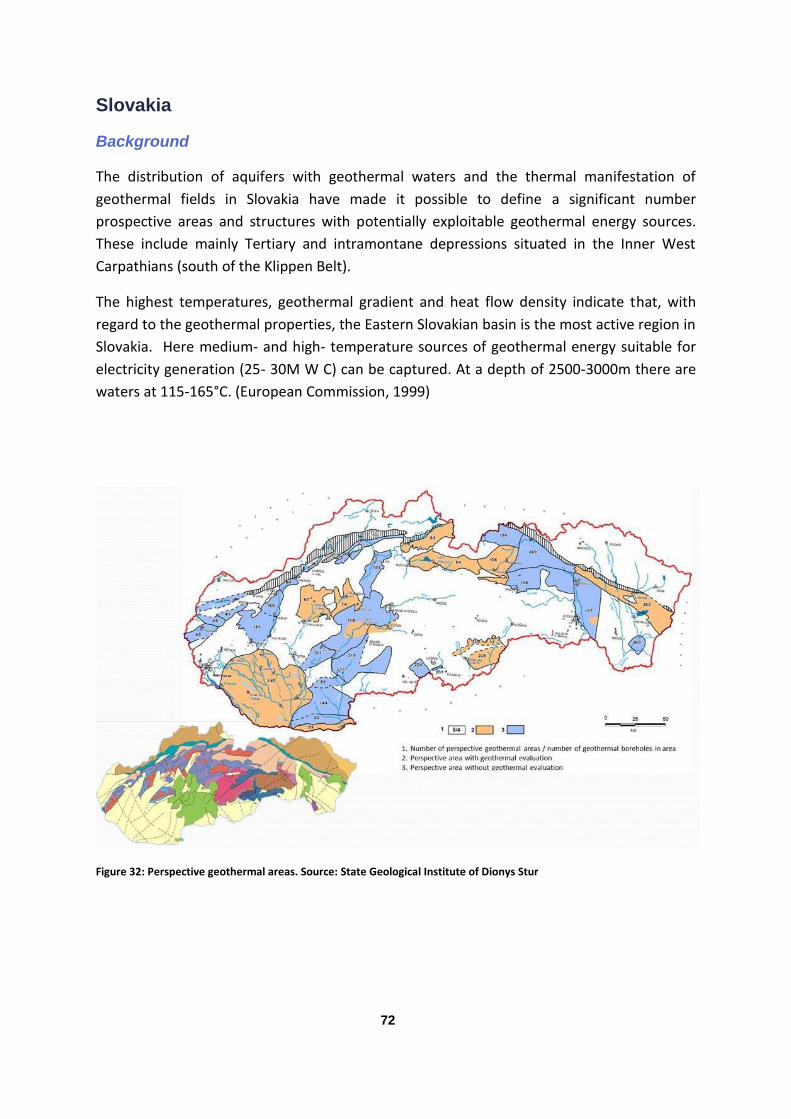
72
Slovakia
Background
The distribution of aquifers with geothermal waters and the thermal manifestation of
geothermal fields in Slovakia have made it possible to define a significant number
prospective areas and structures with potentially exploitable geothermal energy sources.
These include mainly Tertiary and intramontane depressions situated in the Inner West
Carpathians (south of the Klippen Belt).
The highest temperatures, geothermal gradient and heat flow density indicate that, with
regard to the geothermal properties, the Eastern Slovakian basin is the most active region in
Slovakia. Here medium- and high- temperature sources of geothermal energy suitable for
electricity generation (25- 30M W C) can be captured. At a depth of 2500-3000m there are
waters at 115-165°C. (European Commission, 1999)
Figure 32: Perspective geothermal areas. Source: State Geological Institute of Dionys Stur
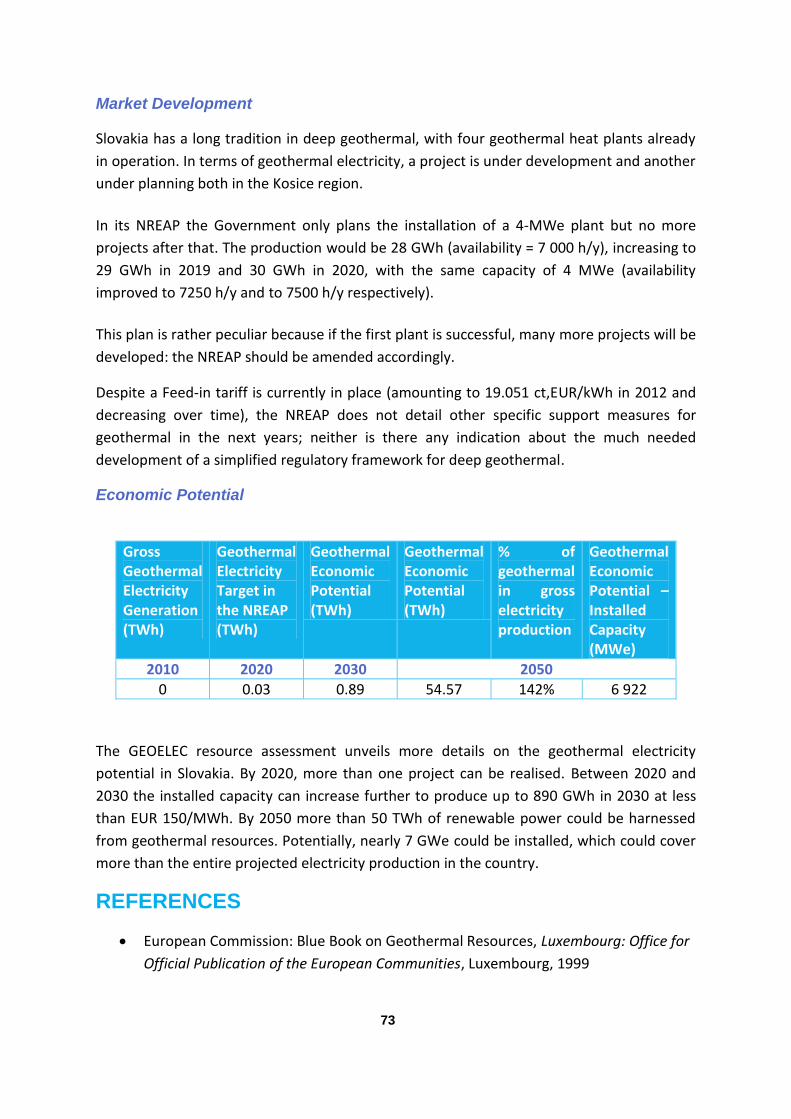
73
Market Development
Slovakia has a long tradition in deep geothermal, with four geothermal heat plants already
in operation. In terms of geothermal electricity, a project is under development and another
under planning both in the Kosice region.
In its NREAP the Government only plans the installation of a 4-MWe plant but no more
projects after that. The production would be 28 GWh (availability = 7 000 h/y), increasing to
29 GWh in 2019 and 30 GWh in 2020, with the same capacity of 4 MWe (availability
improved to 7250 h/y and to 7500 h/y respectively).
This plan is rather peculiar because if the first plant is successful, many more projects will be
developed: the NREAP should be amended accordingly.
Despite a Feed-in tariff is currently in place (amounting to 19.051 ct,EUR/kWh in 2012 and
decreasing over time), the NREAP does not detail other specific support measures for
geothermal in the next years; neither is there any indication about the much needed
development of a simplified regulatory framework for deep geothermal.
Economic Potential
Gross Geothermal Electricity Generation (TWh)
Geothermal Electricity Target in the NREAP (TWh)
Geothermal Economic Potential (TWh)
Geothermal Economic Potential (TWh)
% of geothermal in gross electricity production
Geothermal Economic Potential – Installed Capacity (MWe)
2010 2020 2030 2050
0 0.03 0.89 54.57 142% 6 922
The GEOELEC resource assessment unveils more details on the geothermal electricity
potential in Slovakia. By 2020, more than one project can be realised. Between 2020 and
2030 the installed capacity can increase further to produce up to 890 GWh in 2030 at less
than EUR 150/MWh. By 2050 more than 50 TWh of renewable power could be harnessed
from geothermal resources. Potentially, nearly 7 GWe could be installed, which could cover
more than the entire projected electricity production in the country.
REFERENCES
European Commission: Blue Book on Geothermal Resources, Luxembourg: Office for
Official Publication of the European Communities, Luxembourg, 1999
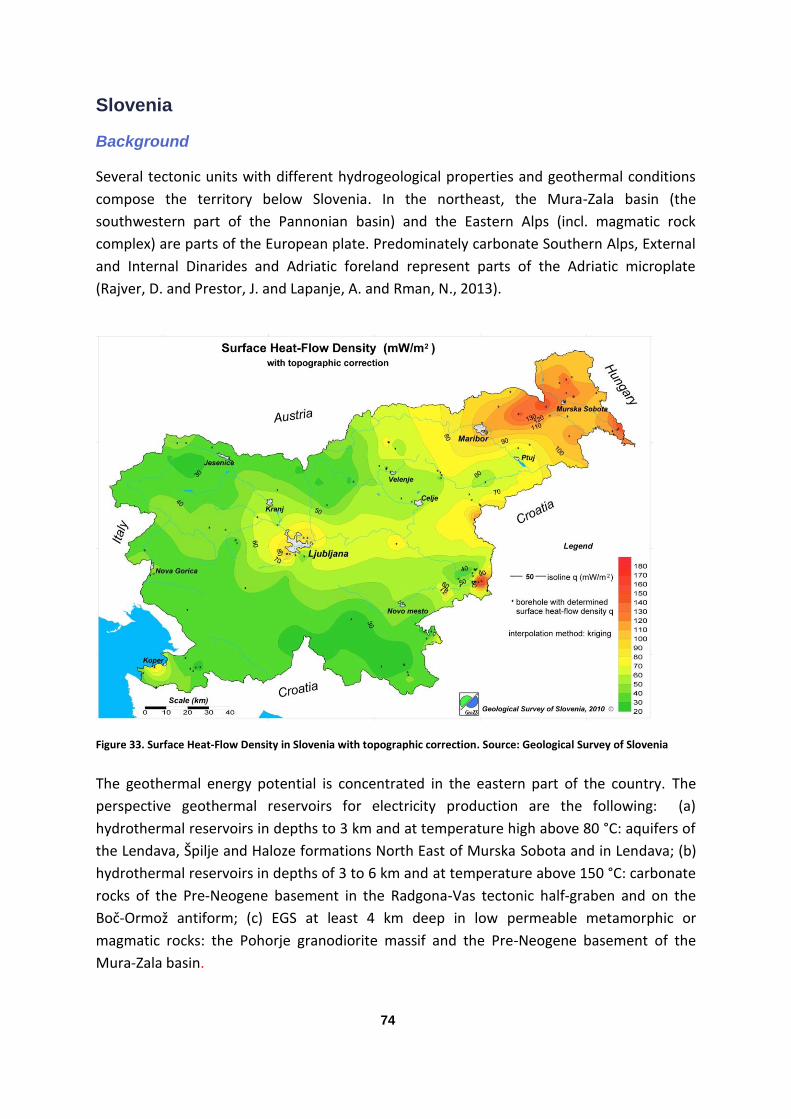
74
Slovenia
Background
Several tectonic units with different hydrogeological properties and geothermal conditions
compose the territory below Slovenia. In the northeast, the Mura-Zala basin (the
southwestern part of the Pannonian basin) and the Eastern Alps (incl. magmatic rock
complex) are parts of the European plate. Predominately carbonate Southern Alps, External
and Internal Dinarides and Adriatic foreland represent parts of the Adriatic microplate
(Rajver, D. and Prestor, J. and Lapanje, A. and Rman, N., 2013).
Figure 33. Surface Heat-Flow Density in Slovenia with topographic correction. Source: Geological Survey of Slovenia
The geothermal energy potential is concentrated in the eastern part of the country. The
perspective geothermal reservoirs for electricity production are the following: (a)
hydrothermal reservoirs in depths to 3 km and at temperature high above 80 °C: aquifers of
the Lendava, Špilje and Haloze formations North East of Murska Sobota and in Lendava; (b)
hydrothermal reservoirs in depths of 3 to 6 km and at temperature above 150 °C: carbonate
rocks of the Pre-Neogene basement in the Radgona-Vas tectonic half-graben and on the
Boč-Ormož antiform; (c) EGS at least 4 km deep in low permeable metamorphic or
magmatic rocks: the Pohorje granodiorite massif and the Pre-Neogene basement of the
Mura-Zala basin.
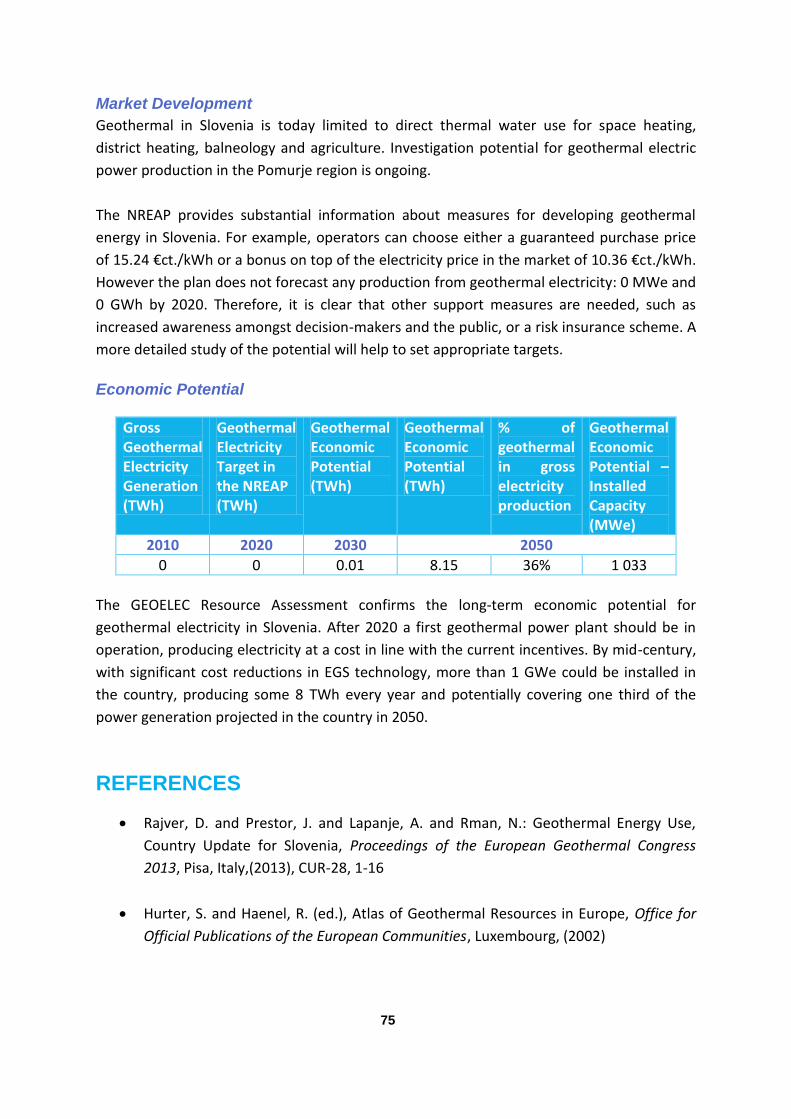
75
Market Development
Geothermal in Slovenia is today limited to direct thermal water use for space heating,
district heating, balneology and agriculture. Investigation potential for geothermal electric
power production in the Pomurje region is ongoing.
The NREAP provides substantial information about measures for developing geothermal
energy in Slovenia. For example, operators can choose either a guaranteed purchase price
of 15.24 €ct./kWh or a bonus on top of the electricity price in the market of 10.36 €ct./kWh.
However the plan does not forecast any production from geothermal electricity: 0 MWe and
0 GWh by 2020. Therefore, it is clear that other support measures are needed, such as
increased awareness amongst decision-makers and the public, or a risk insurance scheme. A
more detailed study of the potential will help to set appropriate targets.
Economic Potential
Gross Geothermal Electricity Generation (TWh)
Geothermal Electricity Target in the NREAP (TWh)
Geothermal Economic Potential (TWh)
Geothermal Economic Potential (TWh)
% of geothermal in gross electricity production
Geothermal Economic Potential – Installed Capacity (MWe)
2010 2020 2030 2050
0 0 0.01 8.15 36% 1 033
The GEOELEC Resource Assessment confirms the long-term economic potential for
geothermal electricity in Slovenia. After 2020 a first geothermal power plant should be in
operation, producing electricity at a cost in line with the current incentives. By mid-century,
with significant cost reductions in EGS technology, more than 1 GWe could be installed in
the country, producing some 8 TWh every year and potentially covering one third of the
power generation projected in the country in 2050.
REFERENCES
Rajver, D. and Prestor, J. and Lapanje, A. and Rman, N.: Geothermal Energy Use,
Country Update for Slovenia, Proceedings of the European Geothermal Congress
2013, Pisa, Italy,(2013), CUR-28, 1-16
Hurter, S. and Haenel, R. (ed.), Atlas of Geothermal Resources in Europe, Office for
Official Publications of the European Communities, Luxembourg, (2002)
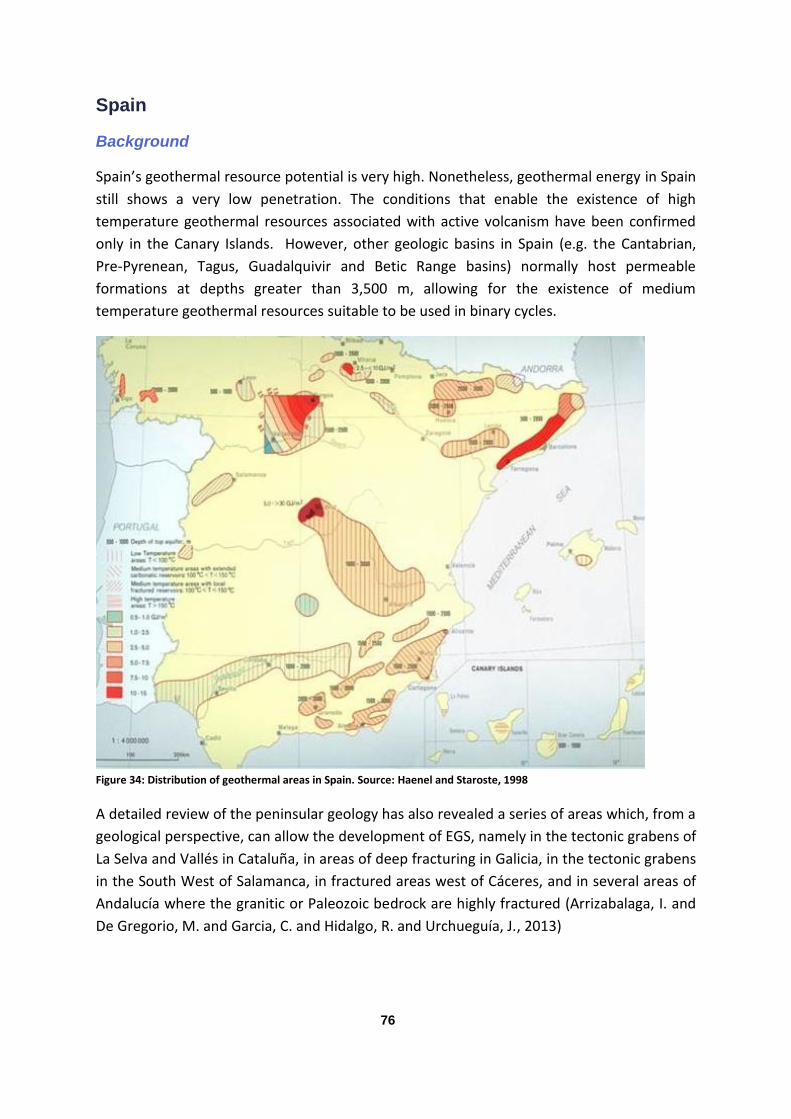
76
Spain
Background
Spain’s geothermal resource potential is very high. Nonetheless, geothermal energy in Spain
still shows a very low penetration. The conditions that enable the existence of high
temperature geothermal resources associated with active volcanism have been confirmed
only in the Canary Islands. However, other geologic basins in Spain (e.g. the Cantabrian,
Pre-Pyrenean, Tagus, Guadalquivir and Betic Range basins) normally host permeable
formations at depths greater than 3,500 m, allowing for the existence of medium
temperature geothermal resources suitable to be used in binary cycles.
Figure 34: Distribution of geothermal areas in Spain. Source: Haenel and Staroste, 1998
A detailed review of the peninsular geology has also revealed a series of areas which, from a
geological perspective, can allow the development of EGS, namely in the tectonic grabens of
La Selva and Vallés in Cataluña, in areas of deep fracturing in Galicia, in the tectonic grabens
in the South West of Salamanca, in fractured areas west of Cáceres, and in several areas of
Andalucía where the granitic or Paleozoic bedrock are highly fractured (Arrizabalaga, I. and
De Gregorio, M. and Garcia, C. and Hidalgo, R. and Urchueguía, J., 2013)
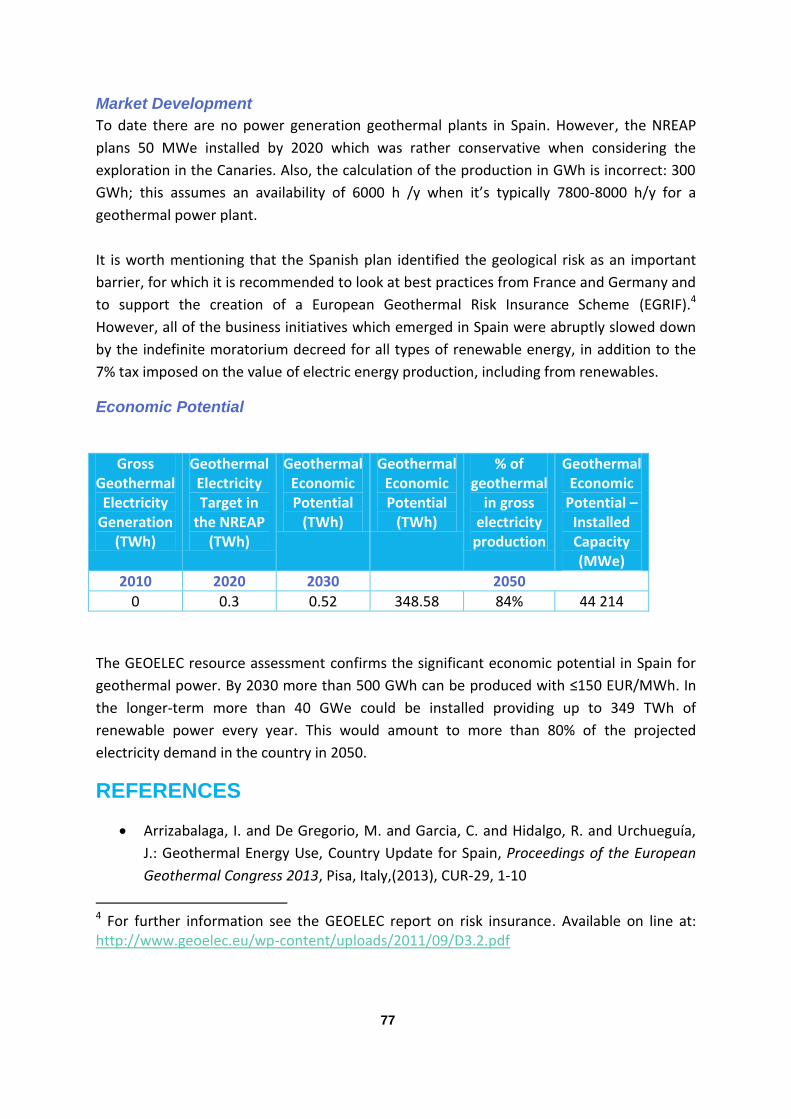
77
Market Development
To date there are no power generation geothermal plants in Spain. However, the NREAP
plans 50 MWe installed by 2020 which was rather conservative when considering the
exploration in the Canaries. Also, the calculation of the production in GWh is incorrect: 300
GWh; this assumes an availability of 6000 h /y when it’s typically 7800-8000 h/y for a
geothermal power plant.
It is worth mentioning that the Spanish plan identified the geological risk as an important
barrier, for which it is recommended to look at best practices from France and Germany and
to support the creation of a European Geothermal Risk Insurance Scheme (EGRIF).4
However, all of the business initiatives which emerged in Spain were abruptly slowed down
by the indefinite moratorium decreed for all types of renewable energy, in addition to the
7% tax imposed on the value of electric energy production, including from renewables.
Economic Potential
Gross Geothermal Electricity
Generation (TWh)
Geothermal Electricity Target in
the NREAP (TWh)
Geothermal Economic Potential
(TWh)
Geothermal Economic Potential
(TWh)
% of geothermal
in gross electricity
production
Geothermal Economic
Potential – Installed Capacity (MWe)
2010 2020 2030 2050
0 0.3 0.52 348.58 84% 44 214
The GEOELEC resource assessment confirms the significant economic potential in Spain for
geothermal power. By 2030 more than 500 GWh can be produced with ≤150 EUR/MWh. In
the longer-term more than 40 GWe could be installed providing up to 349 TWh of
renewable power every year. This would amount to more than 80% of the projected
electricity demand in the country in 2050.
REFERENCES
Arrizabalaga, I. and De Gregorio, M. and Garcia, C. and Hidalgo, R. and Urchueguía,
J.: Geothermal Energy Use, Country Update for Spain, Proceedings of the European
Geothermal Congress 2013, Pisa, Italy,(2013), CUR-29, 1-10
4 For further information see the GEOELEC report on risk insurance. Available on line at: http://www.geoelec.eu/wp-content/uploads/2011/09/D3.2.pdf
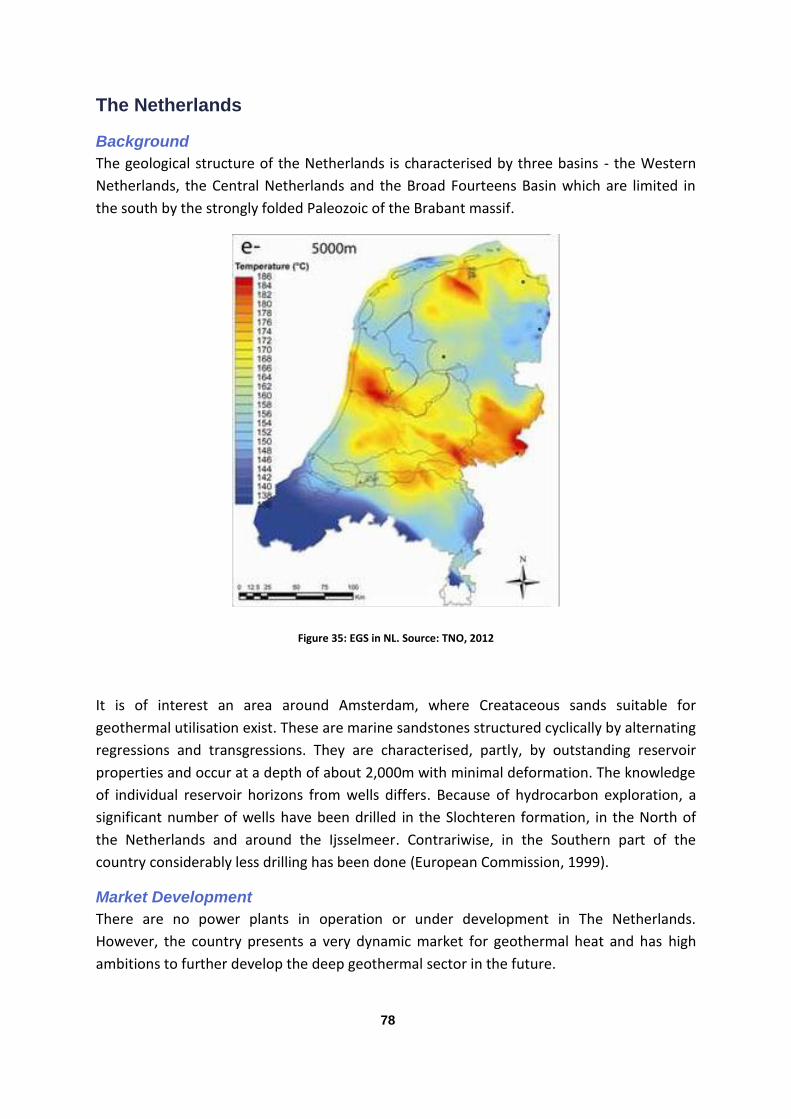
78
The Netherlands
Background
The geological structure of the Netherlands is characterised by three basins - the Western
Netherlands, the Central Netherlands and the Broad Fourteens Basin which are limited in
the south by the strongly folded Paleozoic of the Brabant massif.
Figure 35: EGS in NL. Source: TNO, 2012
It is of interest an area around Amsterdam, where Creataceous sands suitable for
geothermal utilisation exist. These are marine sandstones structured cyclically by alternating
regressions and transgressions. They are characterised, partly, by outstanding reservoir
properties and occur at a depth of about 2,000m with minimal deformation. The knowledge
of individual reservoir horizons from wells differs. Because of hydrocarbon exploration, a
significant number of wells have been drilled in the Slochteren formation, in the North of
the Netherlands and around the Ijsselmeer. Contrariwise, in the Southern part of the
country considerably less drilling has been done (European Commission, 1999).
Market Development
There are no power plants in operation or under development in The Netherlands.
However, the country presents a very dynamic market for geothermal heat and has high
ambitions to further develop the deep geothermal sector in the future.
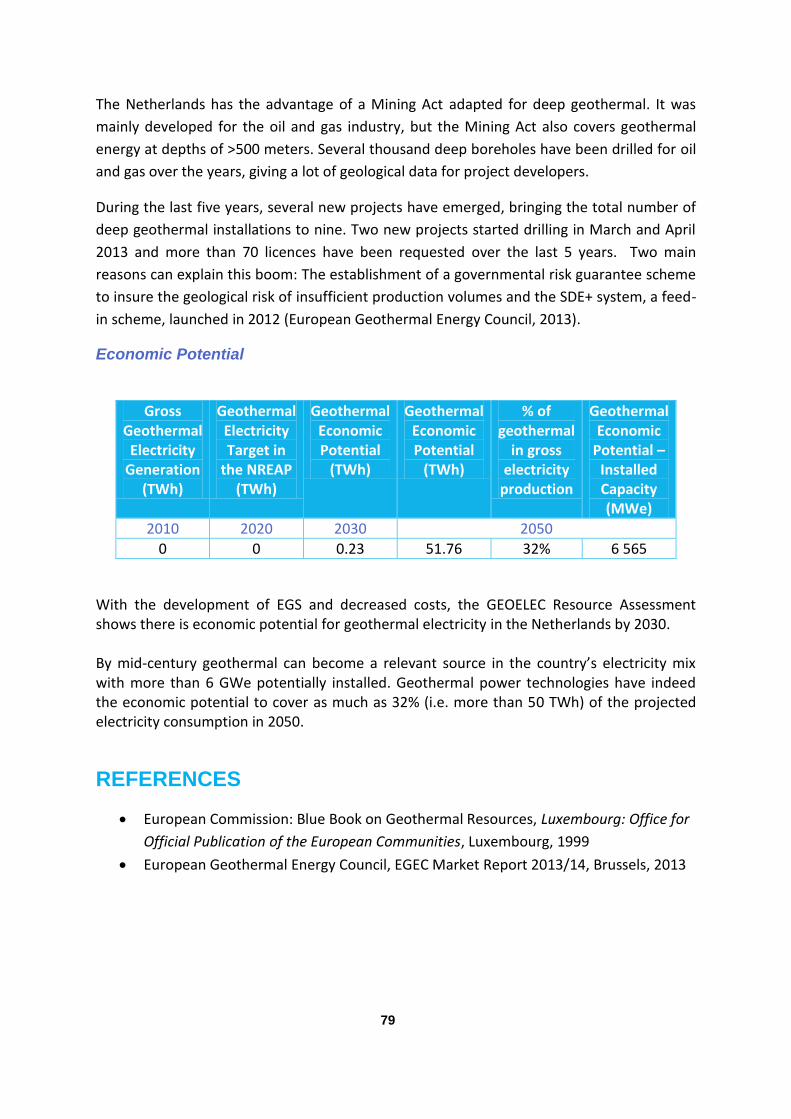
79
The Netherlands has the advantage of a Mining Act adapted for deep geothermal. It was
mainly developed for the oil and gas industry, but the Mining Act also covers geothermal
energy at depths of >500 meters. Several thousand deep boreholes have been drilled for oil
and gas over the years, giving a lot of geological data for project developers.
During the last five years, several new projects have emerged, bringing the total number of
deep geothermal installations to nine. Two new projects started drilling in March and April
2013 and more than 70 licences have been requested over the last 5 years. Two main
reasons can explain this boom: The establishment of a governmental risk guarantee scheme
to insure the geological risk of insufficient production volumes and the SDE+ system, a feed-
in scheme, launched in 2012 (European Geothermal Energy Council, 2013).
Economic Potential
Gross Geothermal Electricity
Generation (TWh)
Geothermal Electricity Target in
the NREAP (TWh)
Geothermal Economic Potential
(TWh)
Geothermal Economic Potential
(TWh)
% of geothermal
in gross electricity
production
Geothermal Economic
Potential – Installed Capacity (MWe)
2010 2020 2030 2050
0 0 0.23 51.76 32% 6 565
With the development of EGS and decreased costs, the GEOELEC Resource Assessment shows there is economic potential for geothermal electricity in the Netherlands by 2030. By mid-century geothermal can become a relevant source in the country’s electricity mix with more than 6 GWe potentially installed. Geothermal power technologies have indeed the economic potential to cover as much as 32% (i.e. more than 50 TWh) of the projected electricity consumption in 2050.
REFERENCES
European Commission: Blue Book on Geothermal Resources, Luxembourg: Office for
Official Publication of the European Communities, Luxembourg, 1999
European Geothermal Energy Council, EGEC Market Report 2013/14, Brussels, 2013
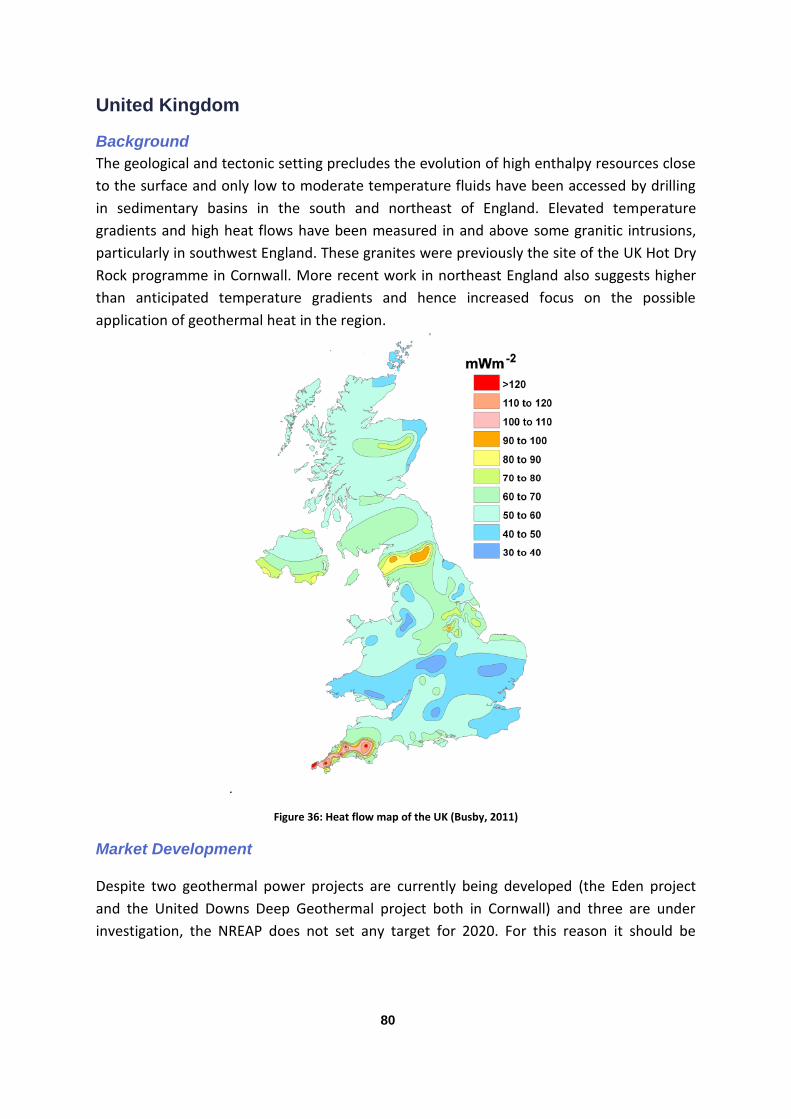
80
United Kingdom
Background
The geological and tectonic setting precludes the evolution of high enthalpy resources close
to the surface and only low to moderate temperature fluids have been accessed by drilling
in sedimentary basins in the south and northeast of England. Elevated temperature
gradients and high heat flows have been measured in and above some granitic intrusions,
particularly in southwest England. These granites were previously the site of the UK Hot Dry
Rock programme in Cornwall. More recent work in northeast England also suggests higher
than anticipated temperature gradients and hence increased focus on the possible
application of geothermal heat in the region.
.
Figure 36: Heat flow map of the UK (Busby, 2011)
Market Development
Despite two geothermal power projects are currently being developed (the Eden project
and the United Downs Deep Geothermal project both in Cornwall) and three are under
investigation, the NREAP does not set any target for 2020. For this reason it should be
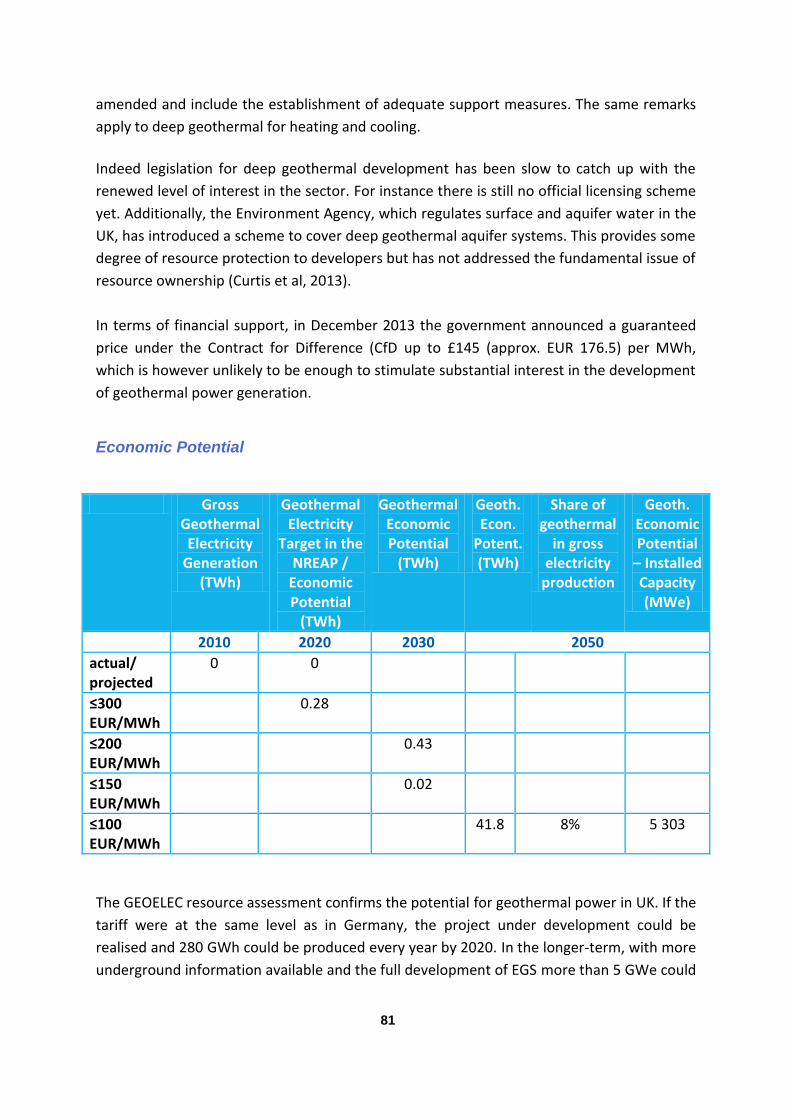
81
amended and include the establishment of adequate support measures. The same remarks
apply to deep geothermal for heating and cooling.
Indeed legislation for deep geothermal development has been slow to catch up with the
renewed level of interest in the sector. For instance there is still no official licensing scheme
yet. Additionally, the Environment Agency, which regulates surface and aquifer water in the
UK, has introduced a scheme to cover deep geothermal aquifer systems. This provides some
degree of resource protection to developers but has not addressed the fundamental issue of
resource ownership (Curtis et al, 2013).
In terms of financial support, in December 2013 the government announced a guaranteed
price under the Contract for Difference (CfD up to £145 (approx. EUR 176.5) per MWh,
which is however unlikely to be enough to stimulate substantial interest in the development
of geothermal power generation.
Economic Potential
Gross Geothermal Electricity
Generation (TWh)
Geothermal Electricity
Target in the NREAP /
Economic Potential
(TWh)
Geothermal Economic Potential
(TWh)
Geoth. Econ.
Potent. (TWh)
Share of geothermal
in gross electricity
production
Geoth. Economic Potential
– Installed Capacity (MWe)
2010 2020 2030 2050
actual/ projected
0 0
≤300 EUR/MWh
0.28
≤200 EUR/MWh
0.43
≤150 EUR/MWh
0.02
≤100 EUR/MWh
41.8 8% 5 303
The GEOELEC resource assessment confirms the potential for geothermal power in UK. If the
tariff were at the same level as in Germany, the project under development could be
realised and 280 GWh could be produced every year by 2020. In the longer-term, with more
underground information available and the full development of EGS more than 5 GWe could

82
be installed providing as much as 42 TWh of renewable base-load power every year. This
would amount to 8% of the projected electricity demand in the country in 2050.
REFERENCES
Busby, J.P and Dunbabin, P.: United Kingdom National Activities, in Annual Report 2011, International Energy Agency Implementing Agreement for Cooperation in Geothermal Research & Technology, (2011)
Curtis, R. and Ledingham, P. and Law, R. and Bennett, T: Geothermal Energy Use,
Country Update for United Kingdom, Proceedings of the European Geothermal
Congress 2013, Pisa, Italy,(2013), CUR-33, 1-9
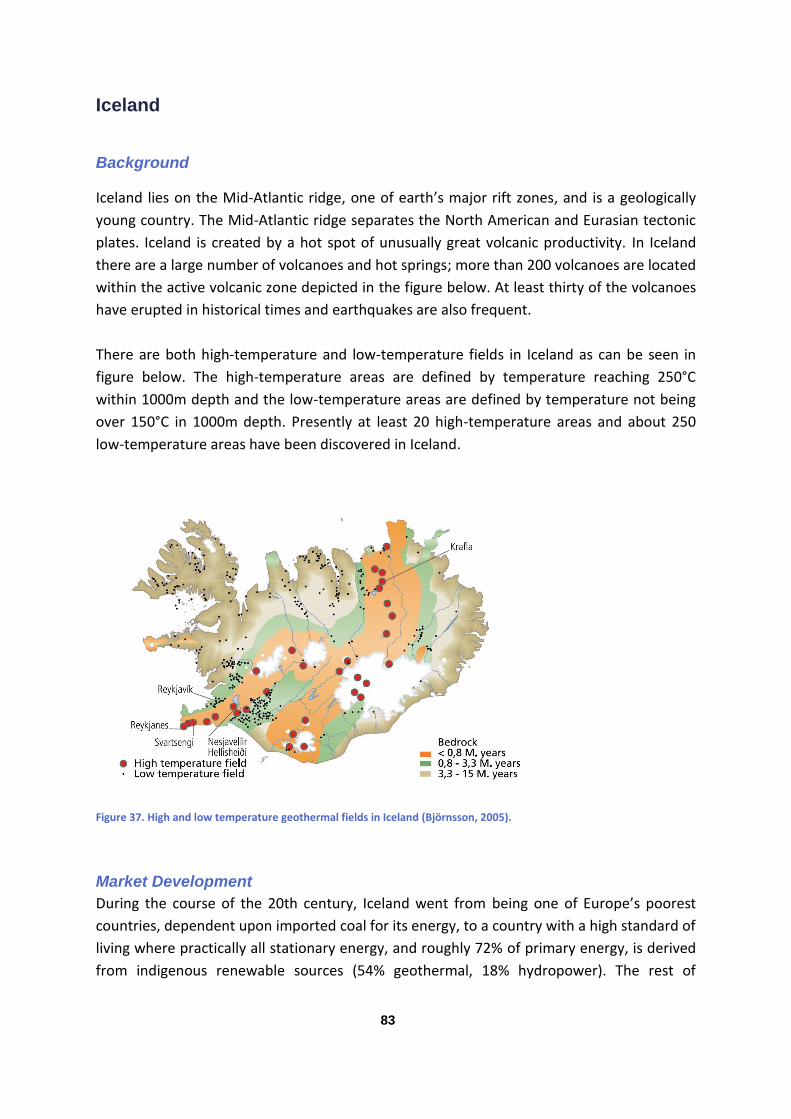
83
Iceland
Background
Iceland lies on the Mid-Atlantic ridge, one of earth’s major rift zones, and is a geologically
young country. The Mid-Atlantic ridge separates the North American and Eurasian tectonic
plates. Iceland is created by a hot spot of unusually great volcanic productivity. In Iceland
there are a large number of volcanoes and hot springs; more than 200 volcanoes are located
within the active volcanic zone depicted in the figure below. At least thirty of the volcanoes
have erupted in historical times and earthquakes are also frequent.
There are both high-temperature and low-temperature fields in Iceland as can be seen in
figure below. The high-temperature areas are defined by temperature reaching 250°C
within 1000m depth and the low-temperature areas are defined by temperature not being
over 150°C in 1000m depth. Presently at least 20 high-temperature areas and about 250
low-temperature areas have been discovered in Iceland.
Figure 37. High and low temperature geothermal fields in Iceland (Björnsson, 2005).
Market Development
During the course of the 20th century, Iceland went from being one of Europe’s poorest
countries, dependent upon imported coal for its energy, to a country with a high standard of
living where practically all stationary energy, and roughly 72% of primary energy, is derived
from indigenous renewable sources (54% geothermal, 18% hydropower). The rest of
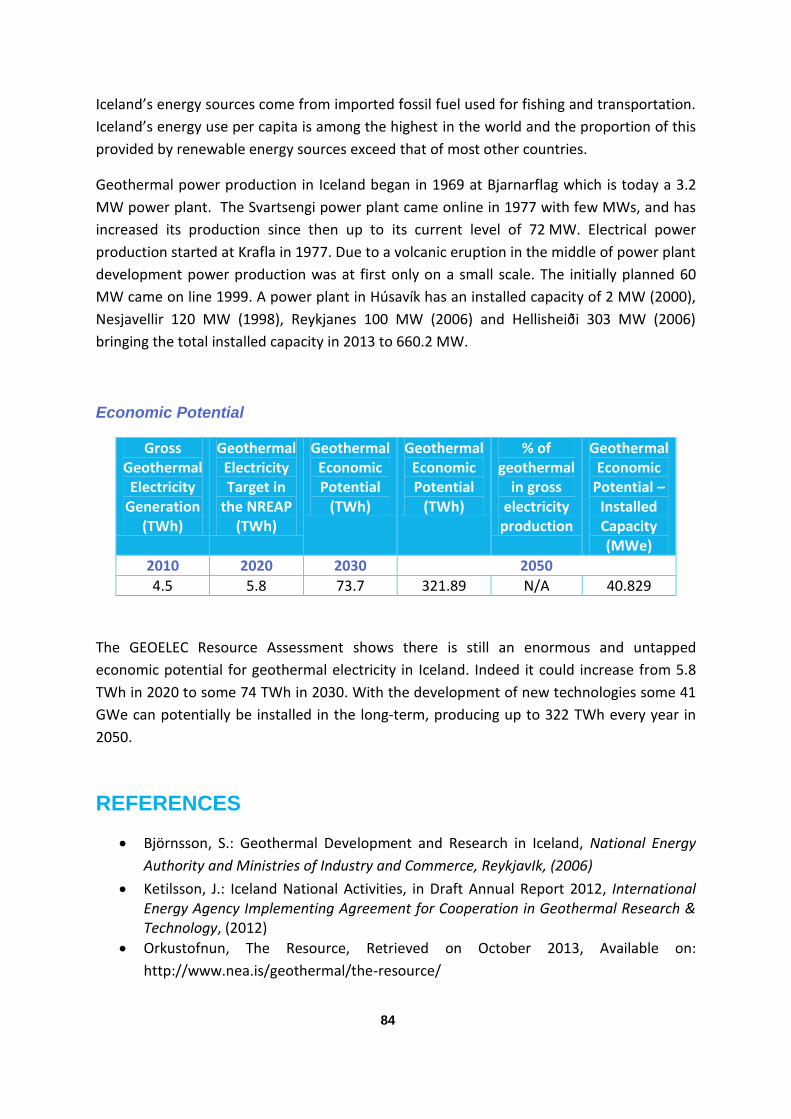
84
Iceland’s energy sources come from imported fossil fuel used for fishing and transportation.
Iceland’s energy use per capita is among the highest in the world and the proportion of this
provided by renewable energy sources exceed that of most other countries.
Geothermal power production in Iceland began in 1969 at Bjarnarflag which is today a 3.2
MW power plant. The Svartsengi power plant came online in 1977 with few MWs, and has
increased its production since then up to its current level of 72 MW. Electrical power
production started at Krafla in 1977. Due to a volcanic eruption in the middle of power plant
development power production was at first only on a small scale. The initially planned 60
MW came on line 1999. A power plant in Húsavík has an installed capacity of 2 MW (2000),
Nesjavellir 120 MW (1998), Reykjanes 100 MW (2006) and Hellisheiði 303 MW (2006)
bringing the total installed capacity in 2013 to 660.2 MW.
Economic Potential
Gross Geothermal Electricity
Generation (TWh)
Geothermal Electricity Target in
the NREAP (TWh)
Geothermal Economic Potential
(TWh)
Geothermal Economic Potential
(TWh)
% of geothermal
in gross electricity
production
Geothermal Economic
Potential – Installed Capacity (MWe)
2010 2020 2030 2050
4.5 5.8 73.7 321.89 N/A 40.829
The GEOELEC Resource Assessment shows there is still an enormous and untapped
economic potential for geothermal electricity in Iceland. Indeed it could increase from 5.8
TWh in 2020 to some 74 TWh in 2030. With the development of new technologies some 41
GWe can potentially be installed in the long-term, producing up to 322 TWh every year in
2050.
REFERENCES
Björnsson, S.: Geothermal Development and Research in Iceland, National Energy
Authority and Ministries of Industry and Commerce, ReykjavIk, (2006)
Ketilsson, J.: Iceland National Activities, in Draft Annual Report 2012, International Energy Agency Implementing Agreement for Cooperation in Geothermal Research & Technology, (2012)
Orkustofnun, The Resource, Retrieved on October 2013, Available on:
http://www.nea.is/geothermal/the-resource/
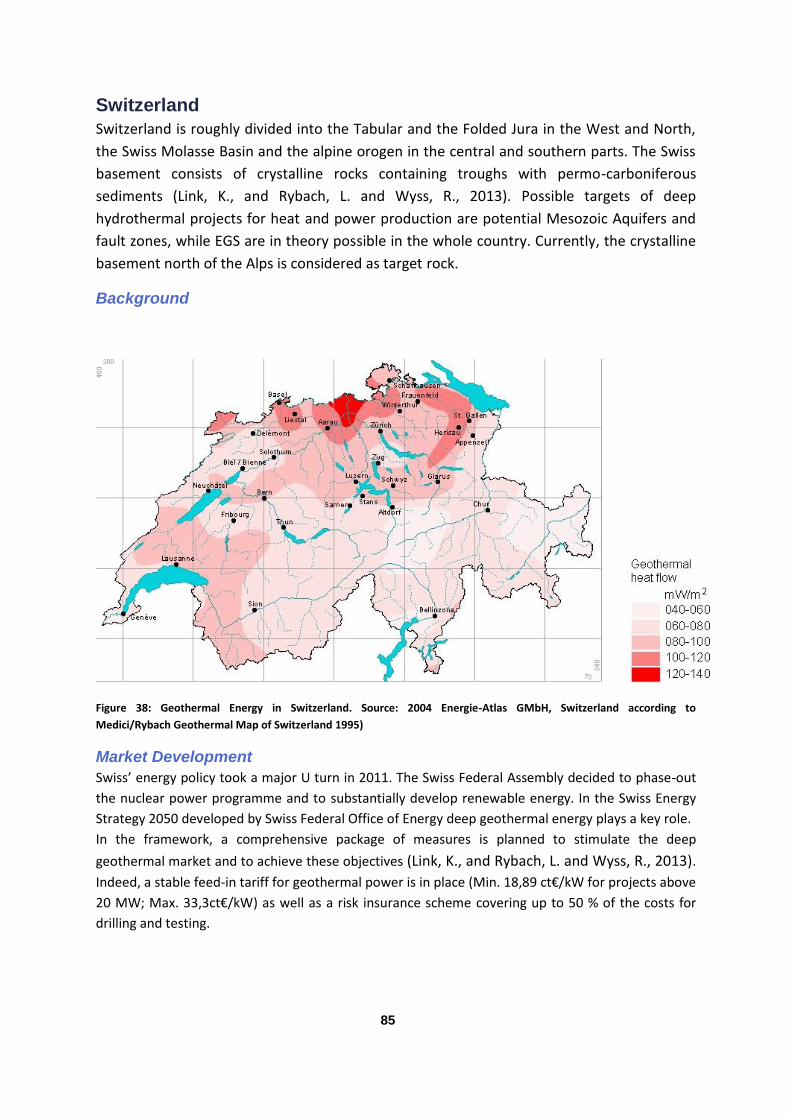
85
Switzerland
Switzerland is roughly divided into the Tabular and the Folded Jura in the West and North,
the Swiss Molasse Basin and the alpine orogen in the central and southern parts. The Swiss
basement consists of crystalline rocks containing troughs with permo-carboniferous
sediments (Link, K., and Rybach, L. and Wyss, R., 2013). Possible targets of deep
hydrothermal projects for heat and power production are potential Mesozoic Aquifers and
fault zones, while EGS are in theory possible in the whole country. Currently, the crystalline
basement north of the Alps is considered as target rock.
Background
Figure 38: Geothermal Energy in Switzerland. Source: 2004 Energie-Atlas GMbH, Switzerland according to
Medici/Rybach Geothermal Map of Switzerland 1995)
Market Development
Swiss’ energy policy took a major U turn in 2011. The Swiss Federal Assembly decided to phase-out
the nuclear power programme and to substantially develop renewable energy. In the Swiss Energy
Strategy 2050 developed by Swiss Federal Office of Energy deep geothermal energy plays a key role.
In the framework, a comprehensive package of measures is planned to stimulate the deep
geothermal market and to achieve these objectives (Link, K., and Rybach, L. and Wyss, R., 2013).
Indeed, a stable feed-in tariff for geothermal power is in place (Min. 18,89 ct€/kW for projects above
20 MW; Max. 33,3ct€/kW) as well as a risk insurance scheme covering up to 50 % of the costs for
drilling and testing.
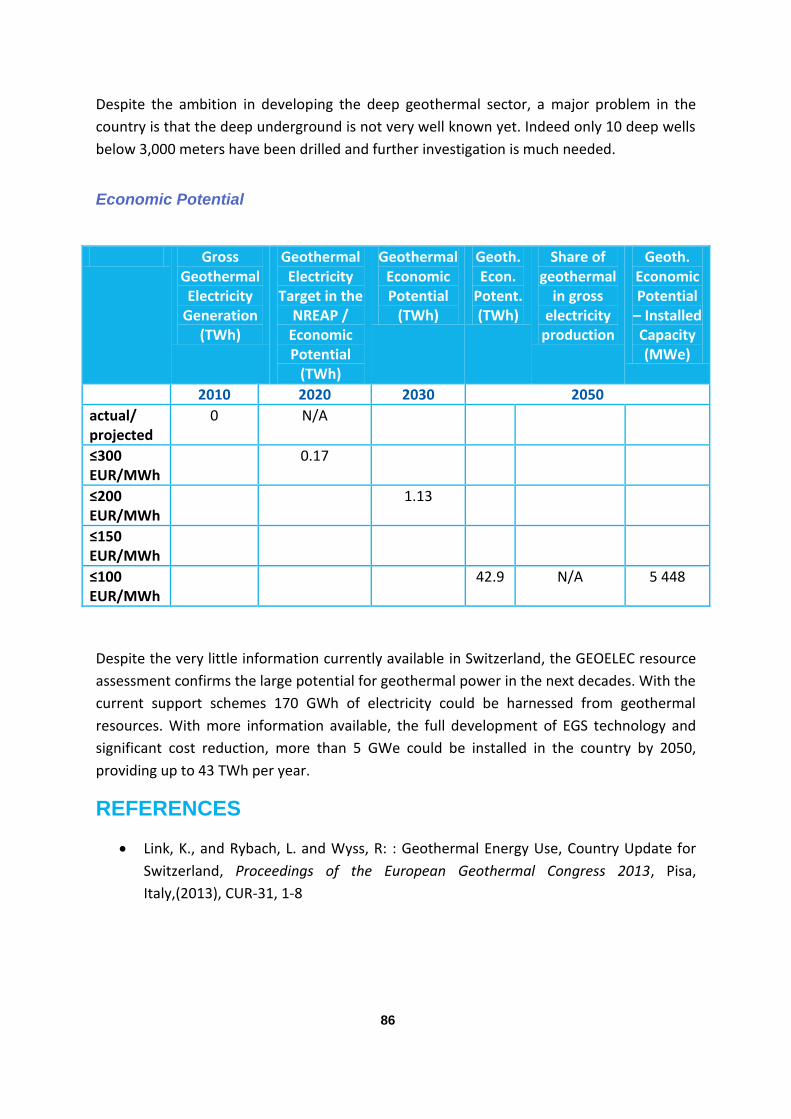
86
Despite the ambition in developing the deep geothermal sector, a major problem in the
country is that the deep underground is not very well known yet. Indeed only 10 deep wells
below 3,000 meters have been drilled and further investigation is much needed.
Economic Potential
Gross Geothermal Electricity
Generation (TWh)
Geothermal Electricity
Target in the NREAP /
Economic Potential
(TWh)
Geothermal Economic Potential
(TWh)
Geoth. Econ.
Potent. (TWh)
Share of geothermal
in gross electricity
production
Geoth. Economic Potential
– Installed Capacity (MWe)
2010 2020 2030 2050
actual/ projected
0 N/A
≤300 EUR/MWh
0.17
≤200 EUR/MWh
1.13
≤150 EUR/MWh
≤100 EUR/MWh
42.9 N/A 5 448
Despite the very little information currently available in Switzerland, the GEOELEC resource
assessment confirms the large potential for geothermal power in the next decades. With the
current support schemes 170 GWh of electricity could be harnessed from geothermal
resources. With more information available, the full development of EGS technology and
significant cost reduction, more than 5 GWe could be installed in the country by 2050,
providing up to 43 TWh per year.
REFERENCES
Link, K., and Rybach, L. and Wyss, R: : Geothermal Energy Use, Country Update for
Switzerland, Proceedings of the European Geothermal Congress 2013, Pisa,
Italy,(2013), CUR-31, 1-8
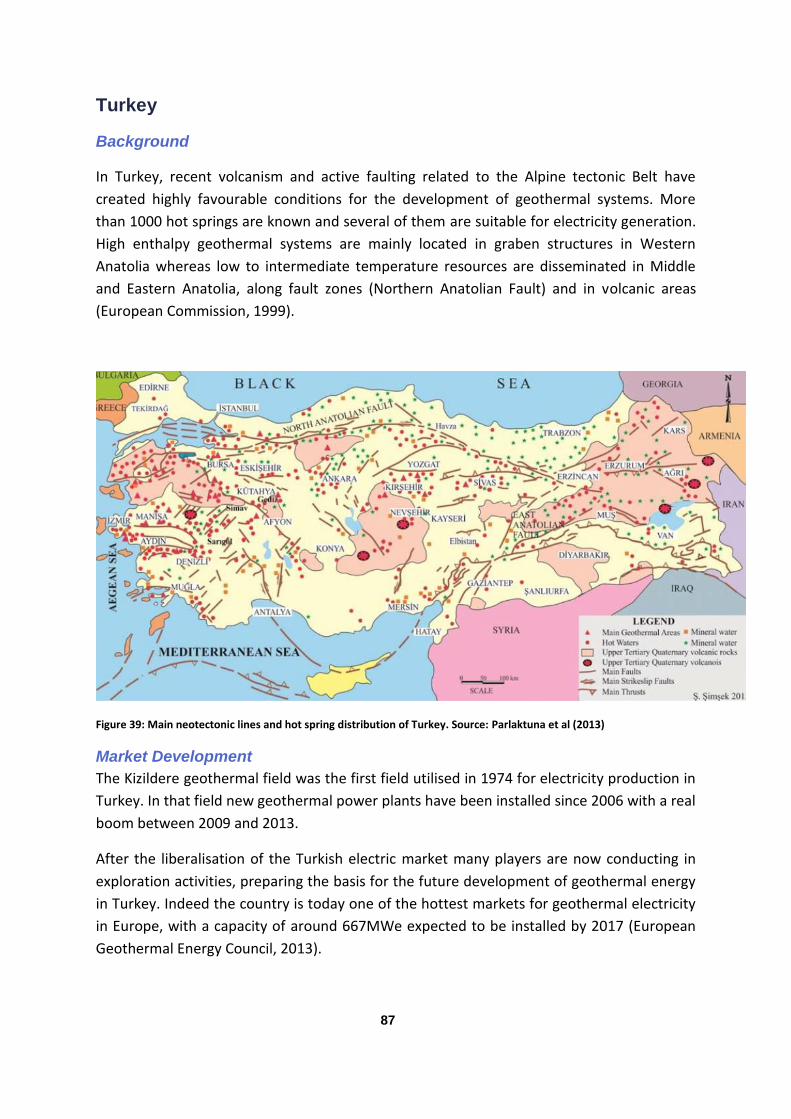
87
Turkey
Background
In Turkey, recent volcanism and active faulting related to the Alpine tectonic Belt have
created highly favourable conditions for the development of geothermal systems. More
than 1000 hot springs are known and several of them are suitable for electricity generation.
High enthalpy geothermal systems are mainly located in graben structures in Western
Anatolia whereas low to intermediate temperature resources are disseminated in Middle
and Eastern Anatolia, along fault zones (Northern Anatolian Fault) and in volcanic areas
(European Commission, 1999).
Figure 39: Main neotectonic lines and hot spring distribution of Turkey. Source: Parlaktuna et al (2013)
Market Development
The Kizildere geothermal field was the first field utilised in 1974 for electricity production in
Turkey. In that field new geothermal power plants have been installed since 2006 with a real
boom between 2009 and 2013.
After the liberalisation of the Turkish electric market many players are now conducting in
exploration activities, preparing the basis for the future development of geothermal energy
in Turkey. Indeed the country is today one of the hottest markets for geothermal electricity
in Europe, with a capacity of around 667MWe expected to be installed by 2017 (European
Geothermal Energy Council, 2013).
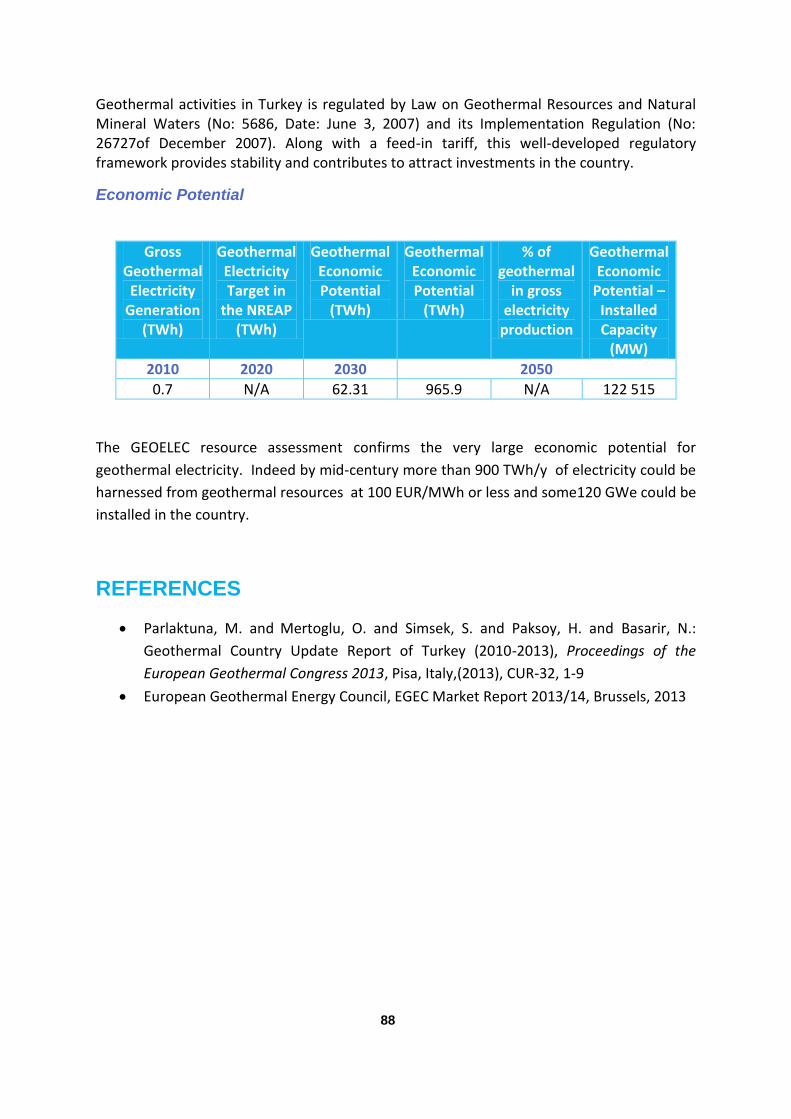
88
Geothermal activities in Turkey is regulated by Law on Geothermal Resources and Natural Mineral Waters (No: 5686, Date: June 3, 2007) and its Implementation Regulation (No: 26727of December 2007). Along with a feed-in tariff, this well-developed regulatory framework provides stability and contributes to attract investments in the country.
Economic Potential
Gross Geothermal Electricity
Generation (TWh)
Geothermal Electricity Target in
the NREAP (TWh)
Geothermal Economic Potential
(TWh)
Geothermal Economic Potential
(TWh)
% of geothermal
in gross electricity
production
Geothermal Economic
Potential – Installed Capacity
(MW)
2010 2020 2030 2050
0.7 N/A 62.31 965.9 N/A 122 515
The GEOELEC resource assessment confirms the very large economic potential for
geothermal electricity. Indeed by mid-century more than 900 TWh/y of electricity could be
harnessed from geothermal resources at 100 EUR/MWh or less and some120 GWe could be
installed in the country.
REFERENCES
Parlaktuna, M. and Mertoglu, O. and Simsek, S. and Paksoy, H. and Basarir, N.:
Geothermal Country Update Report of Turkey (2010-2013), Proceedings of the
European Geothermal Congress 2013, Pisa, Italy,(2013), CUR-32, 1-9
European Geothermal Energy Council, EGEC Market Report 2013/14, Brussels, 2013
89
Recommendations for policy-makers: How to realise the
geothermal electricity potential in Europe
The potential of geothermal energy is recognised by some EU Member States in their
National Renewable Energy Action Plans (NREAPs). However, the actual potential is
significantly larger. In order to increase awareness, GEOELEC has assessed and presented for
the first time the economic potential in Europe in 2020, 2030 and 2050. The figures show
the large potential of geothermal and the important role it can play in the future electricity
mix.
Based on the project results, the GEOELEC consortium puts forward the following
recommendations to realise the potential of geothermal electricity in Europe.
Create conditions to increase awareness about the advantages of this technology
and its potential. National Committees on Geothermal promoting the technology
to decision-makers and engaging the civil society to favour social acceptance
should be established.
The GEOELEC project has paved the way for the creation of national Geothermal
committees across the EU.
Such committee should be established in each EU-28 Member State with the objective of
increasing awareness about geothermal and to ensure public acceptance of the geothermal
projects. This initiative builds on the French experience, where such a Committee has
already been established in July 2010. There, the Energy Ministry launched a ‘Comité
National de la géothermie’ to propose actions and recommendations for a geothermal
development in France. It is composed by 35 members from 5 different sectors: State level,
Local authorities, NGOs, Employers, and Workers. The first results of the Comité National de
la géothermie in France can be presented through 3 key actions:
- Simplifying administrative procedure and quality
- Training professionals
- Disseminating information
In order to progress along the learning curve and deploy at large-scale a reliable
renewable technology, a European EGS flagship programme should be launched,
including new demonstration plants and test laboratories. It should also look at
new technologies, methods and concepts.
EGS is a technology for accessing the heat in hot but impermeable basement rock. Once
fully developed, it will provide a major increase in the geothermal resource base, both for
90
heat and electric power. In spite of its potential and although the basic concepts have been
developed already in the 1980s EGS has not matured yet into a ready-to-implement
technology.
An EGS Flagship program in the EU should be launched for making this technology
competitive at the horizon 2020. Ultimately, this will establish EGS as a technology
applicable almost everywhere for both heat and power production.
At each stage of the EGS development, proven methodologies can be applied and
bottlenecks identified. From this state-of-the-art assessment, priorities encompassing five
main areas have been defined for medium to long term research. The expected outcome
will be geothermal energy in a form that can be widely deployed and competitively priced,
underpinned with reduced capital, operational and maintenance costs. Swift progress (and
continuous improvement) will be pooled with coordinated international R&D efforts, with a
view to successful demonstration and implementation.
- Establish network of complementary 5-10 European EGS test laboratories;
- Develop Demonstration sites in different geological settings and upscale size of the
power plants;
- Launch Training and education programs for new geothermal professionals
specialized in EGS;
- Ensure Public acceptance on micro-seismicity, stimulation, environmental impact,
emissions;
- Towards grid flexibility: Flexible and base load electricity production from EGS plants,
with test on dispatchability, to develop regional flexible electricity systems.
A European Geothermal Risk Insurance Fund (EGRIF) is an innovative option
tailored to the specificities of geothermal to mitigate the cost of the geological risk
and is a complementary tool to operational support, still needed to compensate
for the long-standing lack of a level-playing field.
Financing a geothermal project includes two crucial elements in the initial phase of the
project development: a high capital investment for drilling wells which can take up to 70% of
the total project costs, and an insurance scheme to cover the geological risks.
As pre-drill assessment of geothermal performance is subject to major uncertainty and EGS
is in an embryonic development phase, the risk profile is high compared to alternative
sources of renewable energy. In order to face these challenges the following financial
incentives are required to facilitate growth of geothermal energy in Europe:
91
- Support schemes are crucial tools of public policy for geothermal to
compensate for market failures and to allow the technology to progress
along its learning curve;
- Innovative financing mechanisms should be adapted to the specificities of
geothermal technologies and according to the level of maturity of markets
and technologies;
- The EGRIF is seen as an appealing public support measure for overcoming the
geological risk;
- While designing a support scheme, policy-makers should seek a holistic
approach, which exceeds the LCoE and includes system costs and all
externalities. As an alternative, there is the chance to offer a bonus to
geothermal energy for the benefits it provides to the overall electricity
system, balancing the grid.
Enhance the education and training process, since multidisciplinary expertise and
interaction of several disciplines are necessary. Create Networks for Geothermal
Energy Education and Training involving industrial platforms, Universities and
Research Centres developing a workforce for future geothermal development.
The acceleration in the development of geothermal energy utilisation and the increasing
demand of skilled workforce from industry show the present need for a fast increase in
highly qualified technicians, engineers and specialists. This transition requires the
modification in the existing curricula in different fields of geothermal energy such as basic
research in geothermics, reservoir, drilling, material, power plant, utilisation, economics and
legal aspects:
- Enhancement of the educational and training process is the factor that can have the
largest effect on the long-term needs regarding certain job specialities and skills.
Ensuring the existence of necessary skills in the sector requires action at all levels of
education and training, meaning technical and scientific education, training and
continuous learning. In order to achieve the proper education reforms, cooperation
between all organisations involved is required;
- Cooperation between education and training institutes and companies is also
necessary to create a network allowing for a faster and more efficient satisfaction of
the needs generated in the labour market, while students are provided with the
appropriate skills and knowledge.
Establish a geothermal industry and align energy and industrial policies,
complemented by corresponding social and educational policies.
92
Geothermal can contribute to the development of the local economy and create local jobs.
In 2013, there were 2500-3000 jobs directly related to geothermal electricity in the EU-28,
while the estimated total number amounts to 10,000 jobs. The industry could employ more
than 100.000 people by 2030 (exploration, drilling, construction, and manufacturing), based
on projects under development and under investigation.
Over the last few years little new installed capacity has caused a concentration of jobs
mainly in O&M, traditionally requiring only a few workers. The development of a significant
number of new projects will trigger a real boom in labour-intensive activities such as
exploration, drilling, construction and manufacturing.
The potential of the geothermal power industry can be achieved only through the
attraction, retention and renewal of the workforce. Companies and organisations need to
team up to universities and research centres to shape and have access to the highly skilled
workforce they need.
- Absorb workforce of declining industries: several opportunities exist in the
geothermal sector for employing workers from sectors in decline such as the
coal sector. Professions concerned are in geosciences, drilling and thermal
power plants sectors. Regional and national governments should make use of
EU funds available to facilitate the requalification of workers from declining
industries and ought to align, to the largest extent possible, their active
labour policies to energy and industrial strategies.
- Promote mobility of workers in Europe: the knowledge and expertise on deep
geothermal is concentrated today. There is the need to create conditions for
more cooperation and exchange between juvenile and more mature markets.
- Launch international cooperation especially on EGS: the EGS flagship
programme could integrate an international dimension to exchange
experiences and technologies and exploring export opportunities of the
European know-how on EGS.
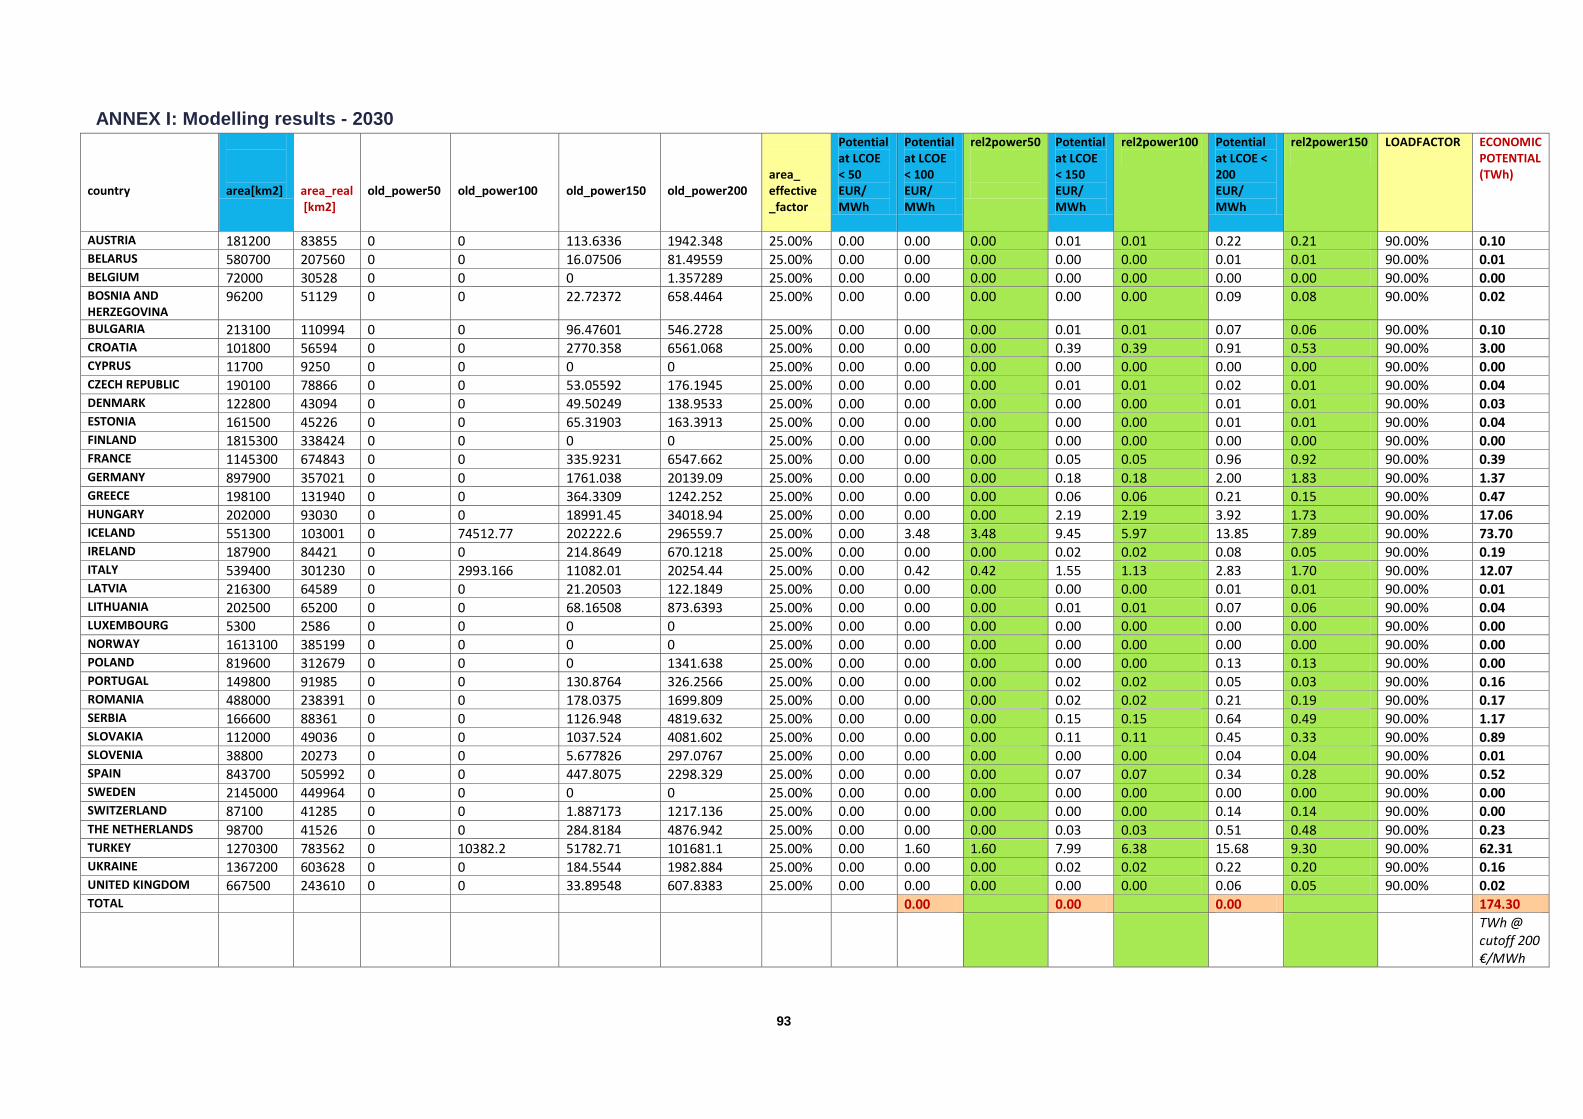
93
ANNEX I: Modelling results - 2030 country
area[km2]
area_real [km2]
old_power50
old_power100
old_power150
old_power200
area_ effective _factor
Potential at LCOE < 50 EUR/ MWh
Potential at LCOE < 100 EUR/ MWh
rel2power50
Potential at LCOE < 150 EUR/ MWh
rel2power100
Potential at LCOE < 200 EUR/ MWh
rel2power150
LOADFACTOR ECONOMIC POTENTIAL (TWh)
AUSTRIA 181200 83855 0 0 113.6336 1942.348 25.00% 0.00 0.00 0.00 0.01 0.01 0.22 0.21 90.00% 0.10 BELARUS 580700 207560 0 0 16.07506 81.49559 25.00% 0.00 0.00 0.00 0.00 0.00 0.01 0.01 90.00% 0.01 BELGIUM 72000 30528 0 0 0 1.357289 25.00% 0.00 0.00 0.00 0.00 0.00 0.00 0.00 90.00% 0.00 BOSNIA AND HERZEGOVINA
96200 51129 0 0 22.72372 658.4464 25.00% 0.00 0.00 0.00 0.00 0.00 0.09 0.08 90.00% 0.02
BULGARIA 213100 110994 0 0 96.47601 546.2728 25.00% 0.00 0.00 0.00 0.01 0.01 0.07 0.06 90.00% 0.10 CROATIA 101800 56594 0 0 2770.358 6561.068 25.00% 0.00 0.00 0.00 0.39 0.39 0.91 0.53 90.00% 3.00 CYPRUS 11700 9250 0 0 0 0 25.00% 0.00 0.00 0.00 0.00 0.00 0.00 0.00 90.00% 0.00 CZECH REPUBLIC 190100 78866 0 0 53.05592 176.1945 25.00% 0.00 0.00 0.00 0.01 0.01 0.02 0.01 90.00% 0.04 DENMARK 122800 43094 0 0 49.50249 138.9533 25.00% 0.00 0.00 0.00 0.00 0.00 0.01 0.01 90.00% 0.03 ESTONIA 161500 45226 0 0 65.31903 163.3913 25.00% 0.00 0.00 0.00 0.00 0.00 0.01 0.01 90.00% 0.04 FINLAND 1815300 338424 0 0 0 0 25.00% 0.00 0.00 0.00 0.00 0.00 0.00 0.00 90.00% 0.00 FRANCE 1145300 674843 0 0 335.9231 6547.662 25.00% 0.00 0.00 0.00 0.05 0.05 0.96 0.92 90.00% 0.39 GERMANY 897900 357021 0 0 1761.038 20139.09 25.00% 0.00 0.00 0.00 0.18 0.18 2.00 1.83 90.00% 1.37 GREECE 198100 131940 0 0 364.3309 1242.252 25.00% 0.00 0.00 0.00 0.06 0.06 0.21 0.15 90.00% 0.47 HUNGARY 202000 93030 0 0 18991.45 34018.94 25.00% 0.00 0.00 0.00 2.19 2.19 3.92 1.73 90.00% 17.06 ICELAND 551300 103001 0 74512.77 202222.6 296559.7 25.00% 0.00 3.48 3.48 9.45 5.97 13.85 7.89 90.00% 73.70 IRELAND 187900 84421 0 0 214.8649 670.1218 25.00% 0.00 0.00 0.00 0.02 0.02 0.08 0.05 90.00% 0.19 ITALY 539400 301230 0 2993.166 11082.01 20254.44 25.00% 0.00 0.42 0.42 1.55 1.13 2.83 1.70 90.00% 12.07 LATVIA 216300 64589 0 0 21.20503 122.1849 25.00% 0.00 0.00 0.00 0.00 0.00 0.01 0.01 90.00% 0.01 LITHUANIA 202500 65200 0 0 68.16508 873.6393 25.00% 0.00 0.00 0.00 0.01 0.01 0.07 0.06 90.00% 0.04 LUXEMBOURG 5300 2586 0 0 0 0 25.00% 0.00 0.00 0.00 0.00 0.00 0.00 0.00 90.00% 0.00 NORWAY 1613100 385199 0 0 0 0 25.00% 0.00 0.00 0.00 0.00 0.00 0.00 0.00 90.00% 0.00 POLAND 819600 312679 0 0 0 1341.638 25.00% 0.00 0.00 0.00 0.00 0.00 0.13 0.13 90.00% 0.00 PORTUGAL 149800 91985 0 0 130.8764 326.2566 25.00% 0.00 0.00 0.00 0.02 0.02 0.05 0.03 90.00% 0.16 ROMANIA 488000 238391 0 0 178.0375 1699.809 25.00% 0.00 0.00 0.00 0.02 0.02 0.21 0.19 90.00% 0.17 SERBIA 166600 88361 0 0 1126.948 4819.632 25.00% 0.00 0.00 0.00 0.15 0.15 0.64 0.49 90.00% 1.17 SLOVAKIA 112000 49036 0 0 1037.524 4081.602 25.00% 0.00 0.00 0.00 0.11 0.11 0.45 0.33 90.00% 0.89 SLOVENIA 38800 20273 0 0 5.677826 297.0767 25.00% 0.00 0.00 0.00 0.00 0.00 0.04 0.04 90.00% 0.01 SPAIN 843700 505992 0 0 447.8075 2298.329 25.00% 0.00 0.00 0.00 0.07 0.07 0.34 0.28 90.00% 0.52 SWEDEN 2145000 449964 0 0 0 0 25.00% 0.00 0.00 0.00 0.00 0.00 0.00 0.00 90.00% 0.00 SWITZERLAND 87100 41285 0 0 1.887173 1217.136 25.00% 0.00 0.00 0.00 0.00 0.00 0.14 0.14 90.00% 0.00 THE NETHERLANDS 98700 41526 0 0 284.8184 4876.942 25.00% 0.00 0.00 0.00 0.03 0.03 0.51 0.48 90.00% 0.23 TURKEY 1270300 783562 0 10382.2 51782.71 101681.1 25.00% 0.00 1.60 1.60 7.99 6.38 15.68 9.30 90.00% 62.31 UKRAINE 1367200 603628 0 0 184.5544 1982.884 25.00% 0.00 0.00 0.00 0.02 0.02 0.22 0.20 90.00% 0.16 UNITED KINGDOM 667500 243610 0 0 33.89548 607.8383 25.00% 0.00 0.00 0.00 0.00 0.00 0.06 0.05 90.00% 0.02 TOTAL 0.00 0.00 0.00 174.30
TWh @ cutoff 200 €/MWh
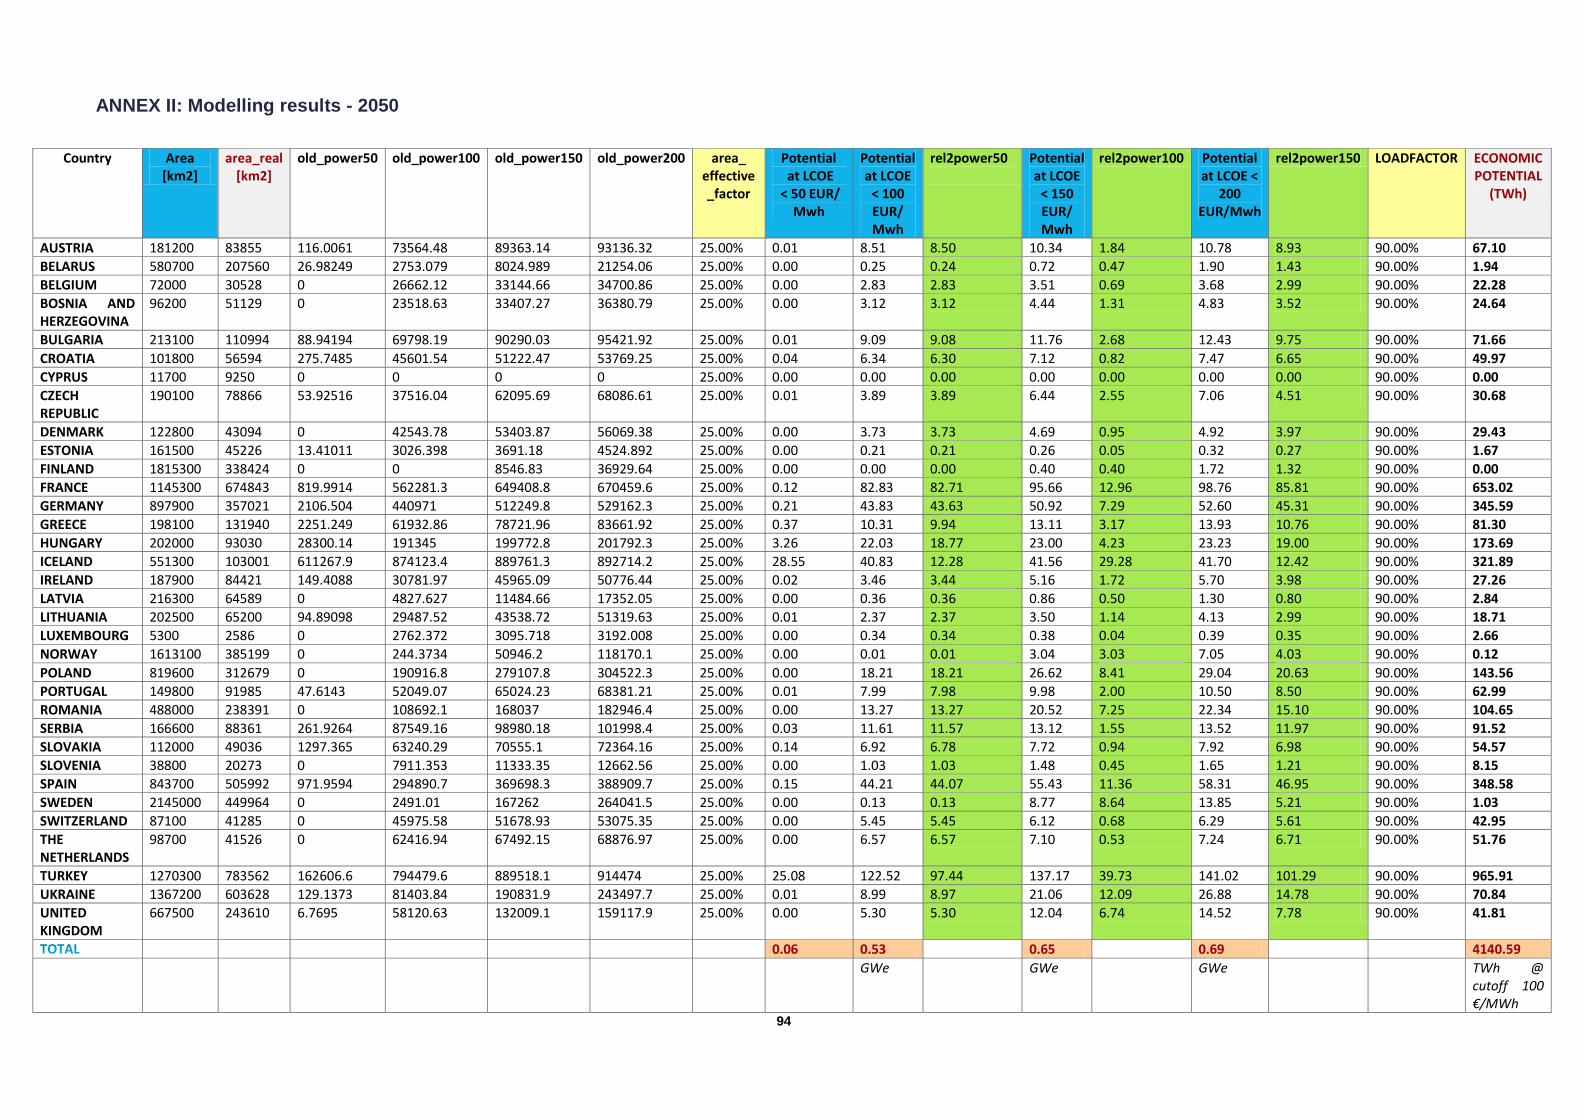
94
ANNEX II: Modelling results - 2050
Country Area [km2]
area_real [km2]
old_power50 old_power100 old_power150 old_power200 area_ effective _factor
Potential at LCOE
< 50 EUR/ Mwh
Potential at LCOE
< 100 EUR/ Mwh
rel2power50
Potential at LCOE
< 150 EUR/ Mwh
rel2power100 Potential at LCOE <
200 EUR/Mwh
rel2power150 LOADFACTOR ECONOMIC POTENTIAL
(TWh)
AUSTRIA 181200 83855 116.0061 73564.48 89363.14 93136.32 25.00% 0.01 8.51 8.50 10.34 1.84 10.78 8.93 90.00% 67.10
BELARUS 580700 207560 26.98249 2753.079 8024.989 21254.06 25.00% 0.00 0.25 0.24 0.72 0.47 1.90 1.43 90.00% 1.94
BELGIUM 72000 30528 0 26662.12 33144.66 34700.86 25.00% 0.00 2.83 2.83 3.51 0.69 3.68 2.99 90.00% 22.28
BOSNIA AND HERZEGOVINA
96200 51129 0 23518.63 33407.27 36380.79 25.00% 0.00 3.12 3.12 4.44 1.31 4.83 3.52 90.00% 24.64
BULGARIA 213100 110994 88.94194 69798.19 90290.03 95421.92 25.00% 0.01 9.09 9.08 11.76 2.68 12.43 9.75 90.00% 71.66
CROATIA 101800 56594 275.7485 45601.54 51222.47 53769.25 25.00% 0.04 6.34 6.30 7.12 0.82 7.47 6.65 90.00% 49.97
CYPRUS 11700 9250 0 0 0 0 25.00% 0.00 0.00 0.00 0.00 0.00 0.00 0.00 90.00% 0.00
CZECH REPUBLIC
190100 78866 53.92516 37516.04 62095.69 68086.61 25.00% 0.01 3.89 3.89 6.44 2.55 7.06 4.51 90.00% 30.68
DENMARK 122800 43094 0 42543.78 53403.87 56069.38 25.00% 0.00 3.73 3.73 4.69 0.95 4.92 3.97 90.00% 29.43
ESTONIA 161500 45226 13.41011 3026.398 3691.18 4524.892 25.00% 0.00 0.21 0.21 0.26 0.05 0.32 0.27 90.00% 1.67
FINLAND 1815300 338424 0 0 8546.83 36929.64 25.00% 0.00 0.00 0.00 0.40 0.40 1.72 1.32 90.00% 0.00
FRANCE 1145300 674843 819.9914 562281.3 649408.8 670459.6 25.00% 0.12 82.83 82.71 95.66 12.96 98.76 85.81 90.00% 653.02
GERMANY 897900 357021 2106.504 440971 512249.8 529162.3 25.00% 0.21 43.83 43.63 50.92 7.29 52.60 45.31 90.00% 345.59
GREECE 198100 131940 2251.249 61932.86 78721.96 83661.92 25.00% 0.37 10.31 9.94 13.11 3.17 13.93 10.76 90.00% 81.30
HUNGARY 202000 93030 28300.14 191345 199772.8 201792.3 25.00% 3.26 22.03 18.77 23.00 4.23 23.23 19.00 90.00% 173.69
ICELAND 551300 103001 611267.9 874123.4 889761.3 892714.2 25.00% 28.55 40.83 12.28 41.56 29.28 41.70 12.42 90.00% 321.89
IRELAND 187900 84421 149.4088 30781.97 45965.09 50776.44 25.00% 0.02 3.46 3.44 5.16 1.72 5.70 3.98 90.00% 27.26
LATVIA 216300 64589 0 4827.627 11484.66 17352.05 25.00% 0.00 0.36 0.36 0.86 0.50 1.30 0.80 90.00% 2.84
LITHUANIA 202500 65200 94.89098 29487.52 43538.72 51319.63 25.00% 0.01 2.37 2.37 3.50 1.14 4.13 2.99 90.00% 18.71
LUXEMBOURG 5300 2586 0 2762.372 3095.718 3192.008 25.00% 0.00 0.34 0.34 0.38 0.04 0.39 0.35 90.00% 2.66
NORWAY 1613100 385199 0 244.3734 50946.2 118170.1 25.00% 0.00 0.01 0.01 3.04 3.03 7.05 4.03 90.00% 0.12
POLAND 819600 312679 0 190916.8 279107.8 304522.3 25.00% 0.00 18.21 18.21 26.62 8.41 29.04 20.63 90.00% 143.56
PORTUGAL 149800 91985 47.6143 52049.07 65024.23 68381.21 25.00% 0.01 7.99 7.98 9.98 2.00 10.50 8.50 90.00% 62.99
ROMANIA 488000 238391 0 108692.1 168037 182946.4 25.00% 0.00 13.27 13.27 20.52 7.25 22.34 15.10 90.00% 104.65
SERBIA 166600 88361 261.9264 87549.16 98980.18 101998.4 25.00% 0.03 11.61 11.57 13.12 1.55 13.52 11.97 90.00% 91.52
SLOVAKIA 112000 49036 1297.365 63240.29 70555.1 72364.16 25.00% 0.14 6.92 6.78 7.72 0.94 7.92 6.98 90.00% 54.57
SLOVENIA 38800 20273 0 7911.353 11333.35 12662.56 25.00% 0.00 1.03 1.03 1.48 0.45 1.65 1.21 90.00% 8.15
SPAIN 843700 505992 971.9594 294890.7 369698.3 388909.7 25.00% 0.15 44.21 44.07 55.43 11.36 58.31 46.95 90.00% 348.58
SWEDEN 2145000 449964 0 2491.01 167262 264041.5 25.00% 0.00 0.13 0.13 8.77 8.64 13.85 5.21 90.00% 1.03
SWITZERLAND 87100 41285 0 45975.58 51678.93 53075.35 25.00% 0.00 5.45 5.45 6.12 0.68 6.29 5.61 90.00% 42.95
THE NETHERLANDS
98700 41526 0 62416.94 67492.15 68876.97 25.00% 0.00 6.57 6.57 7.10 0.53 7.24 6.71 90.00% 51.76
TURKEY 1270300 783562 162606.6 794479.6 889518.1 914474 25.00% 25.08 122.52 97.44 137.17 39.73 141.02 101.29 90.00% 965.91
UKRAINE 1367200 603628 129.1373 81403.84 190831.9 243497.7 25.00% 0.01 8.99 8.97 21.06 12.09 26.88 14.78 90.00% 70.84
UNITED KINGDOM
667500 243610 6.7695 58120.63 132009.1 159117.9 25.00% 0.00 5.30 5.30 12.04 6.74 14.52 7.78 90.00% 41.81
0.06 0.53 0.65 0.69 4140.59
GWe GWe GWe TWh @ cutoff 100 €/MWh
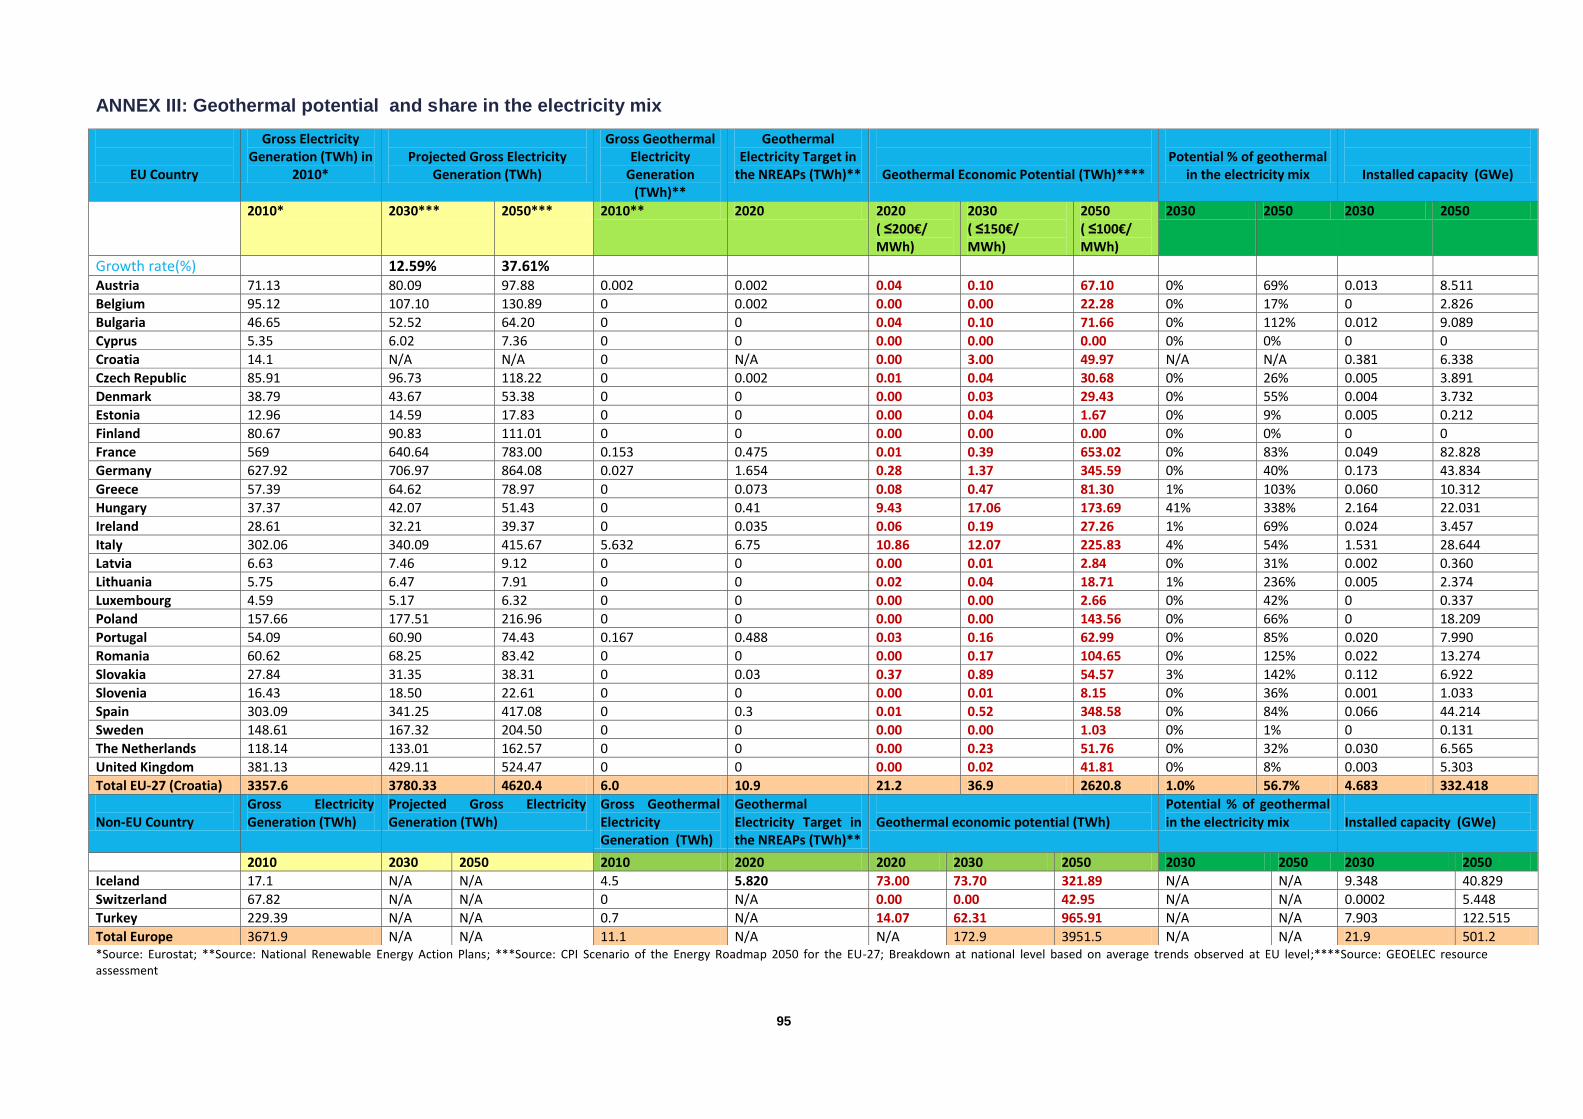
95
ANNEX III: Geothermal potential and share in the electricity mix
*Source: Eurostat; **Source: National Renewable Energy Action Plans; ***Source: CPI Scenario of the Energy Roadmap 2050 for the EU-27; Breakdown at national level based on average trends observed at EU level;****Source: GEOELEC resource assessment
EU Country
Gross Electricity Generation (TWh) in
2010*
Projected Gross Electricity
Generation (TWh)
Gross Geothermal Electricity
Generation (TWh)**
Geothermal Electricity Target in
the NREAPs (TWh)**
Geothermal Economic Potential (TWh)****
Potential % of geothermal
in the electricity mix
Installed capacity (GWe)
2010* 2030*** 2050*** 2010** 2020 2020 ( ≤200€/ MWh)
2030 ( ≤150€/ MWh)
2050 ( ≤100€/ MWh)
2030 2050 2030 2050
Growth rate(%) 12.59% 37.61% Austria 71.13 80.09 97.88 0.002 0.002 0.04 0.10 67.10 0% 69% 0.013 8.511
Belgium 95.12 107.10 130.89 0 0.002 0.00 0.00 22.28 0% 17% 0 2.826
Bulgaria 46.65 52.52 64.20 0 0 0.04 0.10 71.66 0% 112% 0.012 9.089
Cyprus 5.35 6.02 7.36 0 0 0.00 0.00 0.00 0% 0% 0 0
Croatia 14.1 N/A N/A 0 N/A 0.00 3.00 49.97 N/A N/A 0.381 6.338
Czech Republic 85.91 96.73 118.22 0 0.002 0.01 0.04 30.68 0% 26% 0.005 3.891
Denmark 38.79 43.67 53.38 0 0 0.00 0.03 29.43 0% 55% 0.004 3.732
Estonia 12.96 14.59 17.83 0 0 0.00 0.04 1.67 0% 9% 0.005 0.212
Finland 80.67 90.83 111.01 0 0 0.00 0.00 0.00 0% 0% 0 0
France 569 640.64 783.00 0.153 0.475 0.01 0.39 653.02 0% 83% 0.049 82.828
Germany 627.92 706.97 864.08 0.027 1.654 0.28 1.37 345.59 0% 40% 0.173 43.834
Greece 57.39 64.62 78.97 0 0.073 0.08 0.47 81.30 1% 103% 0.060 10.312
Hungary 37.37 42.07 51.43 0 0.41 9.43 17.06 173.69 41% 338% 2.164 22.031
Ireland 28.61 32.21 39.37 0 0.035 0.06 0.19 27.26 1% 69% 0.024 3.457
Italy 302.06 340.09 415.67 5.632 6.75 10.86 12.07 225.83 4% 54% 1.531 28.644
Latvia 6.63 7.46 9.12 0 0 0.00 0.01 2.84 0% 31% 0.002 0.360
Lithuania 5.75 6.47 7.91 0 0 0.02 0.04 18.71 1% 236% 0.005 2.374
Luxembourg 4.59 5.17 6.32 0 0 0.00 0.00 2.66 0% 42% 0 0.337
Poland 157.66 177.51 216.96 0 0 0.00 0.00 143.56 0% 66% 0 18.209
Portugal 54.09 60.90 74.43 0.167 0.488 0.03 0.16 62.99 0% 85% 0.020 7.990
Romania 60.62 68.25 83.42 0 0 0.00 0.17 104.65 0% 125% 0.022 13.274
Slovakia 27.84 31.35 38.31 0 0.03 0.37 0.89 54.57 3% 142% 0.112 6.922
Slovenia 16.43 18.50 22.61 0 0 0.00 0.01 8.15 0% 36% 0.001 1.033
Spain 303.09 341.25 417.08 0 0.3 0.01 0.52 348.58 0% 84% 0.066 44.214
Sweden 148.61 167.32 204.50 0 0 0.00 0.00 1.03 0% 1% 0 0.131
The Netherlands 118.14 133.01 162.57 0 0 0.00 0.23 51.76 0% 32% 0.030 6.565
United Kingdom 381.13 429.11 524.47 0 0 0.00 0.02 41.81 0% 8% 0.003 5.303
Total EU-27 (Croatia) 3357.6 3780.33 4620.4 6.0 10.9 21.2 36.9 2620.8 1.0% 56.7% 4.683 332.418
Non-EU Country
Gross Electricity Generation (TWh)
Projected Gross Electricity Generation (TWh)
Gross Geothermal Electricity Generation (TWh)
Geothermal Electricity Target in the NREAPs (TWh)**
Geothermal economic potential (TWh)
Potential % of geothermal in the electricity mix
Installed capacity (GWe)
2010 2030 2050 2010 2020 2020 2030 2050 2030 2050 2030 2050
Iceland 17.1 N/A N/A 4.5 5.820 73.00 73.70 321.89 N/A N/A 9.348 40.829
Switzerland 67.82 N/A N/A 0 N/A 0.00 0.00 42.95 N/A N/A 0.0002 5.448
Turkey 229.39 N/A N/A 0.7 N/A 14.07 62.31 965.91 N/A N/A 7.903 122.515
Total Europe 3671.9 N/A N/A 11.1 N/A N/A 172.9 3951.5 N/A N/A 21.9 501.2
96
ANNEX IV THE GEOELEC CONSORTIUM
European Geothermal Energy Council (EGEC – BE)
Bureau De Recherches Géologiques Et Minières (BRGM – FR)
Centre For Renewable Energy Sources And Saving (CRES – EL)
Consiglio Nazionale Delle Ricerche, Istituto Di Geoscienze e Georisorse (CNR-IGG – IT)
Asociacion De Productores De Energias Renovables (APPA - ES)
Gaßner, Groth, Siederer & Coll. (GGSC – DE)
EnBW Energie Baden-Württemberg (AG EnBW– DE)
Mannvit (IS)
Helmhotz Zentrum Postdam – Deutsches Geoforschungszentrum (GFZ – DE)
Nederlandse Organisatie Voor Toegepast Natuurwetenschappelijk Onderzoek (TNO – NL)