A Proposal for a Sleep Disorder Detection System
10
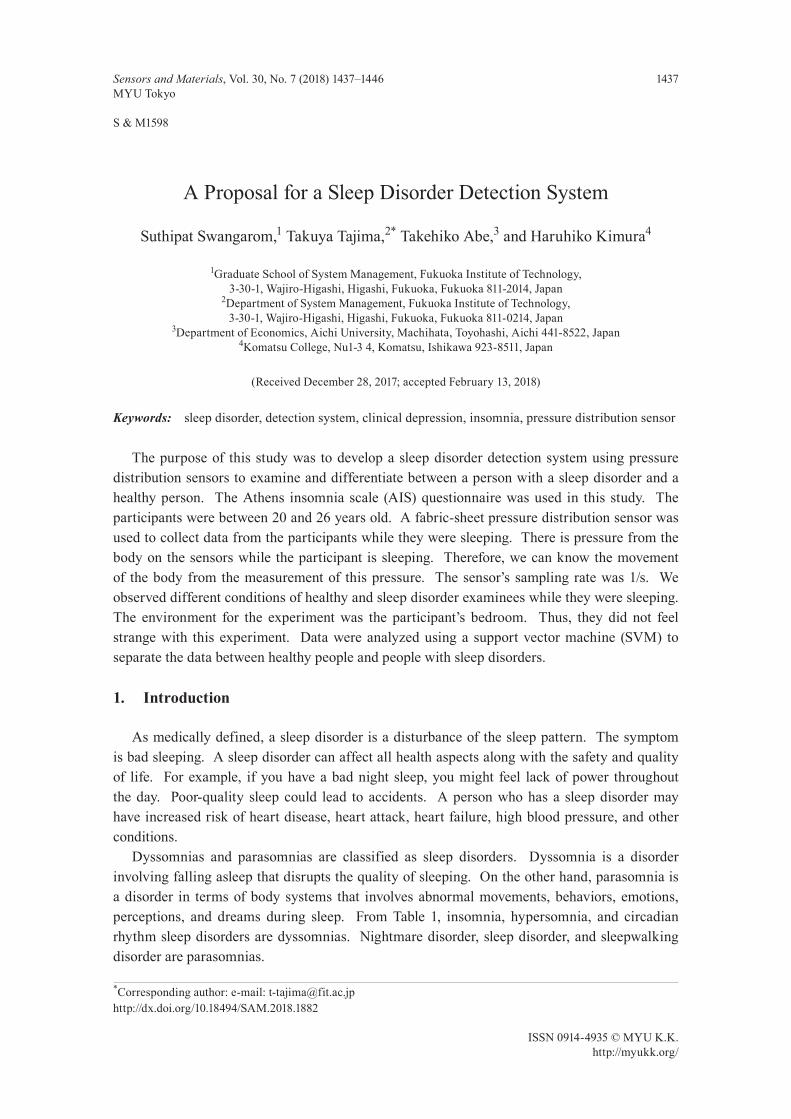
1437 Sensors and Materials, Vol. 30, No. 7 (2018) 1437–1446 MYU Tokyo S & M1598 * Corresponding author: e-mail: [email protected] http://dx.doi.org/10.18494/SAM.2018.1882 ISSN 0914-4935 © MYU K.K. http://myukk.org/ A Proposal for a Sleep Disorder Detection System Suthipat Swangarom, 1 Takuya Tajima, 2* Takehiko Abe, 3 and Haruhiko Kimura 4 1 Graduate School of System Management, Fukuoka Institute of Technology, 3-30-1, Wajiro-Higashi, Higashi, Fukuoka, Fukuoka 811-2014, Japan 2 Department of System Management, Fukuoka Institute of Technology, 3-30-1, Wajiro-Higashi, Higashi, Fukuoka, Fukuoka 811-0214, Japan 3 Department of Economics, Aichi University, Machihata, Toyohashi, Aichi 441-8522, Japan 4 Komatsu College, Nu1-3 4, Komatsu, Ishikawa 923-8511, Japan (Received December 28, 2017; accepted February 13, 2018) Keywords: sleep disorder, detection system, clinical depression, insomnia, pressure distribution sensor The purpose of this study was to develop a sleep disorder detection system using pressure distribution sensors to examine and differentiate between a person with a sleep disorder and a healthy person. The Athens insomnia scale (AIS) questionnaire was used in this study. The participants were between 20 and 26 years old. A fabric-sheet pressure distribution sensor was used to collect data from the participants while they were sleeping. There is pressure from the body on the sensors while the participant is sleeping. Therefore, we can know the movement of the body from the measurement of this pressure. The sensor’s sampling rate was 1/s. We observed different conditions of healthy and sleep disorder examinees while they were sleeping. The environment for the experiment was the participant’s bedroom. Thus, they did not feel strange with this experiment. Data were analyzed using a support vector machine (SVM) to separate the data between healthy people and people with sleep disorders. 1. Introduction As medically defined, a sleep disorder is a disturbance of the sleep pattern. The symptom is bad sleeping. A sleep disorder can affect all health aspects along with the safety and quality of life. For example, if you have a bad night sleep, you might feel lack of power throughout the day. Poor-quality sleep could lead to accidents. A person who has a sleep disorder may have increased risk of heart disease, heart attack, heart failure, high blood pressure, and other conditions. Dyssomnias and parasomnias are classified as sleep disorders. Dyssomnia is a disorder involving falling asleep that disrupts the quality of sleeping. On the other hand, parasomnia is a disorder in terms of body systems that involves abnormal movements, behaviors, emotions, perceptions, and dreams during sleep. From Table 1, insomnia, hypersomnia, and circadian rhythm sleep disorders are dyssomnias. Nightmare disorder, sleep disorder, and sleepwalking disorder are parasomnias.
Transcript of A Proposal for a Sleep Disorder Detection System
1437Sensors and Materials, Vol. 30, No. 7 (2018) 1437–1446MYU Tokyo
S & M1598
*Corresponding author: e-mail: [email protected] http://dx.doi.org/10.18494/SAM.2018.1882
ISSN 0914-4935 © MYU K.K.http://myukk.org/
A Proposal for a Sleep Disorder Detection System
Suthipat Swangarom,1 Takuya Tajima,2* Takehiko Abe,3 and Haruhiko Kimura4
1Graduate School of System Management, Fukuoka Institute of Technology,3-30-1, Wajiro-Higashi, Higashi, Fukuoka, Fukuoka 811-2014, Japan
2Department of System Management, Fukuoka Institute of Technology,3-30-1, Wajiro-Higashi, Higashi, Fukuoka, Fukuoka 811-0214, Japan
3Department of Economics, Aichi University, Machihata, Toyohashi, Aichi 441-8522, Japan4Komatsu College, Nu1-3 4, Komatsu, Ishikawa 923-8511, Japan
(Received December 28, 2017; accepted February 13, 2018)
Keywords: sleep disorder, detection system, clinical depression, insomnia, pressure distribution sensor
The purpose of this study was to develop a sleep disorder detection system using pressure distribution sensors to examine and differentiate between a person with a sleep disorder and a healthy person. The Athens insomnia scale (AIS) questionnaire was used in this study. The participants were between 20 and 26 years old. A fabric-sheet pressure distribution sensor was used to collect data from the participants while they were sleeping. There is pressure from the body on the sensors while the participant is sleeping. Therefore, we can know the movement of the body from the measurement of this pressure. The sensor’s sampling rate was 1/s. We observed different conditions of healthy and sleep disorder examinees while they were sleeping. The environment for the experiment was the participant’s bedroom. Thus, they did not feel strange with this experiment. Data were analyzed using a support vector machine (SVM) to separate the data between healthy people and people with sleep disorders.
1. Introduction
As medically defined, a sleep disorder is a disturbance of the sleep pattern. The symptom is bad sleeping. A sleep disorder can affect all health aspects along with the safety and quality of life. For example, if you have a bad night sleep, you might feel lack of power throughout the day. Poor-quality sleep could lead to accidents. A person who has a sleep disorder may have increased risk of heart disease, heart attack, heart failure, high blood pressure, and other conditions. Dyssomnias and parasomnias are classified as sleep disorders. Dyssomnia is a disorder involving falling asleep that disrupts the quality of sleeping. On the other hand, parasomnia is a disorder in terms of body systems that involves abnormal movements, behaviors, emotions, perceptions, and dreams during sleep. From Table 1, insomnia, hypersomnia, and circadian rhythm sleep disorders are dyssomnias. Nightmare disorder, sleep disorder, and sleepwalking disorder are parasomnias.

1438 Sensors and Materials, Vol. 30, No. 7 (2018)
From Fig. 1, showing the results of a patient survey in Japan from 1996 to 2014 collected by the Japanese Ministry of Health, Labor and Welfare, we see that the number of mood disorder patients from 1996 to 2014 has increased. The number of mood disorder patients including clinical depression was 433000 in 1996; the number has increased 258% in 18 years. In particular, the number increased dramatically in the early 21th century. Moreover, the number has increased year by year. Therefore, it is no exaggeration to say that mood disorder is a Japanese national disease. There are some research studies that are technically similar to this study; one is the development of a sleep apnea syndrome sensor using optical fibers,(2) and another involves the screening of sleep apnea syndrome during full health check-up with the comparison between optical fiber sleep apnea sensor and overnight pulse oximetry measurements.(3) Both studies used a finger clip pulse oximeter to measure the pulse oxygen saturation Spo2 (peripheral capillary oxygen saturation, an estimate of the amount of oxygen in blood) and the measurement system has to be attached to a participant’s finger. However, the developed sleep disorder detection system did not measure oxygen in blood, but it collected sleep data through a fabric-sheet pressure distribution sensor and analyzed them through a support vector machine (SVM). Moreover, our study did not use a measurement system that should be attached to the participant’s body because we would like that all our participants feel relaxed with this experiment. In previous studies, a sleep disorder detection system has been proposed.(4–8) In this study, we develop a sleep disorder detection system for a solitary person to determine whether he has a sleep disorder. It is difficult to observe a strange problem or behavior in the case of a solitary
Table 1Classification of sleep disorder.Dyssomnias ParasomniasInsomnia Nightmare disorderHypersomnia Sleep terror disorderCircadian rhythm sleep disorder Sleepwalking disorder
Fig. 1. Results of patient survey by the Japanese Ministry of Health, Labor and Welfare.(1)

Sensors and Materials, Vol. 30, No. 7 (2018) 1439
person. If such a person develops a strange problem or behavior, it is important to notice it early. If the person is not treated, it may become severe. We expect that this system could solve sleep disorder problems.
2. Materials and Methods
2.1 Athens insomnia scale (AIS)
The AIS is a questionnaire about the quality of sleeping that is frequently used to assess insomnia. There are eight questions in the questionnaire. The first to fifth questions are about nighttime and the sixth to eighth questions are about daytime. Each question has four possible answers scored from 0 to 3, where 0 means the absence of a problem and 3 means a serious issue. Respondents who obtain a total score between 0 and 3 have no problem with insomnia. If they obtain a total of 4 or 5, they may have a problem with insomnia. If the respondents obtain a total score above 6, they are diagnosed as insomniacs. In this study, we separate the respondents into two groups. One group has a total score below 6 and the other group has a total score of 6 or above (hereafter, above 6). The respondents who obtain a score below 6 are considered healthy. Respondents who obtain a score above 6 are speculated to have a sleep disorder.
2.2 Fabric-sheet pressure distribution sensor
A fabric-sheet pressure distribution sensor was used in this study to collect sleep data from the examinees. Figure 2 shows that there are 27 sensing points in the width direction from coordinate numbers A1, B1, …, Z1 to a1, and 64 sensing points in the length direction from coordinate numbers A1, A2, …, A63 to A64. Thus, there are 1728 sensing points. The advantage of this sensor is that it is affordable, flexible, stretchable, and portable. Table 2 shows the specifications of the fabric-sheet pressure distribution sensor. In this study, a sampling rate of 1/s was considered because we wanted to observe the sleeping data precisely. The sampling period is 10800 s. In other words, the sampling period is 3 h after the participant falls asleep. The thickness of the sensor is 2.5 mm and the experimental environment is the participant’s own bedroom. Moreover, we did not use a camera or a video
Table 2Specifications of a fabric-sheet pressure distribution sensor.(9)
Sensor size (mm) 2032 × 863Sensing area (mm) 1854 × 762Number of sensing points 64 × 27 = 1728Sensing point size (mm) 25.4 × 25.4Sensor pitch (mm) 3.6 × 2.93Maximum sensing period (Hz) 50Thickness (mm) 2.5
Fig. 2. (Color on l ine) Fabr ic-sheet pressu re distribution sensor.

1440 Sensors and Materials, Vol. 30, No. 7 (2018)
camera in this study. Therefore, the participants should not feel strange or uncomfortable with this experiment. Figure 3 shows body pressure at a small sensing point while the examinee is lying on the bed. The color appearing in Fig. 3 is related to body pressure based on the pressure at a small sensing point. The color scale is from red, yellow, green to blue as shown in Fig. 4. Red means a strong pressure, while white or blue means a weak pressure. Figure 5 shows body pressure from the fabric-sheet pressure distribution sensor when the examinee was sleeping and there was no movement. The movement distance of the center of pressure was always below 1 cm, while the movement angle of the center of pressure was around 179.9°. This means that the center of gravity is linear even during sleep. The center of gravity moves slightly because of movements such as breathing. The distance moved by the
Fig. 3. (Color) Sample body pressure data from a fabric-sheet pressure distribution sensor.
Fig. 4. (Color) Color scale for body pressure.
Fig. 5. (Color) Sample body pressure images for absence of movement.

Sensors and Materials, Vol. 30, No. 7 (2018) 1441
center of gravity is very small; therefore, the trajectory of the center of gravity is linear. Figure 6 shows the impact of a small movement on body pressure. An example of small movements is swinging hands or legs. The movement distances of the center of pressure are between 1–3 cm. The movement angles of the center of pressure are around 179°. In contrast, Fig. 7 shows the results of some large body movements on the fabric-sheet pressure distribution sensor. An example of large movements is changing the posture of the body during sleep. The movement distances of the center of pressure are above 3 cm, and the movement angles of the center of pressure are below 179°.
2.3 Data
Table 3 shows the collected data. The data set includes the following:
Fig. 6. (Color) Sample body pressure images for small movements.
Fig. 7. (Color) Sample body pressure images for large movements.

1442 Sensors and Materials, Vol. 30, No. 7 (2018)
1. Frame index: number of data sets;2. Time: year/month/day that the data were collected;3. Minimum pressure (mmHg): minimum pressure indicates the lowest individual sensor value
in the displayed frame;4. Maximum pressure (mmHg): maximum pressure indicates the highest individual sensor
value in the displayed frame;5. Average (mmHg): the average of the sensor values, calculated as the sum of all the sensor
values divided by the number of sensors; the average pressure is sensitive to extreme values, which may distort its representation of the typical sensor value;
6. Variance (mmHg2): a measure of the variability, or dispersion, of individual sensor values around the average pressure, calculated as the arithmetic mean of the square of deviations from the mean;
7. Standard deviation (mmHg): the square root of the variance; the comparison of standard deviations for samples with different means is not informative (even if absolute magnitudes of the deviation are equal, the degree of variability relative to each average pressure could be different);
8. Coefficient of variation (%): a statistical measure of the deviation of a variable from its mean; the coefficient of variation permits the comparison of the degrees of variability of the sensor values from two different sensor mats, indicating mat readings with different average pressures. Assuming that σ is the standard deviation for a population and ρ is the pressure on the mat;
100CV σρ
= × . (1)
Table 3Data.

Sensors and Materials, Vol. 30, No. 7 (2018) 1443
9. Horizontal center (cm): the horizontal component of the center of pressure (lower left corner of the mat when viewed in the default orientation of the software);
10. Vertical center (cm): the vertical component of pressure as measured from the origin (lower left corner of the mat when viewed in the default orientation of the software);
11. Sensing area (cm2): the area of the mat or selected subsection of the mat whose readings are at or above the statistical minimum;
12. Regional distribution (%): percentage (%) of the total load in each selected region; if there is no subregion selected, this is always 100% (entire mat);
13. A1–1740: a pressure of a sensing point from numbers A1–a1 in width coordinated with numbers A1–A64 in length.
In addition, we made two feature value data from the horizontal and vertical centers, namely, the movement distance of the center of pressure (cm) and the movement angle of the center of pressure (degrees). Both values are obtained by calculation between the current and previous frames. The movement distance of the center of pressure is a value from which we can determine the movement distance during sleep.
2 22 1 2 1( ) ( )Distance y y x x= − + − (2)
Equation (2) is a formula for a distance between two points. We use this formula to find the movement distance of the center of pressure. Here, x1 and x2 are the horizontal centers (cm) and y1 and y2 are the vertical centers (cm). The movement angle of the center of pressure can be used to determine the change in angle when the body is moved.
2
1 2
1cosθ F F
F F=
⋅ (3)
We use Eq. (3) to find the movement angle of the center of pressure. Here, F1 and F2 are vector1 and vector2, respectively. In other words, F1 indicates horizontal center1 (x1) and vertical center1 (y1), and F2 indicates horizontal center2 (x2) and vertical center2 (y2). The obtained values are in degrees. For data analysis, we use seven features of the data: average, variance, coefficient of variation, horizontal center, vertical center, movement distance of the center of pressure, and movement angle of the center of pressure. As shown in Table 4, in this study, the sampling period was 10800 s. Therefore, each of the five features contains 10800 data points. The five features are average, variance, coefficient of variation, horizontal center, and vertical center. The movement distance of the center of pressure and the movement angle of the center of pressure contain 10799 data points (two features are considered as one data point). In the last box, we put a signal as an instruction that comes from the value in the AIS being below or above 6. If the survey result is below 6, we put in an instruction signal of below 6; if the result is above 6, we put in an instruction signal of above 6.

1444 Sensors and Materials, Vol. 30, No. 7 (2018)
2.4 SVM
An SVM is a data classification tool that can split data using hyperplanes.(10) The advantages of an SVM are that it is intuitive, easy to use, and understandable. An SVM uses the margin between the hyperplane and the training samples as an evaluation function. When the SVM is unable to separate the observed data into linear space, it realizes the linear separation by mapping data to a higher dimensional space through nonlinear conversion. In this study, we used a polynomial kernel because in machine learning, a polynomial is a common kernel function used with an SVM that indicates similarity of training sample vectors. For a polynomial kernel, a lower degree generalizes better, while a higher degree fits training data better. We are using library e1071 to make an SVM (polynomial kernel) in R analyzed data between people with sleep disorders and healthy people.
(γ ∗ u′ ∗ v + coef0)° (4)
Equation (4) is a formula for a polynomial kernel function in R.(11) Here, γ is a set gamma in the kernel function. In this study, γ is 1/num_features. Coef0 is a set coef0 in the kernel function and is 0. The degree is set in the kernel function as 3.
3. Experiments
Table 5 shows information on the participants. The experiment was carried out with nine participants (between 20 and 27 years old). All participants were university students. There were three females and six males. First, we surveyed the AIS questionnaire and divided the results of the questionnaire into two groups (total scores below and above 6). We then ran the experiment using a fabric-sheet pressure distribution sensor. All examinees slept two nights. Therefore, we obtained two data sets from each examinee. To analyze the data, as shown in Fig. 8, we should use machine learning to define test and learning data. All experimental data comprised 18 data sets (nine persons × two experiments.). Then, the data were divided into 16 learning data sets (data of eight persons × two experiments) and two testing data sets (data of one person × two experiments). The learning data set did not include test data. Correspondingly, the test data does not include learning data. Thus, the analysis in this experiment uses a perfectly unknown data set.
Table 4Sample input data.
Average1 … Average10800 Variance1 … Variance108005.66 … 44.55 123.44 … 43.54CV1 … CV10800 Horizontal1 … Horizontal108001459 … 352.44 35.6 … 15.25
Vertical1 … Vertical10800 Distance1 … Distance107990.17 … 4.27 6.09 … 226.24
Angle1 … Angle10799 Instruction Signal179.923 … 179.8673 “Under 6”

Sensors and Materials, Vol. 30, No. 7 (2018) 1445
4. Results
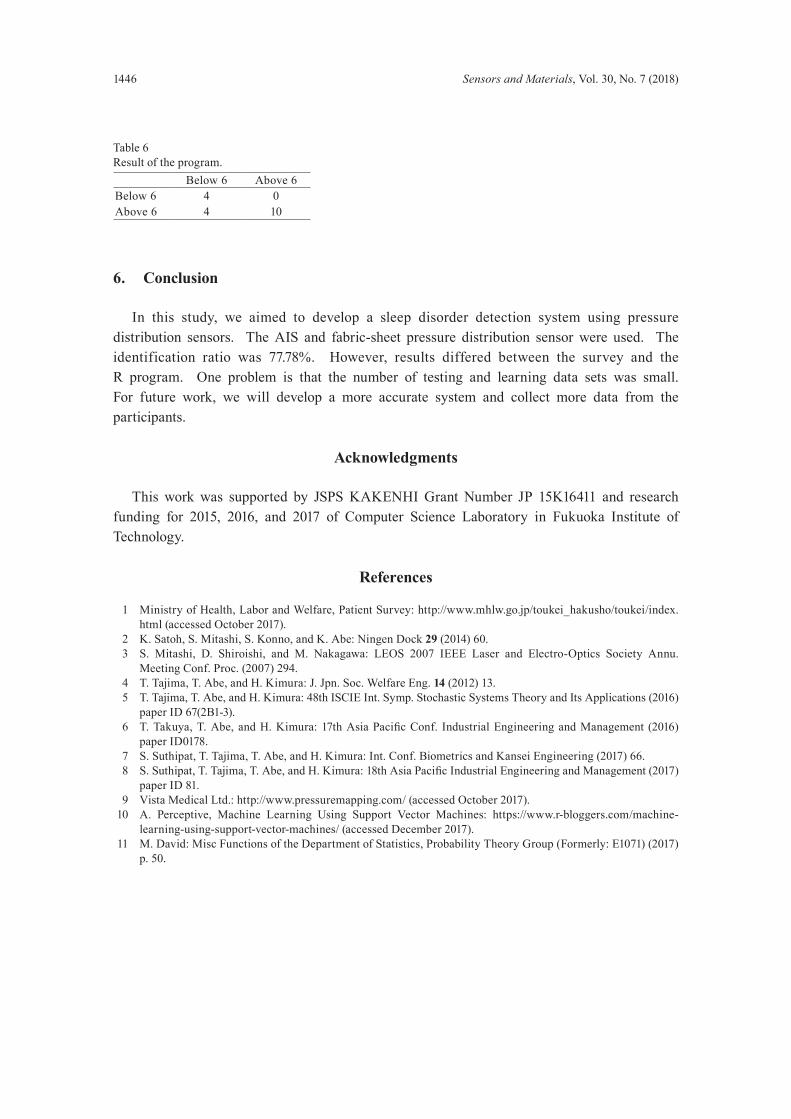
From the AIS, one group has four people with a total score below 6 and the other group has five people with a total score above 6. Table 6 shows result of the program in a confusion matrix. From 18 data sets (nine persons × two experiments), the program produced a result matching with that of the AIS questionnaire with 14 data sets (seven persons). In other words, on the basis of R with an SVM polynomial kernel, seven persons have a sleep disorder and two persons do not. Moreover, results of two data sets from the same subject were the same. We determine that the identification ratio is 77.78%.
5. Considerations
From the results, the identification ratio was 77.78%. To the best of our knowledge, there have been no other research studies that we can use for comparison with our results; thus, the identification ratio is not 100% and we think that the identification ratio of 77.8% is not enough. Moreover, the number of testing and learning data sets may be very small. There may be some difference between the results of R and those of the AIS because a certain time passed between the time we carried out the survey and the time we ran the experiment. It is always possible that there are healthy changes in the examinee in the interim. To improve accuracy, we would like to collect more sleeping data to train the program and find more participants to join this experiment. A sleep disorder detection system is part of the development of clinical depression diagnosis support systems for solitary people. We conducted this experiment in an effort to detect clinical depression better. We should merge the sleep disorder detection systems with other systems, such as indoor behavior identification systems using pressure distribution sensors, to detect disorders more accurately. We think that this system could be a way to solve clinical depression problems. If we know who is likely to suffer a sleep disorder or to become clinically depressed, we will be able to advise them to get remedies from their physician early because if they are not treated, clinical depression problems may become severe.
Table 5Information on the participants.Examinee no. Age Sex Athens scale1 24 F 72 25 F 103 26 M 94 21 M 55 24 M 26 26 M 47 25 M 68 24 F 109 27 M 3
Fig. 8. (Color online) Chart of learning and testing data sets.
1446 Sensors and Materials, Vol. 30, No. 7 (2018)
6. Conclusion
In this study, we aimed to develop a sleep disorder detection system using pressure distribution sensors. The AIS and fabric-sheet pressure distribution sensor were used. The identification ratio was 77.78%. However, results differed between the survey and the R program. One problem is that the number of testing and learning data sets was small. For future work, we will develop a more accurate system and collect more data from the participants.
Acknowledgments
This work was supported by JSPS KAKENHI Grant Number JP 15K16411 and research funding for 2015, 2016, and 2017 of Computer Science Laboratory in Fukuoka Institute of Technology.
References
1 Ministry of Health, Labor and Welfare, Patient Survey: http://www.mhlw.go.jp/toukei_hakusho/toukei/index.html (accessed October 2017).
2 K. Satoh, S. Mitashi, S. Konno, and K. Abe: Ningen Dock 29 (2014) 60. 3 S. Mitashi, D. Shiroishi, and M. Nakagawa: LEOS 2007 IEEE Laser and Electro-Optics Society Annu.
Meeting Conf. Proc. (2007) 294. 4 T. Tajima, T. Abe, and H. Kimura: J. Jpn. Soc. Welfare Eng. 14 (2012) 13. 5 T. Tajima, T. Abe, and H. Kimura: 48th ISCIE Int. Symp. Stochastic Systems Theory and Its Applications (2016)
paper ID 67(2B1-3). 6 T. Takuya, T. Abe, and H. Kimura: 17th Asia Pacific Conf. Industrial Engineering and Management (2016)
paper ID0178. 7 S. Suthipat, T. Tajima, T. Abe, and H. Kimura: Int. Conf. Biometrics and Kansei Engineering (2017) 66. 8 S. Suthipat, T. Tajima, T. Abe, and H. Kimura: 18th Asia Pacific Industrial Engineering and Management (2017)
paper ID 81. 9 Vista Medical Ltd.: http://www.pressuremapping.com/ (accessed October 2017). 10 A. Perceptive, Machine Learning Using Support Vector Machines: https://www.r-bloggers.com/machine-
learning-using-support-vector-machines/ (accessed December 2017). 11 M. David: Misc Functions of the Department of Statistics, Probability Theory Group (Formerly: E1071) (2017)
p. 50.
Table 6Result of the program.
Below 6 Above 6Below 6 4 0Above 6 4 10