A progress report on SDG 11 - unhabitat.org
6
A progress report on SDG 11.2 How the World is making public transport more accessible 2 https://unstats.un.org/sdgs/metadata/files/Metadata-11-02-01.pdf 3https://sdgs.un.org/goals 4 https://sdgs.un.org/goals/goal11 1 This is a periodical report which will be updated in regular intervals. About This Report 1 The Interagency Expert Group on SDGs (IAEG-SDGs) tasked UN-Habitat as the custodian agency for Indicator 11.2.1 under target 11.2 within Goal 11. UN-Habitat works with a variety of partners and civil society agencies to support the global monitoring of Sustainable Development Goal (SDG) indicator 11.2.1, such as UITP 2 . This report brings together transport data collected by both organisations to provide a snapshot of how the world is progressing against SDG target 11.2 and examines the main lessons learned as we approach the halfway point to delivering on the Post-2015 agenda. It also provides a set of key recommendations to support implementation through improved monitoring and reporting for target 11.2. Global and detailed progress on the target 11.2 will be provided in the 2022 SDG 11 Synthesis report which will be launched as part of the 2022 HLPF when Goal 11 status will be reviewed again. Introduction At the heart of the 2030 Agenda for Sustainable Development are 17 SDGs, which are accompanied by a number of targets that will help to realise them. Goal 11 recognizes that cities are at the forefront of the transformation required to meet the SDGs and that local authorities have a crucial role in making societies more liveable, inclusive, and resilient. The SDGs recognise that access to adequate, reliable and safe public transport is a basic urban need. SDG target 11.2 aims that by 2030, all citizens will have access to safe, affordable, accessible and sustainable transport systems, which will be achieved by expanding public transport. In doing so, special attention must be given to the needs of those in vulnerable situations, women, children, persons with disabilities and older persons 4 . Source UN 3
Transcript of A progress report on SDG 11 - unhabitat.org
A progress report on SDG 11.2How the World is making public transport more accessible
2 https://unstats.un.org/sdgs/metadata/files/Metadata-11-02-01.pdf 3https://sdgs.un.org/goals 4 https://sdgs.un.org/goals/goal11
1 This is a periodical report which will be updated in regular intervals.
About This Report1
The Interagency Expert Group on SDGs (IAEG-SDGs) tasked UN-Habitat as the custodian agency for Indicator 11.2.1 under target 11.2 within Goal 11. UN-Habitat works with a variety of partners and civil society agencies to support the global monitoring of Sustainable Development Goal (SDG) indicator 11.2.1, such as UITP2. This report brings together transport data collected by both organisations to provide a snapshot of how the world is progressing against SDG target 11.2 and examines the main lessons learned as we approach the halfway point to delivering on the Post-2015 agenda. It also provides a set of key recommendations to support implementation through improved monitoring and reporting for target 11.2. Global and detailed progress on the target 11.2 will be provided in the 2022 SDG 11 Synthesis report which will be launched as part of the 2022 HLPF when Goal 11 status will be reviewed again.
Introduction
At the heart of the 2030 Agenda for Sustainable Development are 17 SDGs, which are accompanied by a number of targets that will help to realise them. Goal 11 recognizes that cities are at the forefront of the transformation required to meet the SDGs and that local authorities have a crucial role in making societies more liveable, inclusive, and resilient.
The SDGs recognise that access to adequate, reliable and safe public transport is a basic urban need. SDG target 11.2 aims that by 2030, all citizens will have access to safe, affordable, accessible and sustainable transport systems, which will be achieved by expanding public transport. In doing so, special attention must be given to the needs of those in vulnerable situations, women, children, persons with disabilities and older persons4.
Source UN3
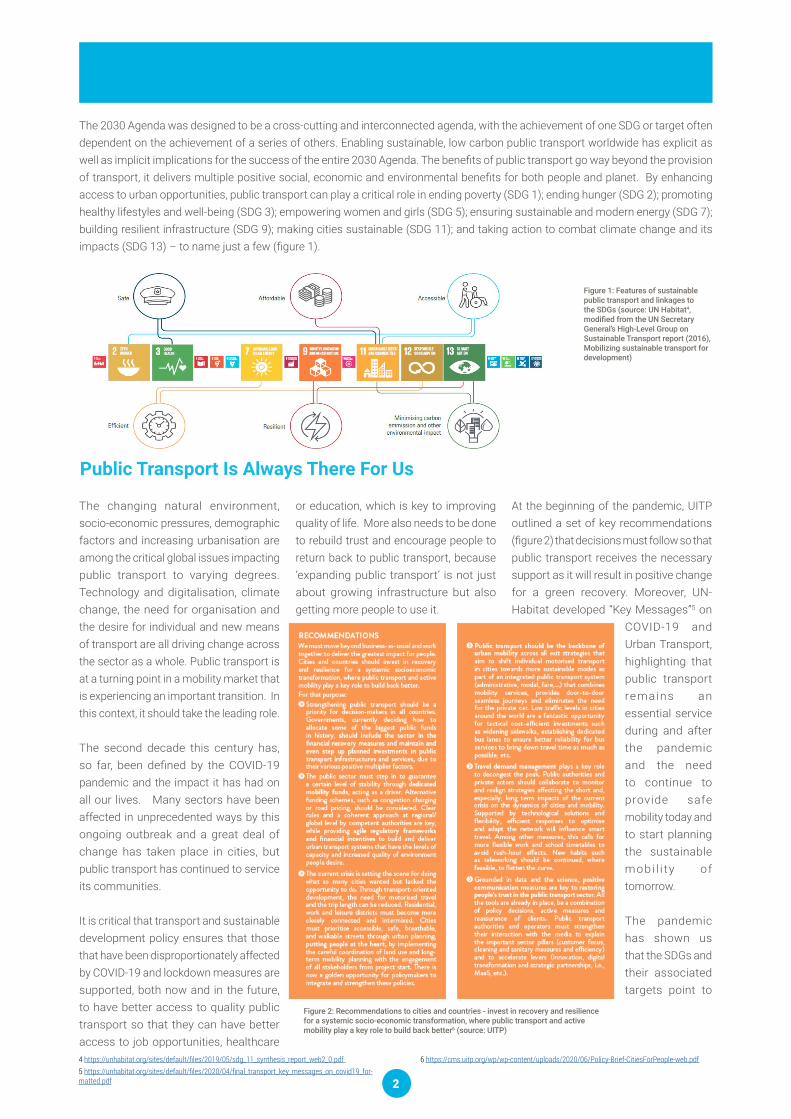
Figure 1: Features of sustainable public transport and linkages to the SDGs (source: UN Habitat4, modified from the UN Secretary General’s High-Level Group on Sustainable Transport report (2016), Mobilizing sustainable transport for development)
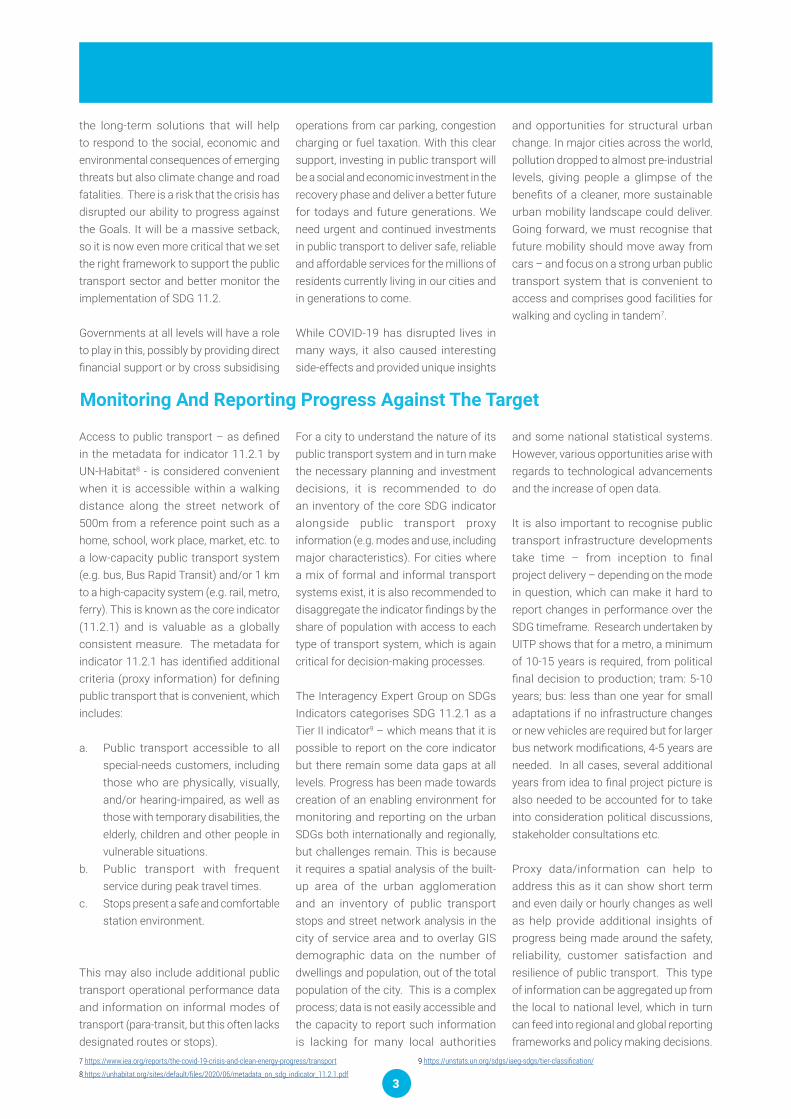
Figure 2: Recommendations to cities and countries - invest in recovery and resilience for a systemic socio-economic transformation, where public transport and active mobility play a key role to build back better6 (source: UITP)
4 https://unhabitat.org/sites/default/files/2019/05/sdg_11_synthesis_report_web2_0.pdf 5 https://unhabitat.org/sites/default/files/2020/04/final_transport_key_messages_on_covid19_for-matted.pdf
6 https://cms.uitp.org/wp/wp-content/uploads/2020/06/Policy-Brief-CitiesForPeople-web.pdf
The 2030 Agenda was designed to be a cross-cutting and interconnected agenda, with the achievement of one SDG or target often dependent on the achievement of a series of others. Enabling sustainable, low carbon public transport worldwide has explicit as well as implicit implications for the success of the entire 2030 Agenda. The benefits of public transport go way beyond the provision of transport, it delivers multiple positive social, economic and environmental benefits for both people and planet. By enhancing access to urban opportunities, public transport can play a critical role in ending poverty (SDG 1); ending hunger (SDG 2); promoting healthy lifestyles and well-being (SDG 3); empowering women and girls (SDG 5); ensuring sustainable and modern energy (SDG 7); building resilient infrastructure (SDG 9); making cities sustainable (SDG 11); and taking action to combat climate change and its impacts (SDG 13) – to name just a few (figure 1).
The changing natural environment, socio-economic pressures, demographic factors and increasing urbanisation are among the critical global issues impacting public transport to varying degrees. Technology and digitalisation, climate change, the need for organisation and the desire for individual and new means of transport are all driving change across the sector as a whole. Public transport is at a turning point in a mobility market that is experiencing an important transition. In this context, it should take the leading role.
The second decade this century has, so far, been defined by the COVID-19 pandemic and the impact it has had on all our lives. Many sectors have been affected in unprecedented ways by this ongoing outbreak and a great deal of change has taken place in cities, but public transport has continued to service its communities.
It is critical that transport and sustainable development policy ensures that those that have been disproportionately affected by COVID-19 and lockdown measures are supported, both now and in the future, to have better access to quality public transport so that they can have better access to job opportunities, healthcare
or education, which is key to improving quality of life. More also needs to be done to rebuild trust and encourage people to return back to public transport, because ‘expanding public transport’ is not just about growing infrastructure but also getting more people to use it.
At the beginning of the pandemic, UITP outlined a set of key recommendations (figure 2) that decisions must follow so that public transport receives the necessary support as it will result in positive change for a green recovery. Moreover, UN-Habitat developed “Key Messages”5 on
COVID-19 and Urban Transport, highlighting that public transport remains an essential service during and after the pandemic and the need to continue to provide safe mobility today and to start planning the sustainable mobi l i ty of tomorrow.
The pandemic has shown us that the SDGs and their associated targets point to
Public Transport Is Always There For Us
2
https://unhabitat.org/sites/default/files/2020/04/final_transport_key_messages_on_covid19_formatted.
the long-term solutions that will help to respond to the social, economic and environmental consequences of emerging threats but also climate change and road fatalities. There is a risk that the crisis has disrupted our ability to progress against the Goals. It will be a massive setback, so it is now even more critical that we set the right framework to support the public transport sector and better monitor the implementation of SDG 11.2.
Governments at all levels will have a role to play in this, possibly by providing direct financial support or by cross subsidising
operations from car parking, congestion charging or fuel taxation. With this clear support, investing in public transport will be a social and economic investment in the recovery phase and deliver a better future for todays and future generations. We need urgent and continued investments in public transport to deliver safe, reliable and affordable services for the millions of residents currently living in our cities and in generations to come.
While COVID-19 has disrupted lives in many ways, it also caused interesting side-effects and provided unique insights
and opportunities for structural urban change. In major cities across the world, pollution dropped to almost pre-industrial levels, giving people a glimpse of the benefits of a cleaner, more sustainable urban mobility landscape could deliver. Going forward, we must recognise that future mobility should move away from cars – and focus on a strong urban public transport system that is convenient to access and comprises good facilities for walking and cycling in tandem7.
Monitoring And Reporting Progress Against The Target
Access to public transport – as defined in the metadata for indicator 11.2.1 by UN-Habitat8 - is considered convenient when it is accessible within a walking distance along the street network of 500m from a reference point such as a home, school, work place, market, etc. to a low-capacity public transport system (e.g. bus, Bus Rapid Transit) and/or 1 km to a high-capacity system (e.g. rail, metro, ferry). This is known as the core indicator (11.2.1) and is valuable as a globally consistent measure. The metadata for indicator 11.2.1 has identified additional criteria (proxy information) for defining public transport that is convenient, which includes:
a. Public transport accessible to all special-needs customers, including those who are physically, visually, and/or hearing-impaired, as well as those with temporary disabilities, the elderly, children and other people in vulnerable situations.
b. Public transport with frequent service during peak travel times.
c. Stops present a safe and comfortable station environment.
This may also include additional public transport operational performance data and information on informal modes of transport (para-transit, but this often lacks designated routes or stops).
For a city to understand the nature of its public transport system and in turn make the necessary planning and investment decisions, it is recommended to do an inventory of the core SDG indicator alongside public transport proxy information (e.g. modes and use, including major characteristics). For cities where a mix of formal and informal transport systems exist, it is also recommended to disaggregate the indicator findings by the share of population with access to each type of transport system, which is again critical for decision-making processes.
The Interagency Expert Group on SDGs Indicators categorises SDG 11.2.1 as a Tier II indicator9 – which means that it is possible to report on the core indicator but there remain some data gaps at all levels. Progress has been made towards creation of an enabling environment for monitoring and reporting on the urban SDGs both internationally and regionally, but challenges remain. This is because it requires a spatial analysis of the built-up area of the urban agglomeration and an inventory of public transport stops and street network analysis in the city of service area and to overlay GIS demographic data on the number of dwellings and population, out of the total population of the city. This is a complex process; data is not easily accessible and the capacity to report such information is lacking for many local authorities
and some national statistical systems. However, various opportunities arise with regards to technological advancements and the increase of open data.
It is also important to recognise public transport infrastructure developments take time – from inception to final project delivery – depending on the mode in question, which can make it hard to report changes in performance over the SDG timeframe. Research undertaken by UITP shows that for a metro, a minimum of 10-15 years is required, from political final decision to production; tram: 5-10 years; bus: less than one year for small adaptations if no infrastructure changes or new vehicles are required but for larger bus network modifications, 4-5 years are needed. In all cases, several additional years from idea to final project picture is also needed to be accounted for to take into consideration political discussions, stakeholder consultations etc.
Proxy data/information can help to address this as it can show short term and even daily or hourly changes as well as help provide additional insights of progress being made around the safety, reliability, customer satisfaction and resilience of public transport. This type of information can be aggregated up from the local to national level, which in turn can feed into regional and global reporting frameworks and policy making decisions.
7 https://www.iea.org/reports/the-covid-19-crisis-and-clean-energy-progress/transport
8 https://unhabitat.org/sites/default/files/2020/06/metadata_on_sdg_indicator_11.2.1.pdf
9 https://unstats.un.org/sdgs/iaeg-sdgs/tier-classification/
3
Proxy indicators that support this better understanding of the target achievements of 11.2 are encouraged and welcomed. UN-Habitat and other partners such as UITP have identified what this could usefully be to help decision makers to better understand if the enhanced spatial distribution of public transport is being translated into use or whether public transport is attractive to citizens. UN-Habitat, UITP and other partners believe that there is a need to urgently improve this reporting against the target at all levels – and this should start from the public transport sector. To help realise this ambition, UITP initiated its Sustainability Charter to support its members to measure progress and advance efforts towards target 11.2 and the wider SDGs, using core and proxy information that is material to the sector. Similarly, UN-Habitat has conducted various expert group
sessions geared at fully disseminating the methodology of SDG Indicator 11.2.1 to national statistical agencies, transport departmental heads, local governments,
academia, civil society (see table below). This has led to significant improvements in data production for indicator 11.2.1 with over 600 cities now having data reported.
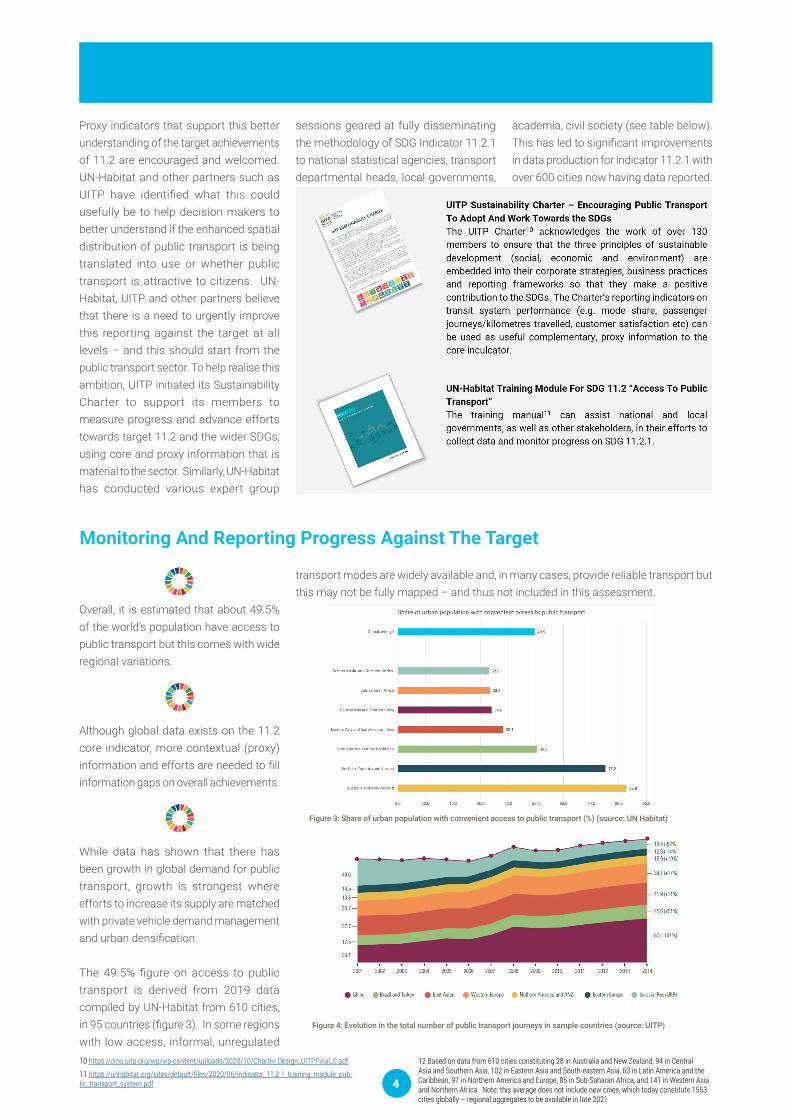
Overall, it is estimated that about 49.5% of the world’s population have access to public transport but this comes with wide regional variations.
Although global data exists on the 11.2 core indicator, more contextual (proxy) information and efforts are needed to fill information gaps on overall achievements.
While data has shown that there has been growth in global demand for public transport, growth is strongest where efforts to increase its supply are matched with private vehicle demand management and urban densification.
The 49.5% figure on access to public transport is derived from 2019 data compiled by UN-Habitat from 610 cities, in 95 countries (figure 3). In some regions with low access, informal, unregulated
transport modes are widely available and, in many cases, provide reliable transport but this may not be fully mapped – and thus not included in this assessment.
Monitoring And Reporting Progress Against The Target
Figure 3: Share of urban population with convenient access to public transport (%) (source: UN Habitat)
Figure 4: Evolution in the total number of public transport journeys in sample countries (source: UITP)
10 https://cms.uitp.org/wp/wp-content/uploads/2020/10/Charter-Design_UITPFinal_0.pdf
11 https://unhabitat.org/sites/default/files/2020/06/indicator_11.2.1_training_module_pub-lic_transport_system.pdf
12 Based on data from 610 cities constituting 28 in Australia and New Zealand, 94 in Central Asia and Southern Asia, 102 in Eastern Asia and South-eastern Asia, 63 in Latin America and the Caribbean, 97 in Northern America and Europe, 85 in Sub-Saharan Africa, and 141 in Western Asia and Northern Africa. Note: this average does not include new cities, which today constitute 1553 cities globally – regional aggregates to be available in late 2021
4
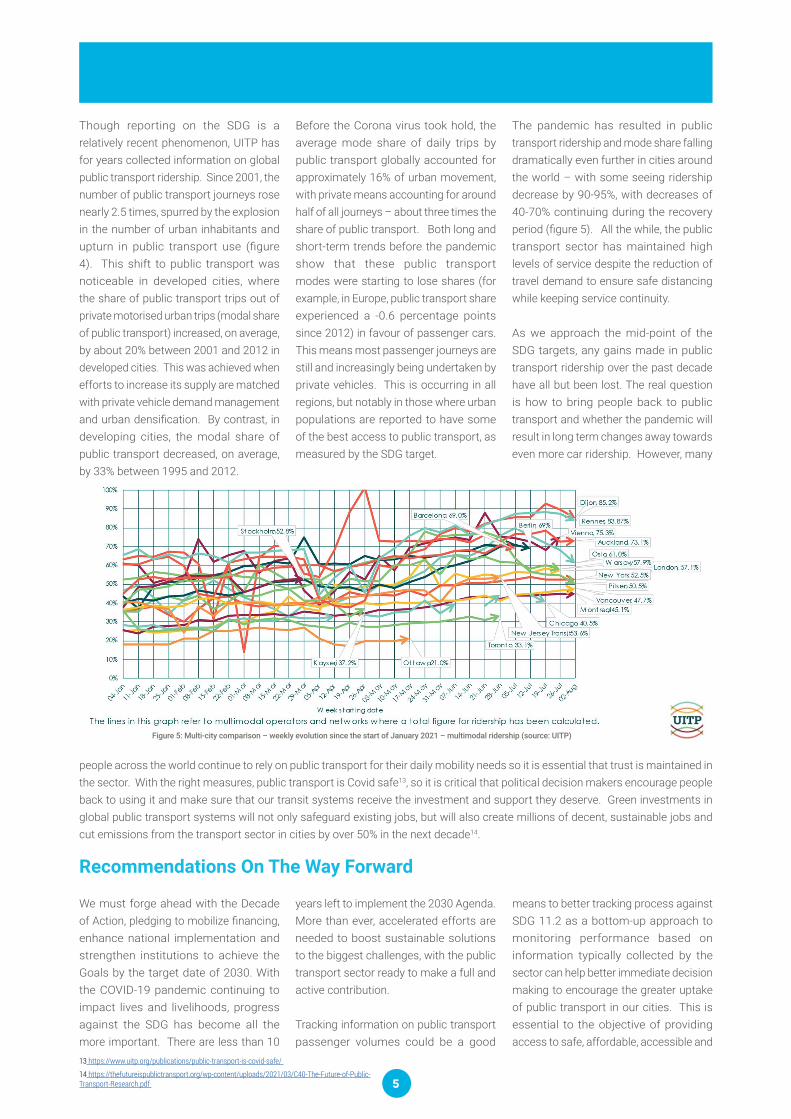
Though reporting on the SDG is a relatively recent phenomenon, UITP has for years collected information on global public transport ridership. Since 2001, the number of public transport journeys rose nearly 2.5 times, spurred by the explosion in the number of urban inhabitants and upturn in public transport use (figure 4). This shift to public transport was noticeable in developed cities, where the share of public transport trips out of private motorised urban trips (modal share of public transport) increased, on average, by about 20% between 2001 and 2012 in developed cities. This was achieved when efforts to increase its supply are matched with private vehicle demand management and urban densification. By contrast, in developing cities, the modal share of public transport decreased, on average, by 33% between 1995 and 2012.
Before the Corona virus took hold, the average mode share of daily trips by public transport globally accounted for approximately 16% of urban movement, with private means accounting for around half of all journeys – about three times the share of public transport. Both long and short-term trends before the pandemic show that these public transport modes were starting to lose shares (for example, in Europe, public transport share experienced a -0.6 percentage points since 2012) in favour of passenger cars. This means most passenger journeys are still and increasingly being undertaken by private vehicles. This is occurring in all regions, but notably in those where urban populations are reported to have some of the best access to public transport, as measured by the SDG target.
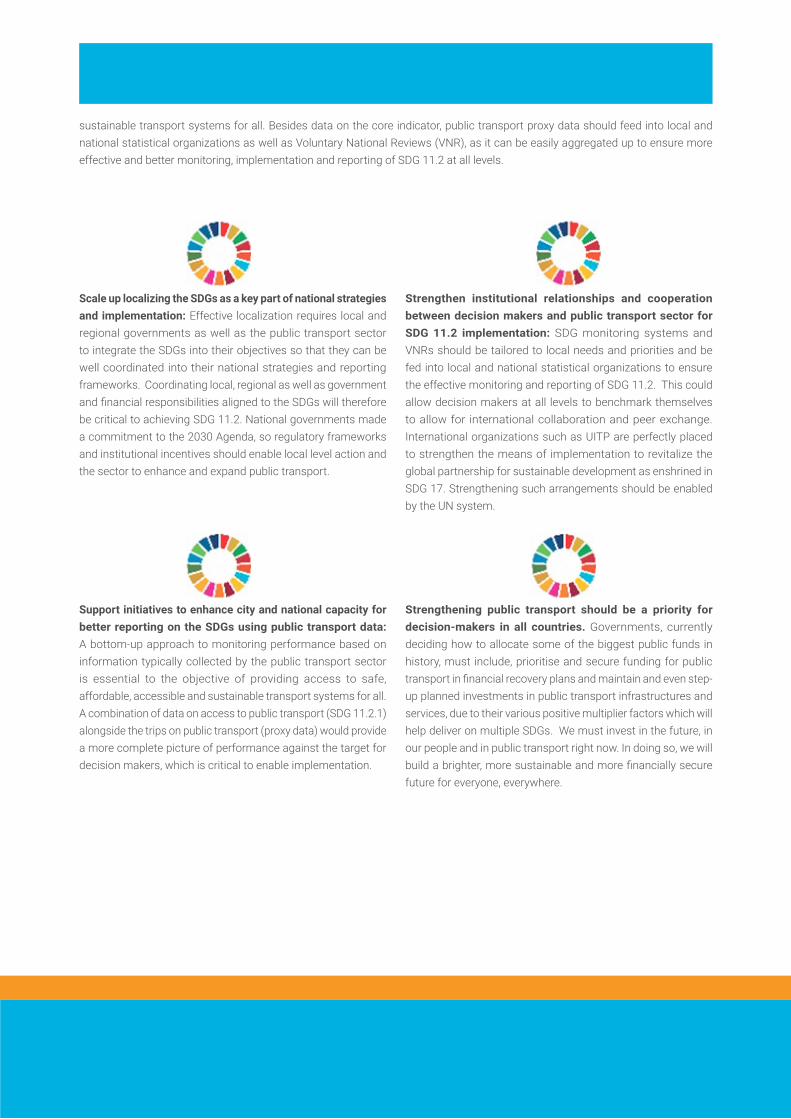
The pandemic has resulted in public transport ridership and mode share falling dramatically even further in cities around the world – with some seeing ridership decrease by 90-95%, with decreases of 40-70% continuing during the recovery period (figure 5). All the while, the public transport sector has maintained high levels of service despite the reduction of travel demand to ensure safe distancing while keeping service continuity.
As we approach the mid-point of the SDG targets, any gains made in public transport ridership over the past decade have all but been lost. The real question is how to bring people back to public transport and whether the pandemic will result in long term changes away towards even more car ridership. However, many
Figure 5: Multi-city comparison – weekly evolution since the start of January 2021 – multimodal ridership (source: UITP)
people across the world continue to rely on public transport for their daily mobility needs so it is essential that trust is maintained in the sector. With the right measures, public transport is Covid safe13, so it is critical that political decision makers encourage people back to using it and make sure that our transit systems receive the investment and support they deserve. Green investments in global public transport systems will not only safeguard existing jobs, but will also create millions of decent, sustainable jobs and cut emissions from the transport sector in cities by over 50% in the next decade14.
Recommendations On The Way Forward
We must forge ahead with the Decade of Action, pledging to mobilize financing, enhance national implementation and strengthen institutions to achieve the Goals by the target date of 2030. With the COVID-19 pandemic continuing to impact lives and livelihoods, progress against the SDG has become all the more important. There are less than 10
years left to implement the 2030 Agenda. More than ever, accelerated efforts are needed to boost sustainable solutions to the biggest challenges, with the public transport sector ready to make a full and active contribution.
Tracking information on public transport passenger volumes could be a good
means to better tracking process against SDG 11.2 as a bottom-up approach to monitoring performance based on information typically collected by the sector can help better immediate decision making to encourage the greater uptake of public transport in our cities. This is essential to the objective of providing access to safe, affordable, accessible and
13 https://www.uitp.org/publications/public-transport-is-covid-safe/
14 https://thefutureispublictransport.org/wp-content/uploads/2021/03/C40-The-Future-of-Public-Transport-Research.pdf 5
sustainable transport systems for all. Besides data on the core indicator, public transport proxy data should feed into local and national statistical organizations as well as Voluntary National Reviews (VNR), as it can be easily aggregated up to ensure more effective and better monitoring, implementation and reporting of SDG 11.2 at all levels.
Scale up localizing the SDGs as a key part of national strategies and implementation: Effective localization requires local and regional governments as well as the public transport sector to integrate the SDGs into their objectives so that they can be well coordinated into their national strategies and reporting frameworks. Coordinating local, regional as well as government and financial responsibilities aligned to the SDGs will therefore be critical to achieving SDG 11.2. National governments made a commitment to the 2030 Agenda, so regulatory frameworks and institutional incentives should enable local level action and the sector to enhance and expand public transport.
Support initiatives to enhance city and national capacity for better reporting on the SDGs using public transport data: A bottom-up approach to monitoring performance based on information typically collected by the public transport sector is essential to the objective of providing access to safe, affordable, accessible and sustainable transport systems for all. A combination of data on access to public transport (SDG 11.2.1) alongside the trips on public transport (proxy data) would provide a more complete picture of performance against the target for decision makers, which is critical to enable implementation.
Strengthen institutional relationships and cooperation between decision makers and public transport sector for SDG 11.2 implementation: SDG monitoring systems and VNRs should be tailored to local needs and priorities and be fed into local and national statistical organizations to ensure the effective monitoring and reporting of SDG 11.2. This could allow decision makers at all levels to benchmark themselves to allow for international collaboration and peer exchange. International organizations such as UITP are perfectly placed to strengthen the means of implementation to revitalize the global partnership for sustainable development as enshrined in SDG 17. Strengthening such arrangements should be enabled by the UN system.
Strengthening public transport should be a priority for decision-makers in all countries. Governments, currently deciding how to allocate some of the biggest public funds in history, must include, prioritise and secure funding for public transport in financial recovery plans and maintain and even step-up planned investments in public transport infrastructures and services, due to their various positive multiplier factors which will help deliver on multiple SDGs. We must invest in the future, in our people and in public transport right now. In doing so, we will build a brighter, more sustainable and more financially secure future for everyone, everywhere.