A Process-Oriented Observational Study of Snowfall Potential in the Central United States Chad M...
21
A Process-Oriented Observational Study of Snowfall Potential in the Central United States Chad M Gravelle Saint Louis University Charles E Graves Saint Louis University Scott M Rochette State University of New York College at Brockport Annual Missouri Academy of Science Meeting Missouri Western State University, 21 April 2007
-
date post
21-Dec-2015 -
Category
Documents
-
view
218 -
download
0
Transcript of A Process-Oriented Observational Study of Snowfall Potential in the Central United States Chad M...

A Process-Oriented Observational Study of
Snowfall Potential in the Central United States
Chad M GravelleSaint Louis University
Charles E GravesSaint Louis University
Scott M RochetteState University of New York College at Brockport
Annual Missouri Academy of Science MeetingMissouri Western State University, 21 April 2007
Outline
• Introduction
• Description of Dataset
• Methodology/Case Selection
• Summary of Results
• Conclusions

Introduction
• Even with advances in numerical and ensemble model guidance, forecasting the axis and spatial extent of heavy snowfall still contains a large amount of uncertainty.
• Gouree and Younkin 1966
• Browne and Younkin 1970• Probabilistic forecasts are used by SPC and HPC to show the uncertainty with an event.

Dataset
• Daily 24-h snowfall amounts were obtained from the National Climate Data Center (NCDC) Cooperative Summary of the Day (COOP) collection for the period of November 1998 and March 2003.
• North American Regional Reanalysis (NARR)– 3-h dataset with 32-km resolution on 29 pressure
levels
• NCDC publications of the Daily Weather Maps.
• COOP and NARR datasets were displayed using the General Meteorological Package (GEMPAK) software.
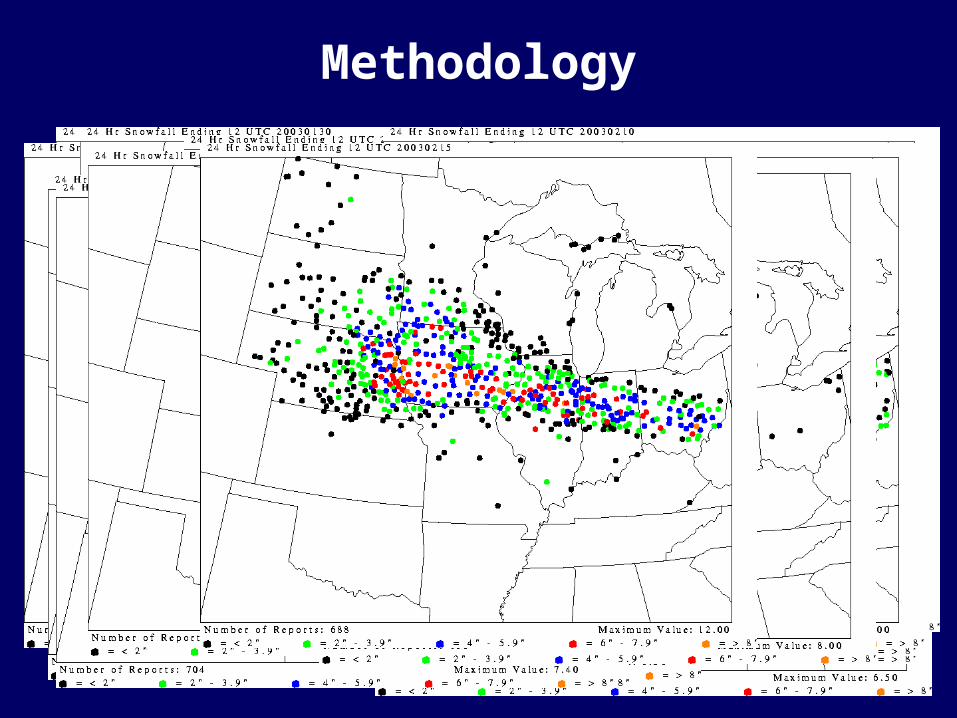
Methodology
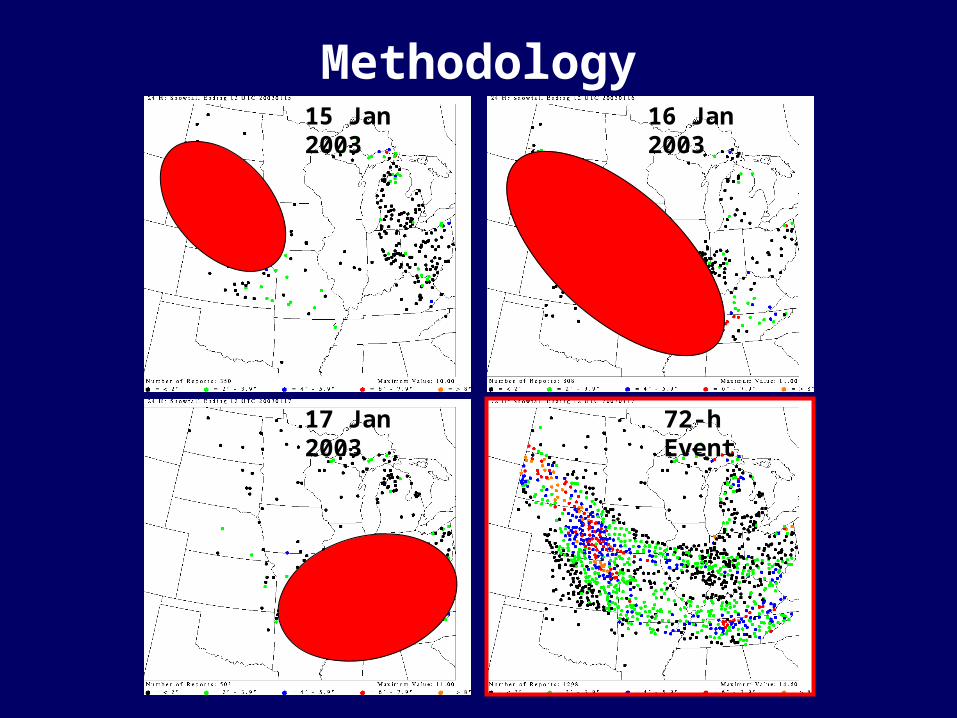
Methodology15 Jan 2003
16 Jan 2003
17 Jan 2003
72-h Event
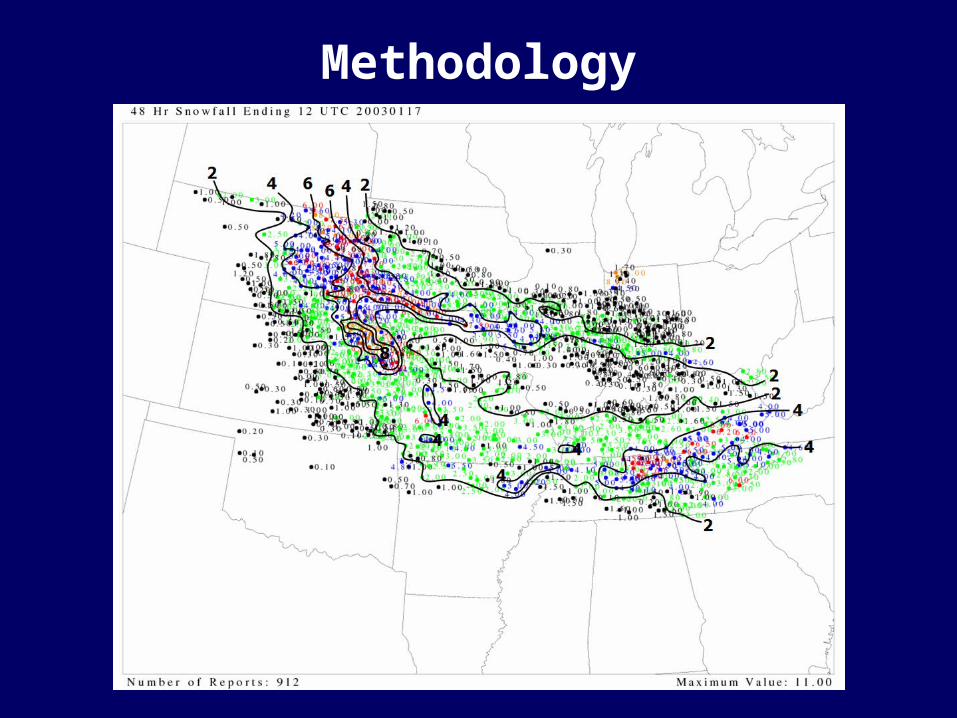
Methodology
Methodology
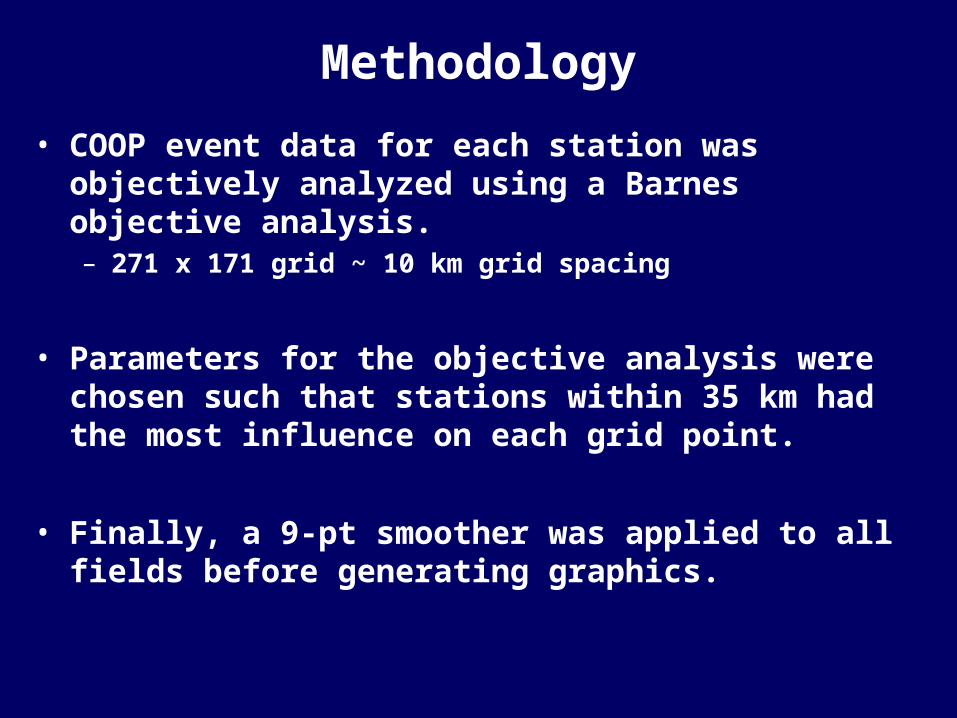
• COOP event data for each station was objectively analyzed using a Barnes objective analysis.– 271 x 171 grid ~ 10 km grid spacing
• Parameters for the objective analysis were chosen such that stations within 35 km had the most influence on each grid point.
• Finally, a 9-pt smoother was applied to all fields before generating graphics.

Methodology

Case Categories
• Total events, n = 82
• Banded (upper left), n = 42• Widespread (upper right), n = 15• Other/Multi-banded/Undefinable
(lower left), n = 25
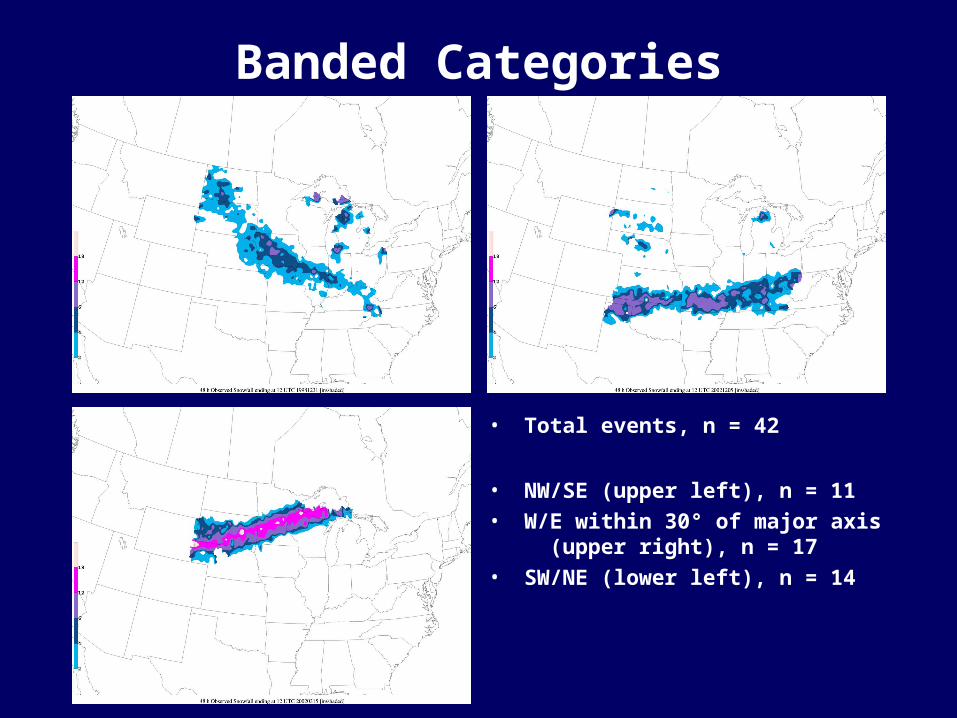
Banded Categories
• Total events, n = 42
• NW/SE (upper left), n = 11• W/E within 30° of major axis
(upper right), n = 17• SW/NE (lower left), n = 14
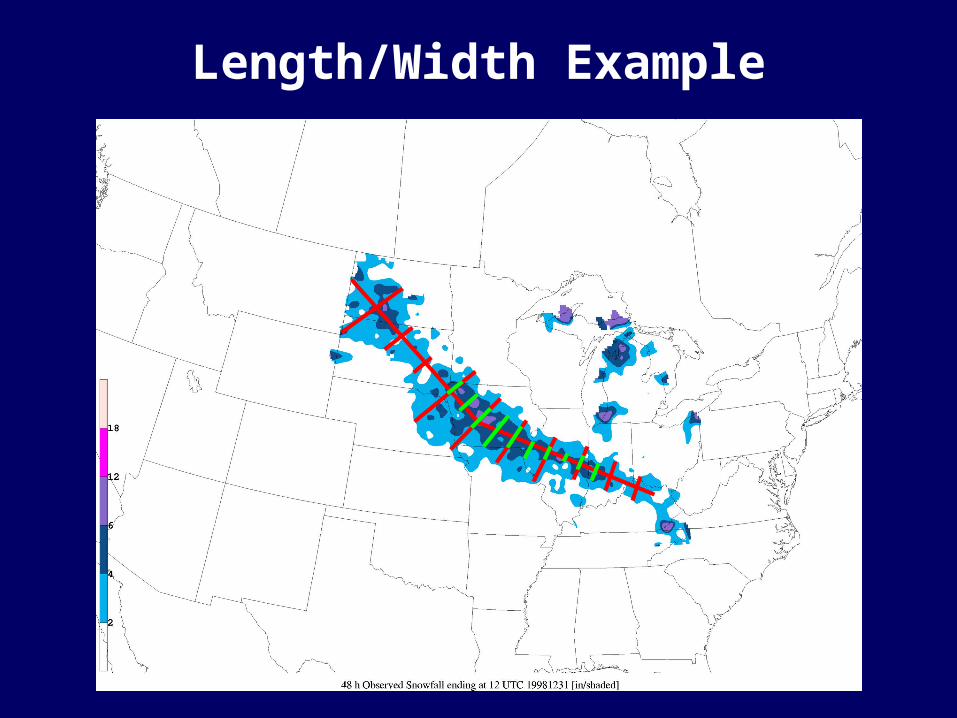
Length/Width Example

Banded Length Statistics
Days Length of > 2" Band Length of > 4" Band Length of > 6" Band Length of > 12" BandNW/ SE AVG 2.3 1389.5 987.4 834.4 none
W/ E AVG 2.4 1308.8 1139.4 892.2 471.3SW/ NE AVG 2.4 1358.4 1121.4 1179.5 820.3
NW/ SE MED 1597.0 885.5 985.0 noneW/ E MED 1353.0 1072.0 940.5 455.0
SW/ NE MED 1323.5 1232.0 1199.5 780.0
NW/ SE SD 460.7 468.7 376.2 noneW/ E SD 371.8 471.0 304.9 35.4
SW/ NE SD 312.3 406.7 271.0 373.6
NW/ SE NORM SD 138.9 165.7 168.2 noneW/ E NORM SD 90.2 114.2 81.5 20.5
SW/ NE NORM SD 83.5 112.8 85.7 152.5

Banded Width Statistics
Width of > 2" Band Width of > 4" Band Width of > 6" Band Width of > 12" BandNW/ SE AVG 220.96 149.79 93.55 none
W/ E AVG 256.43 158.56 119.82 102.09SW/ NE AVG 283.83 216.50 165.86 82.07
NW/ SE MED 206.25 121.37 79.43 noneW/ E MED 271.70 150.57 122.70 114.20
SW/ NE MED 232.94 217.43 170.94 83.04
NW/ SE SD 122.82 84.94 44.61 noneW/ E SD 81.82 70.81 55.11 41.55
SW/ NE SD 148.83 120.06 91.24 25.19
NW/ SE NORM SD 37.03 30.03 19.95 noneW/ E NORM SD 19.84 17.17 14.73 23.99
SW/ NE NORM SD 39.78 33.30 28.85 10.29
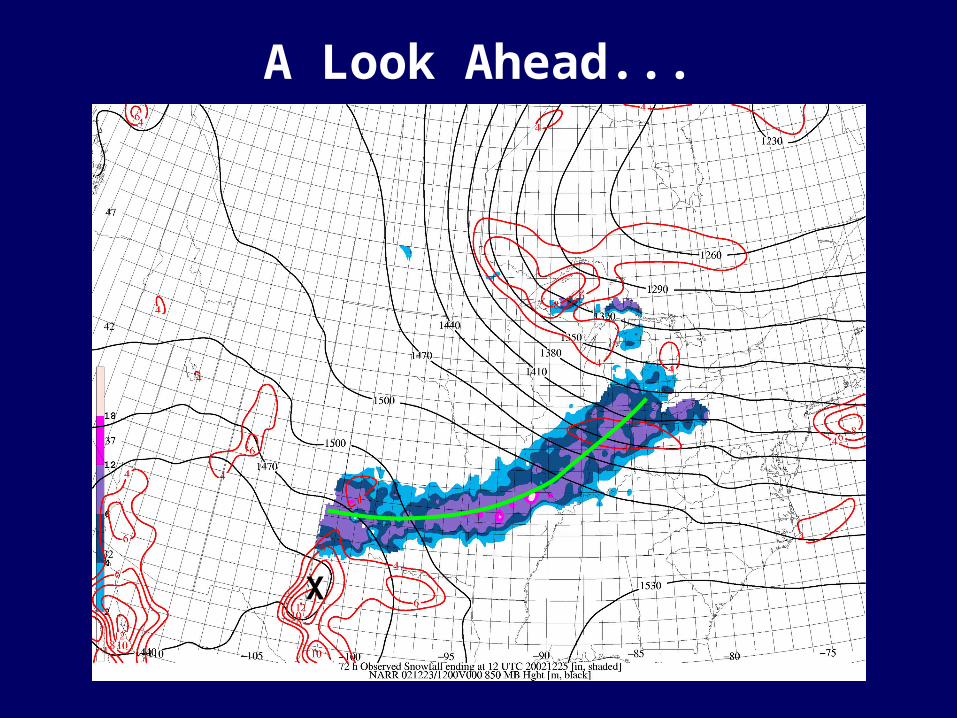
A Look Ahead...
X

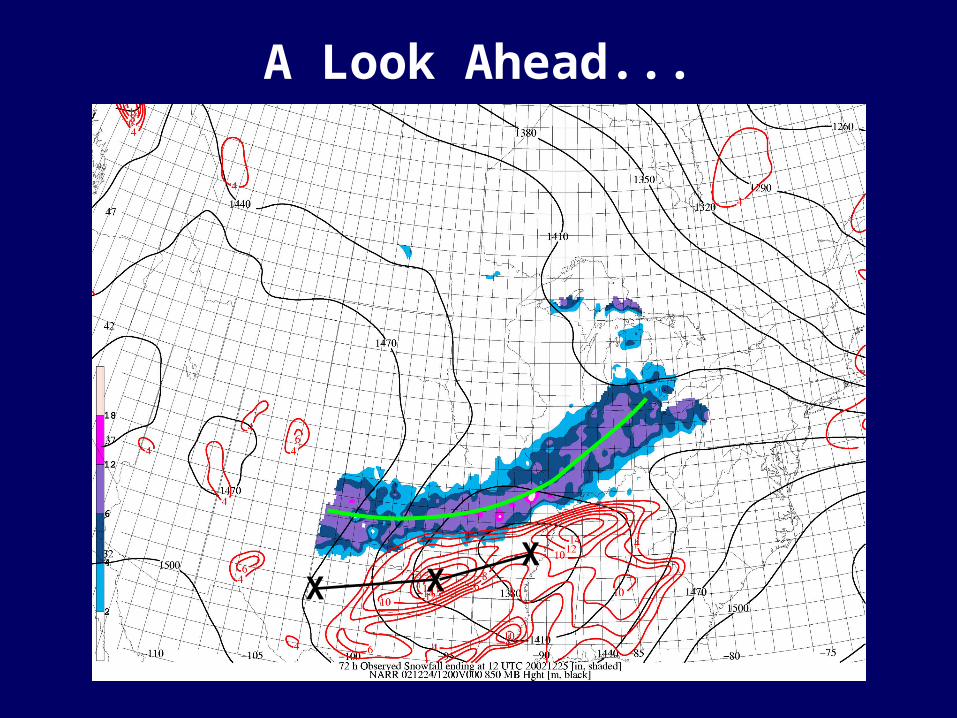
A Look Ahead...
X X
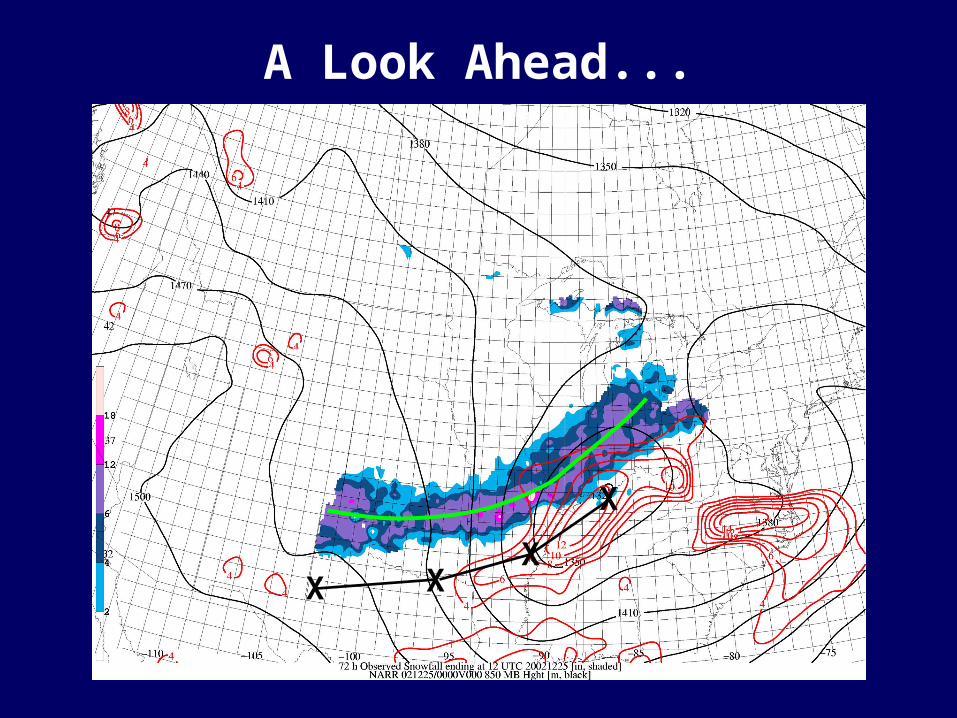
A Look Ahead...
XX
X
A Look Ahead...
X XX
X

Conclusions
• Lengths at lower snowfall thresholds often exceed the domain.
• SW/NE bands are the widest, followed by E/W and NW/SE.
• Early indications suggest that the differences in width of the three orientations are not the results of sampling, but the physical processes associated with snowfall generation.
Future Research
• Using percentiles to provide forecasters with probabilistic guidance on the width of snowfall bands.
• Examine the orientation and strength of processes to snowfall potential.
• Expanding the period of record to include more years.
• Use the identified events as analogs of future events.
Find this, and other presentations online at:
www.eas.slu.edu/CIPS/
Questions or Comments?