A Presentation at JP Morgan China Summit...
24
Mr. MAO Zefeng Senior Assistant Secretary to the Board of Directors And Head of Investor Relations Beijing,June 2013 A Presentation at JP Morgan China Summit 2013
Transcript of A Presentation at JP Morgan China Summit...

Mr. MAO Zefeng
Senior Assistant Secretary to the Board of Directors
And
Head of Investor Relations
Beijing,June 2013
A Presentation at JP Morgan
China Summit 2013

2
Disclaimer
This presentation contains forward-looking statements that involve
risks and uncertainties. These statements are generally indicated by the
use of forward-looking terminology such as believe, expect, anticipate,
estimate, plan, project, target, may, will or other similar words that express
an indication of actions or results of actions that may or are expected to
occur in the future. You should not place undue reliance on these forward-
looking statements, which apply only as of the date of this presentation.
These forward-looking statements are based on our own information and on
information from other sources we believe to be reliable. Our actual results
may be materially less favorable than those expressed or implied by these
forward-looking statements which could affect the market price of our
shares.

3
Agenda
1. 2013 First Quarter Results
2. 2013 Business Outlook
3. Q&A

2013 First Quarter Results

5
First Quarter Financial Highlights
*Earnings per share in RMB
Financial highlights of the first three months ended March 31
RMB Million
2012 2013 Y-o-Y
Change
Q-o-Q
Change (except EPS)
Turnover 525,647 540,263 2.8% -9.5%
Profit from Operations 54,850 53,079 -3.2% 19.1%
Net Profit 39,153 36,017 -8.0% 27%
Basic EPS* 0.21 0.20 -0.01 0.05

6
Exploration & Production Highlights
MM bbl Crude Output, Y-o-Y
1Q2013
+1.8% 227.0 231.0
1Q2012
Marketable Natural Gas , Y-o-Y Bln cf
+4.8%
1Q2012 1Q2013
710.9 745.3
MM bbl Crude Output, Q-o-Q
Marketable Natural Gas , Q-o-Q Bln cf
1Q2013 4Q2012
233.3 231.0
-0.99%
679.5 745.3
1Q2013 4Q2012
+9.68%

7
Exploration & Production Highlights
Average Realized Crude Price
Average Realized Natural Gas Price
Oil & Gas Output
Operating Profit
Three months ended March 31
Three months ended March 31
Three months ended March 31
Three months ended March 31
MM bbl
RMB Million
USD/thousand cubic feet
USD/bbl
- 2.3%
105.48 103.08
2012 2013
4.87 5.07
+4.1%
+2.8%
345.5 355.3
60,376 56,983
- 5.6%

8
921
1,536
475
157
1,1921,071
1,762
366194
893
Refining & Chemicals Highlights
Production of Major Oil Products ‘000 tons Crude Processing Volume MM bbl
Production of Major Chemical Products ‘000 tons 2012
2013
RMB Million
Operating Profit
Three months ended March 31
2012 2013 Y-o-Y Change
Gasoline 6,869 7,556 +10.0%
Kerosene 771 854 +10.8%
Diesel 15,385 14,348 - 6.7%
Three months ended March 31
Three months ended March 31
257.1 253.5
2012 2013
- 1.4%
Ethylene Synthetic
Resin
Synthetic Rubber
Synthetic Fiber
Raw Materials Urea
2012 2013
-10,815
-4,743
+56.1%
Three months ended March 31

9
Refining & Chemicals Highlights
1Q2012 2Q2012 3Q2012 4Q2012 1Q2013
1Q2012 2Q2012 3Q2012 4Q2012 1Q2013
Chemical Operating Profit
Refining Operating Profit

10
Marketing Highlights
‘000 tons 2012 2013 Change
Sales of Oil Products 36,500 37,441 +2.6%
Including:
Gasoline 11,956 12,993 +8.7%
Kerosene 2,741 3,231 +17.9%
Diesel 21,803 21,217 -2.7%
Sales Volume of Major Oil Products
Three months ended March 31
‘000 tons 2012 2013 Change
Sales of Oil Products 22,542 21,577 -4.3%
Including:
Gasoline 6,790 7,316 +7.7%
Kerosene 2,741 3,231 +17.9%
Diesel 13,002 11,030 -15.2%
Sales Volume of Major Oil Products—Domestic Market
Three months ended March 31

11
RMB Million
2013
- 65.0%
6,064
2,122
2012
Three months ended March 31
Operating Profit
Marketing Highlights
Factors Impacting the Operating Profit
Inventory increased - RMB 1.5 Billion Domestic Sales Volume Decreased - RMB0.5Billion Lower Price –RMB 0.9 Billion

12
Natural Gas and Pipeline Highlights
RMB Million Operating Profit
2013
- 45.0%
1,999
1,100
2012
Three months ended March 31
Import Nature Gas 9.15bcm,including: Natural gas from Central Asia: 6.22 bcm, a loss of RMB 8.16 billion
LNG 2.93bcm, a loss of RMB 8.62billion
Total loss: RMB14.5billion, Vat rebate RMB2.3billion
Factors Impacting the Operating Profit

13
International Business Highlights
2012 2013
Overseas Oil & Gas Net Production MM boe
31.2
35.7
+ 14.6%
Three months ended March 31
2012 2013
Overseas Oil Net Production MM boe
26.228.9
+ 10.3%
Three months ended March 31

14
2013 Capex
RMB Million 2013 Capex 2012-2013 Y-o-Y Capex Comparison
67.49%
18.51%
9.13%4.03%
0.84%
Exploration & Production Natrual Gas & Pipeline Refining & Chemicals
Marketing Others
2013 Capex: RMB355 billion
2012 2013
352,516 355,000+0.7%

2013 Business Outlook

16
World economy is slowly recovering while China’s economy is
growing steadily
World economy enters in-depth adjustment, countries
are facing lots of difficulties when adjusting economic
structures. IMF expects world economy growth of 3.4%
for 2013.
China’s macro-economy continued its momentum of a
stable growth, forecasting a 8% GDP growth rate for the
1H 2013 by China State Information Center.

17
World oil supply is sufficient with oil price fluctuating at
moderate high level
IEA forecasts that the world oil demand will be at 89.5
million bbls/d for the 2Q, up 0.3 million bbls/d.
IEA estimates that oil price fluctuates at high level in the
2Q, with Brent oil price ranging among $ 108-113/bbl.

18
A slight increase in domestic oil products demand, hoping for
an increase in chemicals demand
Affected by a sluggish economy, oil products demand
may grow at 3.7% in 2Q and 4.9% in 2013.
With the progress of China’s urbanization, there is a
hope for a slight increase in chemicals demand, with
ethylene consumption growth of 4.2% in 2013.

19
Adhere to Resources Strategy, Maintain Dominance in Domestic
Upstream Business
Exploration &
Production
Oil and gas exploration: Strive for new discoveries in 10
key zones of 7 basins
Oil and gas production: Speed up capacity construction
of 24 oil and gas projects

20
Focus on Efficiency Principle, Continue Adjustment for Refining
and Chemical Business
Refining &
Chemicals
Resource optimization
Layout adjustment, product structure optimization and
quality enhancement
Improve marketing efficiency for chemicals
21
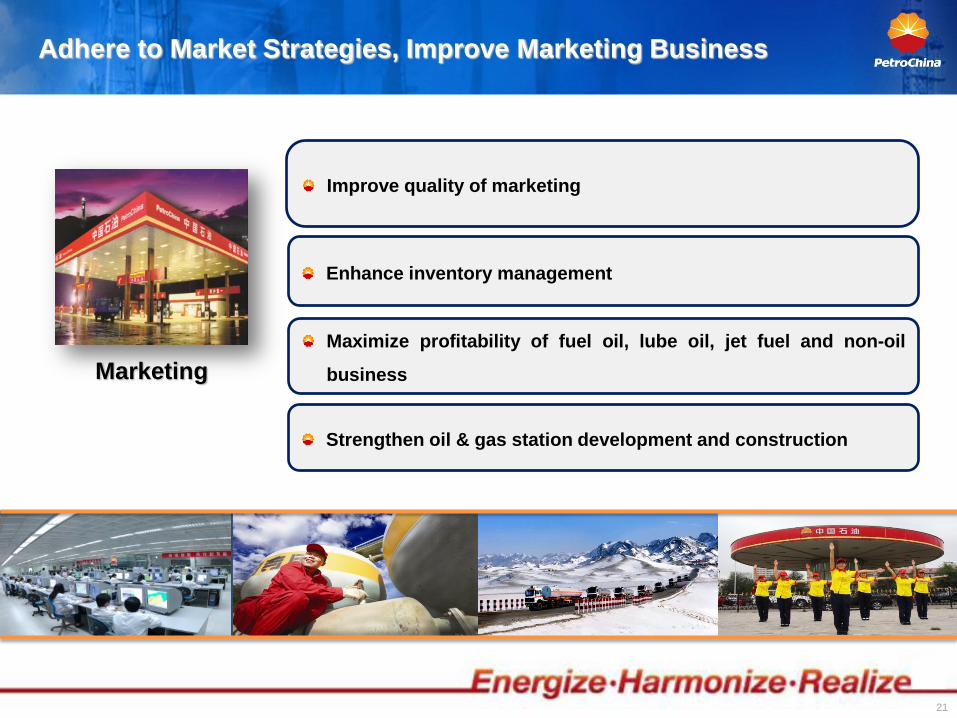
Adhere to Market Strategies, Improve Marketing Business
Marketing
Improve quality of marketing
Enhance inventory management
Strengthen oil & gas station development and construction
Maximize profitability of fuel oil, lube oil, jet fuel and non-oil
business

22
Strengthen Natural Gas Market Development, Work for Price
Change
Natural Gas &
Pipeline
Actively develop Sichuan-Chongqing, Bohai Rim, Yangtze River
Delta, Pearl River Delta, and other key high-effective areas
Work for price change
Implement gas-for-oil projects
Accelerate the construction of key projects

23
Further Enhance International Oil & Gas Cooperation to Become
More International
International
Business
Stabilize and increase production from existing overseas projects
Construction of the three oil and gas operating centers
Lay a solid resource foundation by
a) Mainly independent exploration
b) M & A
c) New Projects

Investor Relations Tel: (852)2899-2010 Fax: (852)2899-2390
Email: [email protected]
Media Relations Tel: (852)2894-6214 Fax: (852)2576-3551
Email: [email protected]