A PREMIUM EDUCATION HOUSE
28
A PREMIUM as on 30 th June, 2021 Investor Presentation EDUCATION HOUSE
Transcript of A PREMIUM EDUCATION HOUSE

A PREMIUM
as on 30th June, 2021
Investor Presentation
EDUCATION HOUSE
2
IndustryOverview
CompanyOverview
Financials

3
About us
OUR BRANDS
State Board Curriculum
CBSE StationeryE-learning – eSense
K12
Rise
Grafalco
Indiannica
YouVa Top Scorer
Top Class
Touch
Study Buddy
The Orchids
International
School
Navneet Education Limited,
founded by the Gala Family, is
an educational syllabus-based
supplementary content provider
in Print & Digital medium and a
manufacturer of Scholastic
Paper stationery for domestic
and international markets. New
range of text books for students
of CBSE and ICSE Boards are
sold across India.
Over the years, the company
has built a strong brand in the
Educational Content &
Scholastic Stationery gaining a
leadership position. The
company has a dominant
market share of about 65% in
western India.
Navneet
Vikas
Gala
4
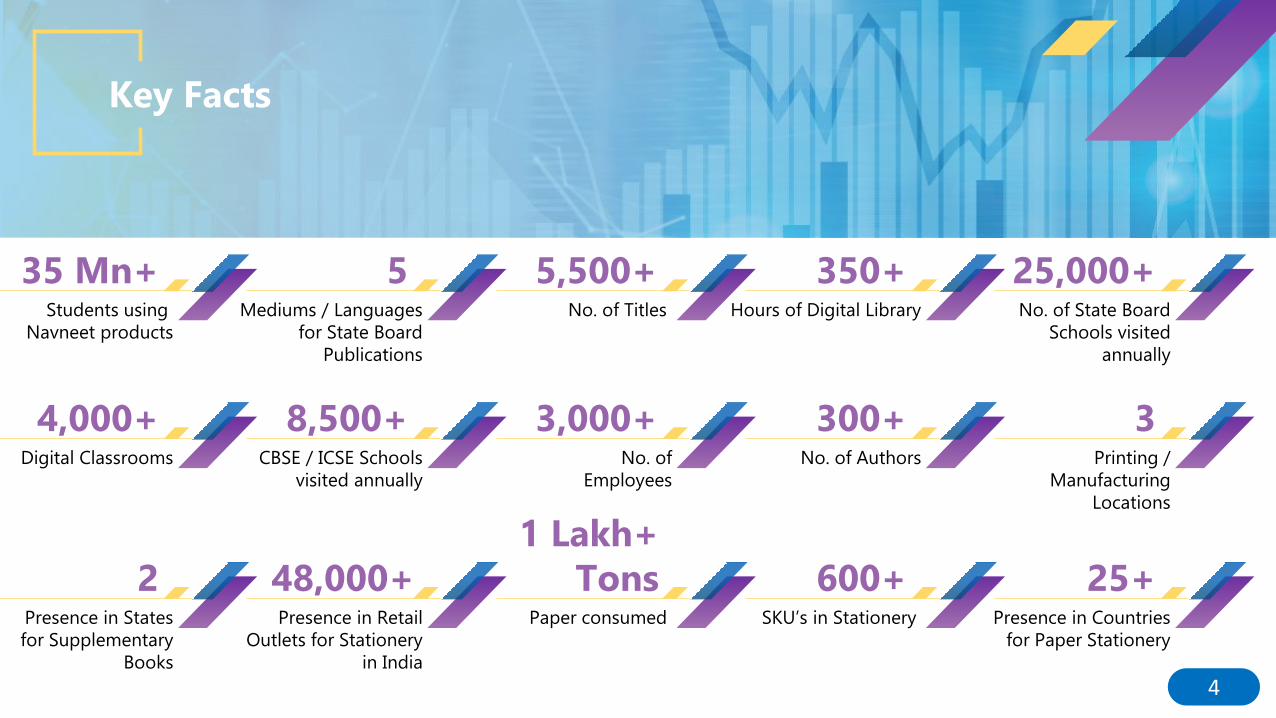
Key Facts
Students using
Navneet products
35 Mn+
Digital Classrooms
4,000+
Presence in States
for Supplementary
Books
2
Mediums / Languages
for State Board
Publications
5
CBSE / ICSE Schools
visited annually
8,500+
Presence in Retail
Outlets for Stationery
in India
48,000+
No. of Titles
5,500+
No. of
Employees
3,000+
Paper consumed
1 Lakh+ Tons
Hours of Digital Library
350+
No. of Authors
300+
SKU’s in Stationery
600+
No. of State Board
Schools visited
annually
25,000+
Printing /
Manufacturing
Locations
3
Presence in Countries
for Paper Stationery
25+

5
6 Decades of Navneet
1959
First Digest /
Guide Published
for Std. X
Workbook
Concept
Introduce
d
Published 21
Most Likely
Question Sets
1970
1975
19901993
1994
20082011 2014 2016
2017
2018
2019
2020
Children
Books
Introduce
d
Scholastic
Stationery
First Educational
Publisher to
be listed
on BSE and NSE
&
Entered
B2B Digital
Learning
Space
Ventured into
School
Managemen
Entered B2C Digital
Learning Space
New Stationery
brand
YOUVA launched,
Acquired Indiannica
Learning
Pvt. Ltd. (earlier
Encyclopaedia
Britannica (India) Pvt.
Ltd.)
Achieved Milestone
Turnover of ₹1,000
crores, Introduction of
premium stationery
products under
brand “HQ”
Digital Assessment
Platform for schools
/children
Branded
Stationery in
UAE
Launch of
new Edtech
Products

6
Global Presence

7
Navneet’s Presence
Supplementary BooksMaharashtra & Gujarat
Digital PresenceMaharashtra & Gujarat
Orchid InternationalMumbai, Pune, Bengaluru, Hyderabad and Kolkata
Text BooksAndaman & Nicobar, Andhra Pradesh, Arunachal Pradesh, Assam, Bihar,
Chhattisgarh, Delhi, Gujarat, Haryana, Himachal Pradesh, Jammu & Kashmir,
Jharkhand, Karnataka, Kerala, Madhya Pradesh, Maharashtra, Manipur, Meghalaya,
Nagaland, Odisha, Punjab, Rajasthan, Tamil Nadu, Telangana, Tripura, Uttar Pradesh,
Uttarakhand, West Bengal and Sri Lanka
StationeryMaharashtra, Goa, Gujarat, Dadra & Nagar Haveli, Diu & Daman, Madhya Pradesh,
Chhattisgarh, West Bengal, Bihar, Jharkhand, Orissa, Rajasthan, Delhi, Haryana,
Chandigarh, Punjab, Himachal Pradesh, Uttar Pradesh, Uttarakhand, Jammu &
Kashmir, Karnataka, Kerala, Tamil Nadu, Andhra Pradesh, Telangana, Andaman &
Nicobar, Assam, Meghalaya, Manipur, Tripura, Nagaland, Arunachal Pradesh,
Sikkim, Nepal

8
eSENSE Learning
1.2Mn
4,000+
350+
2,00,000+
15,000+
15,000+
210+
Institutes using TOPClass
Students learning through
TOPScorer
Hours of digital content
Classrooms Digitised
Team of Authors, Illustrators and
animators
Videos
MCQs

9
Indiannica Learning
SCHOOLS VISITEDANNUALLY
8,500+Schools
o Extensive product catalogue comprising educational, instructional and information
products & technology solution.
o Offers specialized curricular learning solutions consisting of textbooks, interactive
student, teacher resources and training materials.
o Key export markets include Sri-Lanka, Nepal and GCC.
CURRICULUM
CBSE, ICSE, SSB
LOCATIONS
Pan-India School Presence
EMPLOYEES
220+
TARGET REACH
25,000+ CBSE / ICSE & 20,000+
SSC Schools

10
K12 Techno Services
Over the last few
years, quality Direct
Education is in great
demand in the
Country and hence
seen a sudden
growth.
42No. of Schools
(CBSE/ICSE)
7Locations
29,200+No. of Students58,300+
Capacity
54.5%29.8%
15.7%
SHAREHOLDING
Sequoia Capital
Navneet Learning LLP
Sofina Ventures
Locations No. of Schools
Bangalore (16 schools + 1 College) 17
Mumbai 13
Hyderabad 2
Pune 7
Kolkata 1
Chennai 1
Gurgaon 1
TOTAL 42
11
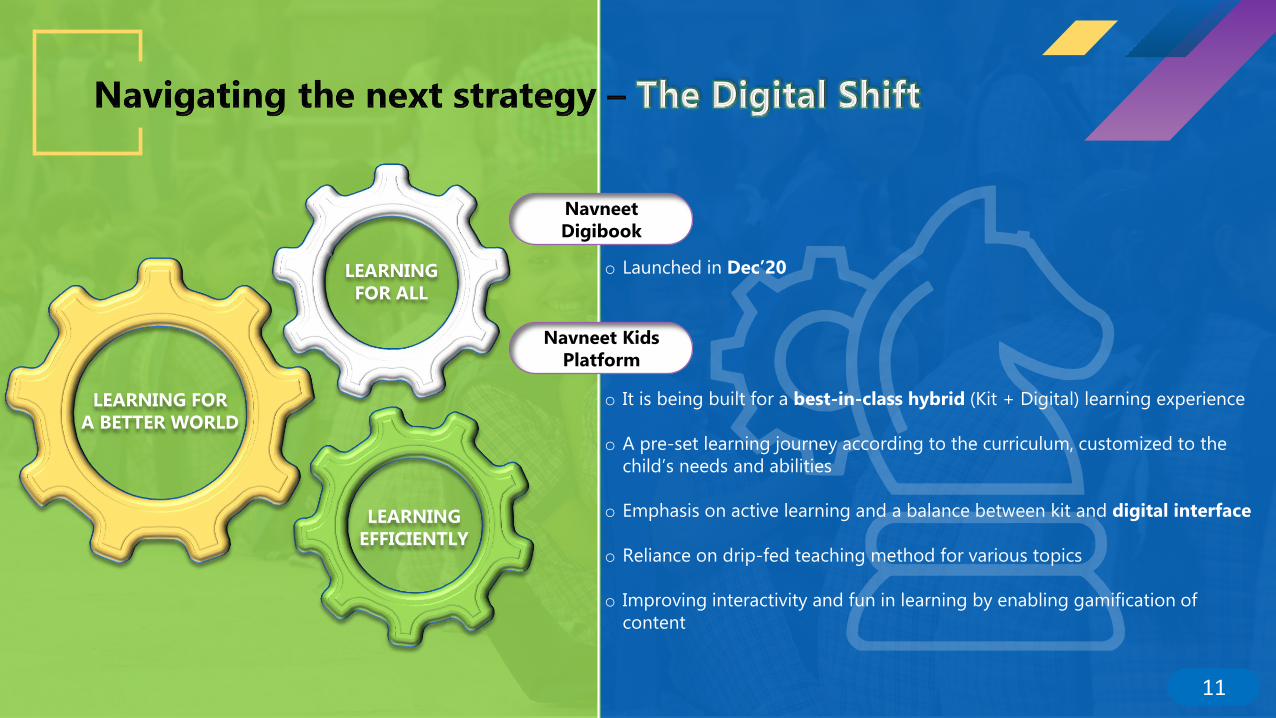
o Launched in Dec’20
o It is being built for a best-in-class hybrid (Kit + Digital) learning experience
o A pre-set learning journey according to the curriculum, customized to the
child’s needs and abilities
o Emphasis on active learning and a balance between kit and digital interface
o Reliance on drip-fed teaching method for various topics
o Improving interactivity and fun in learning by enabling gamification of
content
LEARNING FOR A BETTER WORLD
LEARNING FOR ALL
LEARNING EFFICIENTLY
NavneetDigibook
Navneet Kids Platform

12
Industry Overview
CompanyOverview
Financials
13
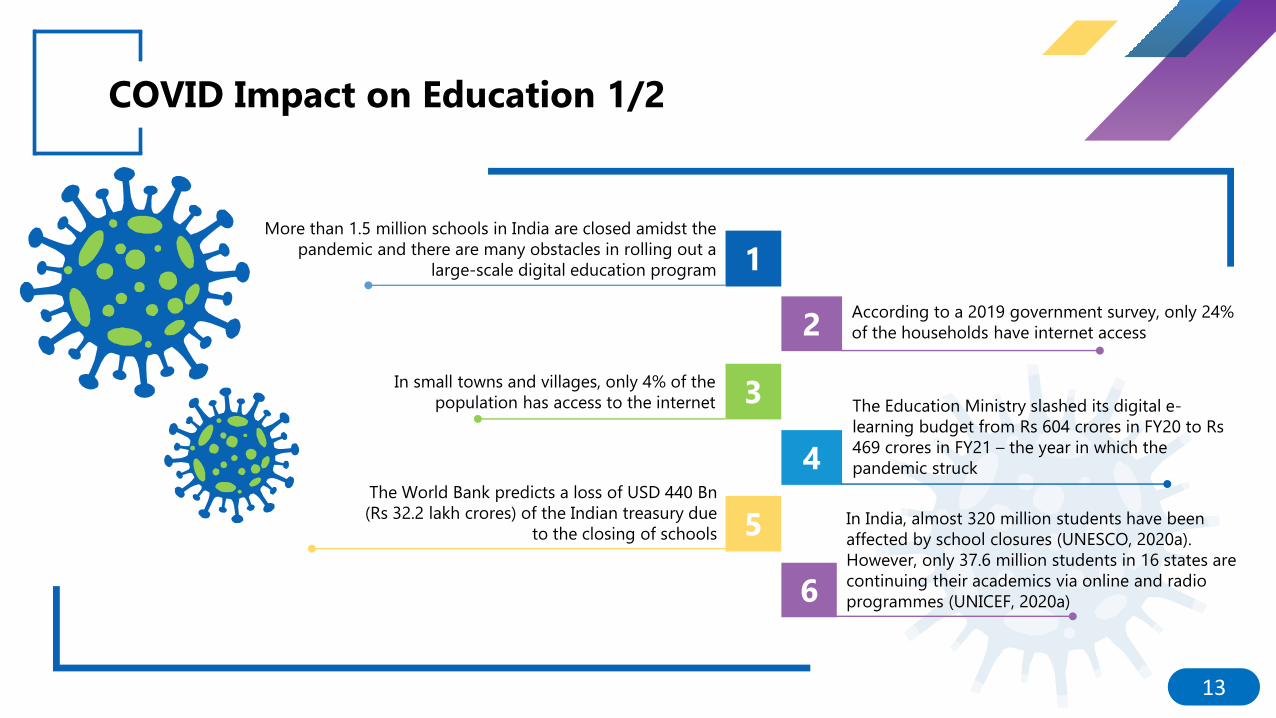
COVID Impact on Education 1/2
6
More than 1.5 million schools in India are closed amidst the
pandemic and there are many obstacles in rolling out a
large-scale digital education program 1
3In small towns and villages, only 4% of the
population has access to the internet
5The World Bank predicts a loss of USD 440 Bn
(Rs 32.2 lakh crores) of the Indian treasury due
to the closing of schools
According to a 2019 government survey, only 24%
of the households have internet access2
4
The Education Ministry slashed its digital e-
learning budget from Rs 604 crores in FY20 to Rs
469 crores in FY21 – the year in which the
pandemic struck
In India, almost 320 million students have been
affected by school closures (UNESCO, 2020a).
However, only 37.6 million students in 16 states are
continuing their academics via online and radio
programmes (UNICEF, 2020a)

14
In West Bengal, child labour amongst school-going
children has risen by 105 per cent during the COVID
pandemic
Numerous challenges have surfaced, including
access to capital, merging technology efficiently
into business models and training teachers for
digital platforms
Schools lack the infrastructure to maintain social
distancing
COVID Impact on Education 2/2
7
8
9
10
11
The disruption in school services has led to a severe
impact on the health of 115 mn children who
received Mid Day Meal (MDM) on a daily basis
Even with the rise of digital learning methods, there are
many students who cannot avail these services. These
include students with disabilities, belonging to
minorities, coming from migrant or refugee camps and
the ones living in the most remote parts of the country

15
Edtech Key Growth Drivers in India
Low Cost of online Education
Increasing Employability Quotient
Government’s Digital initiative
Increasing smartphone user base
Growing internet penetration
Increasing Disposable
Income
Increasing Young Population
Unavailability of Quality Education
Favourable e-learning government policies such as
Skill India, SWAYAM, SANKALP, STRIVE, DIKSHA,
and National Digital Library among others
Rising demand among working
professionals due to the flexibility of
time

16
Value Proposition
Fast-paced EdTech
adoption in a post-
Covid-19 world
Strong balance
sheet and good
liquidity
Pool of
promising
talent
Customer-
centric
products
Healthy
partnerships
Integrating
content, products
and IPs to make
the business
more valuable
High-quality and
cost-effective
products leading
to better access
and results

17
Company Overview
IndustryOverview
Financials

18
STANDALONE FINANCIAL RESULTS – Q1FY22
ParticularsQtr. Ended June’ 21
Q1FY22 % of Rev Q1FY21 % of Rev
Income from Operations 31,832 32,487
Other Income 685 226
Total Revenue 32,516 32,713
COGS 16,508 16,922
Employee benefits 3,622 3,238
Other General Overheads 5,528 4,547
Total Expenses 25,658 24,707
EBITDA 6,859 22% 8,006 19%
Depreciation 799 829
EBIT 6,060 7,176
Finance cost 118 360
PBT 5,942 19% 6,817 21%
Tax 1,489 1,752
PAT 4,453 14% 5,065 16%
Other Comprehensive Income (OCI) (249) 705
Total Comprehensive Income (TCI) 4,204 5,770

19
STANDALONE FINANCIAL RESULTS – Q1FY22
Q1 FY22 9,877 3,341 18,495
Q1 FY21 12,359 4,612 15,470
Publications Stationery - Domestic Stationery - Exports
Segmental Revenue28%20%
32,713
32,517
Q1FY21 Q1FY22
Total Revenue
-1%8,006
6,859
Q1FY21 Q1FY22
EBITDA
-14%
6,817
5,942
Q1FY21 Q1FY22
PBT
-13%
20%

20
Annual Performance Over the Years
1,11,333 1,16,145 1,37,992 1,46,718
81,750
16.8%4.2%
18.8%6.3%
-44.3%
-50.0%
-40.0%
-30.0%
-20.0%
-10.0%
0.0%
10.0%
20.0%
30.0%
0
20,000
40,000
60,000
80,000
1,00,000
1,20,000
1,40,000
1,60,000
FY17 FY18 FY19 FY20 FY21
Total Revenue and Growth (%)
Total Revenue Growth
27,445 26,392 30,704 34,351 12,585
24.6% 22.7% 22.2% 23.4%
15.4%
0.0%
5.0%
10.0%
15.0%
20.0%
25.0%
30.0%
-
5,000
10,000
15,000
20,000
25,000
30,000
35,000
40,000
FY17 FY18 FY19 FY20 FY21
EBITDA & Margins (%)
EBITDA Margin
24,599 23,446 27,072 29,514 8,428
22.1% 20.2% 19.6% 20.1%
10.3%
0.0%
5.0%
10.0%
15.0%
20.0%
25.0%
-
5,000
10,000
15,000
20,000
25,000
30,000
35,000
FY17 FY18 FY19 FY20 FY21
PBT & Margins (%)
PBT Margin
16,165 15,322 17,748 21,935 6,163
14.5% 13.2% 12.9%15.0%
7.5%
0.0%
2.0%
4.0%
6.0%
8.0%
10.0%
12.0%
14.0%
16.0%
-
5,000
10,000
15,000
20,000
25,000
FY17 FY18 FY19 FY20 FY21
PAT & Margins (%)
PAT Margin
(Rs. in lakhs)

21
73,973 82,205 88,738 99,455 1,05,924
33.7%29.2% 31.8% 31.0%
8.6%0.0%
5.0%
10.0%
15.0%
20.0%
25.0%
30.0%
35.0%
40.0%
-
20,000
40,000
60,000
80,000
1,00,000
1,20,000
FY17 FY18 FY19 FY20 FY21
ROCE %
Capital Employed ROCE %
23.8 21.7
14.2
6.5
29.7
0.0
5.0
10.0
15.0
20.0
25.0
30.0
35.0
FY17 FY18 FY19 FY20 FY21
Price to Earnings (x)
72,560 80,841 87,196 96,572 1,03,887
22.3%19.0% 20.4% 22.7%
5.9%
0.0%
5.0%
10.0%
15.0%
20.0%
25.0%
-
20,000
40,000
60,000
80,000
1,00,000
1,20,000
FY17 FY18 FY19 FY20 FY21
Networth & Return on Networth
(%)
Networth Return on NW%
6.81 6.567.67
9.58
2.69
0.00
2.00
4.00
6.00
8.00
10.00
12.00
FY17 FY18 FY19 FY20 FY21
Earnings per share (in Rs)
31.07 34.61 38.10 42.20 45.39
0.00
10.00
20.00
30.00
40.00
50.00
60.00
70.00
FY17 FY18 FY19 FY20 FY21
Book value per share (in Rs)
Annual Performance Over the Years
(Rs. in lakhs)

22
0.6 0.7 0.61.1
2.4
0.0
1.0
2.0
3.0
FY17 FY18 FY19 FY20 FY21
Healthy Pre-tax Cash Flows From Operations /
EBITDA
125%
75%50%
150%
50%
0%
20%
40%
60%
80%
100%
120%
140%
160%
FY17 FY18 FY19 FY20 FY21
Consistent Dividend Payout (%)
0.2
0.3
0.4
0.3
0.00.0
FY17 FY18 FY19 FY20 FY21
Low Leverage with Debt / Equity (x)71.9
40.3
23.8 23.613.3
0.02.04.06.08.0
10.012.014.016.018.020.022.024.026.028.030.032.034.036.038.040.042.044.046.048.050.052.054.056.058.060.062.064.066.068.070.072.074.076.0
FY17 FY18 FY19 FY20 FY21
Interest Coverage Ratio (x)
Annual Performance Over the Years

23
Asset Productivity Ratios for the last 5 years
4.3
2.5
3.5
4.5
5.1
FY17 FY18 FY19 FY20 FY21
Fixed Asset Turnover (x)
1.2
1.1 1.1 1.1
0.6
FY17 FY18 FY19 FY20 FY21
Total Assets Turnover (x)
24
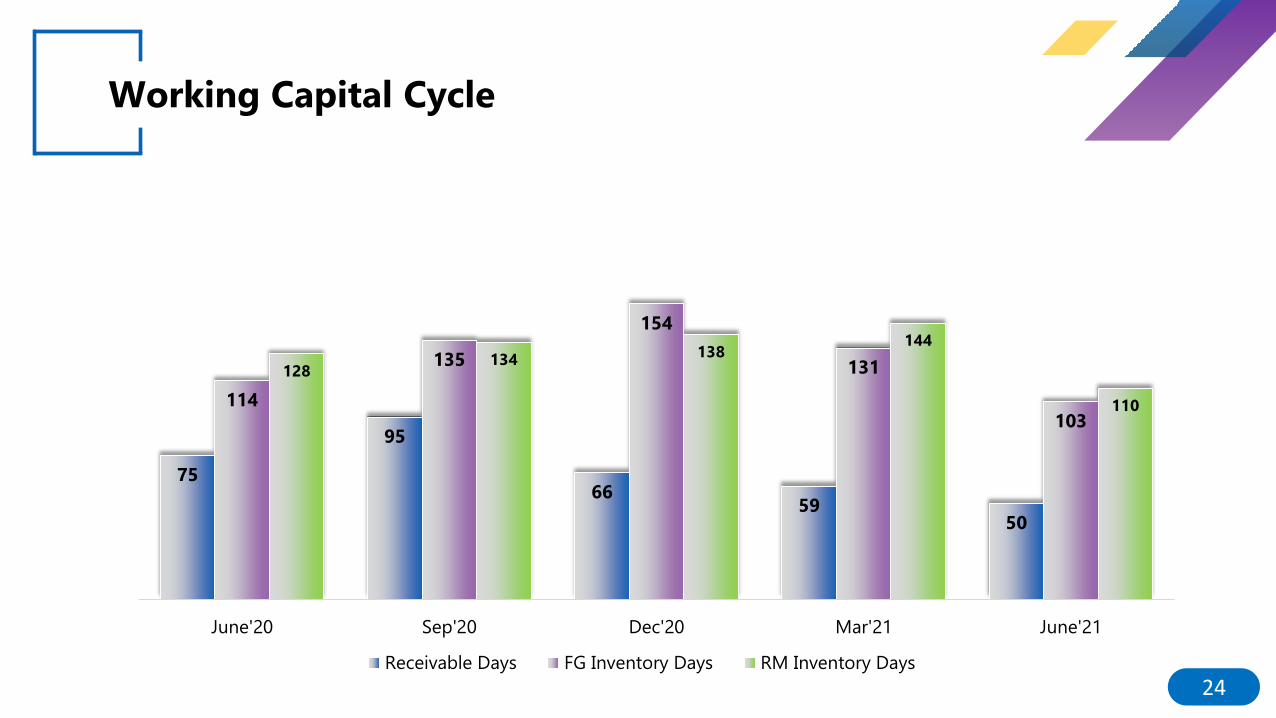
Working Capital Cycle
75
95
6659
50
114
135
154
131
103
128134 138
144
110
0
20
40
60
80
100
120
140
160
180
June'20 Sep'20 Dec'20 Mar'21 June'21
Receivable Days FG Inventory Days RM Inventory Days

25
CONSOLIDATED PERFORMANCE FOR Q1 FY22
Particulars Q1FY22 Q1FY21
NEL 31,831 32,487
eSense 226 110
Indiannica 961 603
NLLP -
NHKL 154 90
K12
NTVPL
Inter co Adjust (387) (90)
Total 32,785 33,199
Q1FY22 Q1FY21
6,858 8,006
(192) (255)
(159) (607)
# #
21 #
# -
16 (76)
6,543 7,068
Q1FY22 Q1FY21
4,452 5,064
(502) (397)
(346) (747)
# #
21 #
(436) 85
# -
21 (68)
3,210 3,938
Revenues Rs. In lakhs EBITDA Rs. In lakhs PBT Rs. In lakhs

26
Outlook
NEL’s ability to significantly
expand its footprint in states
other than Maharashtra and
Gujarat and make inroads in
other national (CBSE and ICSE)
and state level boards amidst
the competitive business
environment will be the key
positives.
Ability of the company to
stabilize the business
operations of the
subsidiaries and increase its
exposure from the digital
segment.
The formal education
segment’s growth should
rebound to 10-12% over the
medium term on the back of
urbanisation, increasing
enrolment in the tertiary
segment, and economic
rebound. In the meantime,
recovery in fees collection and
cash flow management will
remain monitorable

27
Corporate & Shareholding Information
62.33%22.41%
15.26%
Promoters
Others
Institutions
Shareholding Pattern (as on 30th June, 2021)
Market Cap as on 09th August, 2021 ₹ 2,325 Cr.
Stock Price as on 09th August, 2021 ₹ 102.00
52 Week (High / Low) ₹ 107.35/72.30
NSE / BSE - Symbol NAVNETEDUL /508989
No. of Shares Outstanding 22,88,70,500
Stock Data
Stock Performance (as on 09th August, 2021)
76.70 76.55 80.50 83.70 81.4586.40
80.1074.75
84.8591.80
99.65 101.00
0.00
20.00
40.00
60.00
80.00
100.00
120.00
Sep-20 Oct-20 Nov-20 Dec-20 Jan-21 Feb-21 Mar-21 Apr-21 May-21 Jun-21 Jul-21 Aug-21
THANK YOUNAVNEET EDUCATION LIMITED Corporate Identity Number L22200MH1984PLC034055
Corporate Office & Regd. Office : Navneet Education Limited, Navneet Bhavan, Bhavani
Shankar Road, Dadar-(West), Mumbai – 400028.
Website: www.navneet.com
E-mail Id: [email protected]
Investor Relations Contact Roomy Mistry | Head - Investor Relations | Navneet Education Limited
Address: Navneet Education Limited | Navneet Bhavan | Bhavani Shankar Road, Dadar-
(West), Mumbai – 400028.
Phone: +91 22 6662 6565 | Mobile: +91 98199 58878
Email Id: [email protected]