
A preliminary study on infrared thermal imaging of cross ... · involved an incremental treadmill...
10
A preliminary study on infrared thermal imaging of cross-country skiers and swimmers subjected to endurance exercise Zofia Drzazga 1 • Mariusz Binek 1 • Ilona Pokora 2 • Ewa Sadowska-Kre ˛pa 3 Received: 11 January 2018 / Accepted: 16 April 2018 / Published online: 7 May 2018 Ó The Author(s) 2018 Abstract This study was focused on the thermal mapping of skin over the selected muscle zones in two groups of elite athletes fully engaged in completely other sports performing about an hour running effort at individual AT intensity. Two groups of elite male athletes, a group of cross-country skiers (CS; N = 6) and a group of elite endurance swimmers (SW; N = 4), were investigated. Thermal images of sportsmen’ body at front and from the rear were recorded before and about 1–2 min after exercise test using camera Flir Systems E60. Functional (heart rate, oxygen uptake, workload) as well as biochemical markers (activities of creatine kinase and lactate dehydrogenase, concentration of lactate and haemoglobin) were also assessed. The marked differentiation in skin temperature distribution in cross-country skiers and endurance swimmers subjected to the same endurance exercise on treadmill was observed. There was significant decrease in temperature in upper body temperature in CS group, while SW group revealed a significant increase in temperature of the lower limbs. The calculated total body skin temperature was also influenced by practicing training of elite athletes. Some significant correlations of physiological, biochemical and morphological parameters (% fat) with average temperature after exercise test were found for different muscle zones in swimmers and cross-country skiers. Statistical analysis showed that workload had the most impact on skin temperature changes, especially in swimmers. The results provide additional information on the muscle work in the different sport disciplines and may be helpful in efficiency evaluation of elite athletes. Keywords IR thermal mapping Training Cross-country skiers Swimmers Muscles Biochemical markers Functional factors Introduction Infrared thermography is a non-invasive and easy-to-per- form method of imaging, and it is becoming useful in different modalities of clinical medicine including sports medicine [1–4]. The aim of medical infrared thermography (MIT) use in sports medicine is not to be a substitute for clinical examination, but to enhance and support it. It can be concluded that MIT is a reliable, low-cost detection tool that should be applied for pre-scanning athletes. Athletes are exposed to many physical stresses during training and competition season. Overuse reactions and so-called minor traumas are very frequent; therefore, early detection is critical to avoid injuries. Research suggests that the most beneficial application of MIT is the screening of individ- uals for overuse injuries [3]. Moreover, thermal imaging can give important information about state of sportsman health and recovery after different exercises. What is more, & Zofia Drzazga zofi[email protected] 1 Department of Medical Physics, A. Chelkowski Institute of Physics, The Silesian Centre for Education and Interdisciplinary Research, University of Silesia in Katowice, ul. 75 Pulku Piechoty 1A, 41-500 Chorzow, Poland 2 Department of Physiological and Medical Sciences, Department of Physiology, The Jerzy Kukuczka Academy of Physical Education in Katowice, ul. Mikolowska 72a, 40-065 Katowice, Poland 3 Department of Physiological and Medical Sciences, Department of Biochemistry, The Jerzy Kukuczka Academy of Physical Education in Katowice, ul. Mikolowska 72a, 40-065 Katowice, Poland 123 Journal of Thermal Analysis and Calorimetry (2018) 134:701–710 https://doi.org/10.1007/s10973-018-7311-y
Transcript of A preliminary study on infrared thermal imaging of cross ... · involved an incremental treadmill...

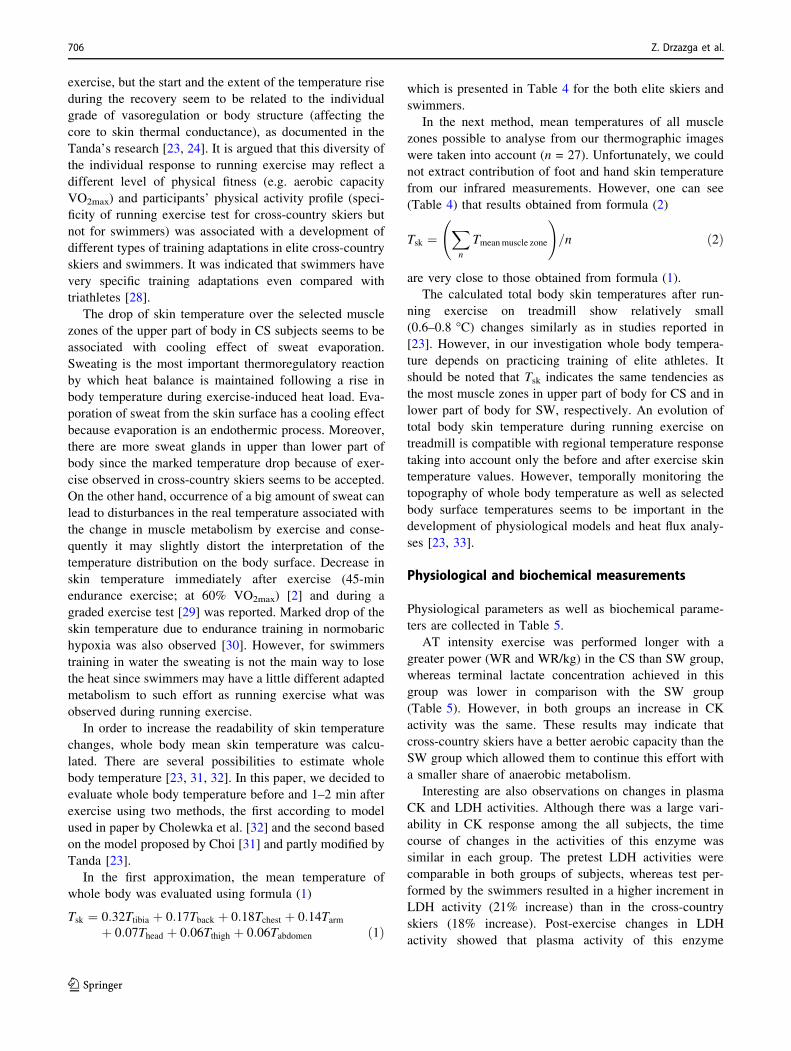
A preliminary study on infrared thermal imaging of cross-countryskiers and swimmers subjected to endurance exercise
Zofia Drzazga1 • Mariusz Binek1 • Ilona Pokora2 • Ewa Sadowska-Krepa3
Received: 11 January 2018 / Accepted: 16 April 2018 / Published online: 7 May 2018� The Author(s) 2018
AbstractThis study was focused on the thermal mapping of skin over the selected muscle zones in two groups of elite athletes fully
engaged in completely other sports performing about an hour running effort at individual AT intensity. Two groups of elite
male athletes, a group of cross-country skiers (CS; N = 6) and a group of elite endurance swimmers (SW; N = 4), were
investigated. Thermal images of sportsmen’ body at front and from the rear were recorded before and about 1–2 min after
exercise test using camera Flir Systems E60. Functional (heart rate, oxygen uptake, workload) as well as biochemical
markers (activities of creatine kinase and lactate dehydrogenase, concentration of lactate and haemoglobin) were also
assessed. The marked differentiation in skin temperature distribution in cross-country skiers and endurance swimmers
subjected to the same endurance exercise on treadmill was observed. There was significant decrease in temperature in
upper body temperature in CS group, while SW group revealed a significant increase in temperature of the lower limbs.
The calculated total body skin temperature was also influenced by practicing training of elite athletes. Some significant
correlations of physiological, biochemical and morphological parameters (% fat) with average temperature after exercise
test were found for different muscle zones in swimmers and cross-country skiers. Statistical analysis showed that workload
had the most impact on skin temperature changes, especially in swimmers. The results provide additional information on
the muscle work in the different sport disciplines and may be helpful in efficiency evaluation of elite athletes.
Keywords IR thermal mapping � Training � Cross-country skiers � Swimmers � Muscles � Biochemical markers �Functional factors
Introduction
Infrared thermography is a non-invasive and easy-to-per-
form method of imaging, and it is becoming useful in
different modalities of clinical medicine including sports
medicine [1–4]. The aim of medical infrared thermography
(MIT) use in sports medicine is not to be a substitute for
clinical examination, but to enhance and support it. It can
be concluded that MIT is a reliable, low-cost detection tool
that should be applied for pre-scanning athletes. Athletes
are exposed to many physical stresses during training and
competition season. Overuse reactions and so-called minor
traumas are very frequent; therefore, early detection is
critical to avoid injuries. Research suggests that the most
beneficial application of MIT is the screening of individ-
uals for overuse injuries [3]. Moreover, thermal imaging
can give important information about state of sportsman
health and recovery after different exercises. What is more,
& Zofia Drzazga
1 Department of Medical Physics, A. Chełkowski Institute of
Physics, The Silesian Centre for Education and
Interdisciplinary Research, University of Silesia in Katowice,
ul. 75 Pułku Piechoty 1A, 41-500 Chorzow, Poland
2 Department of Physiological and Medical Sciences,
Department of Physiology, The Jerzy Kukuczka Academy of
Physical Education in Katowice, ul. Mikołowska 72a,
40-065 Katowice, Poland
3 Department of Physiological and Medical Sciences,
Department of Biochemistry, The Jerzy Kukuczka Academy
of Physical Education in Katowice, ul. Mikołowska 72a,
40-065 Katowice, Poland
123
Journal of Thermal Analysis and Calorimetry (2018) 134:701–710https://doi.org/10.1007/s10973-018-7311-y(0123456789().,-volV)(0123456789().,-volV)

examined changes of temperature during training, can get
impact of physical stress to temperature during this train-
ing. The skin thermal response depends on a number of
specific physiological adjustments as body fluid home-
ostasis, cardiovascular fitness, muscle metabolism and
athlete’s health, which allow to establishing interesting
applications in sport. In professional sport, many details as
possible about athlete are needed. Using thermography can
give as some more knowledge about muscle preservation
[3, 4].
Endurance competitive sport such as skiing or swim-
ming imposes substantial energy, mechanical, mental and
emotional burdens on the human. This reflects, among
other things, on a number of biochemical and haemato-
logical properties, which display significant differences
between athletes and non-athletes in blood samples col-
lected at rest and after exercise. Most prominent among
these properties are lactate (LA) concentration and activi-
ties of creatine kinase (CK) and lactate dehydrogenase
(LDH) [5, 6]. The post-exercise blood LA level is very
useful indicator of both the extent of involvement of
anaerobic processes during work and anaerobic work
capacity in subjects. In turn, increase in plasma activities of
CK and LDH due to their leakage from cell into the
extracellular fluids is generally considered as being
indicative of cellular damage. Therefore, a daily monitor-
ing of training status takes place with measurement of these
parameters in plasma [7–13].
Cross-country skiing is the most demanding sport aimed
at endurance which requires one the highest peak oxygen
uptake. However, to reach a world-class level in competi-
tions skiers have increased other physiological factors
affecting top speed on skis, such as muscular strength and
the ability to generate high power [14, 15]. Anaerobic
threshold related to oxidative capacity of muscle in young
female cross-country skiers was discussed [13]. What’s
more biomechanical aspects of complex movement (double
poling) were studied by EMG [16]. However, according to
our knowledge correlations between thermal parameters
and biochemical factors in athletes have not been analysed
yet except for the lactate level. Lactate threshold against
temperature during maximal aerobic test in athletes [11]
and in capillary blood during post-exercise recovery in
non-trained subjects [12] was reported.
On the other hand, thermography studies for swimmers
were performed more often [17–20]. Purpose of quantify-
ing the influence of the swimming style on the cartogra-
phies of cutaneous temperatures of a swimmer by infrared
thermography was presented [17]. Temperature changes in
particular skin areas in the course of front crawl swimming
were evaluated [18]. An assessment of energetic-metabolic
activity of selected muscles of upper extremities and body
during breaststroke swimming through infrared
thermography was described taking into account sides of
body [19]. Changes in infrared radiation and overloaded
structures of the musculoskeletal system in swimmers were
also detected [20]. However, we do not find any article
comparing evaluation of skin temperature of athletes
practicing endurance swimming and cross-country skiing
taking into consideration physiological and biochemical
factors also.
The aim of this study was to assess the skin temperature
distribution in two groups of elite athletes: cross-country
skiers and swimmers fully engaged in completely other
sports as a response to the same exercise test (running on
treadmill) as well as to analyse the impact of physiological
and biochemical factors on skin temperature changes over
the selected muscles. We would like using thermography to
obtain temperature patterns characteristic for the elite
sportsmen which could provide an information on body’s
adaptation to physical effort, efficiency of thermoregula-
tory system, enabling athletes to continue performing as
their highest sport level.
Materials and methods
Subjects
Two groups of elite male athletes, a group of cross-country
skiers (CS; N = 6) and a group of elite endurance swim-
mers (SW; N = 4) from Academic Sports Association
(AZS) in the Jerzy Kukuczka Academy of Physical Edu-
cation, volunteered to participate in this study. The cross-
country skiers are the members of Polish National Team,
and the swimmers are taking part in the world champi-
onships. The main limitation of our study is the small
number of participants recruited from the elite athletes,
especially swimmers.
All subjects were in the preparatory period of the annual
training plan. They were informed of the purpose, possible
risks and the benefits of the study before giving their
written consent to participate. The study protocol con-
formed to the ethical guidelines of the World Medical
Association Declaration of Helsinki and was approved by
the Ethics Committee of the Jerzy Kukuczka Academy of
Physical Education in Katowice, Poland.
At the beginning of study, the subjects’ body mass and
composition and aerobic fitness were assessed. The basic
characteristics of athletes are presented in Table 1.
Procedure
In order to determine the aerobic fitness, the maximal
oxygen uptake (VO2max) and lactate threshold (AT) were
determined directly, during VO2max test. The VO2max test
702 Z. Drzazga et al.
123

involved an incremental treadmill running to exhaustion:
starting at 6 km h-1, 0% gradient with speed increasing by
2 km h-1 every 3 min, until speed of 14 km h-1. There-
after, the treadmill gradient has been increased by 2.5%
every 3 min until volitional exhaustion. During the exer-
cise test, heart rate (HR) (Polarelectro, Finland) and oxy-
gen uptake (VO2) (was applied—open circuit spirometer,
OXYCON, Jaeger, Germany) were measured and blood
lactate concentration was determined. Lactate threshold
(AT) was designated as the point (workload) at which
blood lactate increased exponentially.
Two weeks after preliminary testing, all participants
were tested again on a treadmill. A proper exercise test
involved about an hour of running effort at individual AT
intensity. Thermal images of sportsmen’ body at front and
from the rear (nine thermal images for each subject
including head) were recorded using camera Flir Systems
E60 with resolution of camera 320 9 240 pixels and with
sensitivity 0.05 K before and about 1–2 min after the
completion of exercise test (after exercise used consistently
thereafter). All measurements were performed in a similar
way to the Glamorgan Protocol including thermal imaging
in its medical standards [21, 22]. The results were analysed
by using a ThermaCAM TM Researcher Pro 2.8 SR-3
focusing on the muscle zones according the model pro-
posed by Fernandez-Cuevas et al. [2].
Blood samples were drawn from the antecubital vein
into test tubes anticoagulated with heparin at rest (0) and
immediately following the run (T). Fresh plasma samples
were assayed for activities of creatine kinase (CK, EC
2.7.3.2) and lactate dehydrogenase (LDH, EC 1.1.1.27),
and concentration of lactate (LA), using diagnostic kits
from Randox Laboratories (CK522, LD3818 and LC2389,
respectively). Haemoglobin (Hb) was assayed by a stan-
dard cyan-methaemoglobin method using a diagnostic kit
(HG980, Randox, UK).
All experiments were performed in a human functional
testing laboratory, Katowice Academy of Physical
Education on treadmill H/P/Cosmos Pulsar at 19 ± 0.5 �Cambient temperature, 56 ± 3% relative humidity and
985 ± 5 hPa atmospheric pressure.
Statistical analysis
The results were analysed in Statistica 12. Variables’ val-
ues were compared using a Wilcoxon and paired Student
t test. Statistical significance was accepted at p\ 0.05.
Correlation coefficients between two variables were cal-
culated using a Pearson-product moment correlation
matrix.
Results and discussion
This study used a running exercise model performed at
individual anaerobic threshold to evaluate the contribution
of physiological factors and biochemical markers in
determining the changes in skin temperatures after exercise
in cross-country skiers and endurance swimmers.
Thermography assessment
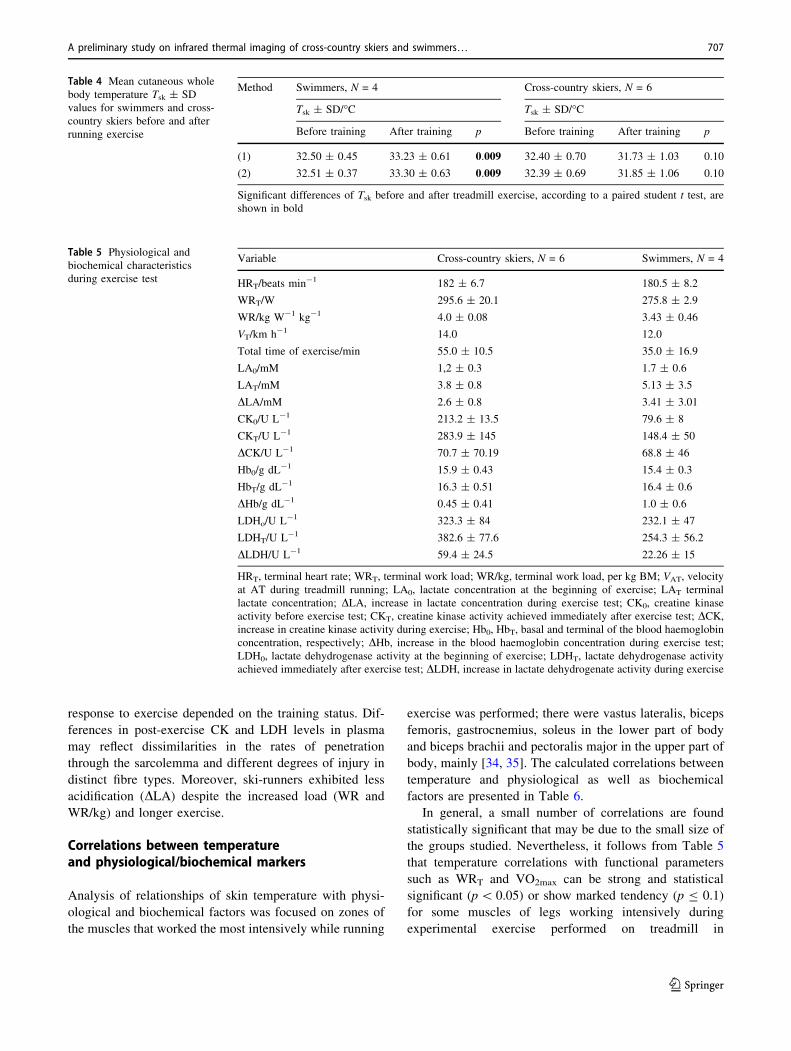
Representative thermographs of body surface including
upper and lower part, before and after running exercise for
ski-runners and swimmers, are shown in Figs. 1 and 2,
respectively. ROIs of interest including 22 muscle zones
for each sportsman were taken into account. Thermo-
graphic recordings present a complex physiological
response of the skin to similar exercise load at individual
AT intensity of cross-country skiers and endurance swim-
mers. It should be noted that skin temperature changes of
body surface due to exercise test were different in cross-
country skiers and endurance swimmers. A marked drop of
the temperature in upper part of body immediately after
physical exertion in cross-country skiers unlike swimmers
was observed. What is more, after exercise the upper part
Table 1 Athletes’
characteristicsParameters Cross-country skiers, N = 6 Swimmers, N = 4
Age/years 23 ± 2.68 21.5 ± 2.08
BH/cm 179.07 ± 3.0 185.25 ± 4.57
BW/kg 73.47 ± 3.16 80.75 ± 6.73
BF/kg 5.3 ± 1.21 7.52 ± 5.56
VO2max/L min-1 4.68 ± 0.55 4.78 ± 0.31
VO2max/mL kg-1 min-1 64 ± 5.85 58 ± 8.48
BMI 22.93 ± 1,03 23.55 ± 2.08
% fat 7.23 ± 1.70 9.32 ± 663
Data are presented as mean ± SD
BH, body height; BW, body mass; BF, total body fat; VO2max, maximal oxygen uptake; BMI, body mass
index
A preliminary study on infrared thermal imaging of cross-country skiers and swimmers… 703
123

of body in cross-country skiers was cooler than legs, while
in swimmers skin temperature of the lower part of body
was hotter than temperature of the upper part of body.
Tanda [23] has evaluated the response of skin temperature
to different types of running exercise on treadmill under
controlled laboratory conditions. The author indicated a
fall in total body skin temperature during the initial stage of
running exercise, regardless of the type of work (with
graded or constant load). In the case of constant load
exercise, the skin temperature decreases at the beginning of
the work, followed by a little increase over time. It is
argued that the initial decline and the subsequent slight rise
in skin temperature is the net result of the competition
between the vasoconstrictor response, which lasts as long
as the exercise is continued, and the vasodilatory response
initiated after cessation of exercise, induced by the
increasing body temperature.
In this study, thermographic data indicated that skin
response to exercise test was specific for the group of tested
subjects. There was probably a difference in the blood
distribution and sweat gland recruitment pattern or sweat
output per gland during exercise in cross-country skiers and
swimmers. In nearly all areas, left–right difference of
temperature is not significant similar as in [19].
In order to get better insight into problem, differences in
skin temperature measured before and after exercise test
DTsk (DTsk = Tskin after - Tskin before) for the selected
muscle zones were calculated. Mean DTsk over the muscles
Fig. 1 Example thermograms of body surface for cross-country skiers
in front A, A0, C, C0 and B, B0, D, D0 from back surface of body
registered a before exercise, b after exercise test. 1 trapezios muscle,
2 pectoralis major, 3 deltoid muscle, 4 serratus anterior, 5 biceps
brachii, 6 trapezios muscle (neck), 7 trapezius muscle (back), 8 rear of
deltoid muscle, 9 latissimus dorsi, 10 triceps brachii
Fig. 2 Example thermograms of body surface for swimmers in front
A, A0, C, C0 and B, B0, D, D0 from back surface of body registered
a before exercise, b after exercise test. 1 vastus lateralis, 2 rectus
femoris, 3 muscles of pubic bone, 4 vastus medialis, 5 knee (at front),
6 tibialis anterior, 7 soleus, 8 biceps femoris, 9 remaining thin
muscles, 10 knee (rear), 11 gastrocnemius caput laterale, 12
gastrocnemius caput mediale
704 Z. Drzazga et al.
123

in upper part of body and lower limbs for both groups is
listed in Tables 2 and 3, respectively.
It should be noted that temperature changes over spec-
ified muscle zones were relatively big and showed signif-
icant temperature increase in the lower limbs in SW in the
range 1.06–2.63 �C and temperature drop in the upper part
of body for CS in the range from – 0.66 to - 2.02 �C.
However, DTsk of head (cheeks and forehead) due to run-
ning exercise was very similar in the both studied groups.
It should be noted that statistically significant drop of
the temperature occurs only for upper part of body in the
cross-country skiers and increase in the temperature for the
lower limbs in the swimmers. These results indicate that
practicing sports may affect the thermal map of skin over
the muscles. Tanda [24], Merla et al. [25] and Ludwig et al.
[26] documented the different temperature responses of
thighs, forearms and trunk as well as the presence of
hyperthermal spots over the entire body during the recov-
ery; these findings are likely to be related to the cutaneous
blood flow adaptation to the specific exercise and probably
participants’ thermal activity profile—related to type of
training adaptation. A type of sport can induce specific to
the nature of the training activity physiological and mor-
phological adaptations. Following training, the cardiovas-
cular and thermoregulatory systems along with their
components go through various adaptive changes. The
nature of these systemic and organ adaptations is highly
specific to a particular sport with respect to the type of
conditioning and apparent stimuli to which the athlete is
subjected [27]. The shape of the time distribution of skin
temperature was different for the swimmers and cross-
country runners participating in the constant AT load
Table 2 Mean DTsk ± SD
values of upper body muscle
zones for elite swimmers and
elite cross-country skiers as a
response to running exercise
Muscle Swimmers, N = 4 Cross-country skiers, N = 6
DTsk ± SD/�C p DTsk ± SD/�C p
Forehead 0.58 ± 0.4 0.17 0.50 ± 1.5 0.32
Cheeks 3.5 ± 0.8 0.0004 2.89 ± 1.4 0.0000
Trapezius muscle - 0.43 ± 0.4 0.25 - 1.48 ± 0.9 0.0001
Deltoid muscle 0.03 ± 0.6 0.90 - 1.46 ± 1.4 0.004
Pectoralis major 0.24 ± 0.4 0.40 - 2.06 ± 1.3 0.0002
Serratus anterior 0.26 ± 0.3 0.50 - 2.02 ± 1.4 0.0001
Abdomen 0.13 ± 0.4 0.75 - 2.61 ± 1.3 0.0000
Biceps brachii 0.56 ± 0.7 0.50 - 1.25 ± 1.2 0.003
Trapezius mascle (neck) - 0.08 ± 0.3 0.26 - 0.48 ± 1.3 0.20
Rear of deltoid muscle 0.50 ± 0.6 0.25 - 0.2 ± 0.8 0.70
Trapezius muscle (back) 0.68 ± 0.6 0.15 - 0.66 ± 0.7 0.002
Latissimus dorsi 0.57 ± 0.5 0.42 - 0.93 ± 1.0 0.0006
Triceps brachii 0.79 ± 1.4 0.30 - 1.04 ± 2.2 0.15
Significant results of DTsk of muscles, according to a paired student t test, are in bold
Table 3 Mean DTsk ± SD
values of lower body muscle
zones for elite swimmers and
elite cross-country skiers as a
response to running exercise
Muscle Swimmers, N = 4 Cross-country skiers, N = 6
DTsk ± SD/�C p DTsk ± SD/�C p
Vastus lateralis 1.10 ± 0.7 0.1 - 0.01 ± 1.5 0.75
Rectus femoris 1.53 ± 0.9 0.049 - 0.2 ± 1.9 0.55
Vastus medialis - 0.19 ± 1.2 0.2 - 0.11 ± 1.2 0.5
Biceps femoris 1.49 ± 0.7 0.01 - 0.46 ± 1.1 0.6
Remaining thigh muscles 1.36 ± 0.8 0.02 - 0.37 ± 1.2 0.4
Knees (at front) 2.63 ± 0.7 0.01 0.4 ± 2.3 0.5
Knees (rear) 0.54 ± 0.6 0.1 - 0.47 ± 1.3 0.1
Tibialis anterior 0.77 ± 0.6 0.15 - 0.02 ± 1.2 0.6
Soleus 1.48 ± 0.5 0.02 0 ± 1.3 0.3
Gastrocnemius caput laterale 1.20 ± 0.6 0.004 - 0.23 ± 0.9 0.6
Gastrocnemius caput mediale 1.06 ± 0.3 0.003 - 0.17 ± 0.9 0.7
Significant results of DTsk of muscles, according to a paired student t test, are in bold
A preliminary study on infrared thermal imaging of cross-country skiers and swimmers… 705
123
exercise, but the start and the extent of the temperature rise
during the recovery seem to be related to the individual
grade of vasoregulation or body structure (affecting the
core to skin thermal conductance), as documented in the
Tanda’s research [23, 24]. It is argued that this diversity of
the individual response to running exercise may reflect a
different level of physical fitness (e.g. aerobic capacity
VO2max) and participants’ physical activity profile (speci-
ficity of running exercise test for cross-country skiers but
not for swimmers) was associated with a development of
different types of training adaptations in elite cross-country
skiers and swimmers. It was indicated that swimmers have
very specific training adaptations even compared with
triathletes [28].
The drop of skin temperature over the selected muscle
zones of the upper part of body in CS subjects seems to be
associated with cooling effect of sweat evaporation.
Sweating is the most important thermoregulatory reaction
by which heat balance is maintained following a rise in
body temperature during exercise-induced heat load. Eva-
poration of sweat from the skin surface has a cooling effect
because evaporation is an endothermic process. Moreover,
there are more sweat glands in upper than lower part of
body since the marked temperature drop because of exer-
cise observed in cross-country skiers seems to be accepted.
On the other hand, occurrence of a big amount of sweat can
lead to disturbances in the real temperature associated with
the change in muscle metabolism by exercise and conse-
quently it may slightly distort the interpretation of the
temperature distribution on the body surface. Decrease in
skin temperature immediately after exercise (45-min
endurance exercise; at 60% VO2max) [2] and during a
graded exercise test [29] was reported. Marked drop of the
skin temperature due to endurance training in normobaric
hypoxia was also observed [30]. However, for swimmers
training in water the sweating is not the main way to lose
the heat since swimmers may have a little different adapted
metabolism to such effort as running exercise what was
observed during running exercise.
In order to increase the readability of skin temperature
changes, whole body mean skin temperature was calcu-
lated. There are several possibilities to estimate whole
body temperature [23, 31, 32]. In this paper, we decided to
evaluate whole body temperature before and 1–2 min after
exercise using two methods, the first according to model
used in paper by Cholewka et al. [32] and the second based
on the model proposed by Choi [31] and partly modified by
Tanda [23].
In the first approximation, the mean temperature of
whole body was evaluated using formula (1)
Tsk ¼ 0:32Ttibia þ 0:17Tback þ 0:18Tchest þ 0:14Tarm
þ 0:07Thead þ 0:06Tthigh þ 0:06Tabdomen ð1Þ
which is presented in Table 4 for the both elite skiers and
swimmers.
In the next method, mean temperatures of all muscle
zones possible to analyse from our thermographic images
were taken into account (n = 27). Unfortunately, we could
not extract contribution of foot and hand skin temperature
from our infrared measurements. However, one can see
(Table 4) that results obtained from formula (2)
Tsk ¼X
n
Tmean muscle zone
!=n ð2Þ
are very close to those obtained from formula (1).
The calculated total body skin temperatures after run-
ning exercise on treadmill show relatively small
(0.6–0.8 �C) changes similarly as in studies reported in
[23]. However, in our investigation whole body tempera-
ture depends on practicing training of elite athletes. It
should be noted that Tsk indicates the same tendencies as
the most muscle zones in upper part of body for CS and in
lower part of body for SW, respectively. An evolution of
total body skin temperature during running exercise on
treadmill is compatible with regional temperature response
taking into account only the before and after exercise skin
temperature values. However, temporally monitoring the
topography of whole body temperature as well as selected
body surface temperatures seems to be important in the
development of physiological models and heat flux analy-
ses [23, 33].
Physiological and biochemical measurements
Physiological parameters as well as biochemical parame-
ters are collected in Table 5.
AT intensity exercise was performed longer with a
greater power (WR and WR/kg) in the CS than SW group,
whereas terminal lactate concentration achieved in this
group was lower in comparison with the SW group
(Table 5). However, in both groups an increase in CK
activity was the same. These results may indicate that
cross-country skiers have a better aerobic capacity than the
SW group which allowed them to continue this effort with
a smaller share of anaerobic metabolism.
Interesting are also observations on changes in plasma
CK and LDH activities. Although there was a large vari-
ability in CK response among the all subjects, the time
course of changes in the activities of this enzyme was
similar in each group. The pretest LDH activities were
comparable in both groups of subjects, whereas test per-
formed by the swimmers resulted in a higher increment in
LDH activity (21% increase) than in the cross-country
skiers (18% increase). Post-exercise changes in LDH
activity showed that plasma activity of this enzyme
706 Z. Drzazga et al.
123
response to exercise depended on the training status. Dif-
ferences in post-exercise CK and LDH levels in plasma
may reflect dissimilarities in the rates of penetration
through the sarcolemma and different degrees of injury in
distinct fibre types. Moreover, ski-runners exhibited less
acidification (DLA) despite the increased load (WR and
WR/kg) and longer exercise.
Correlations between temperatureand physiological/biochemical markers
Analysis of relationships of skin temperature with physi-
ological and biochemical factors was focused on zones of
the muscles that worked the most intensively while running
exercise was performed; there were vastus lateralis, biceps
femoris, gastrocnemius, soleus in the lower part of body
and biceps brachii and pectoralis major in the upper part of
body, mainly [34, 35]. The calculated correlations between
temperature and physiological as well as biochemical
factors are presented in Table 6.
In general, a small number of correlations are found
statistically significant that may be due to the small size of
the groups studied. Nevertheless, it follows from Table 5
that temperature correlations with functional parameters
such as WRT and VO2max can be strong and statistical
significant (p\ 0.05) or show marked tendency (p B 0.1)
for some muscles of legs working intensively during
experimental exercise performed on treadmill in
Table 4 Mean cutaneous whole
body temperature Tsk ± SD
values for swimmers and cross-
country skiers before and after
running exercise
Method Swimmers, N = 4 Cross-country skiers, N = 6
Tsk ± SD/�C Tsk ± SD/�C
Before training After training p Before training After training p
(1) 32.50 ± 0.45 33.23 ± 0.61 0.009 32.40 ± 0.70 31.73 ± 1.03 0.10
(2) 32.51 ± 0.37 33.30 ± 0.63 0.009 32.39 ± 0.69 31.85 ± 1.06 0.10
Significant differences of Tsk before and after treadmill exercise, according to a paired student t test, are
shown in bold
Table 5 Physiological and
biochemical characteristics
during exercise test
Variable Cross-country skiers, N = 6 Swimmers, N = 4
HRT/beats min-1 182 ± 6.7 180.5 ± 8.2
WRT/W 295.6 ± 20.1 275.8 ± 2.9
WR/kg W-1 kg-1 4.0 ± 0.08 3.43 ± 0.46
VT/km h-1 14.0 12.0
Total time of exercise/min 55.0 ± 10.5 35.0 ± 16.9
LA0/mM 1,2 ± 0.3 1.7 ± 0.6
LAT/mM 3.8 ± 0.8 5.13 ± 3.5
DLA/mM 2.6 ± 0.8 3.41 ± 3.01
CK0/U L-1 213.2 ± 13.5 79.6 ± 8
CKT/U L-1 283.9 ± 145 148.4 ± 50
DCK/U L-1 70.7 ± 70.19 68.8 ± 46
Hb0/g dL-1 15.9 ± 0.43 15.4 ± 0.3
HbT/g dL-1 16.3 ± 0.51 16.4 ± 0.6
DHb/g dL-1 0.45 ± 0.41 1.0 ± 0.6
LDHo/U L-1 323.3 ± 84 232.1 ± 47
LDHT/U L-1 382.6 ± 77.6 254.3 ± 56.2
DLDH/U L-1 59.4 ± 24.5 22.26 ± 15
HRT, terminal heart rate; WRT, terminal work load; WR/kg, terminal work load, per kg BM; VAT, velocity
at AT during treadmill running; LA0, lactate concentration at the beginning of exercise; LAT terminal
lactate concentration; DLA, increase in lactate concentration during exercise test; CK0, creatine kinase
activity before exercise test; CKT, creatine kinase activity achieved immediately after exercise test; DCK,
increase in creatine kinase activity during exercise; Hb0, HbT, basal and terminal of the blood haemoglobin
concentration, respectively; DHb, increase in the blood haemoglobin concentration during exercise test;
LDH0, lactate dehydrogenase activity at the beginning of exercise; LDHT, lactate dehydrogenase activity
achieved immediately after exercise test; DLDH, increase in lactate dehydrogenate activity during exercise
A preliminary study on infrared thermal imaging of cross-country skiers and swimmers… 707
123

swimmers, especially. Earlier negative high correlation
between power set on bicycle ergometer and average body
surface temperature of athletes during progressive test was
reported [32]. The strong and statistically significant
influence of aerobic fitness (VO2max) on the change in
surface temperature of the upper limbs immediately after
the exercise for athletes who professionally played vol-
leyball was also reported [36]. It is known that changes in
concentration of biochemical metabolic markers depend on
the type, intensity and exercise duration as well as were
related to individual subjects’ adaptation to exercise and
the aerobic fitness level. Previous studies have established
these differences based on changes of the thermoregulatory
processes depending on the physical level of the subject
[37, 38]. Low-trained subjects release the heat worse than
high-trained during exercise and maintain the heat longer
time during the recovery process [39]. This is probably due
to a higher muscle activation and blood flow in high-
trained subjects.
Temperature correlations with biochemical metabolic
markers (LAT, LDHT) on significance level or tendency
occur much less frequently than with physiological factors
(Table 6) and are dependent on type of muscle. The studied
muscles (especially soleus and gastrocnemius) differ sig-
nificantly in the contribution of slow twitch (ST) and fast
twitch (FT) fibres in the muscle structure which conse-
quently implies differences in the metabolic characteristics
of these muscles.
The lack of significant changes in skin temperature over
leg muscles (Table 3) and practically negligible tempera-
ture correlations between physiological and biochemical
markers in cross-country skiers unlike swimmers seems to
stem from the fact that CS group is characterised by higher
running endurance capacity (VO2max) than SW group for
which running effort is not as specific as for skiers.
Recently, it has been raised [40] that the temperature
distribution at the skin is not directly related to physio-
logical metabolism transforming chemical energy into
work and heat. However, infrared radiation can be directly
correlated with the temperature distribution of a defined
body region [3]. Heat transported by blood is influenced by
the gradient between temperature of core tissues and shell
temperature represented by surrounding tissues. Peripheral
tissues (e.g. fat depot under the skin, subcutaneous fat) may
act as insulation layers varying in expansion in dependence
of ambient temperature and individual human. A study of
surface skin temperature distribution in relation to body
composition indicated a lower skin temperature of most
body surfaces in obese women [41] than women of normal
body mass because the local skin temperatures are influ-
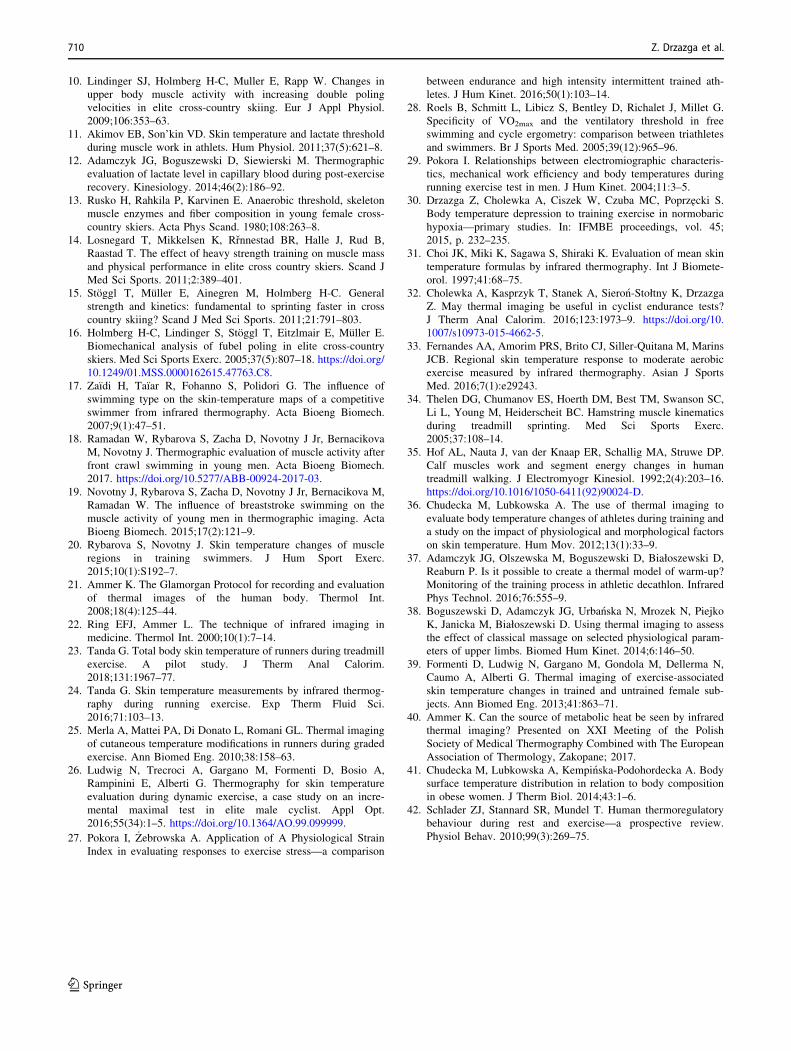
enced by subcutaneous adiposity. Among our studied ath-
letes, higher temperature correlation coefficients with fat
content were obtained in the most muscle zones for
swimmers unlike ski-runners (Fig. 3).
In human thermoregulatory behaviour, the skin as the
thermal input for maintenance of heat balance and tem-
perature regulation during exercise and rest can be con-
sidered [42]. Complex of thermal dynamic balance
between heat dissipation through the radiation, convection
and evaporation of sweat and heat production dependent on
its intensity and effort is reflected in thermal imaging of
surface skin body. Therefore, thermography is used as a
fast, non-invasive method, which can provide indirect
information on the body’s adaptation to physical effort and
Table 6 Correlations (r) of physiological and biochemical parameters (VO2max, WRT, LAT, LDHT) with average temperature after exercise in
selected muscle zones (shown for muscle zones when significant correlation at p B 0.05 occurred for at least one of the studied groups)
Muscle Group VO2max/L min-1 WRT/W LAT/mM LDHT/U L-1
r p r p r p r p
Rectus femoris SW - 0.88 0.12 - 0.94 0.05 - 0.72 0.27 0.73 0.26
CS 0.15 0.77 0.21 0.68 0.21 0.68 - 0.04 0.93
Knees (at front) SW - 0.22 0.67 0.02 0.96 0.68 0.13 - 0.09 0.86
CS - 0.85 0.14 - 0.94 0.05 - 0.76 0.23 0.76 0.23
Soleus SW - 0.7 0.23 - 0.99 0.01 - 0.67 0.32 0.86 0.13
CS - 0.37 0.46 - 0.45 0.36 0.87 0.02 0.06 0.90
Biceps femoris SW - 0.65 0.34 - 0.98 0.01 - 0.48 0.51 0.92 0.05
CS 0.45 0.36 0.36 0.47 0.09 0.85 0.25 0.62
Remaining thigh muscles SW - 0.56 0.43 - 0.99 0.01 - 0.57 0.42 0.96 0.03
CS 0.21 0.68 0.17 0.73 0.38 0.45 0.25 0.63
Gastrocnemius caput mediale SW - 0.94 0.05 - 0.80 0.19 - 0.52 0.47 0.53 0.46
CS 0.11 0.83 0.25 0.63 - 0.18 0.73 - 0.09 0.85
Significant correlations (r) between physiological and biochemical parameters and average skin temperature after exercise are shown in bold
708 Z. Drzazga et al.
123

ability to remove excess heat from body. It was observed
that CS group characterised better efficiency of the mech-
anisms responsible for heat removal (statistical drop of
temperature of upper part of body due to evaporation
unlike swimmers, see Tables 2 and 3) was more burdened
during the exercise test and continued to exercise for a
longer period of time, keeping heart rate close to
swimmers).
Conclusions
Our pilot study showed dissimilarities in skin temperature
distribution in elite athletes with different sport skills
subjected to the same endurance exercise on treadmill.
Moreover, significant (though not many) correlations of
physiological (WRT, VO2max), biochemical (LAT, LDHT)
and morphological parameters (% fat) with average tem-
perature after exercise test were found for different muscle
zones in swimmers and cross-country skiers. These find-
ings can provide additional information on the muscle
work in the different sport disciplines and may be helpful
in efficiency evaluation of athletes. However, further
investigation is needed for validation of results.
Acknowledgements This study was supported by statutory funds of
University of Silesia, Poland and partly by Grant Ministry of Science
and Higher Education (Poland)/Nr0050/RS4/2016/54.
Compliance with ethical standards
Conflict of interest The authors declare that they have no conflict of
interest.
Open Access This article is distributed under the terms of the Creative
Commons Attribution 4.0 International License (http://creative
commons.org/licenses/by/4.0/), which permits unrestricted use, dis-
tribution, and reproduction in any medium, provided you give
appropriate credit to the original author(s) and the source, provide a
link to the Creative Commons license, and indicate if changes were
made.
References
1. Marins JCB, Fernandez-Cuevas I, Arnaiz-Lastras J, Fernandes
AA, Sillero-Quintana M. Applications of infrared thermography
in sports. A review. Revista Internacional de Medicina y Ciencias
de la Actividad Fısica y el Deporte. 2015;15(60):805–24.
2. Fernandez-Cuevas I, Sillero-Quintana M, Garcia-Conception
MA, Ribot-Serrano J, Gomez-Carmona P. Monitoring skin ther-
mal response to training with infrared thermography. New Stud
Athl. 2014;29(1):57–71.
3. Hildebrandt C, Zeilberger K, Francis E, Ring J, Raschner C. The
application of medical infrared thermography in sports medicine.
In: Zaslav KR, editor. An international perspective on topics in
sports medicine and sports injury. InTech; 2012. ISBN: 978-953-
51-0005-8. http://www.intechopen.com/books/an-international-
perspective-on-topics-in-sports-medicine-and-sportsinjury/the-
application-of-medical-infrared-thermography-in-sports-medicine.
4. Arfaoui A, Polidori G, Taiar R, Popa C. Infrared thermography in
sports activity. In: Prakash RV, editor. Infrared thermography.
InTech; 2012. ISBN: 978-953-51-0242-7. http://www.intecho
pen.com/books/infrared-thermography/infrared-thermography-in-
sports-activity.
5. Brancaccio P, Maffulli N, Limongelii FM. Creatine kinase
monitoring in sport medicine. Br Med Bull. 2007;81–82:209–30.
6. Banfi G, Lombardi G, Lubkowska A. Metabolic markers in sports
medicine. Adv Clin Chem. 2012;56:1–54.
7. Stanula A, Gabrys T, Szmatlan-Gabrys U, Roczniok R, Maszczyk
A, Pietraszewski P. Calculating lactate anaerobic thresholds in
sports involving different endurance preparation. J Exerc Sci Fit.
2013;11:12–8.
8. Sprynarova S, Bass A, Mackova E, Vondra K, Vitek V, Teisinger
J, Malkovska M. Changes in maximal aerobic power, aerobic
capacity, and muscle enzyme activities at two stages of the
annual training cycle in ski-runners. Eur J Appl Physiol.
1980;44:17–23.
9. Mackova E, Melichna J, Vondra K, Jurimae T, Paul T, Novak J.
The relationship between anaerobic performance and muscle
metabolic capacity and fibre distribution. Eur J Appl Physiol.
1985;54:413–5.
29.04
6
8
10
12
29.5 30.0 30.5 31.0 31.5 32.0 32.0
3
6
9
12
15
18
32.5 32.5 33.0 33.5 34.0
Average temperature after training/°C
Fat/%
Average temperature after training/°C
Fat/%
SOLEUS
r = 0.09p = 0.85
r = 0.99p = 0.01(a) (b)
Fig. 3 Correlations of fat/% against average temperature after training for the representative muscle of lower partof body in ski-runners (a) and
swimmers (b) respectively
A preliminary study on infrared thermal imaging of cross-country skiers and swimmers… 709
123
10. Lindinger SJ, Holmberg H-C, Muller E, Rapp W. Changes in
upper body muscle activity with increasing double poling
velocities in elite cross-country skiing. Eur J Appl Physiol.
2009;106:353–63.
11. Akimov EB, Son’kin VD. Skin temperature and lactate threshold
during muscle work in athlets. Hum Physiol. 2011;37(5):621–8.
12. Adamczyk JG, Boguszewski D, Siewierski M. Thermographic
evaluation of lactate level in capillary blood during post-exercise
recovery. Kinesiology. 2014;46(2):186–92.
13. Rusko H, Rahkila P, Karvinen E. Anaerobic threshold, skeleton
muscle enzymes and fiber composition in young female cross-
country skiers. Acta Phys Scand. 1980;108:263–8.
14. Losnegard T, Mikkelsen K, Rrnnestad BR, Halle J, Rud B,
Raastad T. The effect of heavy strength training on muscle mass
and physical performance in elite cross country skiers. Scand J
Med Sci Sports. 2011;2:389–401.
15. Stoggl T, Muller E, Ainegren M, Holmberg H-C. General
strength and kinetics: fundamental to sprinting faster in cross
country skiing? Scand J Med Sci Sports. 2011;21:791–803.
16. Holmberg H-C, Lindinger S, Stoggl T, Eitzlmair E, Muller E.
Biomechanical analysis of fubel poling in elite cross-country
skiers. Med Sci Sports Exerc. 2005;37(5):807–18. https://doi.org/
10.1249/01.MSS.0000162615.47763.C8.
17. Zaıdi H, Taıar R, Fohanno S, Polidori G. The influence of
swimming type on the skin-temperature maps of a competitive
swimmer from infrared thermography. Acta Bioeng Biomech.
2007;9(1):47–51.
18. Ramadan W, Rybarova S, Zacha D, Novotny J Jr, Bernacikova
M, Novotny J. Thermographic evaluation of muscle activity after
front crawl swimming in young men. Acta Bioeng Biomech.
2017. https://doi.org/10.5277/ABB-00924-2017-03.
19. Novotny J, Rybarova S, Zacha D, Novotny J Jr, Bernacikova M,
Ramadan W. The influence of breaststroke swimming on the
muscle activity of young men in thermographic imaging. Acta
Bioeng Biomech. 2015;17(2):121–9.
20. Rybarova S, Novotny J. Skin temperature changes of muscle
regions in training swimmers. J Hum Sport Exerc.
2015;10(1):S192–7.
21. Ammer K. The Glamorgan Protocol for recording and evaluation
of thermal images of the human body. Thermol Int.
2008;18(4):125–44.
22. Ring EFJ, Ammer L. The technique of infrared imaging in
medicine. Thermol Int. 2000;10(1):7–14.
23. Tanda G. Total body skin temperature of runners during treadmill
exercise. A pilot study. J Therm Anal Calorim.
2018;131:1967–77.
24. Tanda G. Skin temperature measurements by infrared thermog-
raphy during running exercise. Exp Therm Fluid Sci.
2016;71:103–13.
25. Merla A, Mattei PA, Di Donato L, Romani GL. Thermal imaging
of cutaneous temperature modifications in runners during graded
exercise. Ann Biomed Eng. 2010;38:158–63.
26. Ludwig N, Trecroci A, Gargano M, Formenti D, Bosio A,
Rampinini E, Alberti G. Thermography for skin temperature
evaluation during dynamic exercise, a case study on an incre-
mental maximal test in elite male cyclist. Appl Opt.
2016;55(34):1–5. https://doi.org/10.1364/AO.99.099999.
27. Pokora I, _Zebrowska A. Application of A Physiological Strain
Index in evaluating responses to exercise stress—a comparison
between endurance and high intensity intermittent trained ath-
letes. J Hum Kinet. 2016;50(1):103–14.
28. Roels B, Schmitt L, Libicz S, Bentley D, Richalet J, Millet G.
Specificity of VO2max and the ventilatory threshold in free
swimming and cycle ergometry: comparison between triathletes
and swimmers. Br J Sports Med. 2005;39(12):965–96.
29. Pokora I. Relationships between electromiographic characteris-
tics, mechanical work efficiency and body temperatures during
running exercise test in men. J Hum Kinet. 2004;11:3–5.
30. Drzazga Z, Cholewka A, Ciszek W, Czuba MC, Poprzecki S.
Body temperature depression to training exercise in normobaric
hypoxia—primary studies. In: IFMBE proceedings, vol. 45;
2015, p. 232–235.
31. Choi JK, Miki K, Sagawa S, Shiraki K. Evaluation of mean skin
temperature formulas by infrared thermography. Int J Biomete-
orol. 1997;41:68–75.
32. Cholewka A, Kasprzyk T, Stanek A, Sieron-Stołtny K, Drzazga
Z. May thermal imaging be useful in cyclist endurance tests?
J Therm Anal Calorim. 2016;123:1973–9. https://doi.org/10.
1007/s10973-015-4662-5.
33. Fernandes AA, Amorim PRS, Brito CJ, Siller-Quitana M, Marins
JCB. Regional skin temperature response to moderate aerobic
exercise measured by infrared thermography. Asian J Sports
Med. 2016;7(1):e29243.
34. Thelen DG, Chumanov ES, Hoerth DM, Best TM, Swanson SC,
Li L, Young M, Heiderscheit BC. Hamstring muscle kinematics
during treadmill sprinting. Med Sci Sports Exerc.
2005;37:108–14.
35. Hof AL, Nauta J, van der Knaap ER, Schallig MA, Struwe DP.
Calf muscles work and segment energy changes in human
treadmill walking. J Electromyogr Kinesiol. 1992;2(4):203–16.
https://doi.org/10.1016/1050-6411(92)90024-D.
36. Chudecka M, Lubkowska A. The use of thermal imaging to
evaluate body temperature changes of athletes during training and
a study on the impact of physiological and morphological factors
on skin temperature. Hum Mov. 2012;13(1):33–9.
37. Adamczyk JG, Olszewska M, Boguszewski D, Białoszewski D,
Reaburn P. Is it possible to create a thermal model of warm-up?
Monitoring of the training process in athletic decathlon. Infrared
Phys Technol. 2016;76:555–9.
38. Boguszewski D, Adamczyk JG, Urbanska N, Mrozek N, Piejko
K, Janicka M, Białoszewski D. Using thermal imaging to assess
the effect of classical massage on selected physiological param-
eters of upper limbs. Biomed Hum Kinet. 2014;6:146–50.
39. Formenti D, Ludwig N, Gargano M, Gondola M, Dellerma N,
Caumo A, Alberti G. Thermal imaging of exercise-associated
skin temperature changes in trained and untrained female sub-
jects. Ann Biomed Eng. 2013;41:863–71.
40. Ammer K. Can the source of metabolic heat be seen by infrared
thermal imaging? Presented on XXI Meeting of the Polish
Society of Medical Thermography Combined with The European
Association of Thermology, Zakopane; 2017.
41. Chudecka M, Lubkowska A, Kempinska-Podohordecka A. Body
surface temperature distribution in relation to body composition
in obese women. J Therm Biol. 2014;43:1–6.
42. Schlader ZJ, Stannard SR, Mundel T. Human thermoregulatory
behaviour during rest and exercise—a prospective review.
Physiol Behav. 2010;99(3):269–75.
710 Z. Drzazga et al.
123