
A Preliminary Assessment of Crop Production and Estimated Irrigation Water Use for Chihuahua, Mexico...
22
A Preliminary Assessment of Crop Production and Estimated Irrigation Water Use for Chihuahua, Mexico Presented at “Free Trade of the Americas, the WTO and New Farm Legislation: Responding to Challenges and Opportunities” San Antonio, Texas, May 24, 2002 Parr Rosson, Aaron Hobbs, and Flynn Adcock Texas A&M University
-
Upload
jodie-mosley -
Category
Documents
-
view
212 -
download
0
Transcript of A Preliminary Assessment of Crop Production and Estimated Irrigation Water Use for Chihuahua, Mexico...

A Preliminary Assessment of Crop Production and Estimated Irrigation Water Use for
Chihuahua, Mexico
Presented at
“Free Trade of the Americas, the WTO and New Farm Legislation:
Responding to Challenges and Opportunities”
San Antonio, Texas, May 24, 2002
Parr Rosson, Aaron Hobbs, and Flynn Adcock
Texas A&M University

Background
• U.S. - Mexico 1944 Water Treaty• Mexico to Deliver 350,000 Acre Feet (AF) to the
U.S. Annually from Rio Grande• Mexican Deficits Began in 1995• Currently a cummulative Debt of
Approximately 1.5 Million AF• U.S. to Deliver 1.5 Million AF to Mexico Per
Year from Colorado

Methodology
• Annual Production, Acreage and Yield Data Collected from SAGARPA for the Entire State of Chihuahua, Mexico
• Analysis of Trends
• CropWat Version 7
• Penman-Monteith Method

CropWat
• Estimated Evapotranspiration Rate (ETo) Calculated for Chihuahua, Mexico
• Rainfall Measured for Chihuahua, MX• Medium Soil Type• Irrigation when 25% of ETo, to refill to soil
capacity• Plant date set by crop• Irrigation Efficiency estimated at 50%

Penman-Monteith
• Penman-Monteith Monthly ETo Calculated for Chihuahua by CropWat
• Coefficients from FAO
• Multiplied the monthly ETo by the Coefficient For the Season then Subtracted Out Rainfall for the Time Period

Harvested Acres in Chihuahua, MX1980 - 1999
Source: SAGARPA; Total for 31 crops included in study.
555651
745 728 732
1106
832750
1980 1985 1990 1995 1996 1997 1998 19990
200
400
600
800
1000
1200
1400
Thousand Acres
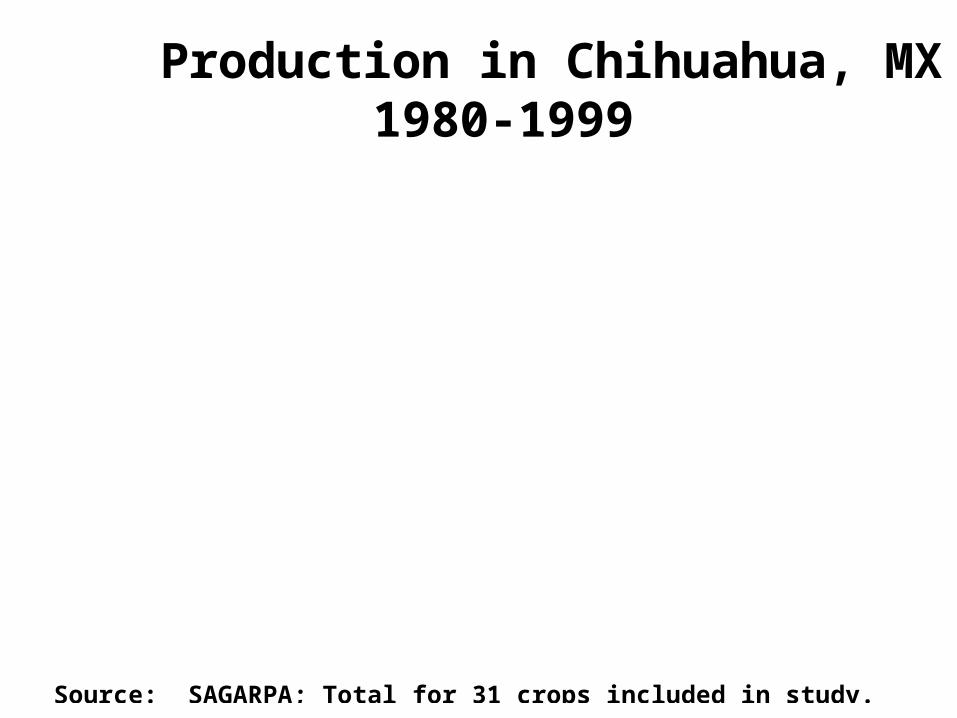
Production in Chihuahua, MX1980-1999
Source: SAGARPA; Total for 31 crops included in study.
1.05
1.63
2.212
2.723.123
4.274
3.059 3.025
1980 1985 1990 1995 1996 1997 1998 19990
1
2
3
4
5
Million MT

Average Yield in Chihuahua, MX1980-1999
Source: SAGARPA; Average for 31 crops included in study.
1.88
2.51
2.97
3.74
4.263.86
3.684.03
1980 1985 1990 1995 1996 1997 1998 19990
1
2
3
4
5
MT/Acre

Percent Increases in Harvested Acres, Production and Yield for Chihuahua
For Major Crops
1980-1999 1990-1999 1995-1999Harvested Acres 35% .72% 3.13%
Production 191% 36.72% 11.21%
Yield 114% 35.74% 7.84%
Source: SAGARPA; Increases for 31 crops included in study.

Crop Acreage, 1999
• Corn• Alfalfa• Cotton• Pecans• Apples• Dry Beans• Bell Peppers
Source: SAGARPA
Total Acreage: 750,430 MT
Corn20.4%
Alfalfa15.3%
Cotton10.7%
Pecans8.7%Apples
7.6%Dry Beans
5.3%
Green Peppers5.2%
Others26.8%
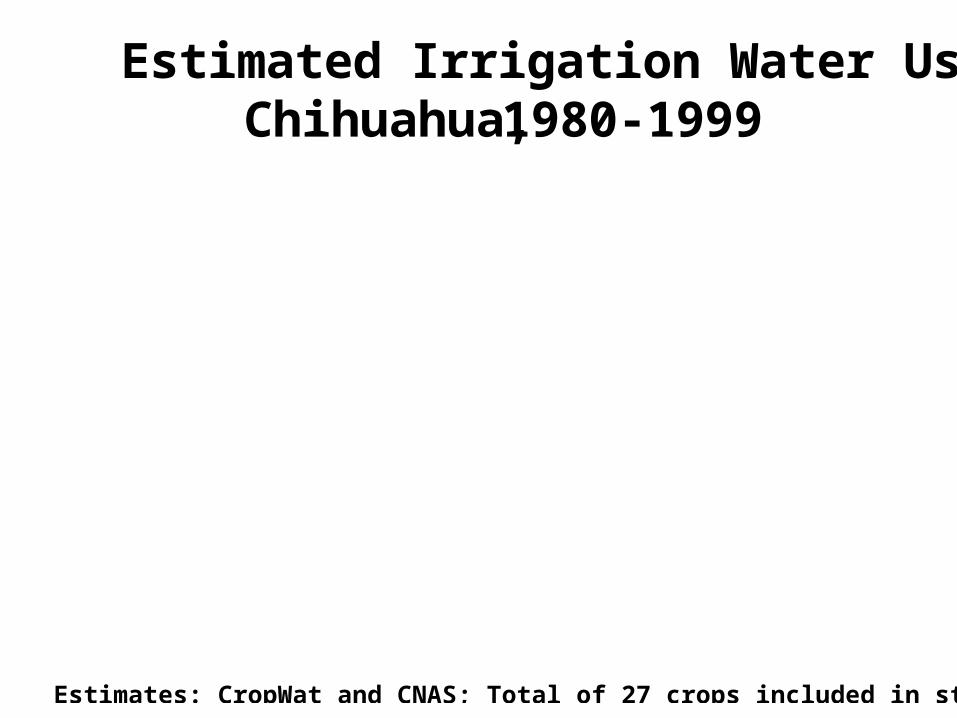
Estimated Irrigation Water Use in Chihuahua, 1980-1999
Estimates: CropWat and CNAS; Total of 27 crops included in study.
1.21.4
1.61.5
1.6
2.3
1.81.6
1980 1985 1990 1995 1996 1997 1998 19990
0.5
1
1.5
2
2.5
Million Acre Feet

Estimated Irrigation Water Use in Chihuahua, MX 1999 (1,000 acre feet)
Estimates: CropWat and CNAS; Total of 27 crops included in study.
Corn294
Alfalfa261
Cotton224
Apples194
Pecans175 Bell Peppers
73
Others362
Total: 1,581taf

Estimated Alfalfa Irrigation Water Use1990 - 1999
Source: CropWat & CNAS estimates
258228
187
291
248261
1990 1995 1996 1997 1998 19990
50
100
150
200
250
300
350
Thousand Acre Feet

Estimated Corn Irrigation Water Use1980 - 1999
Source: CropWat & CNAS estimates
118156
243 238
282
440
339
294
1980 1985 1990 1995 1996 1997 1998 19990
100
200
300
400
500
Thousand Acre Feet

Estimated Cotton Irrigation Water Use1980 - 1999
Source: CropWat & CNAS estimates
263
201230
248
346
442
389
224
1980 1985 1990 1995 1996 1997 1998 19990
100
200
300
400
500
Thousand Acre Feet

Estimated Apple Irrigation Water Use1980 - 1999
Source: CropWat & CNAS estimates
191
144 148
178164
195
149
194
1980 1985 1990 1995 1996 1997 1998 19990
50
100
150
200
250
Thousand Acre Feet

Estimated Pecan Irrigation Water Use1980 - 1999
Source: CropWat & CNAS estimates
55
82
114
145 151 147163
175
1980 1985 1990 1995 1996 1997 1998 19990
50
100
150
200
Thousand Acre Feet

Estimated Bell Pepper Irrigation Water Use1980 - 1999
Source: CropWat & CNAS estimates
26 2533
58 58
121
93
73
1980 1985 1990 1995 1996 1997 1998 19990
20
40
60
80
100
120
140
Thousand Acre Feet

Selected 2001 Irrigation Water UseEstimates
Source: CropWat & CNAS estimates
368
292
31
94
8
16
24
Corn
Alfalfa
Dry Beans
Bell Peppers
Tomatos
Onions
Watermelons
Thousand Acre Feet
0 100 200 300 400 500

Further Research
• Update 2000 and 2001 Data for All Crops
• Change Efficiency Levels For a Range of Estimates
– Determine Efficiency of Delivery of Water to the Farm
– Determine Application Efficiency in the Field
• Factor Yields Into Irrigation Requirements Equation
• Determine the proportion of ground water use and surface water use

Conclusions
• Total Acreage and Production have continued to increase since the drought began in 1995.
• Lower Rainfall and Increased Water Use Have Reduced Flows to the Rio Grand.
• Analysis of Irrigation Districts Would Improve Estimates

Potential Solutions
• Improved Efficiency of Water Delivery and Use in Chihuahua
• Improved Efficiency of Water Delivery and Use in Lower Rio Grande Valley
• Form and Implement Effective Binational Water Management Planning


