A Practical Study on Evaluating the Benefits of ...
16
A Practical Study on Evaluating the Benefits of Transportation for Building Sustainable Cities Shotaro ABE a , Fumi TAKAHASHI b , Terutomo SHIMO c , Hiroaki TAKEBAYASHI d , Yoshiro AE e , Yasuhiro WAKAMA f a,b,c Road & Transportation Engineering Division Urban Planning Section, CTI Engineering Co., Ltd., Osaka, 541-0045, Japan a E-mail: [email protected] b E-mail: [email protected] c E-mail: [email protected] d E-mail: [email protected] e,f Akashi city, Hyogo, 673-8686, Japan e E-mail: [email protected] f E-mail: [email protected] Abstract: Akashi city is a local city in Japan which has established a comprehensive traffic and transportation plan to create an accessible transport network and improve local public transportation service. This plan builds a review process which follows the plan-do-check- action (PDCA) cycle every 5 years. In 2015, the city verified that plan assuming later review. During the process of verification, it is necessary to make quantitative assessments of the effect of public transportation on making sustainable cities, in the context of building a compact city. Different evaluation indexes from public transportation ridership and mode share are required. This study confirmed the practical use of new evaluation indexes such as cross-sector benefits and public transportation accessibility in the evaluation process of public transportation in Akashi city. Keywords: Public Transportation, Cross-sector Benefits, Accessibility, Sustainability 1. INTRODUCTION In recent years, Japanese public transportation has experienced difficult circumstances, due to depopulation and an aging society. Public transportation ridership has been decreasing, leading to negative effects such as transport network reduction and decreasing quality of public transportation services. On the other hand, the Japanese government has promoted national land policy associating urban development with transport policy for regional vitalization. The policy is named “compact plus network.” In the movement of public transportation policy development, evaluation has been based on the concept of the plan-do-check-action (PDCA) cycle in Japan. The concept of the PDCA cycle has been adopted for managing public transportation utilization since the concept of PDCA cycle was introduced in local public transportation plans. In recent years, this concept has been integrated into Japanese public policy, and indicated in local public transportation network plans. However, in the “Check” stage of the cycle, some direct consequences such as changes in ridership and opinion are generally used for measuring the effects of public transportation. For instance, studying the PDCA cycle in a local bus system, Takebayashi and Nitta (2009) pointed out that evaluation by ridership, balance of payments and changes in usage preferences
Transcript of A Practical Study on Evaluating the Benefits of ...

A Practical Study on Evaluating the Benefits of Transportation for Building
Sustainable Cities
Shotaro ABE a, Fumi TAKAHASHI b, Terutomo SHIMO c, Hiroaki TAKEBAYASHI d,
Yoshiro AE e, Yasuhiro WAKAMA f
a,b,c Road & Transportation Engineering Division Urban Planning Section, CTI
Engineering Co., Ltd., Osaka, 541-0045, Japan a E-mail: [email protected] b E-mail: [email protected] c E-mail: [email protected] d E-mail: [email protected]
e,f Akashi city, Hyogo, 673-8686, Japan e E-mail: [email protected] f E-mail: [email protected]
Abstract: Akashi city is a local city in Japan which has established a comprehensive traffic
and transportation plan to create an accessible transport network and improve local public
transportation service. This plan builds a review process which follows the plan-do-check-
action (PDCA) cycle every 5 years. In 2015, the city verified that plan assuming later review.
During the process of verification, it is necessary to make quantitative assessments of the effect
of public transportation on making sustainable cities, in the context of building a compact city.
Different evaluation indexes from public transportation ridership and mode share are required.
This study confirmed the practical use of new evaluation indexes such as cross-sector
benefits and public transportation accessibility in the evaluation process of public transportation
in Akashi city.
Keywords: Public Transportation, Cross-sector Benefits, Accessibility, Sustainability
1. INTRODUCTION
In recent years, Japanese public transportation has experienced difficult circumstances, due to
depopulation and an aging society. Public transportation ridership has been decreasing, leading
to negative effects such as transport network reduction and decreasing quality of public
transportation services. On the other hand, the Japanese government has promoted national land
policy associating urban development with transport policy for regional vitalization. The policy
is named “compact plus network.”
In the movement of public transportation policy development, evaluation has been based
on the concept of the plan-do-check-action (PDCA) cycle in Japan. The concept of the PDCA
cycle has been adopted for managing public transportation utilization since the concept of
PDCA cycle was introduced in local public transportation plans. In recent years, this concept
has been integrated into Japanese public policy, and indicated in local public transportation
network plans.
However, in the “Check” stage of the cycle, some direct consequences such as changes
in ridership and opinion are generally used for measuring the effects of public transportation.
For instance, studying the PDCA cycle in a local bus system, Takebayashi and Nitta (2009)
pointed out that evaluation by ridership, balance of payments and changes in usage preferences

are generally used in the planning processes of Japanese community bus services. Yajima et al.
(2011, 2012) focused on the effects of continuing PDCA cycles by performing multiple reviews.
They proposed improvements to bus services by assessing satisfaction levels and balance of
payments, based on questionnaire results and operating data. Yamazaki et al. (2002) also
examined the development process of community bus service by evaluating accessibility and
frequency of use via questionnaire. Matsunaka (2012) found that many social economic indexes
such as proximity to large-scale facilities, consistency with urban planning, potential ridership,
conversion from car dependency, transport service level, background population, geography,
financial conditions, internal rate and reduction of CO2 have been used to evaluate French
urban public transportation projects named in the “Grenelle de l'Environnement” conference.
In recent years, study has focused on the spillover effect of public transportation for cross-
sector benefits (Carr et al., 1991; Fowkes et al., 1994). For instance, Nishimura et al. (2014)
pointed out that the value and necessity of public transportation have never been clarified in an
objective and quantitative analysis. Thus, they focused on the concepts of cross-sector benefits
and calculated various costs related to the field of transportation in cities without public
transportation. They indicated that a lack of public transportation has measurable disadvantages.
Conventionally, accessibility, which can measure access opportunities to destinations by
public transportation is used for policy assessment (Tanimoto, 2007) and implications (Cheng
and Chen, 2015). However, a simplified method of calculating accessibility has not been
defined well for practical use.
In this study, the authors attempt to construct a process for evaluating Akashi City’s public
transportation effects based on the methodology of evaluating approaches in practical studies
on public transportation.
2. PROCESS OF PLANNING REVIEW IN AKASHI
2.1 Outline of Traffic and Transportation Planning in Akashi
The Traffic and Transportation Plan of Akashi (TTPA) is an individual plan which contains the
fifth comprehensive plan of Akashi (formulated in March, 2011). It is designed considering the
sustainable city and movement of people. TTPA is positioned as the master plan of overall
transportation policy, which includes the direction of road and traffic systems.
The purpose of TTPA is to clarify the essential strategy and scheme for establishing traffic
and transportation systems which can change with the time and provide safety and accessible
movement for everyone, based on promotion of public transportation utilization.
The basic idea of the TTPA is the realization of applying regional characteristics in city
planning through active exchange. The planning period is from 2013 to 2022.
In the TTPA there are five basic strategies: Constructing a traffic and transportation
system centering on public transportation, making a safe and highly-accessible traffic
environment, approaching the realization of low carbon society, promoting active exchange and
fostering a sense of value for public transportation. A wide variety of traffic and transportation
measures are carried out on the basis of these five basic strategies. In addition, for the purpose
of promoting the development of packaged programs based in basic strategies, Akashi city has
set five main programs: A branding strategy for Akashi, revitalization of the city center,
development of transportation nodes, restructuring the bus network and improving traffic safety.
The city has introduced practical efforts regarding each project.
2.2 Process of Planning Review
In the TTPA, planning review is scheduled every five years after checking project effects and
changes in the environment surrounding public transportation such as social changes,

development and financial conditions. Figure 1 shows the concept of PDCA in the TTPA.
Based on the concept of PDCA, in 2015 a committee for mid-term evaluation of the TTPA
was established, and traffic and transportation measures were introduced in parallel. The
committee plans to review the TTPA in 2017 based on the mid-term verification, which will
readjust traffic and transportation strategies.
In this study, the authors consider the progress of developing programs related to public
transportation and useful for evaluating public transportation in the mid-term verification of the
TTPA.
In the TTPA, three numerical targets (public transportation ridership, rate of public
transportation modal split and rate of outgoing trips) are considered as the results of
development programs related to public transportation (also part of Check in PDCA).
Numerical targets are shown in Table 1.
The following section details measurements for the achievement of these three targets.
Figure 1. PDCA of TTPA (Akashi city, 2013, edited by authors)
Table 1. Numerical targets
Index Target values in 2022 Process for setting target values
(1) Public transportation ridership One hundred million riders
per year
Based on the peak value in 1995
(2) Rate of public transportation
modal split Increase to 22% by 2022
Calculated by target value of ‘(1)
Public transportation ridership’ and
population projections in the fifth
comprehensive plan of Akashi
(3) Rate of outgoing trips Maintain standards at 77% Assumed that the rate of outgoing
trips in 2010 is maintained
・Awareness of needs andclarifying problems
・Set Goals and direction
・ Build basic principles andstructure of strategy
・Set developing programs
・Explain to local residents
・Conduct public relations campaign
・Carry out traff ic and
transportation measures
・Set evaluation indexes
・Evaluate practice
・Review traffic and
transportation strategy
・Rebuild each project
Mid-verification of TTPA
(in 2015)Carry out traffic and
transportation measures
(from 2013)
Consideration and creation of
TTPA(in 2012)TTPA planning review
(in 2017)

(1) Public transportation ridership
Public transportation ridership is defined as the summation of railway, bus, marine traffic and
taxi ridership in each year. The target value is a total ridership increase to one million riders per
year in 2022 in order to maintain vital service level.
In Figure 2, annual public transportation ridership is 9,484 million in 2014. Assuming
preservation of this trend, ridership in 2022 would reach the target value.
Figure 3 shows ridership for each public transportation mode from 2007. Railway users
have increased since 2010, but there is a downward trend between 2013 and 2014. Bus users
have also increased from 2010, and in 2014 ridership hit its largest value since 2007. However,
marine ridership and taxi use has decreased since 2007.
Figure 2. Trend of public transportation ridership (Akashi city, 2013, edited by authors)
Figure 3. Public transportation passengers, by mode
9,720in 2017
10,000in 2022
10,173in 1995
8,466
in 2003
9,329in 2010
9,484in 2014
0
2,000
4,000
6,000
8,000
10,000
12,000
1960 1970 1980 1990 2000 2010 2020
Target values
Public transportation ridership
*Ridership of Taco bus, Sanyo bus, Kobe city bus, marine traff ic and taxiare included from 2004.
Annual Ridership (millions) predictive value
601 605 594 594 596 598 608 597
323 326 318 312 319 332 333 334
0
200
400
600
800
2007 2008 2009 2010 2011 2012 2013 2014
Hundreds of thousands ridership
18
17
16 16 16 14 13
10 18
18
14 11
8 8 8 7 0
10
20
2007 2008 2009 2010 2011 2012 2013 2014
Railway
Bus
Taxi
Marine traffic

(2) Public transportation modal split
Target values for public transportation modal split suppose car use decreasing to 32%, and
public transportation use increasing to 22% by 2022. The purpose of these targets is to promote
a modal shift from private car to public transportation, bicycling and walking.
Figure 4 indicates that the rate of public transportation use has remained unchanged since
2010.
Figure 4. Modal split, by year (Akashi city, 2013, edited by authors)
(3) Rate of outgoing trips
The target for outgoing trips in 2022 is to maintain standards at 77%, as recorded in 2010.
Figure 5 shows that the rate of outgoing trips has increased since 2012, and the value in
2014 was 83%, the highest value since 1990.
Figure 5. Change in rate of outgoing trips (Akashi city, 2013, edited by authors)
Rate of outgoing trips is defined as the number of people making trips outside the home on
the given survey date.
20.4%
18.6%
19.2%
18.7%
18.8%
19.1%
18.4%
20.9%
21.5%
27.1%
32.8%
35.5%
35.4%
35.1%
34.8%
36.5%
33.1%
32.5%
52.4%
48.6%
45.4%
45.8%
46.0%
46.1%
45.1%
46.0%
46.0%
0% 20% 40% 60% 80% 100%
1990 (n=1,065)
2000 (n=1,283)
2010 (n=1,185)
2011 (n=1,180)
2012 (n=1,184)
2013 (n=922)
2014 (n=1,021)
2017 (n=1,239)
2022 (n=1,234)
Public transportation Car Bike/Walking
Source: Census (1990 - 2010), Fifth comprehensive plan in Akashi, Third person trip survey in Kinki, Fourth person trip survey in Kinki,Fifth person trip survey in Kinki, Person trip small survey (2011-2013)
Modal split
predictive value
27.1 29.5 29.3 29.1 29.0 29.0 29.1 29.1 28.9
19.6 23.2 22.5 22.3 22.4 23.4 24.1
22.4 22.3
73%79% 77% 77% 77%
81% 83%77% 77%
0%
20%
40%
60%
80%
100%
0
10
20
30
40
50
1990 2000 2010 2011 2012 2013 2014 2017 2020
Ra
te o
f ou
tgo
ing
po
pula
tio
n(%
)
Ou
tgo
ing
trip
s (
Mill
ion
per
yea
r)
Night time population Outgoing populatioin Rate of outgoing population
Source: Census (1990 - 2010), Fifth comprehensive plan in Akashi, Third person trip survey in Kinki, Fourth person trip survey in Kinki,Fifth person trip survey in Kinki, Person trip small survey (2011-2013)
predictive value

2.3 ISSUES OF TTPA REVIEW
As described above, public transportation ridership and the rate of outgoing trips indicated
upward trends. However, in recent years, population decline and aging population are becoming
apparent in Akashi.
For instance, of the rate of expenditure for each department in Akashi, the rate of
expenditure in civil engineering (costs in road construction, parks and municipal housing,
maintenance of these facilities, and project costs of public transportation measures) trends
downward just as the increasing rate of people’s livelihood (such as welfare costs of assistance
for elderly, disabled and caregivers) trends upward. These trends are shown in Figure 6.
Figure 7 shows trends of the balance for city bonds and funding balance. The balance for
city bonds which is the equivalent of the city’s debt has increased in recent years, and the fund
balance which is the equivalent of the city’s savings have remained unchanged. It shows that
Akashi faces an extremely tight fiscal situation.
However, public transportation is an indispensable presence for elderly and young people
who cannot drive. Therefore, measuring a sustainable city by its maintenance of public
transportation is not only evaluated by output indexes such as ridership and public
transportation modal split, but also evaluated in areas other than traffic and transportation from
a standpoint of the necessity to continue public transportation such as community bus service.
This study is intended to build a process which can perform multifaceted evaluation of
policy effects regarding public transportation in Akashi. In order to achieve this purpose, a
public transportation accessibility index and cross-sector benefits are selected as performance
indicators.
Figure 6. Rate of expenditure in each department (Akashi city, 2016, edited by authors)
Figure 7. Trends of the balance for city bonds issued and fund balance
(Akashi city, 2016, edited by authors)
10.7% 11.9% 13.0% 16.2% 10.2% 10.4% 11.2% 17.5% 10.7% 9.9%
30.6% 32.2% 30.8% 30.5% 36.5% 36.4% 38.7% 34.6% 42.1% 42.7%
7.0% 6.6% 6.6% 5.4% 5.6% 6.2% 7.1% 6.5% 7.3% 7.5%16.8% 15.4% 14.3% 12.8% 12.8% 11.2%12.0% 16.6% 12.8% 13.8%11.0% 10.1% 10.0% 11.0% 11.9% 11.8%11.1%
9.4% 10.2% 10.6%15.3% 15.3% 14.3% 13.2% 13.4% 13.2% 12.2% 9.8% 11.7% 10.4%
9% 9% 11% 11% 10% 11% 8% 6% 5% 5%
892 867 851 900 960 983 935 1089 976 988
0%
20%
40%
60%
80%
100%
2006 2007 2008 2009 2010 2011 2012 2013 2014 2015
General affairs People's livelihood Health Civil engineering Education Bond Other
Ra
te o
f exp
end
itur
e in
eac
h d
epar
tme
nt
Total expenditure
1,102 1,075 1,033 1,000 999 998 997 9901,106 1,100 1,114
110 10593
7669 70 70 70 74 75 78
0
20
40
60
80
100
120
140
0
200
400
600
800
1,000
2005 2006 2007 2008 2009 2010 2011 2012 2013 2014 2015
The balance for city bonds issued Fund balance
The
ba
lanc
e fo
r ci
ty b
ond
s is
sued
(H
un
dre
d m
illio
n ye
n)
Fun
d b
ala
nce
(Hu
nd
red
mill
ion
yen)
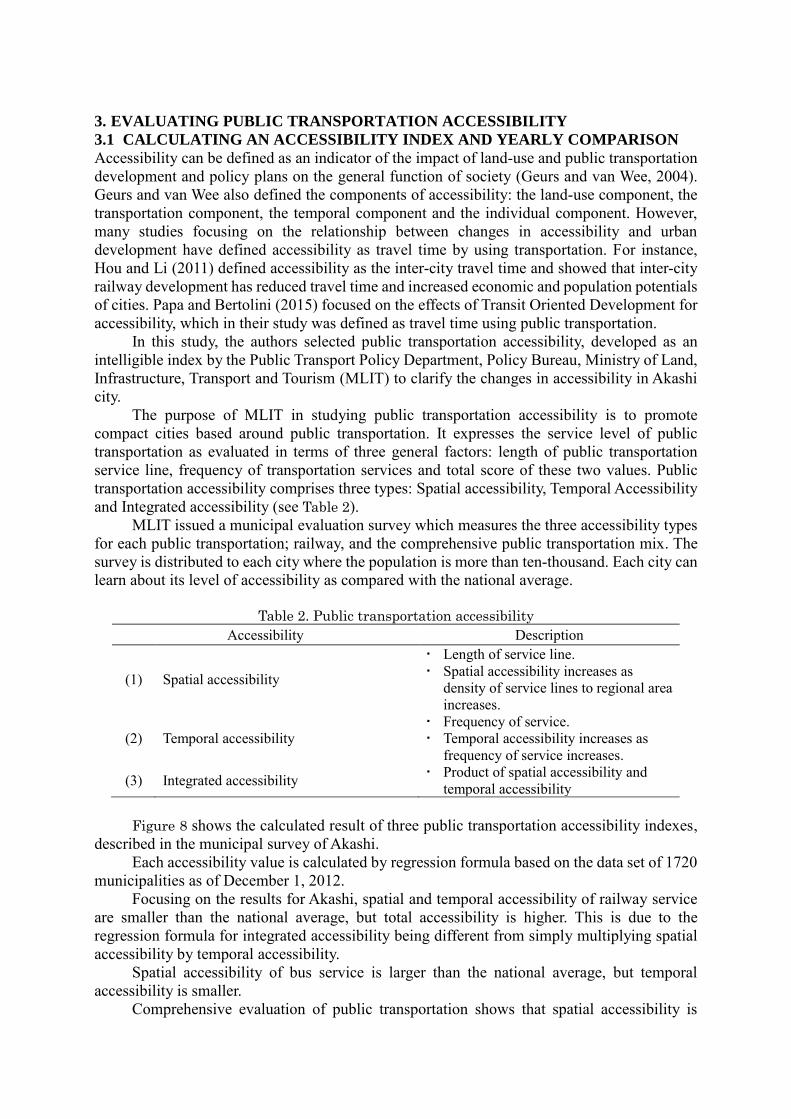
3. EVALUATING PUBLIC TRANSPORTATION ACCESSIBILITY
3.1 CALCULATING AN ACCESSIBILITY INDEX AND YEARLY COMPARISON
Accessibility can be defined as an indicator of the impact of land-use and public transportation
development and policy plans on the general function of society (Geurs and van Wee, 2004).
Geurs and van Wee also defined the components of accessibility: the land-use component, the
transportation component, the temporal component and the individual component. However,
many studies focusing on the relationship between changes in accessibility and urban
development have defined accessibility as travel time by using transportation. For instance,
Hou and Li (2011) defined accessibility as the inter-city travel time and showed that inter-city
railway development has reduced travel time and increased economic and population potentials
of cities. Papa and Bertolini (2015) focused on the effects of Transit Oriented Development for
accessibility, which in their study was defined as travel time using public transportation.
In this study, the authors selected public transportation accessibility, developed as an
intelligible index by the Public Transport Policy Department, Policy Bureau, Ministry of Land,
Infrastructure, Transport and Tourism (MLIT) to clarify the changes in accessibility in Akashi
city.
The purpose of MLIT in studying public transportation accessibility is to promote
compact cities based around public transportation. It expresses the service level of public
transportation as evaluated in terms of three general factors: length of public transportation
service line, frequency of transportation services and total score of these two values. Public
transportation accessibility comprises three types: Spatial accessibility, Temporal Accessibility
and Integrated accessibility (see Table 2).
MLIT issued a municipal evaluation survey which measures the three accessibility types
for each public transportation; railway, and the comprehensive public transportation mix. The
survey is distributed to each city where the population is more than ten-thousand. Each city can
learn about its level of accessibility as compared with the national average.
Table 2. Public transportation accessibility
Accessibility Description
(1) Spatial accessibility
Length of service line.
Spatial accessibility increases as
density of service lines to regional area
increases.
(2) Temporal accessibility
Frequency of service.
Temporal accessibility increases as
frequency of service increases.
(3) Integrated accessibility Product of spatial accessibility and
temporal accessibility
Figure 8 shows the calculated result of three public transportation accessibility indexes,
described in the municipal survey of Akashi.
Each accessibility value is calculated by regression formula based on the data set of 1720
municipalities as of December 1, 2012.
Focusing on the results for Akashi, spatial and temporal accessibility of railway service
are smaller than the national average, but total accessibility is higher. This is due to the
regression formula for integrated accessibility being different from simply multiplying spatial
accessibility by temporal accessibility.
Spatial accessibility of bus service is larger than the national average, but temporal
accessibility is smaller.
Comprehensive evaluation of public transportation shows that spatial accessibility is

larger than the national average, but temporal accessibility is smaller. In other words, length of
railway and buses indicate high density in the region, but the service level of these remain at a
low level compared with the national average.
3.2 RECALCULATING THE ACCESSIBILITY TARGETED IN 2015
(1) Background of recalculation
Public transportation accessibility indexes evaluated in the municipal survey provide easy
comparison with other cities due to calculation using the same method. However, the data set
was built in 2010, and railway and bus services included not only ordinary services but limited
services.
In this study, the authors have calculated public transportation accessibility in Akashi
focusing on ordinary railway and bus services in October, 2015. In addition, accessibility in
2010 was recalculated to only consider ordinary services. In this manner changes in
accessibility could be captured.
(2) Methodology
Initially, network data for rail and buses services was constructed using Geographical
Information System (GIS). We calculated the length of these networks and estimated total travel
distance by measuring the frequency of rail and bus service at rail stations and bus stops on
ordinary days, then multiplying the length by frequency of transportation service. However, we
omit limited bus services such as nonstop service for schools and hospitals, because of restricted
user base.
In this regard, for comparison of accessibility between 2010 and 2015, we calculated the
accessibility of 2010 in same way as for 2015 by using railway and bus service data which is
published on the National Land Numerical Information download service. Figure 9 shows the
Akashi railway and bus networks in 2015.
(3) Result of recalculation
Figure 10 shows the results of recalculation for each year. Between recalculation results, there
is no major difference in railway service accessibility, but in bus service temporal accessibility
decreased because we targeted ordinary public transportation services. As a result, temporal
accessibility of public transportation service also decreased.
Figure 8. Public transportation accessibility in Akashi (MLIT, 2015)
1.27
0.86
1.09
0.93
0.92
1.45
1.32
0.79
1.06
0.0
0.2
0.4
0.6
0.8
1.0
1.2
1.4
1.6
Spatialaccessibility of
publictransportation
service
Temporalaccessibility
publictransportation
service
Integratedaccessibility
publictransportation
service
Spatialaccessibility ofrailway service
Temporalaccessibility ofrailway service
Integratedaccessibility ofrailway service
Spatialaccessibility of
bus service
Temporalaccessibility of
bus service
Integratedaccessibility of
bus service
Akashi
National average

Figure 9. Public transportation network in 2015
Figure 10. Public transportation accessibility in Akashi (Recalculation)
1.58
0.67
1.05
0.92
1.06
1.65
1.65
0.56
0.93
0.0
0.2
0.4
0.6
0.8
1.0
1.2
1.4
1.6
1.8
2.0
Spatial accessibility
of public
transportation
service
Temporal
accessibi lity of
public
transportation
service
Integrated
accessibi lity of
public
transportation
service
Spatial accessibility
of railway service
Temporal
accessibi lity of
railway service
Integrated
accessibi lity of
railway service
Spatial accessibility
of bus service
Temporal
accessibi lity of bus
service
Integrated
accessibi lity of bus
service
National average
Akashi in 2010 (Recalculation)
Akashi in 2015

Focusing on changes in accessibility over time, we find no change in spatial accessibility
of railway service because new railway routes were not developed between 2010 and 2015. On
the other hand, temporal accessibility increased in same period, because of increasing frequency
of railway service. As a result, integrated accessibility has also increased.
Nevertheless, spatial accessibility of bus service decreased, and temporal accessibility
increased, therefore integrated accessibility indicated the same value in 2015 as in 2010. The
reason for decreasing spatial accessibility of bus service is that Akashi city transitioned a city
bus to a private business operator in March, 2012. Therefore, there is no changes in bus service
level from the perspective of users, but spatial accessibility has decreased by losing total length
from the municipal bus network.
3.3 REGIONAL PUBLIC TRANSPORTATION ACCESSIBILITY
Public transportation accessibility can be calculated easily. Therefore, we can divide some small
region and determine regional accessibility as a tool for investigating gaps in public
transportation service level.
Figure 11 shows the regions in the TTPA. Figure 12. indicates the result of calculating
regional accessibility in 2010 and 2015. For regional accessibility, Akashi eastside and Nishi-Akashi enjoy high integrated
accessibility of railway service. Because of that these areas include the stations which have
larger number of the passengers. There is a key traffic area in Akashi eastside, and spatial
accessibility of bus service in this area also indicates high standards compared with other
regions. On the other hand, accessibility of railway and bus service in Uozumi is low, indicating
a regional divide in public transportation accessibility. In the Futami area, spatial accessibility
of bus service increased between 2010 and 2015 due to newly introduced bus service on the
artificial island is located to the southeast of Akashi.
Figure 11. Regions in Akashi

Akashi eastside Nishi-Akashi Okubo
Uozumi Futami
Figure 12. Regional public transportation accessibility
3.4 REMARKS OF PUBLIC TRANSPORTATION ACCESSIBILITY
Many calculation methods for transportation accessibility have already been proposed, mainly
in academia. However, there is no method to easily calculate accessibility at the national level.
By using MLIT’s municipal survey of public transportation accessibility, it is possible for each
city to compare itself with other cities, and to evaluate its public transportation service level
objectively. In addition, it is also possible to understand changes over time and regional gaps
by using the disclosed calculation method. In other words, we can measure the impact of public
transportation policy on public transportation accessibility.
However, from the point of view of keeping public transportation established, the benefits
of public transportation related development are not made clear by evaluating accessibility
alone. As such, the authors tried to use the concept of cross-sector benefits to calculate the social
benefits of community bus service, which is one of the public transportation systems in Akashi.
4. CROSS-SECTOR BENEFITS OF RUNNING AKASHI COMMUNITY BUS
4.1 BRIEFING OF CROSS-SECTOR BENEFITS AND TARGET PROGRAM
(1) Outline of cross-sector benefits of public transportation
In the field of public transportation, cross-sector benefits can be described as the effects on
related sectors of keeping public transportation established, valuated by the possibility of social
cost savings (Fowkes 1994). Nevertheless, there is no established method to calculate the cross-
sector benefits of public transportation. In this study, the authors tried to confirm the calculation
of the cross-sector benefits targeting community bus service in Akashi, based on the previous
study of Nishimura et al. (2014).
Community bus service in Japan is established by local governments in order to eliminate
regional transit deserts.
0.0
0.5
1.0
1.5
2.0
2.5
3.0
Spatial accessibility
of public
transportation
service
Temporal
accessibi lity of
public
transportation
service
Integrated
accessibi lity of
public
transportation
service
Spatial accessibility
of railway service
Temporal
accessibi lity of
railway service
Integrated
accessibi lity of
railway service
Spatial accessibility
of bus service
Temporal
accessibi lity of bus
service
Integrated
accessibi lity of bus
service
Akashi eastside (in 2015) Akashi eastside (in 2010)
Akashi (in 2015) Akashi (in 2010)
0.0
0.5
1.0
1.5
2.0
2.5
3.0
Spatial accessibility
of public
transportation
service
Temporal
accessibi lity of
public
transportation
service
Integrated
accessibi lity of
public
transportation
service
Spatial accessibility
of railway service
Temporal
accessibi lity of
railway service
Integrated
accessibi lity of
railway service
Spatial accessibility
of bus service
Temporal
accessibi lity of bus
service
Integrated
accessibi lity of bus
service
Nishi-Akashi ( in 2015) Nishi-Akashi ( in 2010)
Akashi (in 2015) Akashi (in 2010)
0.0
0.5
1.0
1.5
2.0
2.5
3.0
Spatial accessibility
of public
transportation
service
Temporal
accessibi lity of
public
transportation
service
Integrated
accessibi lity of
public
transportation
service
Spatial accessibility
of railway service
Temporal
accessibi lity of
railway service
Integrated
accessibi lity of
railway service
Spatial accessibility
of bus service
Temporal
accessibi lity of bus
service
Integrated
accessibi lity of bus
service
Okubo (in 2015) Okubo (in 2010)
Akashi (in 2015) Akashi (in 2010)
0.0
0.5
1.0
1.5
2.0
2.5
3.0
Spatial accessibility
of public
transportation
service
Temporal
accessibi lity of
public
transportation
service
Integrated
accessibi lity of
public
transportation
service
Spatial accessibility
of railway service
Temporal
accessibi lity of
railway service
Integrated
accessibi lity of
railway service
Spatial accessibility
of bus service
Temporal
accessibi lity of bus
service
Integrated
accessibi lity of bus
service
Uozumi (in 2015) Uozumi (in 2010)
Akashi (in 2015) Akashi (in 2010)
0.0
0.5
1.0
1.5
2.0
2.5
3.0
Spatial accessibility
of public
transportation
service
Temporal
accessibi lity of
public
transportation
service
Integrated
accessibi lity of
public
transportation
service
Spatial accessibility
of railway service
Temporal
accessibi lity of
railway service
Integrated
accessibi lity of
railway service
Spatial accessibility
of bus service
Temporal
accessibi lity of bus
service
Integrated
accessibi lity of bus
service
Futami (in 2015) Futami (in 2010)
Akashi (in 2015) Akashi (in 2010)

(2) Community bus service in Akashi
The Akashi community bus service known as “Taco bus” began running in 2004 as a social
experiment, with full-fledged fare based service beginning in 2006. Initially, the community
bus played the role of connecting the core rail station and west of Nishi-Akashi where there are
vulnerable bus networks and high car dependence. The TTPA (in May, 2007) described this role.
In 2007, the community bus was extended to reduce inconvenient transport areas and secure
the mobility of mobility-constrained residents. As of 2015, total bus routes including the “Taco
bus mini” number 15 (Taco bus with 9 routes, Taco bus mini with 6) total. Fare for all lines is
100 yen for adults, 50 yen for children. Figure 13 shows trends in Taco bus and Taco bus mini
ridership. Ridership showed upward trends since 2007, and more than one hundred-thousand
people have used the Akashi community bus in 2015.
From the results obtained in investigation of the actual state of public transportation users
in 2014 (Akashi city, 2014), Figures 14 and 15 indicate that major Akashi community bus users
are women and elderly people (over 65 years old).
As seen above, total ridership on the Akashi community bus has increased in recent years,
and community bus service plays a part in a mobile lifestyle, especially for elderly people.
However, some routes have not been able to surpass the standard 50% ratio of current income
to current expenses (Taco bus mini is 20%). As a result, Akashi expenses about one hundred
fifty million yen every year for maintaining community bus services, in the form of grants.
Figure 13. Trend of Taco bus and Taco bus mini ridership
Figure 14. Gender of Akashi community bus
users
Figure 15. Age of Akashi community bus
users
3 13 16 19 20 22 23 25 26 18
59 62
68 72
75 79 76 78
21
72 78
87 92
97 102 100
104
16
20 21
24 25 27 28 27 28
0
10
20
30
40
50
60
0
20
40
60
80
100
120
2007 2008 2009 2010 2011 2012 2013 2014 2015
Tota
l rid
ersh
ip p
er d
ay
(hu
ndr
ed ri
ders
hp p
er d
ay)
Ten
thou
sand
ride
rshi
p
Ridership of Taco bus mini Ridership of Taco bus Total ridership per day
Men33%
Women67%
(n=1682)
Children below
elementary school age
6%
Junior high school
students or older6%
20 - 40 years old
20%
40 - 64 years old
29%
Elderly people
(over 65 years old)
39%
(n=1682)

Based on these situations, the public transportation sector will be caught in a financial
crunch because of increasing of social welfare costs. Multifaceted policy evaluation of
continuing community bus service will be quite necessary for Akashi in the future.
4.2 POLICY EFFECT OF RUNNING AKASHI COMMUNITY BUS
Nishimura et al. (2014) described twelve sectors which can be used to evaluate the necessity of
public transportation: medical, welfare, commercial, education, sightseeing, construction,
disaster-prevention, traffic safety, general affairs, urban and regional planning, environment and
regional community.
From the point of view that the Akashi community bus service is intended to reduce
transport inconvenience, this study focused on seven sectors in order to calculate cross-sector
benefits: medical, welfare, commercial, traffic safety, general affairs, environment and regional
community. Table 3 shows the result of these calculations, in terms of cross-sector costs if
Akashi community bus were canceled.
This study calculated cross-sector benefits based on calculation methods from previous
studies, using assumed values contained in publicly available data. Under normal circumstances,
benefits should be calculated based on actual costs as informed by related sections of each sector.
Therefore, in the practical operation of cross-sector benefits, establishment of a cooperative
framework includes not only public transportation section as a whole, but also related sections
for sharing information.
Focusing on the calculated results, the costs of canceling the Akashi community bus total
about 5 hundred million yen per year. In contrast, expenses of Akashi community bus service
in 2014 were about 1.5 hundred million yen. As a result, social benefits of Akashi community
bus are larger than the yearly subsidies the city spends on the unprofitable service.
As for policy evaluation of the role of public transportation in society, results indicate that
evaluation from the point of view of cross-sector benefits is more desirable than evaluation
considering only the ratio of current income to current expenses, which is generally used on
bus service evaluation by Akashi city and many other bus service companies in Japan. Moreover,
the social benefit derived from running the Akashi community bus indicates that to maintain
the Akashi community bus is desirable.
On the other hand, there are some remaining issues. In this study, total cost saving effects
of Akashi community bus are around 3.5 hundred million yen. This amount is about 2.3 times
the subsidies for running the Akashi community bus, and many times its operating costs. It is
difficult to use the current method of cross-sector benefits evaluation as a basis for reviewing
individual bus routes, as is emphasized in Nishimura et al. (2014). Nevertheless, this method
will be useful for evaluating the social benefits of maintaining an entire community bus system.
5. Conclusion
In recent years, building compact cities has become a focus in Japan for responding to changes
in social and financial situations caused by depopulation and aging society. In this study, the
authors constructed a process to evaluate public transportation effects based on the
methodology of multifaceted evaluation approach in public transportation practical studies.
Firstly, we clarified the trends of basic indexes such as public transportation ridership and
public transportation modal split, which are focused as the output index of transportation policy.
In Akashi, public transportation ridership has increased in recent years. This can be considered
an effect of transportation measures implemented in the traffic and transportation plan of Akashi.
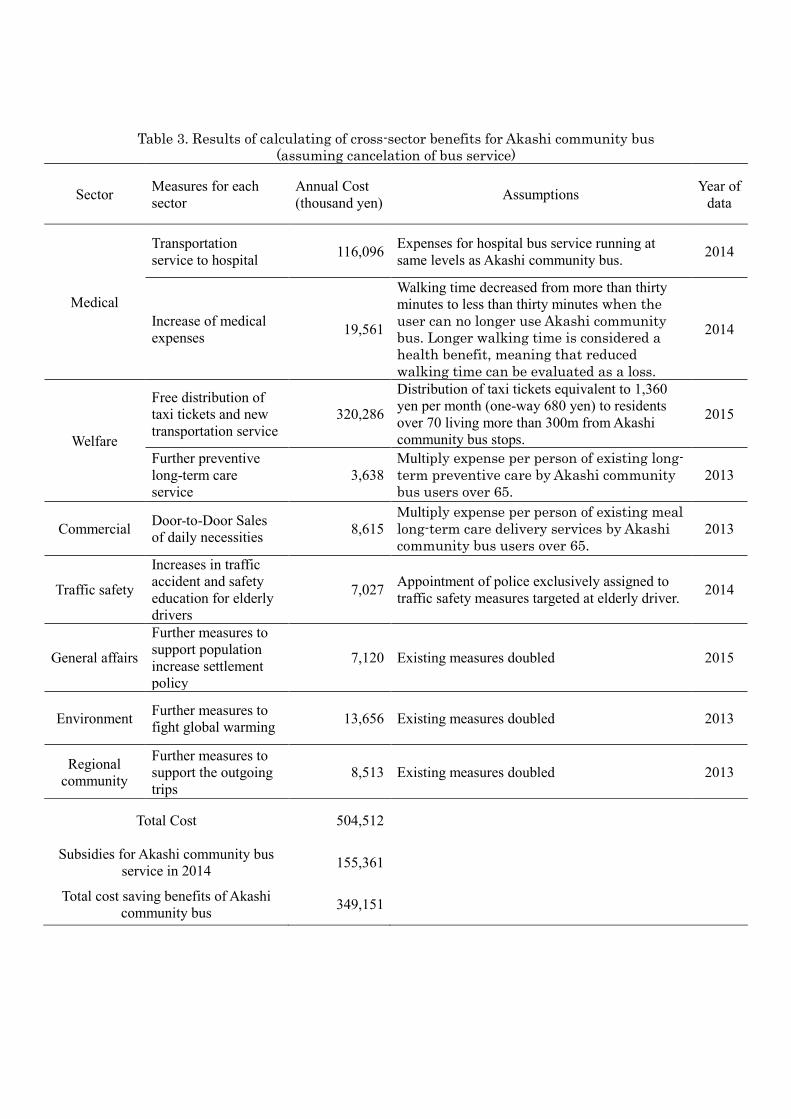
Table 3. Results of calculating of cross-sector benefits for Akashi community bus
(assuming cancelation of bus service)
Sector Measures for each
sector
Annual Cost
(thousand yen) Assumptions
Year of
data
Medical
Transportation
service to hospital 116,096
Expenses for hospital bus service running at
same levels as Akashi community bus. 2014
Increase of medical
expenses 19,561
Walking time decreased from more than thirty
minutes to less than thirty minutes when the
user can no longer use Akashi community
bus. Longer walking time is considered a
health benefit, meaning that reduced
walking time can be evaluated as a loss.
2014
Welfare
Free distribution of
taxi tickets and new
transportation service
320,286
Distribution of taxi tickets equivalent to 1,360
yen per month (one-way 680 yen) to residents
over 70 living more than 300m from Akashi
community bus stops.
2015
Further preventive
long-term care
service
3,638
Multiply expense per person of existing long-
term preventive care by Akashi community
bus users over 65.
2013
Commercial Door-to-Door Sales
of daily necessities 8,615
Multiply expense per person of existing meal
long-term care delivery services by Akashi
community bus users over 65.
2013
Traffic safety
Increases in traffic
accident and safety
education for elderly
drivers
7,027 Appointment of police exclusively assigned to
traffic safety measures targeted at elderly driver. 2014
General affairs
Further measures to
support population
increase settlement
policy
7,120 Existing measures doubled 2015
Environment Further measures to
fight global warming 13,656 Existing measures doubled 2013
Regional
community
Further measures to
support the outgoing
trips
8,513 Existing measures doubled 2013
Total Cost 504,512
Subsidies for Akashi community bus
service in 2014 155,361
Total cost saving benefits of Akashi
community bus 349,151

Considering expenditures in each department in Akashi, the rate of expenditure in civil
engineering indicates downward trends while increasing the rate of people’s livelihood, and
public transportation in Akashi faces an extremely tight fiscal situation. Therefore, it is
necessary to consider by numerical evaluation the effects of public transportation for creating
a sustainable city.
As for policy evaluation of public transportation by analyzing accessibility, we calculated
public transportation accessibility for railway and bus service in 2010 and 2015. We clarified
that frequency of railway service serves to increase temporal accessibility. However, the spatial
accessibility of bus service has decreased from 2010 to 2015 because of the transfer of city bus
service to a private business operator in 2012, though there were no changes in bus service level
from the perspective of riders.
Finally, we calculated the cross-sector benefits of the Akashi community bus. Results
show that the total cost saving effects of the Akashi community bus service are larger than its
running subsidies. In other words, Akashi community bus has a positive social benefit, and the
need to maintain community bus service is clear.
To measure policy effects of maintaining public transportation in a society of constant
change, we evaluated public transportation in Akashi city by verifying the practical availability
of new evaluation indexes (such as cross-sector benefits and public transportation accessibility).
Accordingly, the following two main findings were confirmed:
Public transportation accessibility can be understood by simple calculation of service
level, changes over time and regional gaps.
There is no established method to calculate the cross-sector benefits of public
transportation, and it is difficult to use the current method as a basis for reviewing
individual bus routes. However, social benefits and necessity of maintaining public
transportation can be clarified in a quantitative way.
Acknowledgements
We would like to express our deepest appreciation to Prof. Shoji, K. from Kobe University and
Prof. Matsumura, N. from Ehime University for giving insightful comments and suggestions in
the process of considering policy evaluation of community bus service.
REFERENCES
Akashi city (2013) Traffic and transportation plan of Akashi. (in Japanese)
Akashi city (2014) Investigation of the actual state of public transportation users. (in
Japanese)
Akashi city (2016) Financial results in 2015. (in Japanese)
Carr, M., Lund, T., Oxley, P. and Alexander, J. (1991) Cross-sector benefits of accessible
public transport, Transport Research Laboratory.
Cheng, Y. and Chen, S. (2015) Perceived accessibility, mobility, and connectivity of
public transportation systems, Transportation Research Part A: Policy and Practice,
Volume 77, 386-403
Fowkes, A., Oxlet, P. and Heiser, B. (1994) Cross-sector benefits of accessible pulilc
transport, Cranfield University Press.

Geurs, K. T. and van Wee, B. (2004) Accessibility evaluation of land-use and transport
strategies: review and research directions, Journal of Transport Geography, Volume
12, Issue 2, 127-140
Hou, Q. and Li S. (2011) Transport infrastructure development and changing spatial
accessibility in the Greater Pearl River Delta, China, 1990–2020, Journal of Transport
Geography, Volume 19, Issue 6, 1350-1360
Matsunaka, R. (2012) Urban public transportation planning in France based on the projects
of "Grenelle de l'Environnement", Journal of the City Planning Institute of Japan,
Vol.47, No.2, 154-161. (in Japanese)
Ministry of Land, Infrastructure and Transport (2015) Municipal chart of Akashi city. (in
Japanese)
Nishimura, K., Doi, T. and Kita, H. (2014) Value created by public transportation in terms
of cost cuts in whole society—a perspective from cross-sector benefits—, Journal of
Japan Society of Civil Engineers, Ser. D3 (Infrastructure Planning and Management),
Vol.70, No.5, I_809-I_818. (in Japanese)
Papa, E. and Bertolini, L. (2015) Accessibility and Transit-Oriented Development in
European metropolitan areas, Journal of Transport Geography, Volume 47, 70-83
Takebayashi, H. and Nitta, Y. (2010) A study on review processes of community bus
services provided by local governments - A case study on the "Taco-bus" in Akashi
city, Japan -, Journal of the Eastern Asia Society for Transportation Studies, Vol.8.
Tanimoto, K., Kamiyama, Y. and Maki, S. (2007) Comparative analysis on accessibility
measures for public transportation planning, Infrastructure planning review, Vol.24,
No.4, 677-686. (in Japanese)
Yajima, M., Oe, N., Funato, R., Sakamoto, K. and Kubota, H. (2011) A practical study of
pdca cycle in route bus business, Journal of Japan Society of Civil Engineers, Ser. D3
(Infrastructure Planning and Management), Vol.67, No.5, I_987-I_999. (in Japanese)
Yajima, M., Oe, N., Sakamoto, K. and Kubota, H. (2012) Improvement of route bus
operation with serially pdca cycle, Journal of Japan Society of Civil Engineers, Ser. D3 (Infrastructure Planning and Management), Vol.68, No.5, I_943-I_949. (in Japanese)
Yamazaki, M., Hideshima, E., Izuhara, K. and Yamamoto, K. (2002) The appraisal of
transportation policy development process in local city - A case study for the
"SANSAN BUS" project in Miyoshi town -, Journal of the City Planning Institute of
Japan, Vol.37, 211-216. (in Japanese)