A Practical Copper Loss Measurement Method for the Planar ... · A Practical Copper Loss...
12
2276 IEEE TRANSACTIONS ON INDUSTRIAL ELECTRONICS, VOL. 54, NO. 4, AUGUST 2007 A Practical Copper Loss Measurement Method for the Planar Transformer in High-Frequency Switching Converters Yongtao Han, Student Member, IEEE, Wilson Eberle, Senior Member, IEEE, and Yan-Fei Liu, Senior Member, IEEE Abstract—In this paper, a new and practical measurement method is proposed to characterize the planar transformer copper loss operating in a high-frequency switching mode power supply (SMPS). The scheme is easy to set up, and it provides an equivalent winding alternating current resistance, which is the result of all the field effects on the transformer windings to achieve more accurate copper loss characterization. A detailed error analysis for the pro- posed copper loss measurement method is conducted. The analysis results can provide useful guidelines on the SMPS transformer copper loss measurement scheme design. Measurement results on the copper loss of a planar transformer in a high-frequency dc/dc converter are presented. In order to verify the measurement results, a time-domain finite-element analysis transient solver is adopted to analyze the transformer copper loss. Good matching between the simulation and measurement results is achieved. Index Terms—Copper loss, finite-element analysis (FEA), pla- nar transformer, pulsewidth modulation (PWM), switching mode power supply (SMPS), winding ac resistance. I. I NTRODUCTION P LANAR magnetic components are widely used in high- switching-frequency power converters [1]–[5]. At higher frequencies, the magnetic losses in the switching mode power converters have also been increased. Accurate analysis and characterization of the transformer core loss and copper loss play an important role in the design and optimization of switch- ing mode power supplies (SMPSs). The characterization for the transformer core loss has been frequently discussed in the literature [6]–[9]. However, little work has been done on the transformer copper loss characterization under the actual operating condition. This paper focuses on the characterization of the transformer copper loss for high-frequency SMPSs, and a new measurement method is proposed. Analytical and measurement methods are usually used to obtain the transformer copper loss in SMPSs. The analytical method is based on Fourier series analysis [10]–[14]. With this method, the pulsewidth-modulated (PWM) current waveform flowing through the SMPS transformer windings is decom- Manuscript received October 8, 2005; revised February 4, 2007. Y. Han was with the Department of Electrical and Computer Engineering, Queen’s University at Kingston, Kingston, ON K7L 3N6, Canada. He is now with Jabil Circuit Inc., Shanghai 200233, China. W. Eberle and Y.-F. Liu are with the Department of Electrical and Computer Engineering, Queen’s University at Kingston, Kingston, ON K7L 3N6, Canada (e-mail: [email protected]). Color versions of one or more of the figures in this paper are available online at http://ieeexplore.ieee.org. Digital Object Identifier 10.1109/TIE.2007.899877 posed into i dc , if any, and the harmonics as i 1 ,i 2 ,...; then, the transformer winding dc resistance (R dc ) is calculated, and the ac resistance under each harmonic (R 1 ,R 2 ,...) is obtained using Dowell’s results [15] for the primary and secondary windings, respectively. The transformer total copper loss is then calculated as P copper = P pri + P sec = R dc-pri · I 2 dc-pri + 1 2 N n=1 I 2 n-pri · R n-pri + R dc-sec · I 2 dc-sec + 1 2 N n=1 I 2 n-sec · R n-sec . (1) The analytical method can only be applied to simple trans- former structures, and rough approximations on the core and winding structure are always made. Because of this limitation, they cannot handle complicated winding structures, especially with parallel windings. Another drawback is that they cannot take into account the effect of the nonideal field distributions within the transformer, such as the fringing flux, bypass flux, and winding edge effect [16]–[19]. These effects will impact the winding copper loss significantly, especially for a planar transformer. The measurement method is widely used to obtain the trans- former copper loss and, at the same time, verify the analytical method results. Compared with the analytical method, the measurement method has potentially higher accuracy because it could theoretically include all the field effects on the windings within the transformer structure. However, delicate equipment and experiment are usually needed. In addition, no scheme is available to measure the transformer copper loss under the actual operating conditions, such as directly using the PWM current waveforms. In this paper, after reviewing the limitations of the existing transformer copper loss measurement methods, a new scheme is proposed to measure the transformer copper loss operating in high-frequency SMPSs. An equivalent winding ac resistance for each winding is measured under the transformer’s actual operating condition, which is the result of all the field effects on the winding to achieve an accurate copper loss result, including the nonideal field distributions and field interaction between the primary and secondary windings. The scheme is easy to set up. 0278-0046/$25.00 © 2007 IEEE
Transcript of A Practical Copper Loss Measurement Method for the Planar ... · A Practical Copper Loss...
2276 IEEE TRANSACTIONS ON INDUSTRIAL ELECTRONICS, VOL. 54, NO. 4, AUGUST 2007
A Practical Copper Loss Measurement Method forthe Planar Transformer in High-Frequency
Switching ConvertersYongtao Han, Student Member, IEEE, Wilson Eberle, Senior Member, IEEE, and Yan-Fei Liu, Senior Member, IEEE
Abstract—In this paper, a new and practical measurementmethod is proposed to characterize the planar transformer copperloss operating in a high-frequency switching mode power supply(SMPS). The scheme is easy to set up, and it provides an equivalentwinding alternating current resistance, which is the result of all thefield effects on the transformer windings to achieve more accuratecopper loss characterization. A detailed error analysis for the pro-posed copper loss measurement method is conducted. The analysisresults can provide useful guidelines on the SMPS transformercopper loss measurement scheme design. Measurement resultson the copper loss of a planar transformer in a high-frequencydc/dc converter are presented. In order to verify the measurementresults, a time-domain finite-element analysis transient solver isadopted to analyze the transformer copper loss. Good matchingbetween the simulation and measurement results is achieved.
Index Terms—Copper loss, finite-element analysis (FEA), pla-nar transformer, pulsewidth modulation (PWM), switching modepower supply (SMPS), winding ac resistance.
I. INTRODUCTION
P LANAR magnetic components are widely used in high-switching-frequency power converters [1]–[5]. At higher
frequencies, the magnetic losses in the switching mode powerconverters have also been increased. Accurate analysis andcharacterization of the transformer core loss and copper lossplay an important role in the design and optimization of switch-ing mode power supplies (SMPSs). The characterization for thetransformer core loss has been frequently discussed in theliterature [6]–[9]. However, little work has been done onthe transformer copper loss characterization under the actualoperating condition. This paper focuses on the characterizationof the transformer copper loss for high-frequency SMPSs, anda new measurement method is proposed.
Analytical and measurement methods are usually used toobtain the transformer copper loss in SMPSs. The analyticalmethod is based on Fourier series analysis [10]–[14]. With thismethod, the pulsewidth-modulated (PWM) current waveformflowing through the SMPS transformer windings is decom-
Manuscript received October 8, 2005; revised February 4, 2007.Y. Han was with the Department of Electrical and Computer Engineering,
Queen’s University at Kingston, Kingston, ON K7L 3N6, Canada. He is nowwith Jabil Circuit Inc., Shanghai 200233, China.
W. Eberle and Y.-F. Liu are with the Department of Electrical and ComputerEngineering, Queen’s University at Kingston, Kingston, ON K7L 3N6, Canada(e-mail: [email protected]).
Color versions of one or more of the figures in this paper are available onlineat http://ieeexplore.ieee.org.
Digital Object Identifier 10.1109/TIE.2007.899877
posed into idc, if any, and the harmonics as i1, i2, . . .; then,the transformer winding dc resistance (Rdc) is calculated, andthe ac resistance under each harmonic (R1, R2, . . .) is obtainedusing Dowell’s results [15] for the primary and secondarywindings, respectively. The transformer total copper loss is thencalculated as
Pcopper =Ppri + Psec
=
(Rdc-pri · I2dc-pri +
12
N∑n=1
I2n-pri · Rn-pri
)
+
(Rdc-sec · I2dc-sec +
12
N∑n=1
I2n-sec · Rn-sec
).
(1)
The analytical method can only be applied to simple trans-former structures, and rough approximations on the core andwinding structure are always made. Because of this limitation,they cannot handle complicated winding structures, especiallywith parallel windings. Another drawback is that they cannottake into account the effect of the nonideal field distributionswithin the transformer, such as the fringing flux, bypass flux,and winding edge effect [16]–[19]. These effects will impactthe winding copper loss significantly, especially for a planartransformer.
The measurement method is widely used to obtain the trans-former copper loss and, at the same time, verify the analyticalmethod results. Compared with the analytical method, themeasurement method has potentially higher accuracy because itcould theoretically include all the field effects on the windingswithin the transformer structure. However, delicate equipmentand experiment are usually needed. In addition, no schemeis available to measure the transformer copper loss under theactual operating conditions, such as directly using the PWMcurrent waveforms.
In this paper, after reviewing the limitations of the existingtransformer copper loss measurement methods, a new schemeis proposed to measure the transformer copper loss operatingin high-frequency SMPSs. An equivalent winding ac resistancefor each winding is measured under the transformer’s actualoperating condition, which is the result of all the field effects onthe winding to achieve an accurate copper loss result, includingthe nonideal field distributions and field interaction between theprimary and secondary windings. The scheme is easy to set up.
0278-0046/$25.00 © 2007 IEEE
HAN et al.: COPPER LOSS MEASUREMENT METHOD IN HIGH-FREQUENCY SWITCHING CONVERTERS 2277
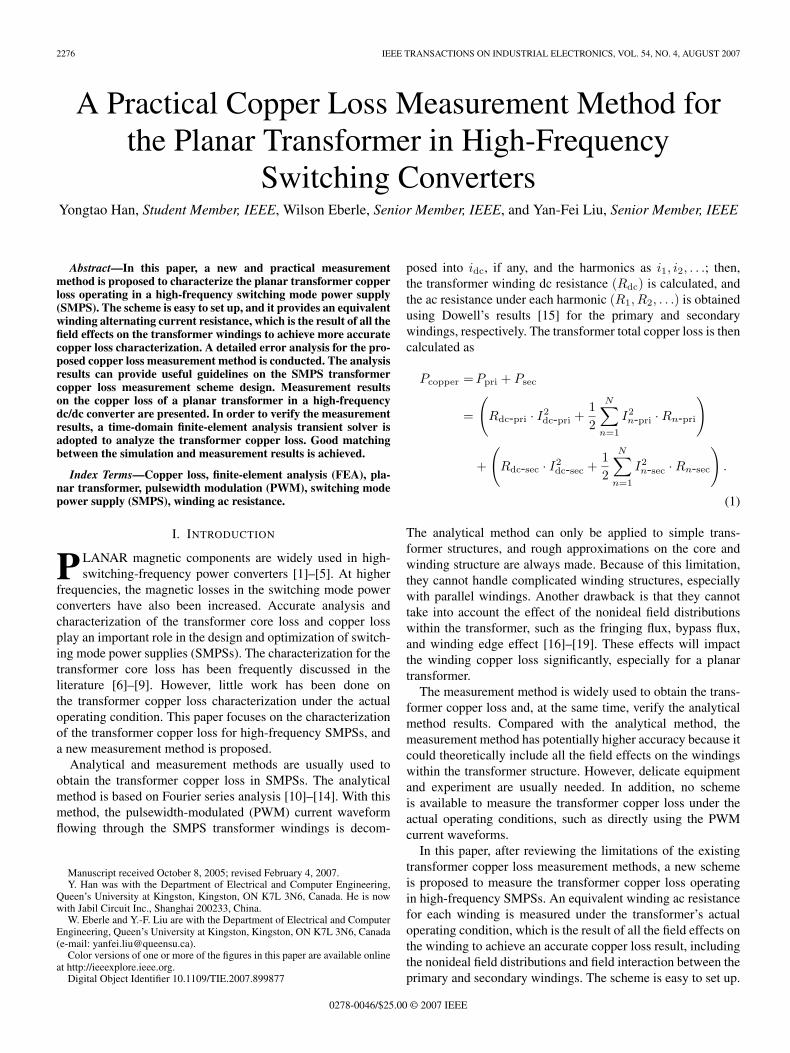
Fig. 1. Calorimeter method for transformer winding copper lossmeasurement.
It also avoids the difficulties that are encountered by othermeasurement methods, such as the separation of core loss fromcopper loss.
Section II reviews the existing copper loss measurementmethods and highlights their drawbacks. In Section III, the newcopper loss measurement method is proposed with the detailedexplanations on the measurement principle, the important is-sues, and the proposed key steps that are related to the measure-ment. Section IV provides the measurement results on a planartransformer winding ac resistances using the proposed method.The measurement results are compared with the finite-elementanalysis (FEA) simulation results by a time-domain transientsolver. In Section V, measurement is conducted to demonstratethe impact of the field interaction between the primary andsecondary windings on the winding ac resistances, which isignored by the existing measurement methods. The results showthat the proposed method can provide more accurate copperloss information because it can include the field interactionbetween windings. Section VI performs the error analysis onthe proposed measurement method and demonstrates that theproposed method can achieve measurement accuracy higherthan 5%. Section VII provides the conclusion.
II. REVIEW OF EXISTING TRANSFORMER COPPER
LOSS MEASUREMENT METHODS
Two measurement methods are commonly used to measurethe transformer copper loss, namely, 1) the calorimetric methodand 2) the Fourier-analysis-based method.
A. Calorimetric Method
The calorimetric method is a typical indirect method andis widely used in the transformer winding copper loss mea-surement for SMPSs. One of the schemes is shown in Fig. 1.The measurement principle of this scheme is stated as follows:The transformer under test is placed in the calorimeter tube,which is enclosed in a near-adiabatic chamber in order tominimize the heat loss in the system. The flow within the tubeis maintained at a constant rate with the pump and control
valve. The reservoir and the cooling coils are used to maintainthe constant temperature for the inlet tube fluid. The “∆T ”block is a thermocouple pile, which measures the temperaturedifference between the inlet and outlet to the calorimeter tube.The transformer copper loss is calculated based on the steady-state temperature rise of a constant flow rate of the calorimetertube in the chamber.
The calorimetric method can potentially achieve high accu-racy in measuring the dissipated power. However, it is verydifficult to set up, and a long time is needed to achieve thethermal equilibrium before the experiment can be carried out.Significant leakage inductance and parasitic capacitance areintroduced by the terminal leads, which will impact the trans-former operation and, hence, reduce the measurement accu-racy. Delicate equipment (calorimeter tube and a near-adiabaticchamber) are also needed. One other important drawback is thatit cannot distinguish the copper loss from the core loss.
B. Fourier-Analysis-Based Method
Based on Fourier series analysis, several methods have beenproposed to characterize the transformer copper loss by mea-suring the winding ac resistance for each harmonic in the PWMcurrent waveform. In [20], a high-precision multifrequencyLCR meter is used to measure the transformer winding acresistance in SMPSs. However, in the measurement, the mag-netic core should be removed from the winding to avoid errors.Hence, it cannot reflect the actual field within the transformerand its effects on the winding copper loss. In [21], the authorsproposed an analytical method to calculate the transformerwinding ac resistance under arbitrary current waveforms. As theverifications on the analytical results, an impedance analyzer isused to measure the transformer winding ac resistance for dif-ferent harmonic frequencies. Therefore, these methods actuallyuse the sine waveform in the measurement, not directly usingthe PWM waveform under the transformer winding’s actualoperating conditions.
It should be noted that, under the transformer’s actual oper-ating condition, both the primary and secondary windings arecarrying current at the same time. The field interaction betweenthe primary and secondary windings due to the proximity effecthas a significant impact on the transformer winding copper lossand is neglected in these methods [22]. With the above methods,the ac resistance of the primary and secondary windings ismeasured separately, which means that only one winding hascurrent flowing in the measurement. Therefore, another veryimportant disadvantage of these methods is that their resultsonly provide the resistance information for the winding itselfand cannot consider the field interaction between transformerwindings.
C. Requirements on Transformer Copper LossMeasurement for SMPSs
At high switching frequency, the transformer winding acresistance significantly increases compared with its dc resis-tance because of the skin and proximity effects. In addition,

2278 IEEE TRANSACTIONS ON INDUSTRIAL ELECTRONICS, VOL. 54, NO. 4, AUGUST 2007
Fig. 2. Equivalent circuit model of a loaded two-winding transformer.
the field interaction between windings and the nonideal fielddistributions (fringing flux, bypass flux, etc.) within the trans-former have significant impact on the winding copper loss.It is also noted that the influence of these factors on thewinding ac resistance is strongly structure and frequency de-pendent. Consequently, these impacts are very difficult toanalyze.
Due to the limitations of the analytical methods in calculatingthe transformer copper loss in high-frequency SMPSs, themeasurement method is the preferred way to characterize thetransformer copper loss. To avoid the drawbacks of the existingmeasurement methods in designing the transformer copper lossmeasurement scheme for SMPSs, the following requirementsare important to achieve accurate measurement.
1) “In-Component” Scheme: This means that the ferritecore should not be removed from the windings and the trans-former operates in the actual electromagnetic field of the op-erating conditions. The nonideal field distributions can also betaken into account.
2) Actual PWM Current Waveforms: The PWM currentunder the transformer’s actual operating condition should bedirectly applied to the windings instead of using the harmonicsinusoidal waveforms.
3) Simultaneous Current Flowing in Both the Primary andSecondary Windings: By achieving this requirement, the fieldinteraction between the primary and secondary windings isincluded in the copper loss measurement results.
Based on these requirements, a new and “in-component”measurement method is proposed to measure the transformerwinding copper loss for SMPSs directly using the PWM cur-rent waveforms. This method can provide an equivalent acresistance for the measurement condition. It considers all thefield effects on the windings, including the field interactionbetween windings, to achieve more accurate results for thecopper loss characterization. The transformer copper loss mea-surement method proposed can be applied to improve theperformance of the transformers, as well as the converters,in [23]–[27].
III. PROPOSED TRANSFORMER COPPER LOSS
MEASUREMENT METHOD
In this section, the proposed new transformer copper lossmeasurement method will be explained in detail. First, someimportant issues and difficulties in the transformer copper lossmeasurement are analyzed so that the proposed method can bebetter understood.
Fig. 3. Secondary side equivalent circuit in the winding ac resistancemeasurement.
A. Important Issues Related to Copper Loss Measurement
The objective of the transformer copper loss measurement isto obtain an equivalent ac resistance for each winding under theactual operating condition. This equivalent ac resistance can beconsidered as a characteristic of the winding under the currentwaveform carried by the winding. In designing the scheme tomeasure the transformer copper loss in SMPSs, it is importantto clarify the following two points:
1) Current Wave Shape Used in the Measurement: By ana-lyzing the SMPS circuits, the currents flowing throughthe transformer windings can be well approximated asrectangular wave shape (unipolar or bipolar) of the cor-responding duty ratio by ignoring the small ripple stayingon the top [10].
2) Equivalent AC Resistance: Although the field interactionbetween windings has a significant effect on the windingac resistance, we do not need to separately obtain thisinformation . We only need an equivalent ac resistance ofeach winding under the operating condition, which con-siders all the high-frequency effects and field interaction.Then, the total copper loss can be calculated as
Pcopper = i2PriRMSRPriAC + i2SecRMSRSecAC. (2)
B. Difficulties in Transformer Winding ACResistance Measurement
The equivalent circuit model of a two-winding transformerunder the loaded condition is shown in Fig. 2.
Here, Vpri and Vsec are the primary and secondary wind-ing voltages; Rcopper-pri and Rcopper-sec are the primary andsecondary winding equivalent resistances; Llk-pri and Llk-secare the primary winding and secondary winding leakage in-ductances; Rcore stands for the core loss, and Lm is the mag-netizing inductance; and Cps, Cpri, and Csec are the windingcapacitances.
In Fig. 2, Rcopper-pri and Rcopper-sec are the values thatwe want to measure, which represent the winding copper loss.

HAN et al.: COPPER LOSS MEASUREMENT METHOD IN HIGH-FREQUENCY SWITCHING CONVERTERS 2279
Fig. 4. Transformer winding ac resistance measurement scheme.
It is observed from the equivalent circuit model that the elec-tric circuit components and parameters inside the enclosingrectangular block are all inside the transformer and cannot beaccessed by the measurement. Using the secondary side as anexample, at the loaded condition, we can derive the secondary-side equivalent circuit as in Fig. 3. (Winding capacitancesare ignored because they do not affect the winding resistancecalculation).
Only the load voltage (VLoad) can be measured. Due to thewinding resistance and leakage inductance, the actual windingterminal voltage (VSec) is unknown. Although we can calculatethe current flowing through the winding ac resistance, whichis the same as the current through the load resistor RLoad, westill cannot obtain the voltage across the winding resistanceRSecAC without obtaining the winding terminal voltage VSec.Consequently, the winding ac resistance cannot be measured.
Therefore, it is critical to accurately measure the windingterminal voltage for the winding resistance measurement. In theproposed method, this difficulty is solved by the introduction ofan auxiliary winding to accurately measure the terminal voltageof the winding under test.
C. Proposed Copper Loss Measurement Scheme
The proposed transformer winding ac resistance measure-ment scheme is shown in Fig. 4. Using the secondary windingresistance measurement as an example, the measurement prin-ciple is explained as follows.
A PWM waveform generator and a power amplifier areused as the excitation source to provide the rectangular PWMvoltage at the primary side. By applying this PWM voltage onthe primary side, the magnetic field is established within thetransformer, and a PWM voltage is induced at the secondaryside. The first requirement (i.e., in-component), as stated inSection II, is satisfied. If a resistive load is connected at thesecondary side, a current in rectangular PWM wave shapewill flow through the load resistor, as well as the secondarywinding equivalent ac resistance, as shown in the equivalentcircuit in Fig. 3. Hence, the second condition (i.e., PWM currentwaveform) stated in Section II is met. Once the secondaryside is loaded, current also flows through the primary windingsimultaneously. Thus, the third requirement (i.e., simultaneouscurrent flow), as stated in Section II, is also fulfilled.
In order to obtain the secondary winding terminal voltage,an auxiliary winding (NAux) is introduced, as shown in Fig. 4.This winding is an open circuit. Since the same magneticflux will couple both the secondary winding and the auxiliary
winding, the secondary winding terminal voltage VSec can becalculated by measuring the auxiliary winding terminal voltageVAux as follows:
VSec =NSec
NAuxVAux. (3)
The secondary-side current iSec can be obtained by measuringthe voltage across the load resistor. With the winding terminalvoltage and the current available, the winding ac resistanceRSecAC is calculated as
RSecAC =PSec−PLoad
I2SecRMS
(4)
where ISecRMS is the rms value of the secondary-side currentiSec. PSec is the power of the secondary winding over oneswitching period T , which can be calculated as
PSec =
T∫0
VSec · iSec · dt =
T∫0
NSec
NAux· VAux · iSec · dt (5)
and PLoad is the load resistor power over one switching period,which can be calculated as
PLoad =
T∫0
VLoad · iSec · dt. (6)
The two voltages Vaux and VLoad (i.e., V1 and V2, as shownin Fig. 4, respectively) are measured by a digital oscilloscope(Tektronix TDS 5054 is used in this paper). By calculating theaverage value of the secondary winding power PSec and therms value of the secondary winding current over one switchingperiod using the mathematical functions of the digital oscillo-scope, the secondary winding equivalent ac resistance is finallycalculated as
RSec-AC=PSec−PLoad
I2SecRMS
=
NSecNAux
1N
N∑i=1
V1i · V2i
RLoad
1N
N∑i=1
(V2i
RLoad
)2 −RLoad
(7)
whereNSec, NAux turns of the secondary and auxiliary windings;V1i, V2i ith sample of the measured voltage values of
Vaux and VLoad by the digital oscilloscope;N number of samples in one switching period.
2280 IEEE TRANSACTIONS ON INDUSTRIAL ELECTRONICS, VOL. 54, NO. 4, AUGUST 2007
With a less sophisticated digital oscilloscope, the measured rawdata can be saved and exported to Excel or MathCad to calculatethe winding resistance. In the same way, we can obtain theac resistance for other secondary windings and the primarywinding (i.e., excite the transformer from the secondary side)in the multiwinding transformer.
This scheme is a real “in-component” method and is suitablefor multiwinding transformer structures, as the auxiliary wind-ing could be the third winding in the transformer. For a two-winding transformer, an auxiliary winding should be added.This auxiliary winding does not need to carry current. Thereis no special requirement for this auxiliary winding, and it iseasy to do.
This scheme is easy to implement and can include all the fieldeffects on the windings to achieve more accurate measurementfor the winding ac resistance and, consequently, the copper losscalculation. It can also avoid the difficulty to separate the coreloss from the copper loss. As the digital oscilloscope accom-plishes most of the necessary calculations on the measured data,a significant amount of time can be saved on data processing,and measurement result can quickly be obtained.
D. Practical Issues and Key Steps
In order to ensure accurate measurement of the transformerwinding ac resistance and eliminate the measurement errorfrom various sources, care should be taken in the test setup andmeasurement. Practical issues and key steps in the transformerwinding ac resistance measurement using the proposed methodare explained as follows.
1) Power Source: A PWM waveform generator (Agilent33120A) and an RF power amplifier are used to provide thePWM voltage source to the transformer. PWM waveforms ofdifferent duty ratios are generated. The power amplifier shouldhave enough bandwidth to generate the required waveform.
It is noted that due to the high-frequency effect, the actualwinding ac resistor could be different under different operat-ing conditions, such as switching frequency, duty cycle, andamplitude. In order to accurately characterize the transformerwinding ac resistance under actual operating conditions, it isalways a good idea to use the same PWM current waveformas in the actual condition. Achieving this requirement largelydepends on the capability of the power amplifier. The worstcase ac resistor happens at the minimum duty cycle and highestcurrent amplitude. Therefore, if the power source cannot pro-vide the required load current, it is suggested to measure theac resistor at the maximum current that the power source canprovide.
2) Load Resistor and Calibration: The load resistor hasa large impact on the accuracy of the winding ac resistancemeasurement result due to its tolerance and its parasitic induc-tance. In order to minimize the error introduced by the loadresistor, it is suggested that a low-inductive resistor be usedand the resistor’s frequency response be calibrated using animpedance analyzer to obtain the accurate resistance value andphase response. These values can be used in the measurement,calculations, and error analysis.
The following factors are considered in the selection of theload resistor: Because the transformer winding resistance is
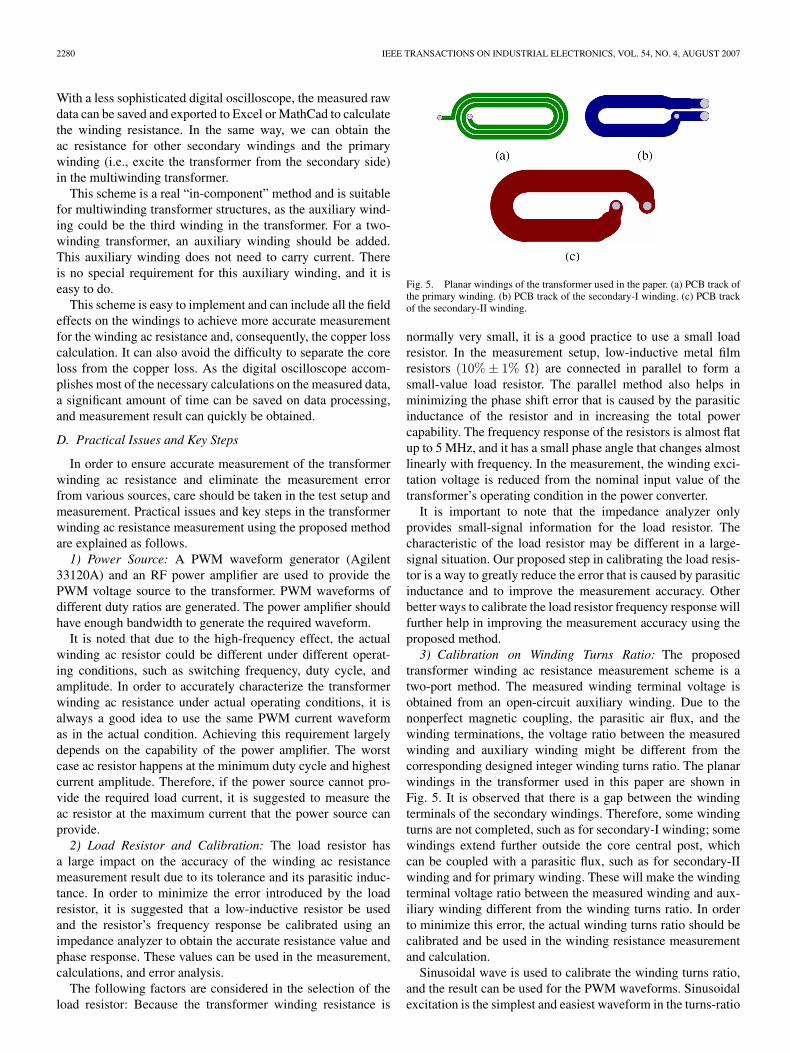
Fig. 5. Planar windings of the transformer used in the paper. (a) PCB track ofthe primary winding. (b) PCB track of the secondary-I winding. (c) PCB trackof the secondary-II winding.
normally very small, it is a good practice to use a small loadresistor. In the measurement setup, low-inductive metal filmresistors (10% ± 1% Ω) are connected in parallel to form asmall-value load resistor. The parallel method also helps inminimizing the phase shift error that is caused by the parasiticinductance of the resistor and in increasing the total powercapability. The frequency response of the resistors is almost flatup to 5 MHz, and it has a small phase angle that changes almostlinearly with frequency. In the measurement, the winding exci-tation voltage is reduced from the nominal input value of thetransformer’s operating condition in the power converter.
It is important to note that the impedance analyzer onlyprovides small-signal information for the load resistor. Thecharacteristic of the load resistor may be different in a large-signal situation. Our proposed step in calibrating the load resis-tor is a way to greatly reduce the error that is caused by parasiticinductance and to improve the measurement accuracy. Otherbetter ways to calibrate the load resistor frequency response willfurther help in improving the measurement accuracy using theproposed method.
3) Calibration on Winding Turns Ratio: The proposedtransformer winding ac resistance measurement scheme is atwo-port method. The measured winding terminal voltage isobtained from an open-circuit auxiliary winding. Due to thenonperfect magnetic coupling, the parasitic air flux, and thewinding terminations, the voltage ratio between the measuredwinding and auxiliary winding might be different from thecorresponding designed integer winding turns ratio. The planarwindings in the transformer used in this paper are shown inFig. 5. It is observed that there is a gap between the windingterminals of the secondary windings. Therefore, some windingturns are not completed, such as for secondary-I winding; somewindings extend further outside the core central post, whichcan be coupled with a parasitic flux, such as for secondary-IIwinding and for primary winding. These will make the windingterminal voltage ratio between the measured winding and aux-iliary winding different from the winding turns ratio. In orderto minimize this error, the actual winding turns ratio should becalibrated and be used in the winding resistance measurementand calculation.
Sinusoidal wave is used to calibrate the winding turns ratio,and the result can be used for the PWM waveforms. Sinusoidalexcitation is the simplest and easiest waveform in the turns-ratio

HAN et al.: COPPER LOSS MEASUREMENT METHOD IN HIGH-FREQUENCY SWITCHING CONVERTERS 2281
calibration for the following reasons: First, it is much easier toobtain a sine waveform; second, no distortions and overshootwill happen to the sine waveform; and third, the definition andcalculation of the turns ratio is easy to make, such as using thepeak voltage value or peak-to-peak voltage value. It should benoted that the winding turns ratio is the transformer character-istic, and it does not depend on the excitation waveforms.
The procedure of winding turns-ratio calibration is to excitethe transformer using a third winding by a sine waveform, andthe terminal voltages of the tested and auxiliary windings aremeasured and the actual turns ratio can be calculated as
NTurns-Ratio =Vmeasured
VAux. (8)
The peak voltage value or peak-to-peak voltage value can beused in the calibration. It should be noted that this calibrationprocedure should be conducted over a range of frequencies inorder to cover the frequency range of the PWM harmonics.If the measured winding turns ratios at different frequenciesare different, the averaging method can be used to obtainan averaged winding turns-ratio value. When the turns ratiobetween the measured and auxiliary windings is obtained, itcan be used in the winding ac resistance measurement andcalculation to achieve more accurate results. By adopting thecalibration, the measurement error introduced by the windingturns ratio can be neglected.
4) Averaging Method: In order to eliminate the randomerror in the measurement, the averaging method is adopted indata processing. The winding ac resistance measurement foreach operating condition is repeated for several times (ten timesfor this paper). Then, these values are averaged by calculation.There will also be the offset error from the power amplifier andthe digital oscilloscope in the measurement. This kind of errorcan be easily eliminated by the offset compensation capabilityof the digital oscilloscope.
IV. COMPARISON BETWEEN MEASUREMENT
RESULTS AND FEA SIMULATION
In this section, the transformer winding ac resistance mea-surement results using the proposed method are presented. Asno other method can accurately predict the transformer copperloss under the actual operating condition, the proposed copperloss method is compared with the FEA simulation result usinga time-domain solver from ANSOFT [28]. The measurementresult and the simulation result are very close to each other.
A. Details of the Transformer Under Test
A high-frequency planar transformer is tested for the windingac resistance using the proposed scheme. This multiwindingplanar transformer is used in an asymmetrical half-bridge(AHB) dc/dc converter with unbalanced secondary windings[29]. In addition to three main power windings, the AHBtransformer has three auxiliary windings, one for the controlchip power supply and two for driving the secondary-sidesynchronous rectifiers. The converter schematic and half crosssection of the designed transformer are shown in Fig. 6. The
Fig. 6. (top) AHB converter scheme and (bottom) half cross section of thetransformer.
dots shown in the figure indicates the added auxiliary winding.The main specifications and parameters of the converter and thetransformer are listed as follows:
1) converter input voltage: 35–75 V, nominal at 48 V;2) converter output: 5 V/25 W;3) switching frequency: 400 kHz;4) main winding turns: Np: Ns1: Ns2 = 6 : 1 : 3;5) core: 41805EC planar core (E18/4/10 in EE combination)
of P-material from Magnetics Inc.;6) winding: 1 oz (35 µm in thickness) copper is used for the
winding tracks, producing an eight-layer printed circuitboard (PCB).
Fig. 6 also illustrates the placement of the auxiliary windings(shown in dots). The auxiliary winding can be arranged in thegap between the core and the PCB for the planar transformerwindings. As this auxiliary winding is only used to measurethe winding terminal voltage and it does not carry current, astandard copper wire can be used; and there is no requirementon the wire gauge.
B. FEA Time-Domain Solver
As a powerful tool, the FEA method is widely used in thedesign and loss analysis for transformers in SMPSs. From theliterature, all the work done before is based on the FEA solverusing sinusoidal excitations, which is essentially a frequency-domain analysis. In this paper, in order to verify the copperloss measurement results under a real operating condition, atime-domain transient solver in the FEA software packageMaxwell from ANSOFT [28] is used to analyze the winding acresistance. This solver can solve the electromagnetic problemswith periodic arbitrary waveform of excitation. The PWM

2282 IEEE TRANSACTIONS ON INDUSTRIAL ELECTRONICS, VOL. 54, NO. 4, AUGUST 2007
Fig. 7. Measurement and FEA results for the AHB transformer primarywinding.
Fig. 8. Measurement and FEA results for the AHB transformer secondary-Iwinding.
current waveforms flowing in the transformer windings can bedirectly used as the sources. In addition, 3-D modeling is usedto achieve higher accuracy.
It is noted that the following limitations have prevented thewide use of the FEA software package in industry. The firstlimitation is that this kind of commercial FEA solver softwarepackage is very expensive. The second limitation is that exten-sive time is needed to learn how to use the software to modeland analyze the electromagnetic problems. The third and alsoa very important limitation is that it is very time consumingto carry out the analysis. For example, for analyzing the AHBtransformer winding resistance by 3-D modeling, it takes morethan 6 h to obtain the copper loss for one operating conditioneven by using the latest computer.
C. Measurement Results and Comparison forWinding AC Resistance
The ac resistance of the AHB transformer main powerwindings is measured using the proposed method followingthe key steps outlined in Section III-D. FEA simulation usingthe transient solver is conducted to analyze the correspondingac resistances. In the measurement, as the load resistor, five10% ± 1% Ω metal film resistors are connected in parallel inmeasuring the primary and secondary-II winding resistances,
Fig. 9. Measurement and FEA results for the AHB transformer secondary-IIwinding.
and ten 10% ± 1% Ω metal film resistors are connected inparallel in measuring the secondary-I winding resistances.
Figs. 7–9 illustrate the measured results and FEA simulationresults for the AHB transformer power windings at 400-kHzbipolar PWM current waveforms of different duty ratios, whichcorrespond to different input voltages of the power converter.Winding dc resistances and the ac resistances at the 400-kHzsine waveform are also provided as reference values.
From the above results, we can observe that the measure-ment results and FEA simulation results are very close toeach other. Using the measurement results as reference values,the difference between the measurement and FEA simulationresults is within 8% for all the three AHB transformer powerwindings. The small difference between them is caused by themeasurement and some other factors. First, FEA simulationcannot exactly model the winding structure, even with 3-Dmodeling. The PCB windings also have certain tolerance in thefabrication. The connection lead for the experiment and the viasand pads of the PCB winding are ignored in the simulation.This can explain why the experimental results are larger thanthe FEA simulation results. Secondly, the FEA solver also haserrors in the solutions.
From both the FEA simulation and measurement results, thefollowing conclusions can be made for the transformer windingresistance.
1) The winding equivalent ac resistance under PWM wave-forms is larger than that under the sine waveform of thesame frequency.
2) When the duty ratio D decreases (from 0.5 to 0.1), thewinding ac resistance increases.
It is noted that the copper PCB tracks used in the transformerwinding is 1 oz, or 35 µm thick, which is much smaller than theskin depth of 110 µm at 400 kHz. The winding ac resistancedoes not change significantly under different operating condi-tions because the high-frequency eddy current effects do notaffect the resistance significantly. It can be expected that the acresistance will significantly change for different conditions if athicker copper PCB track (2 or 4 oz) is used as the winding.
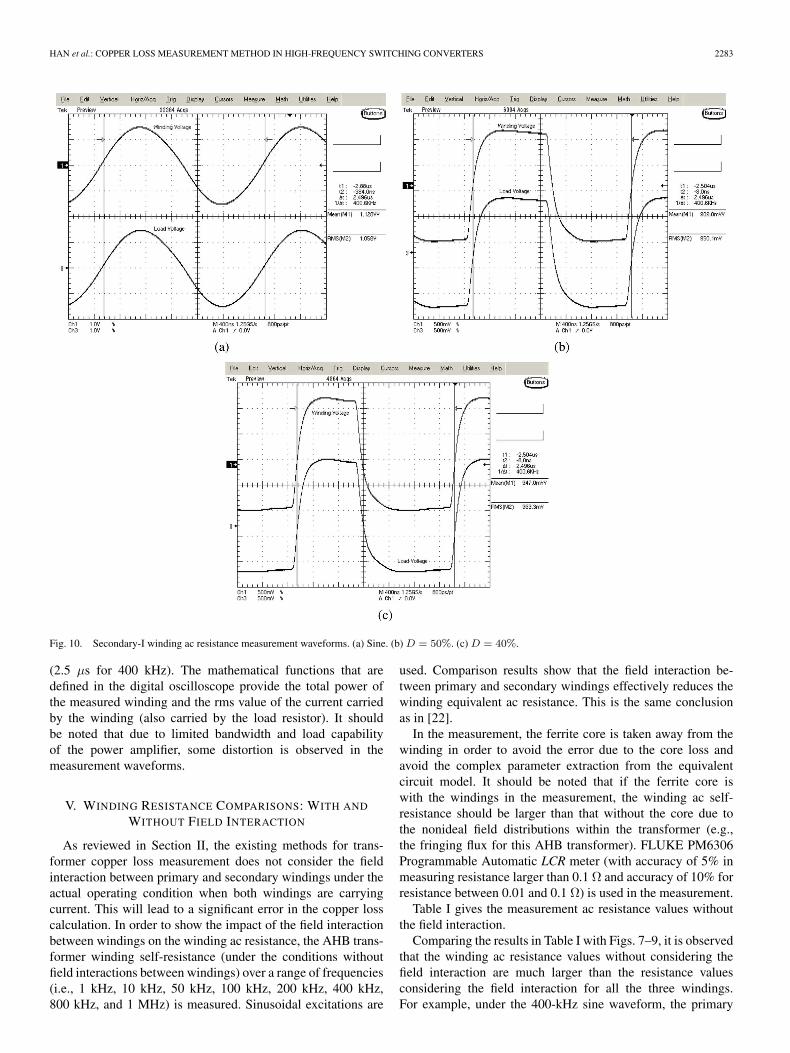
In Fig. 10, the oscillograms (auxiliary winding voltage andload resistor voltage) by the digital oscilloscope under differentoperating conditions in the winding ac resistance measurementare shown for the AHB transformer secondary-I windings. Thetime interval between the two cursors is one switching period
HAN et al.: COPPER LOSS MEASUREMENT METHOD IN HIGH-FREQUENCY SWITCHING CONVERTERS 2283
Fig. 10. Secondary-I winding ac resistance measurement waveforms. (a) Sine. (b) D = 50%. (c) D = 40%.
(2.5 µs for 400 kHz). The mathematical functions that aredefined in the digital oscilloscope provide the total power ofthe measured winding and the rms value of the current carriedby the winding (also carried by the load resistor). It shouldbe noted that due to limited bandwidth and load capabilityof the power amplifier, some distortion is observed in themeasurement waveforms.
V. WINDING RESISTANCE COMPARISONS: WITH AND
WITHOUT FIELD INTERACTION
As reviewed in Section II, the existing methods for trans-former copper loss measurement does not consider the fieldinteraction between primary and secondary windings under theactual operating condition when both windings are carryingcurrent. This will lead to a significant error in the copper losscalculation. In order to show the impact of the field interactionbetween windings on the winding ac resistance, the AHB trans-former winding self-resistance (under the conditions withoutfield interactions between windings) over a range of frequencies(i.e., 1 kHz, 10 kHz, 50 kHz, 100 kHz, 200 kHz, 400 kHz,800 kHz, and 1 MHz) is measured. Sinusoidal excitations are
used. Comparison results show that the field interaction be-tween primary and secondary windings effectively reduces thewinding equivalent ac resistance. This is the same conclusionas in [22].
In the measurement, the ferrite core is taken away from thewinding in order to avoid the error due to the core loss andavoid the complex parameter extraction from the equivalentcircuit model. It should be noted that if the ferrite core iswith the windings in the measurement, the winding ac self-resistance should be larger than that without the core due tothe nonideal field distributions within the transformer (e.g.,the fringing flux for this AHB transformer). FLUKE PM6306Programmable Automatic LCR meter (with accuracy of 5% inmeasuring resistance larger than 0.1 Ω and accuracy of 10% forresistance between 0.01 and 0.1 Ω) is used in the measurement.
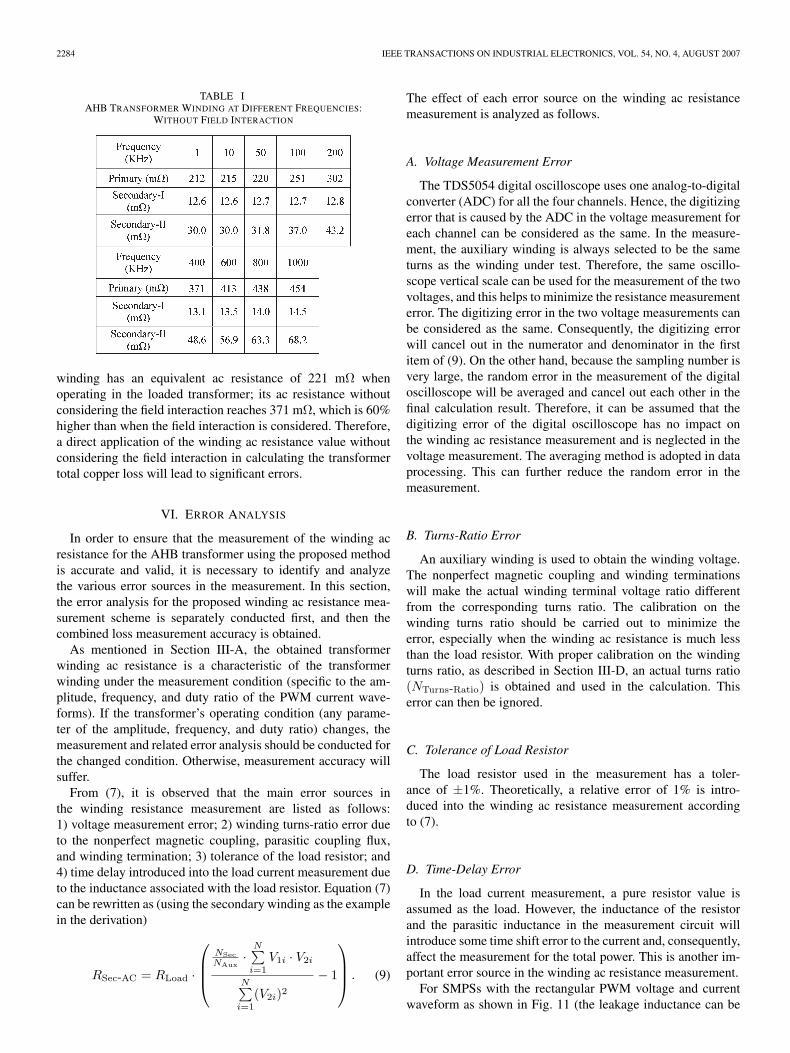
Table I gives the measurement ac resistance values withoutthe field interaction.
Comparing the results in Table I with Figs. 7–9, it is observedthat the winding ac resistance values without considering thefield interaction are much larger than the resistance valuesconsidering the field interaction for all the three windings.For example, under the 400-kHz sine waveform, the primary
2284 IEEE TRANSACTIONS ON INDUSTRIAL ELECTRONICS, VOL. 54, NO. 4, AUGUST 2007
TABLE IAHB TRANSFORMER WINDING AT DIFFERENT FREQUENCIES:
WITHOUT FIELD INTERACTION
winding has an equivalent ac resistance of 221 mΩ whenoperating in the loaded transformer; its ac resistance withoutconsidering the field interaction reaches 371 mΩ, which is 60%higher than when the field interaction is considered. Therefore,a direct application of the winding ac resistance value withoutconsidering the field interaction in calculating the transformertotal copper loss will lead to significant errors.
VI. ERROR ANALYSIS
In order to ensure that the measurement of the winding acresistance for the AHB transformer using the proposed methodis accurate and valid, it is necessary to identify and analyzethe various error sources in the measurement. In this section,the error analysis for the proposed winding ac resistance mea-surement scheme is separately conducted first, and then thecombined loss measurement accuracy is obtained.
As mentioned in Section III-A, the obtained transformerwinding ac resistance is a characteristic of the transformerwinding under the measurement condition (specific to the am-plitude, frequency, and duty ratio of the PWM current wave-forms). If the transformer’s operating condition (any parame-ter of the amplitude, frequency, and duty ratio) changes, themeasurement and related error analysis should be conducted forthe changed condition. Otherwise, measurement accuracy willsuffer.
From (7), it is observed that the main error sources inthe winding resistance measurement are listed as follows:1) voltage measurement error; 2) winding turns-ratio error dueto the nonperfect magnetic coupling, parasitic coupling flux,and winding termination; 3) tolerance of the load resistor; and4) time delay introduced into the load current measurement dueto the inductance associated with the load resistor. Equation (7)can be rewritten as (using the secondary winding as the examplein the derivation)
RSec-AC = RLoad ·
NSecNAux
·N∑
i=1
V1i · V2i
N∑i=1
(V2i)2− 1
. (9)
The effect of each error source on the winding ac resistancemeasurement is analyzed as follows.
A. Voltage Measurement Error
The TDS5054 digital oscilloscope uses one analog-to-digitalconverter (ADC) for all the four channels. Hence, the digitizingerror that is caused by the ADC in the voltage measurement foreach channel can be considered as the same. In the measure-ment, the auxiliary winding is always selected to be the sameturns as the winding under test. Therefore, the same oscillo-scope vertical scale can be used for the measurement of the twovoltages, and this helps to minimize the resistance measurementerror. The digitizing error in the two voltage measurements canbe considered as the same. Consequently, the digitizing errorwill cancel out in the numerator and denominator in the firstitem of (9). On the other hand, because the sampling number isvery large, the random error in the measurement of the digitaloscilloscope will be averaged and cancel out each other in thefinal calculation result. Therefore, it can be assumed that thedigitizing error of the digital oscilloscope has no impact onthe winding ac resistance measurement and is neglected in thevoltage measurement. The averaging method is adopted in dataprocessing. This can further reduce the random error in themeasurement.
B. Turns-Ratio Error
An auxiliary winding is used to obtain the winding voltage.The nonperfect magnetic coupling and winding terminationswill make the actual winding terminal voltage ratio differentfrom the corresponding turns ratio. The calibration on thewinding turns ratio should be carried out to minimize theerror, especially when the winding ac resistance is much lessthan the load resistor. With proper calibration on the windingturns ratio, as described in Section III-D, an actual turns ratio(NTurns-Ratio) is obtained and used in the calculation. Thiserror can then be ignored.
C. Tolerance of Load Resistor
The load resistor used in the measurement has a toler-ance of ±1%. Theoretically, a relative error of 1% is intro-duced into the winding ac resistance measurement accordingto (7).
D. Time-Delay Error
In the load current measurement, a pure resistor value isassumed as the load. However, the inductance of the resistorand the parasitic inductance in the measurement circuit willintroduce some time shift error to the current and, consequently,affect the measurement for the total power. This is another im-portant error source in the winding ac resistance measurement.
For SMPSs with the rectangular PWM voltage and currentwaveform as shown in Fig. 11 (the leakage inductance can be

HAN et al.: COPPER LOSS MEASUREMENT METHOD IN HIGH-FREQUENCY SWITCHING CONVERTERS 2285
Fig. 11. Typical and ideal PWM voltage and current waveform in measuringwinding ac resistance.
neglected for simplification purpose because it is very small),using (9), the winding ac resistance can be calculated as
RSec-AC = RLoad ·(
NTurns-Ratio ·V1
V2− 1)
. (10)
Here,V1 positive part amplitude of the auxiliary winding
voltage waveform;V2 positive part amplitude of the load resistor volt-
age waveform;NTurns-Ratio turns ratio between the auxiliary winding and
the measured winding after calibration.
Due to the parasitic inductance, some time delay δ will beintroduced into the measurement of the load current, whichis obtained by measuring the voltage, as shown in Fig. 12.With this time delay, the winding ac resistance will be (detailedderivation can be found in the Appendix)
RSec-AC=RLoad
[NTurns-Ratio ·
V1
V2
(1− δ
D(1 − D)T
)−1]
.
(11)
Thus, the relative error due to this time delay is calculated as
∆RSec-ACRSec-AC
=δ
D(1−D)T
1 − V2NTurns-Ratio·V1
. (12)
It is related to the time delay, the switching period, the dutyratio of the rectangular PWM waveform, the voltages of thesecondary winding, and the load resistor. If the load resistor ismuch larger than the winding ac resistance, then the ratio ofV2/V1 in (12) will be very close to “1.” In this case, the relativeerror will be very sensitive to the time delay. A large error willbe introduced into the winding ac resistance result. Hence, ifa large load resistor (compared with the measured winding acresistance) is used in the measurement, care should be taken toreduce the time delay caused by the parasitic inductance.
The sources for this time delay δ could be the following:1) poor frequency response of the load resistor; 2) parasiticinductance in the measurement loop; and 3) trigger jitter anddelays for different channels introduced by the oscilloscope.For the digital oscilloscope used in the measurement, the triggerjitter is typical at 8 ps and can be ignored. As the probes for thevoltage measurement are originally from the same oscilloscopeand match to each other, the phase delay between oscilloscopechannels can also be neglected.
Fig. 12. Time delay introduced into the load current measurement.
TABLE IIRELATIVE ERROR IN MEASURING THE AHB TRANSFORMER PRIMARY
WINDING AC RESISTANCE
TABLE IIIRELATIVE ERROR IN MEASURING THE AHB TRANSFORMER
SECONDARY-I WINDING AC RESISTANCE
In the measurement setup of this paper, five 10 ± 1% Ω metalfilm resistors are in parallel and used as the load resistor in theresistance measurement for the AHB transformer primary andsecondary-II windings; ten 10 ± 1% Ω metal film resistors arein parallel and used in the resistance measurement for the AHBtransformer secondary-I winding. The inductance associatedwith the load resistor is the most important source for the time-delay error. In the experiments, care should be taken to reducethese error sources.
From the measurement results by the impedance analyzer, aphase shift of less than 0.01 is observed for the current sensingresistor at 400 kHz, less than 0.02 at 800 kHz, and 0.05 at2 MHz. If we use the phase shift at 400 kHz and transfer it todelay time for 400 kHz, the time error can be calculated as
δ =0.01
360× 2.5 µs = 69.5 ps. (13)
As the relative error depends on several operation parameters,its value will change for different operating conditions of thetransformer. Using the analysis results above, the relative errorsin the AHB transformer winding ac resistance measurement arecalculated and listed in Tables II–IV.
The error introduced by the load resistor tolerance is 1%.In calculating the time-delay error, the results in (10), (12),and (13) are used. For example, calculation of the time delay

2286 IEEE TRANSACTIONS ON INDUSTRIAL ELECTRONICS, VOL. 54, NO. 4, AUGUST 2007
RSec-AC =RLoad ·NSec
NAux· V1
V2· 1T
[DT − δ − δ D
1−D + D2
(1−D)2 (T − δ − DT ) − D1−D δ
D1−D
]− RLoad
=RLoad ·NSec
NAux· V1
V2
[1 − δ
D(1 − D)T
]− RLoad (A1)
TABLE IVRELATIVE ERROR IN MEASURING THE AHB TRANSFORMER
SECONDARY-II WINDING AC RESISTANCE
in secondary-II winding measurement under 0.5 duty ratio in400 kHz (T = 2.5 µs) is done using the following steps.
Step 1) From (13), we have δ = 69.5 ps.Step 2) From (10), we can obtain (NTurns-Ratio · V1)/V2 =
1.0171 (RLoad = 2 Ω and RSec-AC = 34.18 mΩ areused in the calculation).
Step 3) Put these results into (12), the time-delay error iscalculated as
∆RSec-ACRSec-AC
=69.5×10⁻¹²
0.5×0.5×2.5×10−6
1 − 11.0171
= 0.66% < 1%.
(14)This procedure can be applied to other conditions to obtainthe corresponding time-delay error. It is observed that themaximum total relative error is less than 5% for all the threewinding resistance measurements.
VII. CONCLUSION
A new measurement method to characterize the transformercopper loss in high-frequency SMPSs is proposed. The pro-posed measurement method provides an equivalent winding acresistance under the actual operating condition, which takesinto account all the field effects, including the field interactionbetween windings. Therefore, the measurement provides moreaccurate copper loss information. The proposed method is easyto set up, and it can also avoid the difficulty of separating thecore loss from the copper loss.
Measurement results are presented for a planar transformeroperating in a high-frequency PWM dc/dc power converter.Three-dimensional FEA simulation using a time-domain tran-sient solver is used as a comparison. The measured results andsimulated results are very close to each other.
A detailed error analysis is given for the proposed windingac resistance measurement method. The results illustrate thata measurement error of less than 5% can be achieved usingthe proposed method by following the proposed measurement
key steps. It also demonstrates that the proposed schemes canprovide accurate characterization for the transformer copperloss in SMPSs. The proposed method can also help in achievingan optimal design of the high-frequency transformer.
APPENDIX
CALCULATION OF THE WINDING AC RESISTANCE
WITH THE TIME-DELAY ERROR
From (7) and the waveforms shown in Fig. 12, in calcu-lating the winding ac resistance, the switching period can bedivided into four time periods to obtain the total power: [0,∆δ],[∆δ,DT ], [DT,DT + ∆δ], and [DT + ∆δ, T ]. With theparameter in Fig. 12, we can derive the winding ac resistanceas in (A1) (using secondary winding as the example), shown atthe top of the page, where
NSec, NAux turns of the secondary and the auxiliarywindings;
V1, V2 amplitudes of the positive part of the auxiliarywinding voltage and load resistor voltage;
D duty ratio;T switching period;δ time delay between the two measured
voltages;RLoad load resistor.
REFERENCES
[1] F. K. Wong, “High frequency transformer for switching mode power sup-plies,” Ph.D. dissertation, Griffith Univ., Brisbane, Australia, Mar. 2004.
[2] N. Dai, “Modeling, analysis, and design of high-frequency, high-density,low-profile transformers,” Ph.D. dissertation, VPI&SU, Blacksburg, VA,1996.
[3] D. van der Linde et al., “Design of a high-frequency planar power trans-former in multilayer technology,” IEEE Trans. Ind. Electron., vol. 38,no. 2, pp. 135–141, Apr. 1991.
[4] X. Huang, K. D. T. Ngo, and G. E. Bloom, “Design techniques for planarwindings with low resistances,” in Proc. IEEE Appl. Power Electron.Conf. and Expo., 1995, pp. 533–539.
[5] R. Prieto, O. Garcia, R. Asensi, J. A. Cobos, and J. Uceda, “Optimizingthe performance of planar transformers,” in Proc. Appl. Power Electron.Conf. and Expo., Mar. 1996, vol. 1, pp. 415–421.
[6] F. D. Tan, J. L. Vollin, and S. M. Cuk, “A practical approach for magneticcore-loss characterization,” IEEE Trans. Power Electron., vol. 10, no. 2,pp. 124–129, Mar. 1995.
[7] A. Brockmeyer, “Experimental evaluation of the influence of DC-premagnetization on the properties of the power electronic ferrites,” inProc. IEEE APEC, 1996, pp. 454–460.
[8] M. Albach, T. Durbaum, and A. Brockmeyer, “Calculating core loss intransformers for arbitrary magnetizing currents: A comparison of differentapproaches,” in Proc. IEEE PESC, 1996, pp. 1463–1468.

HAN et al.: COPPER LOSS MEASUREMENT METHOD IN HIGH-FREQUENCY SWITCHING CONVERTERS 2287
[9] J. Li, T. Abdallah, and C. R. Sullivan, “Improved calculation of coreloss with nonsinusoidal waveforms,” in Proc. IEEE Ind. Appl. Soc. Annu.Meeting, 2001, pp. 2203–2210.
[10] P. S. Venkatraman, “Winding Eddy current losses in switching modepower transformers due to rectangular wave currents,” in Proc.POWERCON 11, Apr. 1984, pp. 1–11. A-1.
[11] A. M. Urling, V. A. Niemela, G. R. Skutt, and T. G. Wilson, “Character-izing high-frequency effects in transformer windings—A guide to severalsignificant articles,” in Proc. APEC, Mar. 1989, pp. 373–385.
[12] J. A. Ferreira, “Improved analytical modeling of conductive losses inmagnetic components,” IEEE Trans. Power Electron., vol. 9, no. 1,pp. 127–131, Jan. 1994.
[13] C. R. Sullivan, “Optimal choice for number of strands in a litz-wiretransformer winding,” IEEE Trans. Power Electron., vol. 14, no. 2,pp. 283–291, Mar. 1999.
[14] J. G. Breslin and W. G. Hurley, “Derivation of optimum winding thicknessfor duty cycle modulated current waveshapes,” in Proc. 28th Annu. IEEEPower Electron. Spec. Conf., 1997, vol. 1, pp. 655–661.
[15] P. L. Dowell, “Effect of eddy currents in transformer windings,” Proc.Inst. Electr. Eng., vol. 113, no. 8, pp. 1387–1394, Aug. 1966.
[16] K. D. T. Ngo and M. H. Kuo, “Effects of air gaps on winding loss in high-frequency planar magnetics,” in Proc. Power Electron. Spec. Conf., 1988,vol. 2, pp. 1112–1119.
[17] R. Severns, “Additional losses in high frequency magnetics due to nonideal field distributions,” in Proc. IEEE APEC, 1992, pp. 333–338.
[18] W. Chen, J. He, H. Luo, Y. Hu, and C.-C. Wen, “Winding loss analysis andnew air-gap arrangement for high-frequency inductors,” in Proc. IEEEPower Electron. Spec. Conf., Jun. 2001, vol. 4, pp. 2084–2089.
[19] K. W. Cheng, Y. Q. Hu, D. H. He, and W. K. Mo, “Effect of geometricalfactors on copper loss in high-frequency low-profile transformers,” inProc. IEEE 31st IAS Annu. Meeting Conf., 1996, vol. 3, pp. 1397–1404.
[20] D. K. Conory, G. F. Pierce, and P. R. Troyk, “Measurement techniques forthe design of high frequency SMPS transformers,” in Proc. IEEE APEC,1988, pp. 341–353.
[21] C. R. Sullivan, “Computationally efficient winding loss calculation withmultiple windings, arbitrary waveforms, and two-dimensional or three-dimensional field geometry,” IEEE Trans. Power Electron., vol. 16, no. 1,pp. 142–150, Jan. 2001.
[22] J. H. Spreen, “Electrical terminal representation of conductor loss intransformers,” IEEE Trans. Power Electron., vol. 5, no. 4, pp. 424–429,Oct. 1990.
[23] G.-B. Koo, G.-W. Moon, and M.-J. Youn, “New zero-voltage-switchingphase-shift full-bridge converter with low conduction losses,” IEEETrans. Ind. Electron., vol. 52, no. 1, pp. 228–235, Feb. 2005.
[24] L.-P. Wong, D. K.-W. Cheng, M. H. L. Chow, and Y.-S. Lee, “Interleavedthree-phase forward converter using integrated transformer,” IEEE Trans.Ind. Electron., vol. 52, no. 5, pp. 1246–1260, Oct. 2005.
[25] B. Choi, W. Lim, S. Bang, and S. Choi, “Small-signal analysis and controldesign of asymmetrical half-bridge DC–DC converters,” IEEE Trans. Ind.Electron., vol. 53, no. 2, pp. 511–520, Apr. 2006.
[26] A. I. Maswood and Z. K. Yoong, “Design aspects of a switch-mode trans-former under wide input voltage variation,” IEEE Trans. Ind. Electron.,vol. 53, no. 3, pp. 752–758, Jun. 2006.
[27] J.-J. Lee and B.-H. Kwon, “DC–DC converter using a multiple-coupledinductor for low output voltages,” IEEE Trans. Ind. Electron., vol. 54,no. 1, pp. 467–478, Feb. 2006.
[28] Maxwell 2D & 3D User’s Guide, ANSOFT Corp., Pittsburgh, PA, 2002.[29] W. Eberle and Y.-F. Liu, “A zero voltage switching asymmetrical half-
bridge DC/DC converter with unbalanced secondary windings for im-proved bandwidth,” in Proc. IEEE PESC, 2002, pp. 1829–1834.
Yongtao Han (S’01) received the bachelor’sand master’s degrees in electrical engineering fromTianjin University, Tianjin, China, in 1993 and1996, respectively, and the M.Sc. degree in elec-trical engineering, majoring in power electronics,from Queen’s University at Kingston, Kingston, ON,Canada, in December 2003.
After graduation, he became an Electrical Engi-neer, working in the area of industrial control sys-tems and instruments. In May 2001, he joined theQueen’s Power Group, Queen’s University. He is
currently with Jabil Circuit Inc., Shanghai, China, as an Electronics Engineer.His research interests include high-frequency magnetics and dc/dc and ac/dcswitching power supplies.
Wilson Eberle (SM’98) was born in Windsor, ON,Canada. He received the B.Sc. and M.Sc. degreesfrom Queen’s University at Kingston, Kingston, ON,in 2000 and 2003, respectively. He is currentlyworking toward the Ph.D. degree at the Departmentof Electrical and Computer Engineering, Queen’sUniversity at Kingston, under the supervision ofDr. Y.-F. Liu and Dr. P. C. Sen.
From 1997 to 1999, he was an Engineering Co-OpStudent at Ford Motor Company, Windsor, ON, forthree summers. He has one U.S. patent pending and
is the author of 12 technical papers published in conference proceedingsand IEEE journals. His research interests include high-efficiency high-power-density low-power dc/dc converters, digital control techniques for dc/dc con-verters, EMI filter design for switching converters, and resonant gate drivetechniques for dc/dc converters.
Mr. Eberle is a recipient of the Ontario Graduate Scholarship and hasreceived awards through the Power Source Manufacturer’s Association andOntario Centres of Excellence to present papers at conferences.
Yan-Fei Liu (S’91–M’94–SM’97) received theB.Sc. and M.Sc. degrees from Zhejiang University,Hangzhou, China, in 1984 and 1987, respectively,and the Ph.D. degree from Queen’s University atKingston, Kingston, ON, Canada, in 1994.
Since August 1999, he has been with the De-partment of Electrical and Computer Engineering,Queen’s University, as an Associate Professor. Priorto this, from February 1994 to July 1999, he was aTechnical Advisor at the Advanced Power SystemDivision, Astec (formerly Nortel Networks), where
he was responsible for high-quality design, new products, and technology de-velopment. His research interests include digital control technologies for dc/dcswitching converter and ac/dc converter with power factor correction, EMI filterdesign methodologies for switching converters, topologies and controls for highswitching frequency, low switching loss converters, modeling and analysis ofcore loss and copper loss for high-frequency planar magnetics, topologies andcontrol for VRM, and large-signal modeling of switching converters.
Dr. Liu received the Golden Apple Teaching Award and Premiere’s ResearchExcellent Award from Queen’s University in 2000 and 2001, respectively.He is also the recipient of the “1997 Award in Excellence in Technology”from Nortel.