A POLICY 17 - NCAP · NNMB National Nutrition Monitoring Bureau ... Features of Integrated Child...
117
17 Agricultural-based Interventions for Sustainable Nutritional Security Agricultural-based Interventions for Sustainable Nutritional Security POLICY PAPER P Adhiguru C Ramasamy NATIONAL CENTRE FOR AGRICULTURAL ECONOMICS AND POLICY RESEARCH NEW DELHI, INDIA TAMIL NADU AGRICULTURAL UNIVERSITY COIMBATORE INDIA Hkk vuqi ICAR Hkk vuqi ICAR
Transcript of A POLICY 17 - NCAP · NNMB National Nutrition Monitoring Bureau ... Features of Integrated Child...

jk"Vªh; d`f"k vkfFkZdh ,oa uhfr vuqla/kku dsUnz
NATIONAL CENTRE FOR AGRICULTURAL ECONOMICS AND POLICY RESEARCH(Indian Council of Agricultural Research)
POST BOX No. 11305, LIBRARY AVENUE, PUSA, NEW DELHI-110012.Phone : 91-11-25713628, 25819731 Fax : 91-11-25822684 E-mail : [email protected]
http: // www.nic.in/icar/ncap/index.htm
17
Agricultural-based Interventions for
Sustainable Nutritional Security
Agricultural-based Interventions for
Sustainable Nutritional Security
POLICY
PAPER
P Adhiguru
C Ramasamy
NATIONAL CENTRE FOR
AGRICULTURAL ECONOMICS
AND POLICY RESEARCH
NEW DELHI, INDIA
TAMIL NADU
AGRICULTURAL UNIVERSITY
COIMBATORE
INDIA
It is a good piece for publication.
V.Rajagopalan, ChairmanCenter for Development and Policy Studies, Thanjavur and
Former Vice chancellor, Tamil Nadu Agricultural University, Coimbatore
This is a very good paper and brings out fact-based evidence and suggestions for achieving an important objective of sustainable nutritional security.
S.S.Acharya, DirectorInstitute of Development Studies, Jaipur
This manuscript if introduced in a book form will serve as a tool for the policy planners.
A.Susheela Thirumaran, Vice ChancellorThiruvalluvar University. Vellore
Ag
ricu
ltura
l-ba
se
d In
terv
en
tion
s fo
r Su
sta
ina
ble
Nu
trition
al S
ec
urity
NC
AP
PO
LIC
Y P
AP
ER
17
HkkÏvuqiICAR
HkkÏvuqiICAR
NCAP Publication Committee
P K JoshiS SelvarajanRamesh ChandB C BarahSuresh PalP Adhiguru
NCAP has been established by the Indian Council of AgriculturalResearch (ICAR) with a view to upgrading agricultural economicsresearch through integration of economic input in planning, designing,and evaluation of agricultural research programmes and strengtheningthe competence in agricultural policy analysis within the Council. TheCentre is assigned a leadership role in this area not only for variousICAR Institutes but also for the State Agricultural Universities. With aveiw to making agricultural research a more effective instrument foragricultural and rural change and strengthening the policy making andplanning machinery, the Centre undertakes and sponsors research inagricultural economics relating to the problems of regional and nationalimportance.

Agricultural-based Interventions forSustainable Nutritional Security
P AdhiguruC Ramasamy
NATIONALCENTRE FORAGRICULTURAL ECONOMICS ANDPOLICY RESEARCH\NEW DELHI, INDIA
TAMIL NADUAGRICULTURALUNIVERSITYCOIMBATOREINDIA
Policy Paper 17

Policy Paper 17
Agricultural-based Interventions for Sustainable Nutritional Security
PublishedMarch 2003
Published byDr MruthyunjayaDirector, NCAP
Printed atChandu PressD-97, ShakarpurDelhi - 110 092
Authors
P Adhiguru is Scientist (Senior Scale), National Centre for AgriculturalEconomics and Policy Research, New Delhi-110 012, India.
C Ramasamy is Vice-Chancellor, Tamil Nadu Agricultural University,Coimbatore-641 003, India.
Acronyms and Abbreviations ii
Tables iii
Figures iv
Annexures v
Foreword vii
Acknowledgements viii
Executive Summary ix
1. Introduction 1
2. Review of past studies 6
3. Methodology 14
4. Food and nutrients consumption 25
5. Determinants of consumption of food and nutrients 32
6. Consumption expenditure behavior 40
7. Institutional linkages among agriculture, healthand nutrition departments 52
8. Conclusions and implications 57
References 77
Annexures 84
CONTENTS
i

ii
ACRONYMS AND ABBREVIATIONS
ABS Average Budget ShareACC Administrative Committee on CoordinationAMT Anna Marumalartchi ThittamANC Anti-natal ClinicAWW Anganwadi WorkersBDO Block Development OfficerBLP Block Level PlanningFAO Food and Agriculture OrganizationGLVs Green Leafy VegetablesGoI Government of IndiaIAY Indira Awaas YojanaICDP Integrated Cereal Development ProgramICDS Integrated Child Development ServiceICRW Integrated Center for Research on WomenIDD Iodine Deficiency DisordersIFPRI International Food Policy Research InstituteIRDP Integrated Rural Development ProgramJGSY Jawhar Grama Sabha YojanaKVK Krishi Vigyan KendraMBS Marginal Budget ShareMSSRF M S Swaminathan Research FoundationNAAS National Academy of Agricultural SciencesNATP National Agricultural Technology ProjectNGOs Non-Government OrganizationsNNMB National Nutrition Monitoring BureauNPDP National Pulse Development ProgramPCM Protein Calorie MalnutritionPDS Public Distribution SystemPEM Protein Energy MalnutritionPNC Post-natal ClinicRDA Recommended Dietary AllowanceSAARC South Asian Association for Regional CooperationSAU State Agricultural UniversitySCN Sub Committee on NutritionSGY Swarna Jayanthi Yojana SchemeSHG Self Help GroupTANWA Tamil Nadu Women in AgricultureTINP Tamil Nadu Integrated Nutrition ProjectVHN Village Health NurseWFP World Food ProgramWHO World Health Organization

TABLES
Table 1 Recommended dietary allowances (food groups)for adults and children 19
Table 2 Recommended dietary allowances (nutrients)for adults and children 20
Table 3 Independent variables included in the regressionanalysis for per capita intake 21
Table 4 Independent variables included in the regressionsfor expenditure share 24
Table 5 Adults’ food and nutrients intake by agriculturalproduction systems 26
Table 6 Children’s food and nutrients intake by agriculturalproduction systems 28
Table 7 Intra-household allocation of nutrients in rice system 30
Table 8 Intra-household allocation of nutrients in vegetablesystem 30
Table 9 Intra-household allocations of nutrients in sugarcanesystem 31
Table 10 Versions of regression tried 33
Table 11 Factors influencing per capita consumption ofprotein and energy in different production systems 34
Table 12 Frequency of consumption of GLVs, vegetables and fruits 37
Table 13 Expenditure behavior for foods and non-foods ofthe average household in different production systems 42
Table 14 Effect of household characteristics on average budgetshares for selected commodity in rice system 46
Table 15 Effect of household characteristics on averagebudget shares for selected commodity in vegetableproduction system 48
Table 16 Effect of household characteristics on averagebudget shares for selected commodity in sugarcaneproduction system 50
Table 17 Interdepartmental joint activities for improvingnutritional security 63
Table 18 Interdepartmental linkages and co-ordination model 73
iii

FIGURES
Figure 1. Map of the study area 15
Figure 2. Sampling design of the study 17
Figure 3. Nutritional knowledge of women 38
Figure 4. Kind wages in different production systems 39
Figure 5. Share of food and non-food expenditure 40
Figure 6. Institutional linkages for sustainable nutritional security 62
iv

ANNEXURES
Annexure 1. Calorie intake in different states of India 84
Annexure 2. Deficient calorie intake (per cu/day) 85
Annexure 3. Protein calorie inadequacy (percentage ofpopulation with protein and/ or calorie deficiency) 86
Annexure 4. Percentage of population with vitamin A deficiency 87
Annexure 5. Profile of Dharmapuri District 88
Annexure 6. Land-use pattern of study area 89
Annexure 7. Particulars of Integrated Child DevelopmentService (ICDS) Scheme for Dharmapuri district 89
Annexure 8. Nutritional status of children in Dharmapuri district 90
Annexure 9. Supplementary nutrition details of beneficiaries 90
Annexure 10. Number of Anganwadi workers and beneficiaries 90
Annexure 11. Demography of selected sample villages 91
Annexure 12. Departmental visits for collecting secondaryinformation 91
Annexure 13. Activities of Primary Health Center 92
Annexure 14. Features of Integrated Child DevelopmentService (ICDS) Scheme 92
Annexure 15. Services of Health sub-centre 93
Annexure 16. Schemes of Horticulture department 94
Annexure 17. Schemes of Department of Agriculture 96
Annexure 18. Schemes of Block Development Office 97
v


In spite of various nutrition intervention programs being operational in India,it still accounts for 40 per cent of the world’s malnourished children andabout 60 per cent of Indian women are anemic. It has been realized thatagricultural interventions are more beneficial and sustainable in addressingmalnutrition among the rural poor than the direct nutritional interventionprograms.
Incorporating nutritional objectives in agriculture will be a win-win situationwith the poverty alleviation, income growth, nutritional security and ultimatelyachieving goals of India’s agricultural development. In this context, thisstudy has thrown light on the issue of agricultural production systems viz.rice, vegetable, and sugarcane influence on nutritional security of ruralhouseholds in those systems. The study also gives a view about scope forinter-institutional linkages among developmental departments to promotenutritional security.
The study depicts the potential of vegetable systems to supply healthy foodespecially rich in vitamins and micronutrients to the weaker sections of thesociety and expose the weaknesses of non-vegetable production systems.Agricultural- based kind wages and woman income management in thehouseholds seems to be favorable for enhanced household nutritionalsecurity. Location specific agriculture-based interventions would benecessary to safe guard regional nutritional security balance. The existingweaknesses in institutional linkages amongst development departmentssuggest immediate reorientation in their approach. The study underlinesthe need for redefining of agricultural extension to address nutritional securityconcerns.
We hope that this study linking agriculture and nutrition shall further strengthenthe institutional linkages among concerned department as well as guidesfuture policies and planning in the India’s sustainable food and nutritionalsecurity.
MruthyunjayaDirector
FOREWORD
vii

Authors are thankful to Dr Mruthyunjaya, Director, National Centre forAgricultural Economics and Policy Research (NCAP), New Delhi for hisencouragement, constant guidance and for sparing his valuable time forgoing through this policy paper several times and offering critical commentsto improve the quality of contents and presentation. Prof Dayanatha Jha,National Professor, NCAP has provided immense guidance in conceivingand guiding the study. Dr G Gopalan, Director, Nutrition Foundation ofIndia, New Delhi, and Dr Suresh Babu, International Food Policy ResearchInstitute, Washington, provided valuable inputs in designing the study onlinking Agriculture and Nutrition.
Dr P K Joshi’s generous help in providing institutional support forimplementation of the project at field level and for data processing deservesa greater appreciation from the authors. Many thanks to Dr M S Bamji,Emeritus Medical Scientist, Dangoria Charitable Trust, Hyderabad,Dr K Vijayaragavan, National Institute of Nutrition, Hyderabad, Dr Nina Dodd,Consultant, CARE-INDIA and Dr G N V Ramana, World Bank, Delhi office,who provided suggestions in devising the methodology appropriate for thisstudy.
The authors are grateful to the external referees, Dr V Rajagopalan,Chairman, Center for Development and Policy Studies, Dr S S Acharya,Director, Institute of Development Studies, and Dr A Susheela Thirumaran,Vice Chancellor, Thiruvalluvar University, Tamil Nadu. Dr Ramesh Chand,Professor and Head, Institute of Economic Growth, New Delhi andDr P S Birthal have offered critical comments in preparing project proposaland survey instruments and we are grateful to them. Thanks to Ms K Uma,Assistant Professor, Tamil Nadu Agricultural University, Coimbatore, for herhelp in data analysis related to budget share equations. Thanks are alsodue to Mr Ramesh Kolluru, Technical Investigator and Ms S Vimala Devi forproviding computational assistance and suggestions. We are thankful toDr B S Agarwal, the Language editor for his meticulous editing.
Authors
ACKNOWLEDGEMENTS
viii

EXECUTIVE SUMMARY
Agricultural interventions are more sustainable in addressing malnutritionamong the rural poor than the direct nutritional intervention programs, whichmay not be cost-effective in the long run. To examine this issue, a study wastaken up covering rural households in the rice, vegetable and sugarcaneproduction areas (systems). The rural households comprised small andmarginal farmers and agricultural laborers in Dharmapuri district in TamilNadu. The scope for inter-institutional linkages among developmentaldepartments to promote nutritional security was also explored.
One village representing each production system was selected for collectingprimary data. Sixty households per production system have been selected.Data on socio-economic factors of household members and their dietaryintake were collected. The secondary data were collected by interactingwith various development departments from village level to state level. Thesurvey was conducted during the year 2000-01.
The study has indicated that, among the food groups, the deficit (shortageof RDA in %) is more pronounced in the case of fruits and green leafyvegetables for both males and females, and was least in pulses and cereals.Among the these production systems, the extent of deficit was comparativelylower in the vegetable production system. Gender wise, the adult femaleshave higher deficit than adult males.
The maternal beliefs about some food items being bad to children, haveadversely affected the nutrients intake. For instance, the intake of ‘Agathi’(Sesbania grandiflora) was lower though it is highly rich in calcium. Theintake of pulses, green leafy vegetables and vegetables by children hasbeen found to be comparatively higher in the vegetable production system.There was also significant deficiency in respect of consumption of fruits,milk, fats and oils in children of all age groups, particularly, in the food-grain-based and cash-crop based production systems.
The deficit in the consumption of vitamin A, iron and vitamin C has beenfound to be significantly low in the vegetable system as compared to in foodand cash crop-based production systems for both men and women. Theinfluence of production systems on nutrient intake among children hasrevealed in the same pattern as that of adults
ix

These results depict the potential of vegetable system to supply healthyfood to the weaker sections of society and expose the weaknesses of non-vegetable production system. Therefore, location-specific horticulturalinterventions are necessary to ensure nutritional security in differentproduction systems.
The intra-household allocation analysis has revealed that female individualshave higher deficit of vitamin A and iron than the average household deficitdue to unawareness about the physiological requirements. However, noconscious gender discrimination in food intake has been noticed.
Regression analysis has shown that, Public Distribution System (PDS) doesserve the cause of nutritional security, especially in the rice system withintake of wheat supplying more protein. Region-specific PDS would helpbalanced dietary intake. The presence of children in a household influencesprotein and energy intake. Hence, the number of children per householdshould be considered as one of the indicators for identification of ‘at-risk’households. Nutrition knowledge has positively influenced the per capitaprotein and energy intake in the sugarcane system. It has been found thatcash flow without sufficient nutritional knowledge would not automaticallylead to a balanced food intake. Hence, nutrition education is more crucial innon-vegetable producing farming systems.
The frequency of consumption of leafy and other vegetables and indigenouscrops has been higher in the vegetable system. Kind wages positivelyinfluence nutrient intake of the agricultural laborers in the vegetablesystem. Share of food expenditure has been found comparatively lowerin the vegetable production system. In the rice and sugarcane systems,the expenditure share of rice has been found higher, whereas, the shareof fruits and vegetables is comparatively lower. In the vegetable system,the food expenditure share has been found well distributed. Well thoughtof agricultural, and nutrition and educational intervention, programsand market interventions can minimize this disparity across productionsystems.
In the non-vegetable growing farming systems, the incremental income hasbeen observed to promote purchase of milk and milk products by thehouseholds. Interestingly, in the vegetable system, the income increaseleads to change in food intake from finger millet to rice due to perception thatformer is inferior. So, agriculture and nutrition departments can take up jointcampaign for promoting consumption of millets. Among non-food
x

expenditure, health expenditure has been observed to be the highest in thesugarcane system as compared to other systems. Therefore, specialagricultural interventions for greater access to fruits and vegetables areessential.
In the rice system, in households with higher income and large land holdingsize, there has been reduction in the consumption of rice, but increase in theconsumption of vegetables and oils. Hence, marginal farmers and agriculturallaborers can be assisted for establishing nutrition gardens and cultivation ofvegetables in smaller plots of their own land. It has been found that formaleducation influences the consumption of finger millet. Therefore, nutritioneducation is as important as formal education. “Number of children” hasemerged as an important factor influencing intra household food intake.Homestead gardens have greatly contributed to an increased intake of fruitsand vegetables. Earning members positively influenced the intake of pulsessuggesting that the increased income flow or direct access to pulses as kindwages contribute to more protein intake.
In this study, programs of various development departments have beenexamined to assess the linkages in promoting nutritional security. There issome co-operation between Health Department and Integrated ChildDevelopment Service (ICDS) in identifying the ‘at-risk’ households. Theyprovide mainly direct feeding and pharmaceutical assistance. Their linkagewith agriculture and allied departments has been found to be negligible.Health and nutrition agencies can share the data on nutritional status andthe list of ‘at-risk’ households with other development departments. Theagricultural regional research stations of State Agricultural Universities, IndianCouncil of Agricultural Research, Krishi Vigyan Kendras (KVKs) etc., canplay a greater role in developing regional nutritional security plans andstrategies in co-ordination with district level line departments. Joint actioncan be taken up in the area of nutrition gardening, identification of indigenousmicronutrient-rich fruits and vegetables, developing varieties high inmicronutrients, especially iron and vitamin A, and designing innovativecropping patterns etc.
Small and marginal farmers and agricultural laborers have greatly beenbenefited from the dairy and poultry enterprises as an alternative source ofincome. Hence, Animal Husbandry Department needs to strengthen the co-ordination with other line departments in implementing schemes that promoteintegrated farming systems.
xi

Panchayati Unions and Village Panchayats, which are implementing top-to-down schemes, should be innovative in coordinating with other developmentagencies in redesigning and implementing the schemes based on localneeds for achieving nutritional security of the poor households.
State Agricultural Universities, Home Science colleges, nutrition agencies,and KVKs can take up joint training programs for nutrition and extensionofficials/workers in the management of nutritional gardens. The role ofextension functionaries needs to be reoriented because, at present, it ismostly concerned with the distribution of subsidized inputs. Therefore, trainingprograms can be organized to sensitize them regarding nutritional issues ofvulnerable sections of the society and the nutritive value of crops.
At present people are passive receivers of governmental nutritionalprogrammes. Therefore, the development departments jointly can help informing Self-Help Groups (SHGs) from out of the ‘at-risk’ households. Trainingprograms can also be organized for these SHGs in the areas of financialmanagement, knowledge sharing, establishing grain bank, etc.
Horticulture Departments can promote village co-operatives with socialmarketing concept for sale of fruits and vegetables especially in the non-vegetable farming areas. Such a strategy would improve nutritionalknowledge as well as nutrient intake.
The discussions with the nutrition department reveal that the quality andthe quantity of supplementary feeding is one of the main concerns inimplementing the schemes like ICDS. The development departments andFood Science and Nutrition Departments of State Agricultural Universitiescan jointly assist in the formation of community level agro-based small scaleprocessing units which can produce dehydrated leaf powder of nutrient richspinach, drumstick, agathi, spirulina, etc.
Interdepartmental co-ordination committees may be constituted at variouslevels for periodic monitoring and evaluation and to evolve dynamic policyalternatives from time to time. Coordinated efforts among developmentdepartments may be difficult but are must. A strong political will and blessingsof the top management is essential to implement these policies and strategiesto ultimately reach the goal of sustainable nutritional security.
xii

1
1. INTRODUCTION
1.1. The Background
India has made significant progress in food production, disease control, andeconomic and social development since independence. Notwithstandingthe progress made, it still accounts for 40 per cent of the world’s malnourishedchildren and about 60 per cent of Indian women are anemic (World Bank,1998). Infections and lifestyle factors probably often combine with inadequateor imbalances in food intake resulting in conditions that lead to malnutrition.
The Government of India has formulated appropriate policies and launchedmajor programs to address the problem of malnutrition. India’s NationalNutritional Policy (GOI, 1993) stresses upon the importance of direct nutritioninterventions for vulnerable groups, including the expansion of IntegratedChild Development Service (ICDS), nutrition and health education programsfor adolescent girls, better care of pregnant women, and control ofmicronutrient deficiencies. However, these nutritional intervention programsinvolve huge expenditures. To address this issue, World Bank assistance toIndia over the past 18 years, has amounted to $753 million, equivalent tomore than one- quarter of its assistance to nutrition world-wide. Within India,the World Bank assistance to the Central Government for ICDS has doubled,from about 15 to 30 per cent between 1991 and 1998. For the year 1997-98,the Central Government expenditure on ICDS was to the tune of Rs.608.85crore, covering about 2.39 crore beneficiaries. On an average, the costincurred by the Central Government in providing nutritional intervention perbeneficiary amounts to Rs.254.80 per annum. In addition, the stategovernments bear the cost of supplementary nutrition component.
However, these policies and programs had shown only a limited impact onnutrition among the poor, because of the problems involved in effectivetargeting, coverage and implementation (World Bank, 1998). The WorldBank report also states that, in general, the quality of ICDS services is poor.Although these services are much in demand, they are generally poorlycoordinated and delivered. The World Bank has suggested freezing of furtherexpansion until quality and impact are considerably improved. Thus, thereis a real difficulty in expanding the direct food feeding intervention programswith particular reference to quality. According to the World Bank, long-terminstitutional and structural changes in the relevant sectors can play a majorrole in improving nutritional security in India. Sustaining short-term measures

2
would not be cost-effective in the long run. Agriculture development overthe years has been able to provide food security, in general. In spite of thisdevelopment, that the malnutrition continues to be major problem particularlyamong vulnerable sections of population. Therefore, incorporating nutritionalobjectives in the agricultural policy and programs must be a strategy tosolve the nutritional problems of the food-insecured households.
The workshop of South Asian Association for Regional Co-operation(SAARC) on food-based interventions has emphasized strong initiatives toimplement the food-based nutrition improvement programs. It has suggesteddeveloping the intervention as an integral part of national development plans,with holistic approach (Hussain 1998). Therefore, it is imperative toincorporate nutritional objectives in our agricultural policies/ programs.
Under these circumstances, agricultural programs must include long-termmeasures in promoting nutritional security. National Nutrition Policy (1993)had echoed that Agricultural Policy had been hitherto concerned exclusivelywith production, exclusively ignoring nutrition. During the process of evolutionof ‘green revolution’ technologies, we missed the desired focus on nutritionparticularly for the poor.
India faces the formidable task of feeding a population of a billion plus. It hasover two-thirds of its national workforce directly or indirectly dependent onagriculture. Increased food grain production through adoption of the greenrevolution technologies has been the cornerstone of India’s agriculturalsuccess. Effective development programs for milk, oilseeds, poultry, fishand horticultural produce have followed the suit. Food grain production hasrisen from 51 million tons in 1950-51 to 208.5 million tons in 2001-02. India’sNinth Five-Year Plan estimated that about 230 million tons would be neededby 2020 (NATP Main Document 1998). One of the reasons for continuedhigh malnutrition, could be the production pattern itself. The Green Revolutionhas largely remained a cereal revolution, with bias towards wheat and rice.Coarse grains and pulses, which supply the poor man’s staple and proteinrequirements, have not been given adequate attention. Impressive increasein cereal production led by wheat and rice with declining trend in thepercentage share of coarse grains and pulses is witnessed during past fewdecades. Per capita net availability of foodgrains moved narrowly between150 and 175 kg per year. The present per capita net availability of foodgrains is lower by about 24 per cent, as compared to the recommendedminimum per capita dietary norms by Indian Council of Medical Research(Selvarajan and Ravishankar 1996). Thus, if one looks at it from nutritionalsecurity angle, there is a need for promoting a balanced food production.

3
For instance, the production levels of pulses and green leafy vegetablesneed to be improved. The intake of green leafy vegetables in poor householdsis low, and one of the important reasons for is that they are not always withintheir reach, physically and economically. In India, once the third largestproducer of horticultural products in the world, the per capita daily availabilityof fruits and vegetables (60g and 75g, respectively) is short of this minimumrequirement (estimated at 85 and 280g, respectively (Gopalan 1996, NNMB1997). There is thus an urgent need for concerted efforts towardsaugmentation of production of vegetables and fruits in India.
Although nutritional goals are often implicit, the explicit goals of externallyinduced changes in the agricultural sector are more likely to be enhancedproduction, higher income and more foreign exchange earnings. This focusraises three questions of relevance for nutrition. First, would better nutritionaleffects result from changes in the agricultural policy, if nutritional goals weremade explicit? Second, are explicit nutritional goals compatible with thegoals more commonly pursued? And third, what is the trade off between thetwo sets of goals? In other words, need we worry today about the opportunitieslost for not planning good nutrition because nutrition goals were not madeexplicit at the time of designing and implementing changes in the agriculturalsector? Or can the usual goals of agricultural change be expected to fulfilnutritional objectives? (Mebrahtu, Pelletier and Pinstrup-Andersen 1995).
There is, thus a need for close examination of the role of agriculturalintervention in nutritional security. The macro-level analysis of food productionand its per capita availability would not indicate the household food securityand nutritional security, particularly for the households at risk. The macro-policies on cropping pattern and food production focus much on increasingthe food production the national levels. There is a possibility that cash cropsmay provide economic benefit to the farmers and may bring foreign exchangein the country also. But, the small and marginal farmers are not likely tospend this additional income on food items. Moreover, the landless laborerswhen work in food crops, they have a chance of getting some farm produceto take home for consumption. But in the case of production of cash cropsthis may not happen. The studies have revealed that the commercializationof agriculture has lowered the household food and nutritional security of thepoor (Valverde 1977, Taussig 1978b, George 1977).
Another important point is that even if a balanced food production is achievedat macro level, it may not support at micro level the household food andnutritional security. Therefore, the goal of agricultural development shouldnot be limited achieving national food security but should extend to householdfood and nutritional security especially of the food-insecured households.

4
The agricultural development agencies also need to consider health andnutrition intervention programs for promoting nutritional objectives alongwith their programs. The nutritional intake and malnutrition are complexphenomena involving multi-sectoral interests and socio-economic factors.To formulate sound agricultural policies which could fulfil national andhousehold nutritional security, better empirical evidences and deeperanalyses are required. There may be differences in the nutrient intake acrossproduction systems, depending upon the types of crops grown. In extremecases of ‘at-risk’ households, appropriate interventions are required forproviding nutritional security. There have been only a few studies on exploringthe potential of agricultural-based interventions for better nutrient intake bythe rural households in the Indian context. Further, if the agriculturalproduction system is to be improved to address the nutritional issues of thespecific areas, at micro-level, sound linkages will have to be establishedamongst the agencies involved in tackling the problem of malnutrition.
The present study was therefore, taken up to find the nutrient intake patternof the rural households under different agricultural production systems. Thehouseholds dependent solely on agriculture, of small and, marginal farmersand of agricultural landless laborers, which are all more at risk regardingmalnutrition, have been studied in details. The possible linkages betweenprograms of the departments of agriculture, health and nutrition interventionshave been studied. It would help in identifying areas for exchange ofinformation and experience on nutritional management in the country. Basedon the status of nutrition, nature and strength of linkages among theconcerned departments, the agriculture-based nutritional interventions canbe planned and implemented. The findings of the study would be useful indevising policy for sustainable nutritional security.
1.2. Objectives
The specific objectives of the study were:
1. To find the nutrient intake pattern and its determinants of ruralhouseholds under different agricultural production systems, and
2. To assess the possibilities of fostering institutional linkages amongagriculture, health, and nutritional-intervention programs and with aview to designing programs for achieving sustainable nutritionalsecurity.

5
1.3. Out line of the report
The report is organized into eight chapters. Following the introduction part,the second chapter provides review of past studies carried out in householdnutrition. Chapter 3 deals about methodology explaining sampling andanalytical frameworks followed in this study. Inter and intra household foodand nutrients consumption pattern has been presented in Chapter 4. Chapter5 describes about factors influencing consumption. Information oninstitutional linkages among agriculture, health and nutrition departmentshas been presented in Chapter 7. The last chapter presents majorconclusions and policy implications.

6
2. REVIEW OF PAST STUDIES
2.1. Malnutrition status
Poverty and hunger go hand in hand, affecting particularly the children inthe developing world. The number of underweight children in under-fiveyears age group is rising in the developing countries; it has gone up from164 million in 1980 to 184 million in 1990, with about 200 million by the turnof the century. Almost half of the children in South Asia are projected to besignificantly underweight by 2000. Micronutrient deficiencies are alsowidespread in this area. About 14 million pre-schooling children have eyeproblem due to deficiency of vitamin A. Between a quarter and a half of amillion children go blind each year for lack of Vitamin A, and two-thirds ofthese die within months of going blind. Iron-deficiency leading to anemia,which diminishes learning capacity and lowers physical health-also affectsabout a billion people in the world, particularly children and women of childbearing age (Pinstrup-Andersen et al. 1997). There are various factorsinfluencing nutritional security.
The major nutritional deficiencies in the developing world are: protein-energymalnutrition (PEM), iron-deficiency anemia, iodine-deficiency disorders(IDD), and vitamin A deficiency (ACC/SCN 1992, Latham 1987). All fourmajor nutritional problems show prevalence of gender differentials also andseverity for some specific population subgroups. Three of these represent amore serious problem for females in South Asia (where almost half theworld’s undernourished people live); and both iron-deficiency anemia andgoiter are more prevalent among adult women than in men, while vitamin Adeficiency is more among boys than girls.
2.2. Nutrients intake
According to the 1993-94 Round of the National Sample Survey (NSS),about 80 per cent of the rural population and 70 per cent of the urbanpopulation had caloric intakes below the recommended values (2400 caloriesper adult in rural areas and 2100 calories in urban areas), respectively. In1993-94, the poorest 30 per cent of India’s population (or about 300 millionpeople) could consume, on an average, lower than 1700 calories per day.The lowest 10 per cent among these received less than 1300 calories per

7
day (Shariff and Mallick 1998, World Bank 1998). A multicentric studyconducted in India on the use of carotene-rich food to combat vitamin Adeficiency revealed that the main factor behind this was low level ofconsumption of Green Leafy Vegetables (GLVs). The GLVs were non-available during summer season and are reported to be of poor quality inmonsoons. The economic affordability was found to be another importantfactor influencing the consumption of GLVs and other carotene-rich foods(Seshadri 1996).
Income is one major factor, which controls the nutrient intake. In rural UttarPradesh (India), significant differences were observed in nutrient intake,except carbohydrates, between different income groups. Households at thehigher end of income distribution consumed significantly higher amounts ofnutrients, through dairy products, non-vegetarian foods and fruits. Cerealscontributed increasingly to nutrient supply at the lower end of incomedistribution where the consumption patterns were chiefly cereal-based.The implication is that strengthening the policies of diversification ofagriculture into animal husbandry and vegetable growing, particularly forthe low income households would help them in not only improving theirnutritional standards but also providing them with sufficient income topurchase needed high-value food other than the home-produced (Birthal1996).
2.3. Intra-household allocation
Intra-household food allocation rules or procedures may substantially affectthe child health and nutrition. Intra-household allocations are the result ofimplicit or explicit bargaining among household members, individualbargaining positions (which may depend partly on their individual commandover resources), and various cultural norms that could affect individualpreferences that shape the bargaining and allocation processes (Behrman1995).
In a study on intra-household allocation of nutrients in a community inrural South India, Behrman and Deolalikar (1988) have analyzed theeffect of income and food prices on individual dietary intake. One of thefindings concerning nutrient intakes by women in this study is particularlyinteresting. It was found that when food prices gone up, the nutrient intakesof girls and women were adjusted downward more than those of boysand men.

8
2.4. Determinants of food and nutrients intake
2.4.1.Preferences and tastes
Preferences and tastes characterize the trade-offs an individual is willing tomake among his/ her consumption of various goods and services.Preferences indicate, for example, how many additional kilograms of coarsegrains an individual would like to consume to reduce consumption of goodquality rice by a kilogram? The preferences depend on immediate micro-environment under which one is raised, generally including that of thehousehold and the traditional culture and norms of the community of whichthe household is a constituent (Behrman 1995).
Culinary practices did seem to pose a constraint in the consumption offoods especially by children. Green leafy vegetables were mostly served inthe form of a “sabji” or “sag” which was not prefered by children. Further,these GLVs were cooked with addition of chillies which further deterred thechildren from consuming them. Although some children liked to eat carrotsin raw form, mothers usually seved them as ‘sabji’. Thus, it was found thatyoung children had problems not with these vegetables per se but with theform in which they were offered to them (Seshadri 1996).
2.4.2.Income control
Caregiver’s autonomy and control of resources effectively influence thechildcare. Haddad and Hoddinott (1994), for example, have suggested thatmothers are more likely to allocate extra resources under their control tochildren than fathers in Côte d’ Ivoire. And the higher the share of incomecontributed by women, the greater is their control over resources (Blumberg1988, Engle 1991, Engle and Nieves 1993). High female wages wereassociated with an improvement in the nutrient intake of most of thehousehold members. However, little positive effect was found on the nutrientintake of women themselves (Behrman and Deolalikar 1990). Leslie (19881989) has reviewed twenty-five studies from sixteen developing countriesand could not conclude linking maternal employment with poorer nutritionalstatus of children. Studies that have examined impact of maternalemployment as a function of the age of the child, controlling potentiallyconfounding variables, have reported a negative association betweenmaternal earnings and children’s nutritional status during infancy (Engleand Pedersen 1989, O’Gara 1989), particularly, when employment startsbefore the child’s second month of life, a finding not observed when motherswere at home for the first three months of the child life (Vial et al. 1989).

9
Some studies have found significant negative association of maternalearnings with nutritional status of the child. In a study covering about 2,000rural mothers in India, Abbi et al. (1991) have found that children of motherswho worked for agricultural jobs on their own farms for 5 to 6 hours a daywere likely to be significantly malnourished, regardless of who the alternatecaregiver was, if these women did not have control on their earnings.
Studies suporting negative effect (Wandel and Holmboe Ottesen 1992a,1992b) as well as positive effect of work on children (de Groote et al. 1994,in Mali; Brown et al. 1994, in Niger; Blau et al. 1996, in the Philippines; Engle1991and 1993 , in Guatemala; LaMontagne et al. 1993, in Nicaragua) havebeen found in the literature. In the Philippines, Blaue et al. (1996), using arigorous model, analyzed the well-paid works; and found that children whosemothers worked in higher paying occupations had equal or better growthrates. When the work was well-paid, or the income was in the hands of themother, or when the child was more than one year old, the effects on eitherchild nutrient intake or nutritional status were positive.
2.4.3.Customs and beliefs
Household’s resources, customs and traditions affect the nutritional statusof pre-school children. Even within the same level of resources, the traditionalbeliefs towards food items influence their intake and hence the nutritionalintake. For example, if certain foods through rich in some relatively scarcenutrients, are believed to be bad for children, their intake result will be lesssatisfactory (Behrman 1995).
Many weaning customs of people in non-industrialized areas also lead tomalnutrition (Cassidy 1980). Customs, such as restricting certain protein-rich foods, allowing competition for food within children, specific food to thepreferred sex and separating the child from the mother for a long period oftime, tended to result in malnutrition.
Many food taboos for young children may limit the types of foods that can beoffered (Van 1989). In Iran, the introduction of a variety of food to children isoften delayed, based on the perception that young children cannot digestthe foods that are served to the family (for example, beans) or that somefoods cause stammering and delayed speech (eggs) and impair the intellectif introduced before 18 months of age (cheese) (Rabiee and Geissler 1992).This implies that children may not receive adequate amounts of protein-and micronutient-rich foods until they are 18 months of age (Engle et al.1997).

10
The practice of excluding lactating women from certain green leafy vegetableswas seen prominently in southern India. These GLVs were avoided for fearof diarrhoea or cold in infants. In the eastern India, colocasia leaves had anegative connotation, since they are offered at funerals by the Tea Tribecommunities, while the other rural and tribal populations believed thatcolocasia leaves could cause a wide variety of health disorders (Seshadri1996).
2.4.4.Sex discrimination
McGuire and Popkin (1989) have compiled data from thirty-two studies thatreported dietary intake and or, anthropometric data, for women in thedeveloping countries. With a few exceptions (e.g. Korea, Micronesia, andSingapore), these studies have concluded that women consume only abouttwo-thirds of the WHO-recommended daily allowance for energy.
Ravindran (1986) has summarized much of the literature through mid 1980sabout the evidences on parental sex preference, and discriminatory feedingand health care practices in the Third World. The review has reportedwidespread evidence of expressed preferences for sons on the part ofparents. Among the countries for which comparable data were available,(based on the World Fertility survey), all, except Korea, located in eitherSouth Asia, or the Middle East, are classified as having a strong preferencefor sons; many others (including quite a number in West Africa) have amoderate preference for sons; a similar number (including many LatinAmerican and Caribbean countries) has equal preference; and only two(Venezuela and Jamaica) have a slight preference for daughters. It is primarilyin those countries of South Asia which showed a strong preference for sons(e.g., India, Nepal, Pakistan, and Bangladesh) that consistent evidence ofwidespread discrimination against girls was found, resulting in marked sexdifferences in mortality, morbidity, and malnutrition. Conflicting findingsemerged as regards to sex discrimination. In rural north India, Birthal (1996)study did not reveal any sex discrimination in nutrient intake. On the contrary,Jatrana and Sangwan (1996) have found strong evidence for sexdiscrimination in food intake. They found that in rural north India, there hasbeen a consistent discrimination between a female and a male child.Differential care resulted in higher female mortality in post-neonatal andearly childhood period where behavioral factors were powerful to influencemortality. Level of protein-calorie malnutrition (PCM) among girls wassubstantially higher than in boys. Differential care was also noticed in feedingpractices and general care of new born when the mother goes out to work.

11
A study covering 17 villages in Morinda,(Punjab) has reported that morethan any other factor (such as socio-economic status), the sex of a childdetermines the nutritional status. Within households, the available food isdistributed according to the status of the individual in the family rather thanaccording to the nutritional requirements as per the work output andphysiological requirements (Gade 2000).
2.4.5.Cash cropping
The studies on the nutrition effects of cash cropping have been reviewed byFleuret and Fleuret (1980); von Braun and Kennedy (1986); Longhurst (1981);Maxwell and Fernando (1989); Dewey (1989); and Brun et al. (1990). Noconclusive finding as to the cash cropping was being bad or good for nutritionemerged from these reviews. Fernando (1989) generally concurs with theconclusions of other reviews, that “the naive view that cash croppingnecessarily competes with food production and worsens food security iswrong; cash cropping can be associated with increases in the productionand availability of food at both household and national levels”.
At the household level, IFPRI studies have shown that farm householdsoften expand staple food production along with cash crop production (vonBraun et al. 1988). The studies indicated that farmers generally attemptedto maintain or even increased their food production in the context ofcommercialization of agriculture, partly as a response to market andproduction risks. Despite the higher profits from cash crop production shownin all the IFPRI studies, all farmers participating in the scheme maintainedstaple food production for home consumption. In general, thecommercialization of agriculture generated additional employment orincreased labor productivity in agriculture (von Braun et al. 1988). In general,women were found to work less on the more commercialized crops thanmen do and to work much more on the subsistence crops, except inGuatemala. Some authors (Valverde et al. 1977; Taussig 1978; George1977) have argued that commercialization of agriculture would aggravateincome distribution among farmers through drastic changes in the distributionof land and land-tenure relations, hence jeopardizing the nutritional welfareof the near-landless and landless population groups.
There is little evidence from recent studies that commercialization ofagriculture per se alters expenditure on food and consumption patterns in away that is detrimental to nutrition (Von Braun et al. 1988). Commercializationhas generally led to increased incomes, which, in turn, have led to higher

12
calorie intakes. It was generally found that with rising income, the relativeproportion of income spent on food decreased, but the absolute foodexpenditures as well as food calories increased. It also improved diet qualityand intake of micronutrients. IFPRI has conducted studies in the Gambia,Guatemala, Kenya, Philippines, and Rwanda on food consumption patternsand malnutrition. Although the prevalence of malnutrition was found to belower among cash crop–producing households, the difference between cashcrop producers and food producers was not always statistically significant.In the case of children, malnutrition remained high among cash-crop-producing families. The effect of increased income on the nutritional statusof pre-schooling children, though generally positive, was less than expected,probably because of the existence of poor sanitary conditions, poor qualityof water, lack of access to primary healthcare, and poor knowledge aboutthe nutrition-related issues in the households.
2.4.6.Time Allocation
In general, women’s role in cultivation of cash crops and direct control overincome from the new cash crops was found to be that of much less thanmen’s. Women did not play a significant role as decision-makers andoperators of the more commercialized crop production line in any of theschemes; even when typical women’ s crops were promoted (e.g. rice in theGambia).
There was a large variation in the effects of cash cropping on women’s time-use patterns, as reported by IFPRI studies. In Kenya, women were found tospend equal amounts of time on farming, animal care, and childcare in bothsugar and non-sugar producing households. They spent virtually no time onproduction of sugar (Kennedy and Cogill 1988). In Guatemala, in contrast,von Braun et al. (1988) have indicated that introduction of the new exportcrops increased women’s participation in agriculture by 78 per cent comparedto 33 per cent for men, although in absolute terms men were to under takeadditional work per season (21 days) than women (15 days).
Seasonality and the working pattern of the women also tend to affect thegrowth of the children. Children in 6-12 months age group are most dependenton the mothers for feeding and care. When women were involved in highlytime intensive tasks like transplanting, they were not in a position to giveadequate care to children of this age group. This situation was found to leadto virtually zero growth velocity among these children (Stuart and McNeill,1992)

13
That women in India work for longer hours in both unpaid/domestic workthan men has also been established by a study carried out in Karnataka.The study conducted in 500 households in six villages, has revealed thatwomen had a shortfall of 100 calories while men had a surplus of 800calories per day. Women’s domestic work was also taken into account in thephysical activity calculations (Gade 2000).

14
3. METHODOLOGY
3.1. Selection of study location
The macro-level data on nutrition in different states of India revealed that,Tamil Nadu was at the bottom of the calorie intake by the poorest of the poor.The lowest ten per cent amongst the poor in Tamil Nadu consume only1551 Kcal per consumption unit per day (Annexure 1) (MSSRF 2001). Itmay be mentioned there that persons consuming less than 1890 Kcalper consumer unit per day are termed as ‘hungry’, as the consumption ismuch lower than the food adequacy norms of ICMR. Tamil Nadu has thehighest percentage of the households consuming less than 1890 Kcal.(Annexure 2) (MSSRF 2001). Protein Energy Malnutrition is as high as41.40 per cent in this state (Annexure 3). The results of micronutrientssurvey reveal that Tamil Nadu has the highest percentage of populationwith vitamin A deficiency (Annexure 4). The consumption of thiamin wasalso found to be less than the required level of 1.20 mg/day. The averageintake of niacin is the lowest at 9.70 mg per day, as against the minimumrequirement of 16.00 mg per day. Considering the low status of Tamil Naduin nutrients intake and malnutrition control, this state was selected for thepresent study.
Within Tamil Nadu, based on the discussion with the officials of StateDepartment of Agriculture and the experts in Tamil Nadu AgriculturalUniversity, (Coimbatore), Dharmapuri district, having three agriculturalproduction systems namely rice, vegetables and sugarcane were purposively,chosen. Dharmapuri district, the area of the present study, is in the Agro-climatic region I of Tamil Nadu. Broadly describing, its western and northernregions are dry with moderate temperature where rainfed crops andvegetables are raised. Dairy and sericulture are supplementary activities.The eastern part is endowed with the Krishnagiri river and rice is the majorcrop in its ayacut, followed by pulses and vegetables. Fruit orchards areraised in uplands. In rainfed areas around north, central and south-eastregions, grapes and mango, millets and pulses, and vegetables are grown.In the south and central regions, sugarcane, oil seeds such as groundnutand sunflower are the major crops. The south-eastern part is covered withmango orchards, cashew, and vegetables; and south-western region is withsugarcane under irrigation and millets-pulses in rainfed areas. In rainfedlands, depending on rains mainly, crop mixtures of 15-20 crops of millets,

15
Figure 1. Map of the study area

16
pulses and oilseeds are common to hedge against risks due to delay andfailure of rains.
The district is one of the backward districts in Tamil Nadu with literacypercentage as low as 46 per cent. Further, the district is subject to intensiveresearch dominated by crop and livestock research and development withpractically little focus on nutritional security. The demographic and nutritionalintervention particulars about the district are given in Annexures 5-10. Thestudy area was restricted to one district because it has been assumed thatwithin a district there would be probably more of agro-biological and socio-cultural homogeneity. Within the district, three sample villages were selectedbased on primarily crop production systems. Production system was decidedbased the predominant cropping pattern. For example, a village havingmore than 40 per cent of the cultivated area under rice was selected asrepresentative of rice production system. Similarly, other production systemswere also selected, viz. vegetables and sugarcane production system. Onevillage representing each production system was selected. Thus, there werein total three villages. The villages were selected such that they were quitedistant apart. The villages were identified with the help and guidancefrom senior officers of the state departments of agriculture. Annexure 11provides the details about the selected villages. The district map ofDharmapuri along with the geographical location of the study area is depictedin Figure 1.
3.2. Collection of information from households
A specially-designed and pre-tested questionnaire was used in this studyfor collecting information from households. For each village, 60 householdswere selected at random as respondents. The literature indicated that withinthose who have agriculture as primary occupation, small and marginalfarmers and agricultural landless laborers were at risk in terms of nutritionalintake and nutritional status. By following the random sampling method,20 respondents from each category of small and marginal farmers andlandless laborers were selected from each village representing a particularproduction system. Thus, from three villages, a total sample of 180households was selected randomly after taking the list of these groupsusing village records. The sample design is given in Figure 2. In eachhousehold, the male and female heads of the household were consideredas respondents for collecting the information on nutrient intake patternof the household members. The survey was conducted during the year2000-01.

17
3.3. Collection of information from organizations
Various organizations/development departments from the state level up tovillage level were visited for collecting secondary data and to elicit theperception of the officials related to the research questions included in thisstudy (Annexure 12). Information about ongoing development programswas collected through publications such as annual progress reports of theorganizations. Discussions were held with senior officers of the concerneddevelopment departments to find out their information needs for improvingthe regional nutritional security. The possible linkages among them wereexamined. The potentiality for agriculture-based interventions in alleviatingthe problem of malnutrition was explored. Their suggestions for agriculture-based intervention for sustainable nutritional security were recorded.
3.4. Analytical framework
Malnutrition is defined as poor nutritional status caused by certaincombinations of lower food intake, illness, and inadequate care (World Bank1998). Protein-Energy Malnutrition (PEM) and deficiencies of micronutrients(Vitamins A, B and D, iodine and iron) are various forms of malnutrition.Malnutrition results from a combination of three key factors: inadequatefood intake; illness; and deleterious caring practices. Underlying these are
Figure 2. Sampling design of the study
Tamil Nadu
Dharmapuri District
Taluk 1: KrishnagiriRice-based
Taluk 2:DenkanikotaVegetables-based
Taluk 3: PalacodeNon-food crop based
Block1: Krishnagiri Block 2: Kelamangalam Block 3: Palacode
Village 1: Periyamuthur Village 2:Marasandaram Village 3: Thottanahalli
60 Households(20 each from SmallFarmers, MarginalFarmers and Agrl.Landless laborers)
60 Households(20 each from SmallFarmers, MarginalFarmers and Agrl.Landless laborers)
60 Households(20 each from SmallFarmers, MarginalFarmers and Agrl.Landless laborers)

18
household food insecurity, inadequate preventive and curative healthservices, and insufficient knowledge about proper care.
Food insecurity exists when all people, at all times, do not have physical andeconomic access to sufficient, safe and nutritious food to meet their dietaryneeds and food preferences for an active and healthy life (FAO, 1996).
Conventionally, food security is defined as the balance of food supply (mainlycereal supply) and effective demand for food, otherwise, termed food self-sufficiency within a territorial entity, usually the country. Although availabilityof food is a necessary condition, it is not a sufficient condition, to ensurefood security for all, because those who cannot afford to buy food are lefthungry and undernourished. Recognizing the composition, access andspatial dimensions of food security, an appropriate goal will be ‘livelihoodsecurity for the households and all members within, which ensures bothphysical and economic access to balanced diet, safe drinking water,environmental sanitation, primary education and basic health care’.Livelihood security for all should be the country’s number one priority(Swaminathan et al .1996).
In India, the household food insecurity stems from inadequate employmentlow income, seasonal migration (especially among tribal populations),relatively higher food prices, geographic and seasonal mal-distribution offood, poor social organization, and large family sizes.
3.4.1.Measuring food and nutrients intake
The study was to examine the pattern of nutrient intake and determinants ofintake in different crop production systems. It was assumed that in a singledistrict, the agro-biological socio-economic and cultural differences wouldnot vary considerably. The production systems were identified within a district.Nutrient intake was considered as a dependent variable. Nutrient intakeinformation was collected using questionnaire and the 24-hour recall method,which is the standard methodology, followed by National Nutrition MonitoringBureau (NNMB), Hyderabad. In the 24-hour recall method, a respondenthas to undergo the following processes: (i) recall the names of foodpreparations/ items that the respondent had brewed or cooked during thelast 24 hours (i.e. previous day before the data collection interview); (ii)Recalling information about all leftovers, food brought from outside, foodtaken in from hotels, shops, and fields; and (iii) Recalling how much eachmember consumed from each preparation (regardless of source).
The name of all the preparations consumed on the previous day (“thereference day”), including all solid, semi-solid and liquid foods were recorded.
19
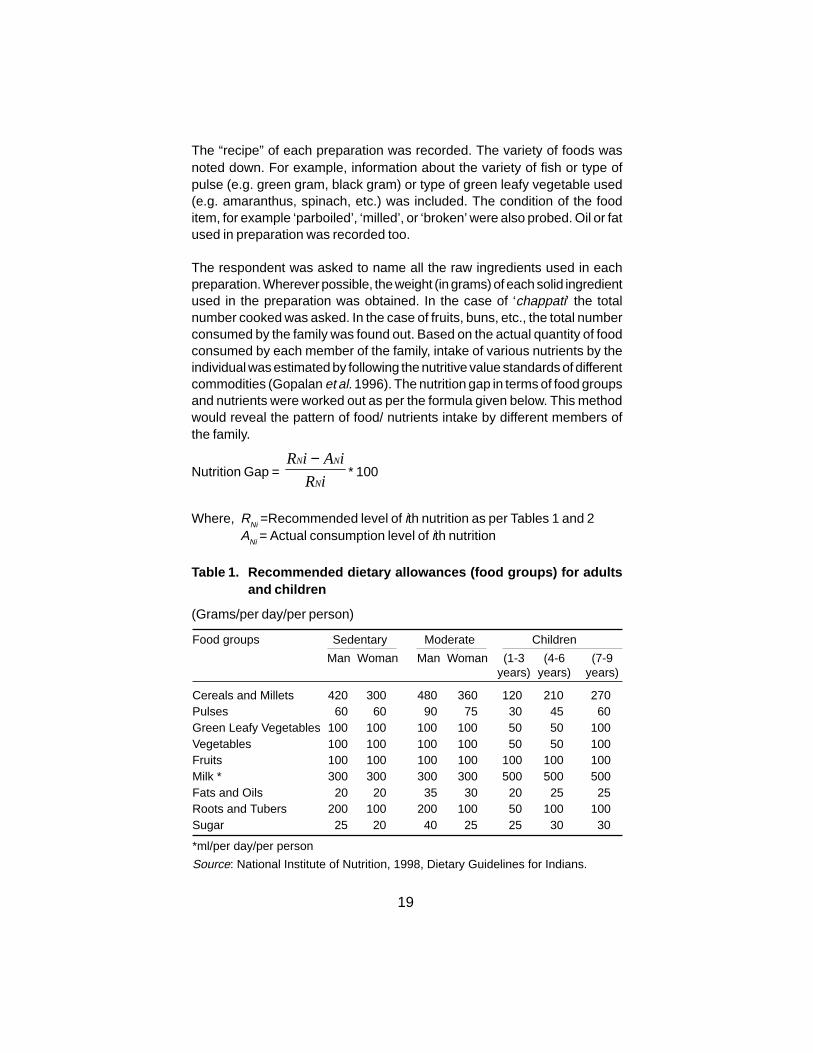
The “recipe” of each preparation was recorded. The variety of foods wasnoted down. For example, information about the variety of fish or type ofpulse (e.g. green gram, black gram) or type of green leafy vegetable used(e.g. amaranthus, spinach, etc.) was included. The condition of the fooditem, for example ‘parboiled’, ‘milled’, or ‘broken’ were also probed. Oil or fatused in preparation was recorded too.
The respondent was asked to name all the raw ingredients used in eachpreparation. Wherever possible, the weight (in grams) of each solid ingredientused in the preparation was obtained. In the case of ‘chappati’ the totalnumber cooked was asked. In the case of fruits, buns, etc., the total numberconsumed by the family was found out. Based on the actual quantity of foodconsumed by each member of the family, intake of various nutrients by theindividual was estimated by following the nutritive value standards of differentcommodities (Gopalan et al. 1996). The nutrition gap in terms of food groupsand nutrients were worked out as per the formula given below. This methodwould reveal the pattern of food/ nutrients intake by different members ofthe family.
Nutrition Gap = iR
iAiR
N
NN −* 100
Where, RNi =Recommended level of ith nutrition as per Tables 1 and 2ANi = Actual consumption level of ith nutrition
Table 1. Recommended dietary allowances (food groups) for adultsand children
(Grams/per day/per person)
Food groups Sedentary Moderate Children
Man Woman Man Woman (1-3 (4-6 (7-9years) years) years)
Cereals and Millets 420 300 480 360 120 210 270Pulses 60 60 90 75 30 45 60Green Leafy Vegetables 100 100 100 100 50 50 100Vegetables 100 100 100 100 50 50 100Fruits 100 100 100 100 100 100 100Milk * 300 300 300 300 500 500 500Fats and Oils 20 20 35 30 20 25 25Roots and Tubers 200 100 200 100 50 100 100Sugar 25 20 40 25 25 30 30
*ml/per day/per person
Source: National Institute of Nutrition, 1998, Dietary Guidelines for Indians.

20
Table 2. Recommended dietary allowances (nutrients) for adults andchildren
Nutrients Moderate Children
Man Woman (1-3 years) (4-6 years) (7-9 years)
Protein, g/d 60 50 22 30 40
Energy, Kcal/d 2875 2225 1240 1690 1950
Calcium, mg/d 400 400 400 400 400
Iron, mg/d 28 30 12 18 26
Vitamin A (Retinol),mg/d 600 600 400 400 600
Vitamin C, mg/d 40 40 40 40 40
Source: National Institute of Nutrition, 1998, Dietary Guidelines for Indians.
Nutrition Gap is expressed in terms of percentage. A positive value indicatesthe extent of deficit from the recommended level, whereas a negative showsexcessive nutrient intake. Information on following factors was considered.They are, type of crops grown, crop yields, food availability, socio-culturaland economic indicators such as caste, beliefs, taboos, maternal knowledgeon nutrition, type of crop in which agricultural labor works, farm size, totalhousehold income, crop income, livestock income, wage income, self-employment income, mother’s income, education of the key individual ofthe household, market access, road access, total expenditure, non-foodexpenditure, gender of the head of the household, family size, sources offood intake, seasonality and village characteristics. The extent ofrelationship between independent variables with the dependent variablewas analyzed and screened based on their significance. Inter-productionsystem and inter-category comparison in terms of adult male, adult females,and children were also carried out.
3.4.2.Factors influencing food and nutrients intake
Linear estimates of nutrient intake were worked out. Per capita consumptionof most important nutrients, viz. protein and energy were included in theanalysis. Out of various personal, and socio-economic characteristics thatmay influence nutrient intake, the influence of only some significant variableslike rice area, expenditure on milk and milk products, family size (Birthal1996), total expenditure on PDS commodities, maternal nutritionalknowledge, woman education (Birthal, 1996) and children (1-5 year old)were estimated. Previous studies cited elsewhere in the report also indicatethe importance of these variables. In a nutrient consumption study in ruralnorth India, by Birthal (1996), alternate functional forms were tried to estimate

21
the effect of various personal and socio-economic variables on nutrientintake. He had concluded that based on explanatory power of differentfunctions, linear form was found to give the best fit for most of the nutrients.Hence, in this study also, linear functional form was used, incorporating theabove-mentioned variables. The ordinary least square regression modelfollowed in this study is described below. The descriptions of variables aregiven in Table 3.
Y = a + β1RICA + β
2EMIL + β
3FAMSZ + β
4TOTE + β
5TOTPDS +
β6NUKNOW + β
7WEDU + β
8CHILDREN
Where, Y is a dependent variable PCPRO (per capita protein consumed) orPCENER (per capita energy consumed). For each production system, twosets of regressions were run, i.e. one for per capita protein consumed andanother for per capita energy consumed. There were thus six regressions.
Table 3. Independent variables included in the regression analysisfor per capita intake
Description Variable Unit
Intercept Constant gram or calories/per capita / per day
Rice area RICA Acre
Expenditure on milk andmilk products EMIL Rs.
Family size FAMSZ Number
Total expenditure TOTE Rs.Total value of commoditiesavailed through Public
Distribution System TOTPDS Rs.
Maternal nutritional knowledge NUKNOW Score
Women education level in thehousehold WEDU Score
Dummy for children(1-5 year old) CHILDREN —
An analysis on expenditure behavior for foods and non-foods consumed byaverage household was attempted. The aim of this analysis was to find outthe relationship between income and consumption of commodities. Thechange in this relationship as a result of any change in income and socio-

22
economic characteristics of households was determined. Average monthlyexpenditures were collected from the sample households. The model usedis a set of Engel functions relating average monthly expenditures on variouscommodities to a measure of total income.
The average monthly consumption expenditure for each household wasused as a proxy for income, because, collecting information about preciseincome of a household is relatively difficult. Moreover, consumptionexpenditure is usually considered a better indicator of regular/permanentincome, which itself is an important determinant of consumption behavior(Friedman 1952). The total consumption expenditure is considered a betterproxy of total income of a household. A flexible functional form, which couldprovide a good statistical fit to a wide range of commodities, is required tofind out the income-consumption relationships. Further, the function musthave a slope that is free to change with income. Because, a common set ofEngel relations is to be estimated for all the households.
Let us assume for a moment that all households differ only in their totalconsumption expenditure. A linear functional form would then be toorestrictive for these purposes. The linear Engel curve [Equation (1)] is:
E i = α
i +β
i E (1)
Where, E i is expenditure on good i, E is total consumption expenditure,
and α is a constant, and does not permit the marginal budget share (βI) to
vary at all. Thus, redistribution is implicitly assumed to have no effect onthe aggregate expenditure of good i.
It is expected that there could be variation in households’ expenditurepattern and marginal budget share. A non-linear function is more appropriateand the modified form of the Working-Leser model was therefore considered.The influence of socio-economic characteristics of the household shouldbe captured for meaningful comparison of consumption expenditurebehavior of households. The complete model in expenditure share form asfollowed by Hazell and Röell (1983), was adopted. The form is [Equation(2)]:
Si=β
i+α
i/E+γ
i log E (2)
Equation (2) is equivalent to the Engel function
Ei= α
i +β
iE+γ
i E log E (3)

23
It is expected that the household-expenditure behavior would be affectedby the socio-economic characteristics of the household also. Therefore, afew household characteristic variables were also included in the Engelfunctions. Inclusion of variables in the Engel function was done in a mannerthat allows them to shift both the intercept and the slope of the Engelfunctions.
Ei= α
i +β
iE+γ
i E log E+∑
j(µ
ij Z
I+λ
ijEZ
j) (4)
where, E i is expenditure on good I
i= 1,2……18: items of household expenditure [rice, finger millet, othercereals, pulses, vegetables, fruits, oil, milk and milk products, animalproducts, sugar, miscellaneous (food expenditure), education, socialobligation, health, transport, fuel, clothing, others (non-food expenditure)].
Zj = jth household characteristics variable
j = 1, 2,……10 : household characteristics, Z factors (totalexpenditure, log expenditure, land, head education, children, family size,proportionate women, homestead garden, proportionate earning member)µ
ij and λ
ij= constants
In expenditure share form, it is equivalent to [Equation (5)]:
SI = β
i + α
i/E + γ
i log E + ∑
j(µ
ij Z
I/E + λ
ijEZ
j) (5)
The marginal and average budget shares and the expenditureelasticity ξ can be determined using the following equations for ith good.
MBSI = dE
i/dE = β
i+γ
i (1 + log E) + Σ
jγ
ijZ
j
ABSI = S
I = equaltion (1), and
ξ = MBSi/ ABS
i
A disadvantage of estimating share equations is that the R2 coefficientsare typically smaller. The parameters of the share equations were estimatedfor each commodity using ordinary least squares regression (OLS). Thestudy sample included farmers and agricultural laborers. So, there could beprice differences in food commodities due to whether they were farm-produced or purchased. In the study area even the agricultural laborers also

24
were receiving kind wages. To adjust this type of problem, possession ofland was used in this model similar to the study of Hazel and Röell, (1983).
3.4.3. Factors influencing expenditure behavior of households
The explanatory variables that were included in the budget share equationsfor three different productions systems which, are shown in Table 4. Thesevariables were identified after screening for the significant results. It waspresumed that households having farms had access to larger amounts ofhome-grown foods at farm level prices; thus, the dummy variable “possessionof land” acted as proxy for Massell’s subsistence ratio. The homesteadgarden was also included as a variable.
Table 4. Independent variables included in the regressions forexpenditure share
Description Name Unit
Intercept Constant Rs.
Reciprocal of total expenditure 1/E Rs.
Log of expenditure Log E —-
Dummy for possession of land LAND —-
Education of household head HDEDU —-
Age of household head HDAGE —-
Dummy for children (one to five years old) CHIDREN —-
Family size FAMSZ Number
Number of women as proportionate to family size WOMEN —-
Dummy for possession of homestead garden HSTEAD —-
Number of earning members as proportionate EARNM —-to family size

25
4. FOOD AND NUTRIENTS CONSUMPTION
4.1. Food and Nutrients Intake of Sample Households
The agricultural production systems influence, due to the type of cropslocally grown and their free access, the food-intake pattern of the households(Valverde et al. 1997, Taussig, 1978b; and George, 1977). The findingshave established that the increased income due to the cash crops may ormay not necessarily translated into having nutritionally-balanced food basketsby rural households. To examine these issues, different production systemswere investigated in the present study. From the quantity of food intake byan individual, the nutrients intake gap was worked out. The nutrient gap hasbeen expressed in percentage with respect to various types of nutrients.This is a good indicator of nutritional security of the individuals under differentproduction systems. The percentage of deficit from the RDA for thecorresponding food groups or nutrients is depicted in Table 5.
4.1.1.Adults’ food and nutrients intake
Actual food intake by adult males and adult females were measured and thepercentage of deviation from the recommended dietary allowances (RDA)was worked out for various types of food groups.
Among the food groups, the deficit was more pronounced in the case offruits and green leafy vegetables (GLVs) for both sexes, and the least forpulses and cereals. Among the production systems, the extent of deficitwas comparatively lower in the vegetable production system. The adultmales had lower deficit than that of adult females. As referred earlier, amulti-centric study on the use of carotene-rich food to combat vitamin Adeficiency in India had revealed the factors responsible for the lower level ofconsumption of green leafy vegetables. These included non-availability ofGLVs during the summer and monsoon months and the reported poor qualityof the pro-vitamin A sources, especially GLVs during monsoon.

26
Table 5. Adults’ food and nutrients intake by agricultural production systems
Production Food groups Nutrients
System Cereals Pulses GLVs* Vegetable Fruits Milk Fats & Oils Protein Energy Calcium Iron Vitamin A Vitamin C
Men
Rice 2 10 83 27 84 43 77 23 13 -50 21 60 42Vegetable 7 3 45 17 74 33 66 22 15 -125 14 40 5Sugarcane 4 15 85 30 90 47 83 25 14 -63 26 65 45
Women
Rice 2 13 93 28 88 63 77 24 14 -38 33 64 50Vegetable 8 5 70 18 78 53 63 22 13 -113 23 43 13Sugarcane 6 18 94 37 93 67 80 26 14 -50 37 67 50
Note:* Green Leafy Vegetables“-“ indicates more than RDA

27
The economic affordability emerged as an important factor influencing theconsumption of GLVs and other carotene-rich foods (Seshadri 1996).
Among nutrients, for both adult males (men) and adult females (women),the vegetable production system had highly favored the increased intake ofiron, vitamin A and vitamin C, whereas in food and cash crop systems, thedeficit was more in respect of consumption of these vital nutrients (Table 5).The deficit in the consumption of iron and vitamin C was significantly low inthe vegetable system as compared to the food and cash crop basedproduction systems for both men and women. Calcium intake was found tobe excess of the recommended level across both the production systemsfor both the genders. However, its intake was more in vegetable productionsystem. The macro-nutrients like protein and the energy consumptionremained non-significant across production systems. The GLVs are generallyrich in carotenoid pigments and 40 to 80 per cent of the total carotene inthem is contributed by beta-carotene. Green leafy vegetables are very goodsource for vitamin A, because these contain beta-carotene that can bebiologically converted into vitamin A in an effective manner.
4.1.2.Children’s food and nutrients intake
The values of RDA for adults and children are different. Even within thechildren category, these vary with age group. The percentage of shortagesto RDA for children of different age groups is presented in Table 6.
Among food groups, and in the case of green leafy vegetables (GLVs), thechildren in the age group of 1-3 years across the production systems wereslightly more deficit. This was partially due to the non-preference for thesefood items by children of these groups may be due to non-palatablepreparation to suit their taste. Further, some mothers had strong belief thatthe greens if given to children induce diarrhoea and, therefore they did feedit to the children. Household’s resources and other constraints also affectedthe nutritional status of pre-school children.
Even within the same level of resources, customs and beliefs regardingsome food items influence the nutritional intake. For example, if certainfoods though rich in some relatively scarce nutrients, were labeled ‘bad forchildren’ as per belief. In the study area, it has been observed the intake of‘Agathi’ (Sesbania grandiflora) was lower in the case of pre-school children,though, it is highly rich in calcium mineral. A significant deficiency wasnoticed in respect of the consumption of fruits, milk, fats and oils by thechildren of all age groups, particularly in food-grain-based and cash crop

28
Table 6. Children’s food and nutrients intake by agricultural production systemsShortage to RDA in %)
Production Food groups Nutrients
System Cereals Pulses GLVs* Vegetable Fruits Milk Fats & Oils Protein Energy Calcium Iron Vitamin A Vitamin C
1-3 Year age groupRice 3 10 85 30 95 36 65 14 10 -14 17 50 55Vegetable 4 3 50 20 86 29 55 9 12 -75 8 41 38Sugarcane 3 13 88 32 97 34 70 18 13 -6 20 53 48
4-6 Year age groupRice 4 11 80 24 90 50 68 17 11 -30 11 45 43Vegetable 2 9 43 10 80 43 64 13 13 -100 6 31 33Sugarcane 5 14 85 28 92 54 76 20 11 -27 17 46 45
7-9 Year age groupRice 4 10 80 25 85 50 68 17 13 -35 13 62 45Vegetable 6 5 38 17 77 43 60 15 14 -75 6 50 10Sugarcane 5 15 83 28 87 54 72 20 14 -33 15 63 38
Note: * Green Leafy Vegetables ‘-’ indicates more than RDA

29
based production systems. On the other hand, the consumption of pulses,green leafy vegetables (GLVs), and vegetables consumption wasconsiderably high in the children under vegetable production system thanin other systems.
The influence of production system on nutrients intake among childrenrevealed the same pattern as observed in the case of adults (Table 6). Atpresent, the malnourished children are being given supplementary tabletsfor iron and vitamin A deficiencies. Lower deficit on these nutrients in thevegetable production system indicates its scope to serve as complement inalleviating micro-malnutrition.
4.2. Intra-household allocation of nutrients
The estimate of household level nutritional security may not necessarilyreflect the individual level nutritional security in that household. Variousstudies have highlighted the importance of understanding intra-householdallocation of food. Intra household nutrient intake may be influenced byfactors such as gender, physiological status, etc. apart from food availability.These studies have indicated widespread differences. Intra-householdallocation rules or procedures may substantially affect the child health andnutrition. Therefore, in this study, the gender effect on the nutrient intakewithin a household was examined. To understand the phenomenon of intra-household nutrient intake, one household was picked up from the samplehouseholds from each productions system.
4.2.1.Rice production system
It was observed in the rice system that the female individuals had higherdeficit of nutrient intake of vitamin A and iron than the average householddeficit. This is mainly because due care was not provided in food consumptionneeded at that age and the specific requirement of certain nutrients (Table7). It implies the prevalence of gender differences within a household.
4.2.2.Vegetable production system
In vegetable production system the calcium intake was more than requiredfor all the members of the household. The females had higher deficiency ofiron and vitamin A than compared to males in the household. Among children,differences in intake were not observed (Table 8). Gender differences withparticular references to iron and vitamins were however prevalent.

30
Table 7. Intra-household allocation of nutrients in rice system
(Shortage to RDA in %)
Category Age Nutrients(Years) Protein Energy Calcium Iron Vitamin A Vitamin C
Men 45 23 6 -3 11 52 3025 22 10 -2 14 53 1820 20 9 -1 18 53 20
Women 40 25 9 -1 27 65 2320 24 1 -1 30 60 25
Girl 18 24 3 14 33 54 13
Child-Male 5 20 4 -1 11 44 18
Child-Female 3 18 3 -1 17 45 15
Household deficit 24 6 2 21 52 18
Note: “-“ indicates more than RDA
Table 8. Intra-household allocation of nutrients in vegetable system
(Shortage to RDA in %)
Category Age Nutrients(Years) Protein Energy Calcium Iron Vitamin Vitamin
A C
Men 45 4 10 -213 5 38 833 3 10 -200 8 38 1328 4 6 -150 9 37 5
Women 70 10 15 -208 19 43 1535 10 11 -208 12 42 1328 10 11 -211 16 42 1022 8 12 -203 19 40 13
Child-Male 2 7 5 -3 6 25 10Child-Female 5 13 5 -9 9 24 10Household deficit 7 9 -156 12 38 11
Note: “-“ indicates more than RDA
4.2.3. Sugarcane production system
In sugarcane system, all the members had calcium levels more than therecommended values except the adult females (Table 9). One plausiblereason could be that physiological status of pregnancy is not given due carein food intake. The deficiencies of iron, vitamin A, and vitamin C were alsohigher in young women than the household average.

31
Table 9. Intra-household allocations of nutrients in sugarcane system
(Shortage to RDA in %)
Category Age Nutrients(Years) Protein Energy Calcium Iron Vitamin A Vitamin C
Men 65 16 10 -6 25 58 3038 17 6 -3 25 58 33
Women 50 15 10 -5 33 62 3030 20 7 40 33 68 56
Child-Male 7 14 13 -2 35 53 28
Child-Female 2 14 7 -1 25 58 38
Household deficit 16 9 11 30 61 39
Note: “-“ indicates more than RDA
It can be inferred from the case studies that the household deficit in nutrientintake does not necessarily reflect the average deficit of an individual. Thisis because within the household, there are variations in nutrient intake dueto the age, sex, and physiological factors, which are not taken consideredduring food intake within a household. As a result, intra-household disparityof nutrient intake exists. One of the reasons for the lower food intake byfemale is the customary social norms, i.e. the food is served first to malemembers in the household, and the female members consume only thebalance. Even in these intra-household variations, the household deficit isrelatively lower in vegetable system.

32
5. DETERMINATS OF FOOD ANDNUTRIENTS CONSUMPTION
5.1. Factors Influencing per capita consumption of proteinand energy
Identification of factors affecting the consumption of nutrients energy arenecessary to evolve the policies to influence these factors to fill the gaps inintake of nutrients. Hence, a regression model was conceptualized andestimated for major nutrients, i.e. external energy in different productionsystems. The specification and econometric estimation details relating tothe model have been given in Section 3.4.2.
For the model, various variables were identified and regressed with thedependent variable, viz., per capita protein /per capita energy consumption.For each production system, the regression analysis was done separately.Several versions of regression (Table 10) were tried. The regression resultsof most appropriate version (version 4) are presented in Table 11.
The data in table 11 reveal that the total expenditure on Public DistributionSystem (PDS) had significant positive influence on the consumption of proteinin rice production system. Consumption of wheat supplied through PDScould be the key component on increasing the per capita protein intake. Thepresence of children in a household had significant negative effect on proteinintake. This might be due to preference for children for protein rich foodsdepriving other family members from it. And in intra-household allocation offood items, children in the family were given priority over the other members.The per capita consumption of protein came down for lack of minoradjustments in protein rich food items by the household. As per the findingsof the study, all the independent variables collectively contributed 34.90 percent of the variation on the dependent variable, per capita consumption ofprotein.
A perusal of table 11 reveals that the total expenditure on Public DistributionSystem (PDS) had significant positive influence on the consumption ofenergy, as observed in the case of protein. This could be largely due to ricesupplied through PDS. Interestingly, the presence of children in the householdhas a significant negative influence on per capita consumption of energy. Aschildren are given priority, food prepared in the family was not as adequate

33
Table 10. Versions of regression tried
Version Constant Rice Milk and Milk Family Total Log Total Nutrition Woman Childrenarea animal Expend. Size Expend. Total PDS KnowledgeEducation dummy
(acre) prod. (Rs.) (No.) (Rs.) Expend. (Rs.) (Score) (Score)expend.
Version 1 √ √ √ √ √ √ √ √Version 2 √ √ √ √ √ √Version 3 √ √ √ √ √ √Version 4* √ √ √ √ √ √ √ √ √
Note: *Selected for reporting

34
Table 11. Factors influencing per capita consumption of protein and energy in different production systems
Production Variable Particulars Constant Rice Milk Family Total Total Nutrition Woman ChildrenSystem area (acre) Expend. Size Expend. PDS Knowledge Education dummy
(Rs.) (No.) (Rs.) (Rs.) (Score) (Score)
Rice Protein Coefficient 34.28229 -4.91132 -15.539 -0.78631 1.97E-04 4.05E-03 0.131195 -8.83E-02 -4.80677
t-value 5.883 1.796 0.884 0.995 1.480 2.14* 0.501 0.699 2.416*
R-Squared =.349047 , N = 60, F Statistics =3.42**, Version = 4
Energy Coefficient 1484.642 -186.802 -91.7159 -3.48035 3.14E-03 0.149932 9.308059 -1.63713 -285.159
t-value 6.07 1.628 0.124 0.105 0.564 2.161* 0.847 0.309 3.415**R-Squared =.346311, N= 60, F Statistics =3.38** Version = 4
Vegetable Protein Coefficient 28.94188 -1.64942 30.54934 0.449696 6.57E-05 2.27E-03 -3.45E-02 0.100629 -8.19538t-value 3.659 0.351 1.140 0.618 0.738 1.062 0.157 0.750 4.112*R-squared = .284537, N= 60, F Statistics = 2.54* , Version = 4
Energy Coefficient 1188.993 32.212 13.576. 13.99 .398E-02 .147 -2.366 5.514 -391.421t-value 3.592 .164 1.211 .459 1.069 1.684 .260 .982 -4.695**
R-squared = 0.344866, N=60, F Statistics = 3.36** ,Version = 4
Sugarcane Protein Coefficient 33.528 .172 -2.351 -1.015 .116 .197 .368 -.129 -7.966t-value 6.760 .073 .183 1.622 1.109 .008 2.182* 1.164 5.208**
R-squared = .542070, N=60, F Statistics = 7.55**, Version = 4
Energy Coefficient 1462.962 -9.108 1.287 -40.900 .677 .607E-01 13.52 -5.14 1.234t-value 7.817 .103 .003 1.733 1.721 .687 2.179* -359.700 6.233**
R-squared = .620884, N=60, F Statistics = 10.44**, Version = 4
Note: * and ** denote significance at 5% and 1 % respectively
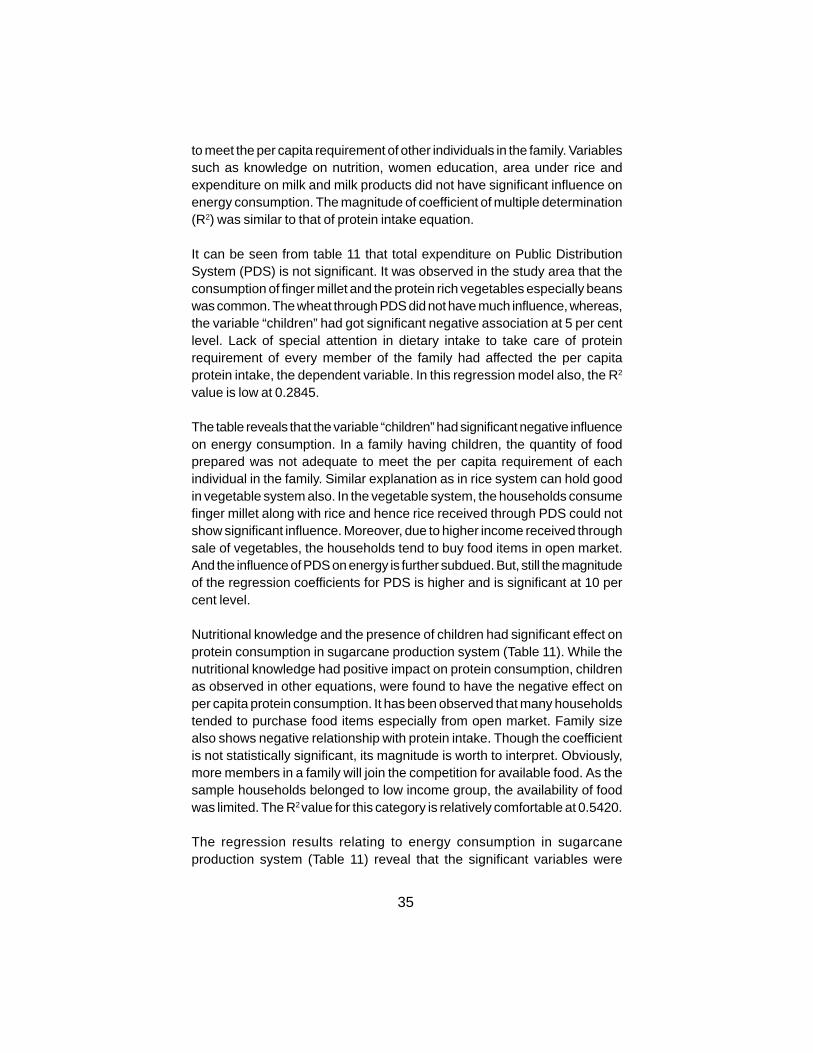
35
to meet the per capita requirement of other individuals in the family. Variablessuch as knowledge on nutrition, women education, area under rice andexpenditure on milk and milk products did not have significant influence onenergy consumption. The magnitude of coefficient of multiple determination(R2) was similar to that of protein intake equation.
It can be seen from table 11 that total expenditure on Public DistributionSystem (PDS) is not significant. It was observed in the study area that theconsumption of finger millet and the protein rich vegetables especially beanswas common. The wheat through PDS did not have much influence, whereas,the variable “children” had got significant negative association at 5 per centlevel. Lack of special attention in dietary intake to take care of proteinrequirement of every member of the family had affected the per capitaprotein intake, the dependent variable. In this regression model also, the R2
value is low at 0.2845.
The table reveals that the variable “children” had significant negative influenceon energy consumption. In a family having children, the quantity of foodprepared was not adequate to meet the per capita requirement of eachindividual in the family. Similar explanation as in rice system can hold goodin vegetable system also. In the vegetable system, the households consumefinger millet along with rice and hence rice received through PDS could notshow significant influence. Moreover, due to higher income received throughsale of vegetables, the households tend to buy food items in open market.And the influence of PDS on energy is further subdued. But, still the magnitudeof the regression coefficients for PDS is higher and is significant at 10 percent level.
Nutritional knowledge and the presence of children had significant effect onprotein consumption in sugarcane production system (Table 11). While thenutritional knowledge had positive impact on protein consumption, childrenas observed in other equations, were found to have the negative effect onper capita protein consumption. It has been observed that many householdstended to purchase food items especially from open market. Family sizealso shows negative relationship with protein intake. Though the coefficientis not statistically significant, its magnitude is worth to interpret. Obviously,more members in a family will join the competition for available food. As thesample households belonged to low income group, the availability of foodwas limited. The R2 value for this category is relatively comfortable at 0.5420.
The regression results relating to energy consumption in sugarcaneproduction system (Table 11) reveal that the significant variables were

36
children-dummy, and nutrition-knowledge. While total expenditure hadpositive influence, family size had adverse impact on energy consumptionin this system. The model results are much better with higher R2 value at0.6208.
5.2. Frequency of consumption of GLVs, vegetables andfruits
The food frequency is another method of assessing the pattern of foodintake especially for fruits and vegetables. A food frequency method countshow often certain food items are taken in a specific period of time. Unlikeother dietary methods, such as 24-hour recall, a semi-quantitative foodfrequency method does not estimate the precise amount of nutrient intake.It can, however, be used to predict whether or not the nutritional deficiencyis prevailing in the area (Rosen et al. 1993). This methodology has beenused to find out the production system influence on the frequency ofconsumption of fruits and vegetables.
For selected food items, the frequency of their consumption was inquiredfrom the respondent households for each production system and thecategory- wise results are presented in Table 12. The data indicate that,generally, daily consumption of GLVs, vegetables and fruits was low, giventhe fact that these were low-income families. Only exception was ripenedtomato, which was the most popular vegetable in the study region. But,most of the households consumed it weekly. A closer examination of figuresconfirms that there was not much variation across production systems infrequency of consumption of GLVs, vegetables and fruits on weekly basis.A sizeable number of households were found to consume papaya once in amonth. Higher the frequency of consumption of GLVs, vegetables and fruits,more would be the micronutrients intake. Hence, specific policies andstrategies must be designed and implemented to increase their frequencyof consumption.
5.3. Nutritional knowledge of women
The maternal knowledge on nutrition is an important factor in influencingnutritional intake of household members. Although a direct evidence ofmisinformation about the proximate determinants of health of a pre-schoolchild and nutrition is limited, and largely anecdotal, much more systematicevidence has been found concerning the association between the health of

37
Table 12. Frequency of consumption of GLVs, vegetables and fruits
(% of households)*
Food Item Production Once Once Once OnceSystem a day a week a fortnight a month
FruitsBanana Rice 0.00 30.00 57.50 12.50
Vegetable 5.00 65.00 20.00 10.00Sugarcane 3.70 51.85 37.04 7.41
Mango Rice 10.64 85.11 4.26 0.00Vegetable 5.17 94.83 0.00 0.00Sugarcane 12.50 87.50 0.00 0.00
Papaya Rice 0.00 50.00 12.50 37.50Vegetable 0.00 50.00 30.00 20.00Sugarcane 0.00 36.36 18.18 45.45
Tomato Rice 91.53 8.47 0.00 0.00Vegetable 95.00 5.00 0.00 0.00Sugarcane 87.93 8.62 3.45 0.00
GLVsAgathi Rice 0.00 100.00 0.00 0.00
Vegetable 0.00 85.71 14.29 0.00Sugarcane 0.00 92.86 0.00 7.14
Amaranthus Rice 0.00 76.19 19.05 4.76Vegetable 0.00 90.48 7.14 2.38Sugarcane 0.00 93.75 0.00 6.25
Cabbage Rice 0.00 100.00 0.00 0.00Vegetable 5.08 94.92 0.00 0.00Sugarcane 0.00 97.30 0.00 2.70
Drumstic leaves Rice 0.00 100.00 0.00 0.00Vegetable 0.00 100.00 0.00 0.00Sugarcane 0.00 100.00 0.00 0.00
VegetablesBeans Rice 0.00 97.22 0.00 2.78(Scarlet runner) Vegetable 19.23 80.77 0.00 0.00
Sugarcane 0.00 100.00 0.00 0.00Brinjal Rice 15.25 84.75 0.00 0.00
Vegetable 11.86 88.14 0.00 0.00Sugarcane 15.00 81.67 3.33 0.00
Cauliflower Rice 0.00 100.00 0.00 0.00Vegetable 10.17 88.14 1.69 0.00Sugarcane 0.00 100.00 0.00 0.00
Moringa Rice 8.33 83.33 8.33 0.00Vegetable 0.00 100.00 0.00 0.00Sugarcane 11.11 55.56 33.33 0.00
Roots and TubersBeetroot Rice 0.00 92.00 4.00 4.00
Vegetable 0.00 95.00 0.00 5.00Sugarcane 0.00 75.00 6.25 18.75
Note: * In each production system, for sixty households to which percentage hasbeen worked out.

38
a pre-school child and nutrition education, particularly maternal education(Behrman, 1995). In this study, the women household heads were asked toprovide responses to a set of fifty questions related to nutrition and then thescores were computed for each respondent. It can be inferred from Figure 3that in all production systems most of the respondents had low level ofknowledge. Within these systems, the knowledge level was relatively betterin the vegetable production system followed by the rice system.
5.4. Share of kind wages in income
Studies conducted elsewhere indicate that the income control by the womendo influence the pattern of food consumption in the household. In this context,the kind wages have better chances of directly benefiting the food intake of,particularly, the labor households. Sometimes, the cash income has thedisadvantage that sufficient proportion is diverted to non-food expenditure,especially, when the income control is dominated by the male householdmember. This study reveals that in the vegetable production system, therewere diversified sources of kind wages in terms of food groups. In the othersystems, kind wages were mainly given as rice (Figure 4).
0
20
40
60
80
100
120
Kno
wle
dge
Sco
re
MEDIUM(>50)
LOW(25-50)
VERY LOW(<25)
Figure 3. Nutritional knowledge of women
Rice
Vegetables
Sugarcane
Production Systems

39
0
20
40
60
80
100
120
Res
po
nd
ents
% Roots and Tubers
Nuts and oil seeds
Leafy vegetables
Other Vegetables
Cereals
Figure 4. Kind wages in different production systems
Rice Vegetables Sugarcane
Production Systems

40
6. CONSUMPTION EXPENDITUREBEHAVIOR
6.1. Share of food and non-food expenditure byhouseholds
One of the objectives of this study was to find the relationship betweenincome and consumption of different commodities and to know how thesechange with the income and socio-economic characteristics of households.These relationships were estimated for individual commodities. Total percapita expenditure was used as a proxy for income and Engel relationswere estimated in budget share form using the variant of the Working- LeserModel.
The household expenditure was worked out on annual basis to estimate theequation. A number of socio-economic variables influence the householdexpenditure. Those included in the model are size and composition of thefamily, the age and education of the household head, farm size and thepresence of homestead garden. The equations were specified and estimatedin a way that ensured the usual adding-up requirements.
The food and non-food expenditure analysis revealed that the share of foodexpenditure was lower in the vegetable production system, than in otherproduction systems. (Figure 5). This is in conformity with Engel function,which states that as the income level increases the share of food expenditure
Figure 5. Share of food and non-food expenditure
Exp
end
itu
re S
har
e %
Production Systems
Rice Vegetables Sugarcane
150
100
50
0
Non-food Expenditure
Food Expenditure

41
decreases. The absolute value of food expenditure per household was foundmore in the vegetable system than in rice and sugarcane systems.
6.2. Expenditure behavior of households
In the study district of Dharmapuri, it was observed that people used toconsumed different food commodities but largely confined to select cereals,pulses and vegetables. To study the expenditure pattern, 11 food items andeight non-food items were considered. As the households are generallypoor, detailed analysis of food items could not be taken up for many of thehouseholds, only zero values were obtained. That is why, the food itemswere grouped into other cereals, pulses, fruits and vegetables. Ifdisaggregated, we get only a few observations for some food items, withwhich it was difficult to estimate the Engel curves for these items.
The expenditure behavior of average households in three production systemsof Dharmapuri district is summarized in Table 13. It reports average budgetshare, marginal budget share and expenditure elasticity. These results wereobtained using the mathematical equations as presented in chapter onmethodology. The values reported here were evaluated at the sample meanvalues for total expenditure E and all the household Z
j variables.
In the rice production system, 64 per cent of the total expenditure was onfood items, and the rest on non-food items. Among food expenditure, thehighest share was on rice followed by oil. In the vegetable system, expenditureon finger millet received the highest share followed by milk and milk products.Amongst different production systems, the share of vegetable expenditurewas the highest in the vegetable production system. In sugarcane system, ahigher share was for rice followed by milk and milk products. Among non-food expenditure share, across the production systems, health careexpenditure was the highest in all the three systems; and amongst systemthe sugarcane system was at the top than other production systems. Shareon clothing was more in the vegetable production system than the rest.There was a remarkable similarity in the expenditures on health care andsocial obligations across the production systems.
The Marginal Budget Share (MBS) indicates the budget share of a particularcommodity allocated from the incremental income. In the rice system, thoughrice accounted for the largest share of consumption expenditure of all thefood items, yet its marginal budget share turned out to be negative. Marginalbudget share was the highest in the case of milk and milk products in the

42
Table 13. Expenditure behavior for foods and non-foods of the average household in different production systems
Average Budget Share (%) Marginal Budget Share (%) Expenditure Elasticity
Rice Vegetable Sugar- Rice Vegetable Sugar- Rice Vegetable Sugar-cane cane cane
Food groupRice 17.02 5.67 10.12 -6.16 -6.72 31.97 -0.36 -1.19 3.16Finger millet 4.64 9.95 5.30 8.08 -17.55 14.63 1.74 -1.76 -2.76Other cereals 2.83 1.41 3.12 0.65 0.81 -28.97 0.23 0.57 -9.28Pulses 5.51 7.16 5.19 -2.89 -3.10 2.51 -0.52 -0.43 0.48Vegetables 2.78 7.00 4.81 5.84 2.91 4.60 2.10 0.42 0.96Fruits 4.16 2.54 4.42 7.42 3.15 13.37 1.78 1.24 3.02Oil 7.91 5.58 7.44 1.93 12.35 -3.69 0.24 2.21 -0.50Milk and milk products 7.31 9.50 8.20 11.68 8.55 -24.13 1.60 0.90 -3.14Animal products 5.05 7.44 5.18 7.30 8.59 9.76 1.45 1.15 1.88Sugar 1.68 1.44 1.59 0.08 1.09 -9.04 0.05 0.76 -5.81Miscellaneous 5.15 5.50 5.62 -5.20 -1.55 20.94 -1.01 -0.28 3.73
Sub total 64.04 63.19 60.98
Non-food groupEducation 3.38 2.40 3.84 19.08 18.08 25.13 5.64 7.53 6.28Social obligation 9.75 8.32 8.76 1.57 5.54 -4.11 0.16 0.67 -0.48Health 9.56 9.41 11.63 33.55 30.44 43.28 3.51 3.23 6.28Transport 3.77 2.83 3.54 1.34 2.59 -5.24 0.36 0.92 -1.48Fuel 1.00 1.01 1.02 0.20 2.22 3.09 0.20 2.20 3.03Clothing 2.07 8.23 4.14 4.31 20.03 23.83 2.08 2.43 5.76Others 6.42 4.60 6.18 11.21 12.56 14.21 1.75 2.73 2.30
Sub total 35.95 36.80 39.11

43
rice system. This means, if an average household gets one rupee additionalincome, it will allocate 11.68 paise to purchase milk and milk products. In thevegetable system, finger millet expenditure was the highest but its MBSwas negative. It shows, as the income increased, the finger millet expendituredecreased. As income increased the consumption pattern shifted towardsoil, milk and milk products and animal products. It was because peopleconsidered these products superior to finger millet. The MBS for rice wasthe highest in sugarcane production system. Among non-food groups, healthcare expenditure was the highest across the production systems. One ofthe reasons in the sugarcane system could be consuming unbalanced foodleading to nutrition deficiency and other health problems. Fortunately, thehigher income from cash crop supported the need for increased healthcare.
Expenditure elasticity indicates the percentage increase in the budget shareof a specific item for a given percentage increase in total expenditure(household income). In the case of food groups, the expenditure elasticityranged from -0.36 to 2.10 in the rice system, whereas in vegetable system,from -0.28 to 0.57 in the vegetable system, and from -0.50 to 3.73 in thesugarcane system. As far non-food group was concerned, in the rice system,it ranged from 0.16 to 5.64. In the vegetable system, it was between 0.67and 7.53. In the sugarcane system, minimum value was -0.48 and themaximum 6.28.
Some general observations also emerged from this study. In the riceproduction, though the expenditure on rice was the highest, yet itsmarginal budget share and expenditure elasticity turned out to be negative.As income increased, people spent their incremental income on milkand milk products, animal products and vegetables, as they became moreincome elastic (positive MBS) as well as expenditure elastic. It implies thatas income increases households diversify their food products, indicating arise in the standard of living. Furthe, since marginal budget share andexpenditure elasticity of pulses were negative, milk and milk products andanimal products became substitutes so as to supplement protein in thedietary intake.
Of the non-food items, education, health, clothing and others wereexpenditure elastic. On account of increasing awareness among the peopleto reduce wasteful expenditure on social ceremonies such as festivals,marriages etc., people spent relatively less amount on social obligations.The other point to be remembered is that the respondents were marginal,small farmers and agricultural laborers who were resource poor. So, it is

44
obvious that they tend to spend more on essential items than on extravagantitems. Interestingly social obligation turned expenditure inelastic (0.16 to –0.47) across all these production systems.
The effect of household characteristics on average budget shares forselected commodities was examined in different production systems. Thechanges in the average budget shares for the average household in therice, vegetable and sugarcane systems are given in Table 14, 15 and 16,respectively with a change in each of the Zi variables.
In the rice system, total expenditure had a significant but negative influenceon rice consumption but had positive and significant influence on vegetableconsumption. This means that as income increased, people spent more onvegetables and reduced rice consumption. The land size increased theconsumption of oil. The education of household head discouraged fingermillet consumption. Children’s strength in a family reduced per capitaexpenditure on vegetables, due to more competition for vegetables. Familysize had a negative influence on pulses intake. Homestead garden hadpositively influenced the consumption of fruits and vegetables. In non-foodgroup, education, and family size had got significant negative relationship.Table 14 shows that land size and higher proportion of women led to higherspending on social obligations. Education of household head had a positiveeffect on expenditure on clothing (Table 14).
In the case of vegetable production system, land size had positive influenceon intake of rice, pulses, vegetables and fruits but negative towards fingermillet. Quite unexpectedly, land size negatively influenced the expenditureon animal products, which might be due to the diversion of their ownproduction to markets to realize more cash for day to day running ofhousehold. Education of family head had a positive impact on consumptionof other cereals and sugar. The family size had positively influenced theexpenditure on rice and vegetables. And the presence of more women inthe family caused more intake of finger millet. Due to social norms men andchildren, were given priority while serving rice-based food items, whereas,women consumed inferior cereals. Homestead garden, as expected hadinfluenced positively the intake of vegetables and fruits. Higher familyearnings reflected in more consumption of rice, fruits and reduction inconsumption of finger millet. Among non-food items, the higher incomeinfluenced positively the spending on health and fuel. Among non-foodexpenditure, the increase in family size had a negative impact on expenditureon clothing. Higher the proportion of women in a household, clothing

45
expenditure increased. Higher proportion of earning members made peopleto spend more on transport and entertainment (Table 15).
In the sugarcane system, increase in land resulted in greater share in pulses,oils and clothing but had a negative influence on other cereals. Education offamily head, showed had positive link with milk and milk products but it wasreverse with respect to sugar, transport and entertainment, and clothing.Age of the head of a household, revealed a negative relationship with fruits,animal products and social obligations. Proportion of women had positiveeffect on social obligations but negative with respect to fuel. Homesteadgarden had positive relationship with pulses, vegetables, oils and education.Proportion of earning members had positive bearing on oil, milk and milkproducts and education. It may be that more family members go to low paidwork to add to the family income but at the cost of education (Table 16).
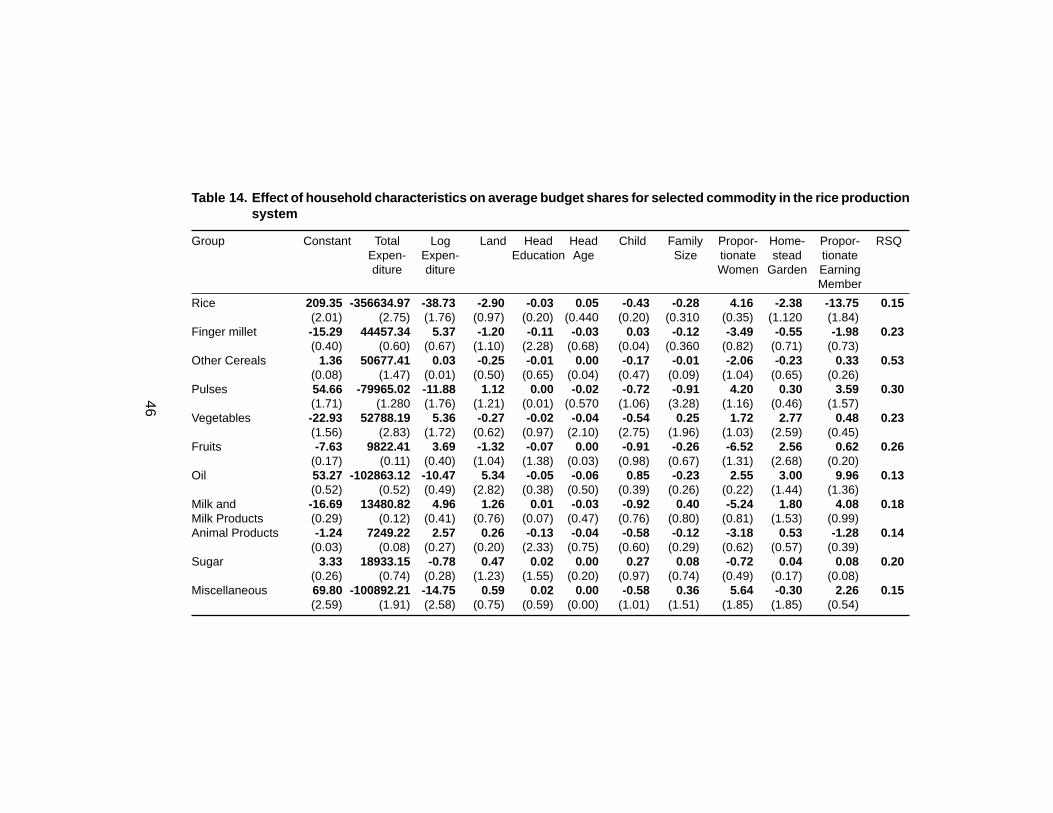
46
Table 14. Effect of household characteristics on average budget shares for selected commodity in the rice productionsystem
Group Constant Total Log Land Head Head Child Family Propor- Home- Propor- RSQExpen- Expen- Education Age Size tionate stead tionatediture diture Women Garden Earning
Member
Rice 209.35 -356634.97 -38.73 -2.90 -0.03 0.05 -0.43 -0.28 4.16 -2.38 -13.75 0.15(2.01) (2.75) (1.76) (0.97) (0.20) (0.440 (0.20) (0.310 (0.35) (1.120 (1.84)
Finger millet -15.29 44457.34 5.37 -1.20 -0.11 -0.03 0.03 -0.12 -3.49 -0.55 -1.98 0.23(0.40) (0.60) (0.67) (1.10) (2.28) (0.68) (0.04) (0.360 (0.82) (0.71) (0.73)
Other Cereals 1.36 50677.41 0.03 -0.25 -0.01 0.00 -0.17 -0.01 -2.06 -0.23 0.33 0.53(0.08) (1.47) (0.01) (0.50) (0.65) (0.04) (0.47) (0.09) (1.04) (0.65) (0.26)
Pulses 54.66 -79965.02 -11.88 1.12 0.00 -0.02 -0.72 -0.91 4.20 0.30 3.59 0.30(1.71) (1.280 (1.76) (1.21) (0.01) (0.570 (1.06) (3.28) (1.16) (0.46) (1.57)
Vegetables -22.93 52788.19 5.36 -0.27 -0.02 -0.04 -0.54 0.25 1.72 2.77 0.48 0.23(1.56) (2.83) (1.72) (0.62) (0.97) (2.10) (2.75) (1.96) (1.03) (2.59) (0.45)
Fruits -7.63 9822.41 3.69 -1.32 -0.07 0.00 -0.91 -0.26 -6.52 2.56 0.62 0.26(0.17) (0.11) (0.40) (1.04) (1.38) (0.03) (0.98) (0.67) (1.31) (2.68) (0.20)
Oil 53.27 -102863.12 -10.47 5.34 -0.05 -0.06 0.85 -0.23 2.55 3.00 9.96 0.13(0.52) (0.52) (0.49) (2.82) (0.38) (0.50) (0.39) (0.26) (0.22) (1.44) (1.36)
Milk and -16.69 13480.82 4.96 1.26 0.01 -0.03 -0.92 0.40 -5.24 1.80 4.08 0.18Milk Products (0.29) (0.12) (0.41) (0.76) (0.07) (0.47) (0.76) (0.80) (0.81) (1.53) (0.99)Animal Products -1.24 7249.22 2.57 0.26 -0.13 -0.04 -0.58 -0.12 -3.18 0.53 -1.28 0.14
(0.03) (0.08) (0.27) (0.20) (2.33) (0.75) (0.60) (0.29) (0.62) (0.57) (0.39)Sugar 3.33 18933.15 -0.78 0.47 0.02 0.00 0.27 0.08 -0.72 0.04 0.08 0.20
(0.26) (0.74) (0.28) (1.23) (1.55) (0.20) (0.97) (0.74) (0.49) (0.17) (0.08)Miscellaneous 69.80 -100892.21 -14.75 0.59 0.02 0.00 -0.58 0.36 5.64 -0.30 2.26 0.15
(2.59) (1.91) (2.58) (0.75) (0.59) (0.00) (1.01) (1.51) (1.85) (1.85) (0.54)

47
Table 14. (Contd.)
Group Constant Total Log Land Head Head Child Family Propor- Home- Propor- RSQExpen- Expen- Education Age Size tionate stead tionatediture diture Women Garden Earning
Member
Education -98.82 157967.30 22.59 0.53 0.02 0.03 -0.72 -0.78 -5.82 2.52 -1.58 0.31(1.96) (1.60) (2.12) (0.36) (0.37) (0.48) (0.67) (2.78) (1.02) (2.45) (0.44)
Social Obligations 73.23 -126006.29 -13.67 2.86 -0.02 -0.04 0.63 -0.14 11.50 -0.34 -0.56 0.30(1.72) (1.51) (1.52) (2.33) (0.36) (0.88) (0.71) (0.37) (2.39) (0.40) (0.18)
Health -147.40 204814.97 32.93 -2.72 0.12 0.06 3.00 -0.25 1.57 -2.21 2.85 0.17(1.42) (1.01) (1.50) (0.91) (0.92) (0.47) (1.37) (0.28) (0.13) (1.04) (0.38)
Transport andEntertainment -0.53 56483.62 0.04 0.98 0.04 0.01 0.15 0.27 -3.08 -0.18 -0.01 0.17
(0.02) (0.94) (0.01) (1.11) (1.04) (0.29) (0.23) (1.02) (0.89) (0.29) (0.00)Fuel 2.29 8141.94 -0.45 -0.07 0.00 0.00 -0.09 0.04 0.20 -0.10 0.64 0.58
(0.44) (0.80) (0.41) (0.49) (0.46) (0.21) (0.82) (0.78) (0.35) (0.98) (1.72)Clothing -23.97 60674.43 4.89 -1.17 0.10 0.03 0.05 0.15 0.88 -0.71 -1.03 0.21
(0.87) (1.13) (0.84) (1.47) (2.93) (0.07) (0.09) (0.62) (0.28) (1.26) (0.52)Others -32.80 80870.81 8.32 -2.96 0.11 0.08 0.68 -0.28 -2.28 0.14 -4.70 0.18
(0.70) (0.88) (0.84) (2.18) (1.91) (1.46) (0.68) (0.69) (0.43) (0.15) (1.39)
Note: Figures in parentheses indicate |t| ratios

48
Table 15. Effect of household characteristics on average budget shares for selected commodity in the vegetableproduction system
Group Constant Total Log Land Head Head Child Family Propor- Home- Propor- RSQExpen- Expen- Education Age Size tionate stead tionatediture diture Women Garden Earning
Member
Rice 55.94 -15129.53 -12.92 2.94 0.01 -0.06 -0.07 1.03 1.22 2.14 6.67 0.23(0.66) (0.06) (0.75) (2.23) (0.12) (1.10) (0.06) (2.50) (0.23) (1.77) (2.12)
Finger millet 228.01 -495040.88 -47.10 -1.91 0.07 0.15 0.89 0.70 7.61 1.01 -4.94 0.40(3.35) (2.49) (3.41) (2.80) (1.61) (3.08) (0.99) (2.11) (2.75) (1.04) (2.96)
Other Cereals 0.55 16123.04 -0.03 -0.02 0.01 0.01 0.08 -0.02 0.61 -0.15 0.04 0.33(0.07) (0.70) (0.02) (0.15) (2.14) (0.96) (0.81) (0.46) (1.21) (1.31) (0.13)
Pulses 64.02 -47654.23 -11.95 2.22 0.01 -0.05 -0.74 0.08 2.15 -2.53 -2.23 0.27(0.83) (0.21) (0.77) (2.87) (0.29) (1.02) (0.73) (0.22) (0.44) (2.31) (0.79)
Vegetables -44.17 329835.67 7.63 1.79 0.05 0.02 0.36 0.52 -2.29 1.87 1.98 0.33(-0.82) (2.10) (0.70) (2.14) (1.56) (0.53) (0.51) (2.01) (-0.67) (2.30) (1.00)
Fruits 6.74 -52363.10 -1.25 2.21 0.05 -0.02 -0.27 0.23 3.81 1.47 5.37 0.32(0.11) (0.30) (0.10) (2.36) (1.41) (0.40) (0.33) (0.78) (0.99) (2.54) (2.40)
Oil 183.88 -525034.15 -36.58 -0.19 0.00 0.08 0.63 0.01 1.38 2.39 -2.03 0.27(2.47) (2.41) (2.42) (0.17) (0.04) (1.58) (0.64) (0.03) (0.29) (2.25) (0.74)
Milk and 107.29 -138078.06 -20.43 -1.28 -0.01 -0.03 -1.31 -0.26 12.09 -0.88 -3.13 0.49Milk Products (1.82) (0.80) (1.71) (1.40) (0.37) (0.67) (1.69) (0.91) (3.22) (1.04) (1.43)Animal Products 30.40 34317.00 -5.62 -1.88 0.01 0.05 -0.05 -0.08 -0.53 0.08 0.96 0.55
(0.78) (0.30) (0.71) (3.11) (0.43) (1.69) (0.10) (0.41) (0.22) (0.15) (0.67)Sugar -0.95 46545.79 0.02 0.28 0.03 0.00 0.07 0.08 1.20 -0.10 -0.35 0.26
(0.05) (0.85) (0.00) (0.95) (2.90) (0.33) (0.27) (0.92) (0.28) (0.36) (0.50)Miscellaneous 11.34 126688.25 -2.56 0.38 -0.01 -0.01 -0.93 0.25 2.18 0.49 -0.48 0.42
(0.33) (1.26) (0.37) (0.71) (0.36) (0.51) (2.05) (1.51) (0.99) (0.92) (0.37)

49
Table 15. (Contd.)
Group Constant Total Log Land Head Head Child Family Propor- Home- Propor- RSQExpen- Expen- Education Age Size tionate stead tionatediture diture Women Garden Earning
Member
Education 43.56 -187828.03 -7.00 -0.26 0.04 -0.05 -1.91 0.07 -1.30 -1.03 -0.53 0.24(0.76) (1.12) (0.60) (0.29) (0.99) (1.37) (2.53) (0.25) (0.36) (1.27) (0.25)
Social Obligations 51.26 -26048.34 -9.22 -0.65 -0.02 -0.01 -0.16 0.04 -1.25 0.12 0.76 0.62(2.09) (-0.36) (-1.85) (-1.72) (-1.16) (-0.75) (-0.50) (0.37) (-0.80) (0.35) (0.84)
Health -968.87 2288095.63 202.35 4.17 -0.17 -0.16 -0.62 -0.02 1.78 -3.61 1.77 0.69(7.91) (6.39) (8.14) (2.19) (2.20) (1.90) (0.39) (0.03) (0.23) (2.07) (0.39)
Transport and 38.05 -68100.88 -7.85 1.67 0.03 -0.03 0.18 0.21 -0.27 0.12 2.55 0.28Entertainment (1.08) (0.66) (1.10) (3.07) (1.26) (1.10) (0.39) (1.22) (0.12) (0.24) (2.25)Fuel -1.22 31917.61 0.23 0.07 0.00 0.00 0.02 0.01 0.13 0.06 0.01 0.61
(0.29) (2.59) (0.27) (1.14) (0.94) (0.88) (0.37) (0.53) (0.47) (0.95) (0.05)Clothing 332.80 -1402851.89 -56.56 -3.06 -0.08 0.03 3.33 -2.46 28.06 1.95 -5.01 0.41
(1.95) (2.81) (1.63) (1.16) (0.79) (0.24) (1.48) (2.97) (2.58) (0.80) (0.79)Others -38.63 84606.09 8.84 -2.05 -0.03 0.11 0.51 -0.41 0.42 -0.43 -1.41 0.16
(0.50) (0.37) (0.56) (1.69) (0.53) (2.05) (0.50) (1.08) (0.09) (0.38) (0.49)
Note: Figures in parentheses indicate |t| ratios.

50
Table16. Effect of household characteristics on average budget shares for selected commodity in the sugarcaneproduction system
Group Constant Total Log Land Head Head Child Family Propor- Home- Propor- RSQExpen- Expen- Education Age Size tionate stead tionatediture diture Women Garden Earning
Member
Rice -66.26 0.00 17.62 -3.12 0.01 -0.08 -1.78 1.50 10.53 0.43 -1.68 0.0902(0.45) (0.25) (0.47) (1.04) (0.08) (0.74) (0.75) (1.43) (0.93) (0.15) (0.23)
Finger millet -14.08 0.00 5.40 -0.77 0.02 0.03 0.98 -0.04 -3.72 0.91 -1.00 0.1534(0.29) (0.70) (0.44) (0.77) (0.57) (0.75) (1.25) (0.11) (1.00) (0.93) (0.42)
Other Cereals 98.67 0.00 -23.94 -1.20 0.00 0.00 -0.24 0.21 1.61 -0.99 0.74 0.7791(4.68) (3.27) (4.38) (2.77) (0.04) (0.20) (0.70) (1.42) (0.98) (2.31) (0.71)
Pulses 9.60 0.00 -2.57 2.28 0.05 0.03 -1.08 0.86 0.83 1.18 0.98 0.3387(0.22) (0.02) (0.22) (2.50) (1.37) (0.84) (1.50) (2.71) (0.24) (2.31) (0.44)
Vegetables 6.44 0.00 -0.96 1.28 0.04 0.02 0.29 0.19 -0.29 1.37 0.21 0.3012(0.16) (0.16) (0.09) (1.55) (1.26) (0.77) (0.44) (0.66) (0.09) (2.68) (0.11)
Fruits -11.08 0.00 5.27 -0.98 0.01 -0.07 -0.50 0.23 -0.46 3.75 -2.22 0.3394(0.25) (0.72) (0.46) (1.08) (0.27) (2.25) (0.70) (0.73) (0.14) (1.84) (1.02)
Oil 19.89 0.00 -5.88 9.20 0.09 0.02 -1.26 -0.29 2.37 3.74 8.23 0.5425(0.21) (0.48) (0.24) (4.80) (1.12) (0.27) (0.83) (0.44) (0.33) (2.49) (2.78)
Milk and 88.50 0.00 -22.42 1.92 0.20 -0.02 -0.82 0.77 -9.56 -1.13 8.33 0.2282Milk Products (1.01) (1.13) (-0.99) (1.06) (2.54) (-0.24) (-0.58) (1.22) (-1.40) (-0.64) (2‘.91)Animal Products -5.71 0.00 3.17 -1.40 0.01 -0.06 -0.32 0.42 4.99 0.37 -3.38 0.1952
(0.14) (0.29) (0.29) (1.62) (0.39) (2.39) (0.47) (1.38) (1.53) (0.43) (1.62)Sugar 29.96 0.00 -7.33 0.34 -0.02 0.02 0.17 -0.09 -0.49 -0.55 0.47 0.3311
(2.30) (2.17) (2.17) (1.25) (2.84) (1.60) (0.78) (0.93) (0.48) (2.06) (0.73)Miscellaneous -29.12 0.00 9.09 0.59 0.01 0.05 -0.41 0.17 -0.72 -0.91 -2.21 0.3447
(0.91) (1.66) (1.09) (0.89) (0.36) (1.88) (0.79) (0.73) (0.29) (1.39) (1.39)

51
Table 16. (Contd.)
Group Constant Total Log Land Head Head Child Family Propor- Home- Propor- RSQExpen- Expen- Education Age Size tionate stead tionatediture diture Women Garden Earning
Member
Education -119.97 0.00 35.04 -0.63 -0.12 -0.05 -0.12 -0.69 0.39 3.46 10.10 0.1936(1.17) (1.54) (1.32) (0.29) (1.35) (0.69) (0.07) (0.94) (0.05) (1.66) (2.98)
Social Obligations 56.55 0.00 -11.75 0.85 0.02 -0.04 -0.60 0.66 4.33 -0.09 -0.83 0.5251(2.07) (0.35) (1.66) (1.51) (0.70) (2.36) (1.34) (3.40) (2.24) (0.16) (0.61)
Health -166.21 0.00 43.56 -4.99 -0.09 0.03 2.70 -1.96 6.85 -0.36 10.53 0.2634(1.04) (0.50) (1.06) (1.52) (0.64) (0.25) (1.04) (1.72) (0.55) (0.11) (1.33)
Transport and 25.93 0.00 -5.95 1.13 -0.08 0.03 0.01 -0.06 -1.19 0.62 0.37 0.3040Entertainment (0.72) (0.65) (0.64) (1.52) (2.47) (1.00) (0.01) (0.24) (0.43) (0.85) (0.21)Fuel 17.15 0.00 -3.82 0.05 0.00 0.00 -0.06 -0.02 -0.49 0.06 -0.09 0.8152
(4.71) (1.61) (4.05) (0.62) (1.45) (0.56) (1.06) (0.62) (2.72) (0.82) (0.49)Clothing 137.12 0.00 -34.63 3.95 -0.22 0.02 2.22 -0.23 -4.67 2.13 -3.10 0.3696
(1.39) (2.01) (1.36) (2.94) (2.49) (0.32) (1.38) (0.33) (0.61) (1.07) (0.63)Others 22.62 0.00 0.11 -0.60 0.05 0.09 0.84 -1.62 -10.32 0.35 -5.25 0.3083
(0.20) (0.61) (0.00) (0.26) (0.52) (1.05) (0.46) (2.03) (1.19) (0.15) (0.95)
Note: Figures in parentheses indicate |t| ratios.

52
7. INSTITUTIONAL LINKAGES AMONGSTAGRICULTURE, HEALTH ANDNUTRITION DEPARTMENTS
Using the structured and non-structured interview methods and thesecondary data, the existing development programs being implemented bydifferent development departments and the linkages amongst them wereexamined, keeping in mind their potentiality for agriculture-basedinterventions in alleviating malnutrition. The salient observations arepresented in this section.
7.1. Health and nutrition intervention programs
At the block level, State Health Department runs Primary Health Centers(PHC). For every 5,000 population, one health sub-centre is functioningwhich is looked after by a Village Health Nurse (VHN). PHC is concentratingon health education, nutrition education, family welfare program, reproductionand child health program, disease eradication and immunization programsfor the better health of the society (Annexure 13).
The Directorate of Social Welfare implements Nutrition intervention programs.The Tamil Nadu Integrated Nutrition Project II (TINP), which was implementedwith the World Bank assistance in 318 blocks covering 24 districts of TamilNadu from 1991, came to a close in 1997. In continuation of TINP II, theGovernment of India gave its approval to implementation of World Bankassisted ICDS III project with effect from January 1998. The ICDS is beingimplemented in all the 318, Rural Blocks, 19500 centers in 24 districts. Theprogram details are presented in Annexure 14. These intervention programsare implemented through Anganvadi centres located at the grass root level.
There seems to be a considerable close linkage between health and nutritiondepartments/ programs. The officials of PHC and ICDS scheme have closeco-operation and are conducting their activities with mutual support. Blocklevel joint training programs are organized by Social Welfare Departmentfor health and nutrition workers and supervisors. At Health Sub Centre,VHN with the help of nutrition workers at Anganwadi centre provides variousservices for improving health and nutritional status of women and children(Annexure 15).

53
Functionaries from these departments jointly identify households at riskhaving malnourished children and women and facilitate improving theirnutritional status. The approach is primarily the distribution of vitamin tabletsand provision of nutritive food to some extent. To alleviate the micronutrientmalnutrition, the Anganwadi workers at village level educate the womenabout the importance of consumption of fruits and vegetables and greenleafy vegetables. For women having anemia, PHC doctors were found torecommend them to take more quantity of green leafy vegetables such asmoringa (Moringa oleifera).
Supplementary feeding programs being implemented by nutrition agenciesthrough Anganwadi centers revealed some weaknesses and the need forstrong linkages with agriculture and horticulture departments. For instance,in the supplementary feeding programs, at present Re.0.17 is being providedper child to Anganwadi centre for purchasing of vegetables. The Anganwadiworkers were of the perception that the financial assistance provided throughthe scheme was grossly inadequate to buy vegetables even from the localmarket. This constraint was more experienced in those villages which hadthe rice and sugarcane systems. Further, the Anganwadi workers had tobuy the vegetables from nearby markets, which were also not fresh. Tocounter such problems, nutrition gardening component was included in thefunctioning of Anganwadi centres. As per that, each Anganwadi centremaintains a nutrition garden around the centre. In monthly meetings,monitoring of kitchen gardening is done. On the advice of District Collector,horticulture department is supplying saplings to kitchen gardens. However,grass root level nutrition functionaries at Anganwadi centres have poortechnical know-how in the area of plant protection and maintenance ofnutrition garden. As a result, by and large, laying out and maintenance ofnutrition gardens near by Anganwadi centre was found to be poor. In mothersgroup meetings, women were educated on kitchen gardening andencouraged to establish nutritional gardens. But, for want of proper expertise,they were not in a position to properly guide the women to establish andmaintain the nutrition gardens. This kind of situation reflects the existingweak linkages between nutrition agencies and horticulture department.
7.2. Horticulture department development programs
Horticulture department is implementing various development schemes(Annexure 16), some of which are relevant for ensuring nutritional security.For instance, at present the department is implementing a scheme forpromoting nutritional gardening. In that scheme, around 50 households are

54
covered every year and seedlings worth of Rs.50 for each are distributed.The focus of the scheme is mainly on input distribution and not on sensitizingthe vulnerable households about the importance of nutritional gardening inimproving their access to nutritious food items. Unfortunately, extensionpersonnel were found to have inadequate knowledge on these aspects. Asa result, this aspect of the message was found missing during the technologytransfer to the farmers. The department identifies the scheme beneficiariesin general based on land size and community, i.e. mostly small, marginalfarmers and scheduled caste farmers. Since the scheme benefits can beextended to only a limited number of households, the nutritional vulnerabilityshould also to be considered as one of the criteria. While identifyingbeneficiary households,the ICDS scheme being implemented throughSocial Welfare Department and Primary Health Centers is identifyingnutritionally risky households for extending the benefits of nutritionalintervention scheme. At present, there is no proper arrangement for mutualsharing of database on these lists of beneficiaries who constitute weakersections of the community among development departments. As a resultthe most vulnerable and needy households may not necessarily avail thebenefits of the scheme.
7.3. Agriculture department development programs
The State Department of Agriculture is also implementing various schemes,which are beneficial to the weaker sections of the farming community(Annexure 17). Some of these schemes focus on the reduction in the inputcosts. Such schemes help these farmers to increase their farm productivityand earn more income. The agriculture department distributes some of theplant micronutrients, which are mainly recommended to the rice, minor millets,groundnut, sesame and sunflower at subsidized rate. The other program,which is of greater importance, is National Pulse Development Program(NPDP) being implemented by this department. The small and marginalfarmers are provided all assistance to increase the production and productivityof pulses like black gram, green gram, cow pea, etc.,
Another importance scheme is “Integrated Cereal Development Program”,whose objective to increase the area, production and productivity of cereals.Under this scheme, apart from paddy, millet seeds like pearl millet andfinger millet are distributed at subsidized rates. Though, the national nutritionalpolicy emphasizes the inclusion of nutritional objectives in developmentprograms including agricultural programs, at grass root level, at theimplementing level of agricultural developmental schemes, there seems to

55
be no specific strategy for inclusion of nutritionally at risk households fordistribution of subsidies, or technology transfer, aiming at improving of overallnutritional status those households. This is due to lack of sensitivity to theregional malnutrition concerns and the lack of linkage with nutritional agenciesof Directorate of Social Welfare.
7.4. Development programs of animal husbandrydepartment
This department is mainly providing healthcare services for cattle andimplements artificial insemination scheme for breed improvement. Thedepartment linkage with other departments in implementing programs isnegligible. During the discussion with the Department of Animal Husbandryofficials, it was revealed that availability of livestock feed was one of themain constraints and suggested that livestock fodder could be supplied atsubsidized rate to boost the milk yield. Though the possible interventionsthat can be taken up by the department of agriculture which can facilitate toboost up dairy and poultry sector is felt by the officials those needs/ ideasare yet to be put into to agriculture department as concrete proposals. Itwas observed that, the officials and grass root workers in the animalhusbandry department are yet to realize the potentiality of animal husbandrydepartment to play a proactive role to address the issues of nutrition in itsjurisdiction.
7.5. Block development office programs
Various state and central government schemes are being implementedthrough Block Development Officer (BDO) Office (Annexure 18). Theseschemes are mainly meant for poverty alleviation. BDO office in liaison withVillage Panchayat offers some employment opportunities. Some schemesprovide financial focus on improvement of health and sanitation in thecommunity for instance, providing safe drinking water and providing financialassistance for construction of toilets. While prioritizing the region and thetarget groups for funding, BDO office and the Village Panchayat, thereseems to be no proper coordinated efforts with other developmentdepartments to address the nutritional security-related issues in the area ofoperation. At present, the role of these institutions in location-specificstrategies and integrating schemes for nutritional security of the communityis negligible.

56
7.6. Regional research station activities
In the study area, nearby sample village, at Paiyur, there is a RegionalResearch Station of Tamil Nadu Agricultural University. It mainly focuses onplant protection and productivity enhancement technologies. It was foundthat there were no specific research programs for addressing human nutritionrelated problems. As a result, there was absence of an integrated focus oninformation about nutritional status, agricultural development adequacyoptions for nutritional security.

57
8. CONCLUSIONS AND IMPLICATIONS
At present, the main component of alleviating nutrition intervention programsis supplementary feeding, which may not be cost-effective in the long run,whereas, agriculture-based nutritional interventions are sustainable. NationalNutritional Policy (1993) emphasizes on incorporating nutritional objectivesin agricultural development programs. But, its actual implementation requiressystematized efforts. Understanding of the nutrient intake pattern of ruralhouseholds in different agricultural production systems will signal the neededadjustments in agricultural development programs to address the nutritionalissues of at-risk households, apart from focusing the national food security.Therefore, the nutrient intake pattern was examined in different productionsystems viz., rice, vegetable and sugarcane. Further, the existing inter-institutional linkages among development departments for nutritionalinterventions were also studied and the scope for effective linkages wasexplored.
8.1. Production system wise food and nutrients intake
The analysis of data collected in the study revealed that, the food group-wise intake in general was lower than the RDA. Higher deficit was observedwith regard to consumption of fruits and vegetables. However, consumptionof these commodities was found better in the vegetable production systemthan in the rice and sugarcane systems. Children in the vegetable systemconsumed more pulses. A similar trend was observed in intake ofmicronutrients, i.e. intake of nutrients viz. iron, vitamin A and vitamin C werecomparatively higher in the vegetable system. This depicts the potential ofvegetable system in supporting healthy food to the weaker sections. Location-specific assessment is to be made on poor people’s nutritional security inthe rice and sugarcane systems and the needed adjustments are to becarried out.
The intra-household allocation of nutrients revealed no consciousdiscrimination of females. The general society norm that females shouldtake food only after male in a household seems to influence the femalenutrient intake to a large extent. Further, unawareness about the specialrequirements of nutrients for females due to age and other physiologicalfactors like pregnancy resulted in lower nutrient intake of females. It implieswhatever be the reason, women are more vulnerable to nutritional insecurity.

58
The factors influencing per capita protein and energy intake in differentproduction systems were found out using regression model. PublicDistribution Systems do serve the cause of nutritional security, especially inthe rice system for improved protein intake through wheat consumption.Region-specific PDS plan with regard to types of food commodities to bedistributed at nominal rate would help balanced dietary intake.
A higher number of children in a family increased competition for the availableprotein and energy across the productions systems. The number of childrenper household should be considered as one of the indicators for theidentification of ‘at-risk’ households. Nutrition knowledge has influencedpositively the per capita protein and energy intake in the sugarcane system.It was found that in farmers and agricultural laborer households, the cashincome flow was not directly translated into a higher consumption of nutrient-rich foods. Instead, it was diverted to non-food items, ignoring the householdnutrient requirements. One of the reasons for this was insufficient nutritionknowledge. Such a consumption behavior leads to increased healthexpenditure. Hence, the nutrition education was more crucial in non-vegetable systems.
The frequency of consumption of leafy and other vegetables was more inthe vegetable system. At the rural level, the production environmentinfluenced much on food habits of the households. In the non-vegetableproduction area, better market and transport infrastructure was to be createdfor increasing the access of households, especially for fruits and vegetables.Indigenous crops helped to improve the nutrient intake. Vegetable co-operative models that are successful in the urban environment could alsobe established with appropriate modification as needed by the rural settings.
Kind wages positively influenced the agricultural laborers’ nutrient intake invegetable system. Households’ receiving various types of vegetables askind wages (a part of total wage) and perks had opportunity for better nutrientintake. On the contrary, in most of the households which were receivingmostly cereals and/ or cash income not necessarily purchased vegetablesto the extent of fulfilling balanced nutrient intake of the household members.
8.2. Food and non-food expenditure share
Share of food expenditure was found to be comparatively lower in thevegetable production system. One of the reasons could be the access tofarm-produced food items as mostly vegetables were valued at lower cost.

59
The perks and kind wages also reduced to some extent the food expenditure.Further, due to higher income received from the sale of vegetables, thehouseholds could spend more money on other non-food commodities andservices. Lower budget share on food is a good indicator of better livingstandard of a family.
In the rice and sugarcane systems, among food expenditure, the highestshare went to rice. Next in the order were oil and milk and milk products. Theplausible reason could be that two commodities were readily available throughwell-established market channels at reasonable rates. The high marginalbudget share in the case of oil and milk and milk products further supportsthis fact. The fruits and vegetables, being perishable in nature, purchasedthrough market were highly influenced by the price fluctuations and thesupply to local market. Therefore, share on vegetable expenditure waslower. In contrast to the rice and sugarcane production systems, foodexpenditure share in the vegetable system was equally distributed, mainlydue to greater availability of all food items through either farm production ormarket channels. Therefore, it is essential to increase the fruits and vegetablesupply in the rice and sugarcane system by appropriate agriculturalintervention programs, including creation of an efficient market infrastructure.
In systems other than vegetable system the, the incremental incomepromoted the purchases of milk and milk products. So, introduction of dairyenterprises would be beneficial so that even weaker sections would be in aposition to buy milk. Interestingly, in the vegetable system area in this study,people though eat finger millet traditionally as one of the staple foods, overthe period however, there has been shift in the food preference. As a result,the income increase led to a change in food intake from finger millet to rice.The reason lies in the people’s growing perception that finger millet was aninferior commodity. In reality, the finger millet is rich in calcium and is a goodsource of minerals. Hence, for resource-poor farmers, finger millet is a verygood substitute for nutritious food. Keeping this in mind, the agriculture andnutrition department can take up joint campaign for educating about thenutritive value of finger millet and the importance of growing and consumingfinger millet. This extension strategy can be integrated with the IntegratedCereal Development Program being implemented by the agriculturedepartment.
Among non-food expenditure, health expenditure was the highest in thesugarcane system, compared to that in other systems. Since sugarcanesystem is a cash crop, access to farm produced foods was limited to the

60
population in that area. The source for food commodities was mainly throughmarket purchase. The price fluctuations of food commodities considerablyaffected the vulnerable households, especially during off-seasons. This ishighly relevant for perishable green leafy vegetables and vitamin-rich fruits.Consuming less nutritive food may lead to increased expenditure on healthcare. Therefore, special agricultural programs need to be designed to providescope for increased access to fruits and vegetables, thereby, addressingmicronutrient deficiencies.
In the rice system, the higher income and more farm size lead usually toreduction in rice consumption and increase in vegetables and oilsconsumption through market purchases. The marginal farmers andagricultural laborers can be provided assistance for establishing nutritiongardens and cultivation of vegetables in marginal lands. In nutritionalgardening, seasonal and perennial varieties of green leafy vegetables suchas creeper spinach (Basilla alba), amaranth (Amaranth gangeticus),moringa and yellow-orange fruits, and vegetables like mangoes, papayaand yellow pumpkin can be promoted. Vitamin C-rich fruit such as guavaand amla can be introduced. Even introduction of cruciferous vegetableslike cucumbers, watermelon, muskmelon would help in increasing the intakeof vitamins and minerals. This approach would generate additional incomethrough sale of these farm produce and improve overall quality of their foodintake.
It has been found that formal education negatively influenced the consumptionof finger millet. More formal education leading to higher earnings resulted ina shift in the consumption pattern from finger millet to rice based foodpreparations. Therefore, nutrition education is more important, irrespectiveof formal education of the household member for proper utilization of availablefood as well as improving the health and nutrition status of these people.People should be sensitized about the nutritive value of finger millet andtheir mind-set should be changed. Households having more number ofchildren generally suffer from greater variation in intra-household foodintake, mainly fruits and vegetables. So, the number of children per householdcan be one of the indicators while identifying the target beneficiaries forextending other agricultural scheme benefits with the intention of improvingtheir nutritional security. There is clear evidence across the productionsystems, supporting that homestead gardens greatly contribute increasedintake of fruits and vegetables. This should be taken as a cue for higherpotential for and importance of nutritional and other agricultural diversificationprograms.

61
In the households with high proportions of earning members, the intake ofpulses had gone up, suggesting that the increased income flow or directaccess to pulses as perks contributed a higher protein intake. Though, theagricultural laborers working in the sugarcane system had the same amountof income as that of laborer in rice system, the incidence of market purchaseof pulses was lesser. An Increase in income leading to higher intake ofnutritionally balanced food was too much to expect. In lower incomehouseholds, a direct physical access to the food produced had greaterinfluence on food consumption than the recycling of cash income to fooditems and balanced nutrition intake. For cash income, to get recycled intoimproved nutrition intake, other factors, like nutrition knowledge, easy marketaccess to vitamin rich foods, income control by women, etc., were found tobe of great importance.
8.3. Scope for institutional linkages among agriculture,health and nutrition departments
It has been found that nutritional objectives are not included in the agriculturalplans and programs. It looked as though these programmers/schemes wereinsensitive to the food-insecure households. The link between health andnutrition agencies with agriculture and allied departments is negligible.Combating malnutrition based on diet diversification through regionalnutritionally rich food production systems is to be emphasized.
Implementing agriculture-based interventions warrants a strong co-ordinationof all the state development departments for achieving the goal of sustainablenutrient security in a cost-effective manner. Institutional arrangement for asustained co-ordination assumes much significance. The role of eachdevelopment department should be assessed and redefined (if needed) forcomplementing each other. In this study, various programs of developmentaldepartments were examined. Figure 4 and Table 17 depict the possibleroles and linkages between the development departments. The salientobservations and suggestions for their increased interaction in differentareas are discussed here under.
8.3.1.Database sharing
Health Department and Social Welfare Department along with nutritionagencies generate data related to nutritional issues. Primary Health Center(PHC) and ICDS scheme officials were formally coordinating and identifying‘at-risk’ households. The target beneficiaries were those households which

62
InterdepartmentalCommittee to
Develop RegionalNutritional Policies
SAUs/ICAR Research InstituteNutrition Rich Varieties
Field FortificationFarming System Models
NutritionalSecurity
Health & NutritionDatabase:
Food Related BehaviorNutritional Status
Food Insecured HouseholdsCapacity Building
Sensitizing AgriculturalPersonnel
SDA/KVK/NGOs/PrivateDatabase:
Potential Nutrition outputCapacity Building:
Nutrition GardeningValue addition & Food
ProcessingTOT:
Agronomic PracticesFarming System Diversification
Demonstrations
Figure 6. Institutional linkages for sustainable nutritional security
had malnourished children and weaker mothers, requiring maternalhealthcare. It was also observed that the information on nutritional status isbeing gathered at various levels from village up to state level. But these datawere rarely analyzed at local levels for preparing regional nutritional securitystrategies for addressing the real causes of malnutrition. The data weresent to ICDS Central office at national level and analyzed. As a result,

63
Table 17. Interdepartmental joint activities for improving nutritional security
Departments Activity Benefit
Primary role Secondary role
Health, Social Agriculture, Identification of “at-risk” households Integrated targeting of developmentalwelfare, Nutrition Horticulture, schemes to ‘at-risk’ households
Animal Husbandry
Health, Social Agriculture, Decentralized analysis of nutritional Development of region-specific policywelfare, Nutrition Horticulture, status data of ICDS alternatives
Animal Husbandry
Health, Social Horticulture Estimation of nutritional requirements Effective planning of nutritional gardening forwelfare, Nutrition of average poor household in the region poor households
Horticulture, Social welfare, Processing and value addition of Increased shelf-life, enhanced nutrient intake,KVKs Nutrition mushroom, vegetables access to nutritive foods in off-season.
Horticulture Social welfare, Tree planting, nutrition gardening Utilization of common land for increasedSchools supply of fruits and vegetables
Agriculture Horticulture Farming system diversification- Enhanced nutrient supply from food systemsintercropping, mixed croppingand border cropping
Agriculture Nutrition Joint campaign on benefits of millets Sustaining millets cultivation andconsumption consumption
Agriculture Animal Husbandry Developing integrated farming system Low cost feed, cost-effective maintenance ofmodel for promotion of dairy and poultry livestock and poultry, increased production

64
Panchayat union, Development Coordinated proactive role in Integrated targeting, enhanced nutritionalVillage Panchayat departments implementing development programs security through poverty alleviation
Horticulture, Social welfare, Identification of Micronutrient-rich Crop introduction and or area expansionSAUs University, Nutrition indigenous cropsKVKs, NGOs,
State Agricultural Health, Social Development of nutrient rich Field fortificationUniversity, ICAR, welfare, Nutrition transgenic varietiesKVKs, Agriculture
Horticulture, Social welfare, Technical know-how on nutrition Effective management of nutrition gardeningKVKs Nutrition gardening by Anganwadis
Health, Social Agriculture and Sensitizing extension personnel Extension system incorporates nutritionalwelfare, Nutrition allied objective in its technology transfer
Horticulture, Social welfare, Social marketing- co-operative units Awareness about nutritive value of foodsNGOs Nutrition and increased food and vegetable intake
Social welfare, Agriculture, Self-h1elp Groups (SHGs) from Empowering ‘at-risk’ households to solveNutrition Horticulture ‘at-risk’ households malnutrition problems
Agriculture, Social welfare, Large-scale co-operative operations Agro processing and sale of dehydratedHorticulture, Nutrition, NGOs and fortified greens/vegetablesKVKs, NGOs,
Table 17. (Contd.)
Departments Activity Benefit
Primary role Secondary role

65
though the guidelines were given, generally, they were broader in naturewithout much relevance to the location specific problems. Therefore,decentralized analysis of nutritional status information may be done andtranslated to policy alternatives at the local level. These information on foodrelated behavior, nutritional status, food insecure households etc. generatedby health and nutrition agencies may be shared with the Agriculture,Horticulture and other development departments. Such data sharing wouldhelp agriculture and allied departments to go for integrated targeting ofnutritionally vulnerable (‘at-risk’) households and extend the relevantdevelopmental schemes for their upliftment.
One of the important schemes being implemented by Horticulture departmentis nutrition gardening. The scheme mainly deals with distribution of greens,fruits and vegetable seedlings. The target beneficiaries are small, marginal,agricultural laborers, and scheduled caste farmers. But, the beneficiaryhouseholds may not necessarily be those who are actually nutritionallyvulnerable. But, with the help of database on ‘at-risk’ households, thosehouseholds can be included as a part of beneficiary list while distributingfruits and vegetable seeds and/ or seedlings. For instance, when horticulturedepartment distributes Moringa seedlings, it can be given precisely to thosehouseholds which are in need of horticulture intervention for combatinganemia and other nutritional deficiencies.
The State Department of Agriculture is implementing various schemes,which are beneficial to the weaker sections of the farming community. Thestrategies behind these programs are mainly input subsidies anddissemination of technologies for yield enhancement. The other significantschemes are promotion of pulses and millets. Database on ‘at-risk’households would be able to provide assistance to those nutritionally-vulnerable households in increasing their income as well as access to nutrientrich pulses and millets.
In the study area, dairy and poultry contribute income to the households to aconsiderable level. These enterprises are a good source of increasingthe access of animal protein and calcium for resource-poor households.It was observed during the study that the agricultural landless laborersgreatly benefited from the dairy and poultry sector as an alternativesource of income. Therefore the Animal Husbandry Department has acomplimentary role to play for the household nutritional security and it shouldextend its schemes to those also who have been identified as ‘at-risk’households.

66
In brief, these departments should attempt at developing appropriateindicators for properly identifying households which are food and nutritionallyinsecured and should jointly address the nutritional issues jointly with theirprograms.
8.3.2.Reinventing ongoing schemes
Horticulture department is implementing various schemes for thedevelopment of fruits and vegetables in the state. Some of the significantschemes are nutrition gardening, mushroom cultivation and vegetable minikitscheme for popularizing hybrid vegetable seeds. Before, supplying seed/planting materials, the real nutritional requirement of average poor householdin the region is to be worked out. This would facilitate establishment of well-organized nutrition gardening. Similarly, in schemes like mushroomcultivation, its processing and value-addition can be taught to thebeneficiaries. For these activities, the expertise available in social welfaredepartment, nutrition agencies and KVKs can be utilized. The departmentimplements another scheme for tree planting in educational institutions.Such schemes can be reoriented to address the nutritional security issuealso in the villages. Social Welfare Department and Horticulture Departmentcan have tie up with local educational institutions. The horticulture officercan provide technical knowledge to the school children on maintainingnutrition gardens and tree planting in the wastelands around the school. Itwould benefit the Anganwadi centers to procure vegetables at a lower cost.Children in Anganwadi centers and schools will have opportunity to getfresh nutritive vegetables.
8.3.3.Farming system diversification
The agricultural extension system, which was one of the three pillars of theGreen Revolution in India, must be linked to community welfare (Babu 2000).It has been found that during the study that the role of extension functionaries’is mostly confined to the distribution of subsidized seeds. Further, agriculturalplans lay stress only on the production targets. These do not give adequateimportance to “Farming system diversification”. What is expected is a moreintensified effort to promote technologies like inter-cropping, mixed-croppingand border-cropping which would help farmers in utilizing the inputs receivedthrough the scheme in a much productive way. Further, it has been observedthat the linkage between horticulture and agriculture departments requiresfurther strengthening. Coordinated implementation would facilitate promotionof this kind of cropping system. For instance, growing pulse crop in fieldbunds by agriculture-sponsored schemes and growing papaya tree around

67
the field by horticulture-sponsored schemes would contribute to reducingprotein and vitamin A deficiencies. National Pulse Development Program(NPDP) beneficiaries can be identified with the help of nutrition department.This would help farmers to increase their income as well as improve theconsumption of pulses and fruits of a household. The landless agriculturallaborers also indirectly would derive benefit by getting pulses as kind wagesor gifts from farmers. This provides a scope for increasing their intake ofprotein rich pulses.
8.3.4.Sustenance of millets consumption
Millets have high nutritive value with high calcium and other minerals.Promotion of millet cultivation assumes significance especially for the poorfarming community. Because there is an apprehension that shifts fromtraditional foods, many of, which are rich in vitamins and micronutrients,would result in decline in nutritional quality of diets. Substitution of millets bywheat and rice, for example, does not augur well for poor consumers whocannot afford supplementary alternatives (NAAS 2001). Therefore,agriculture department should prepare appropriate location-specificstrategies in encouraging farmers for millet production. The agriculture andnutrition departments can take up joint campaigns for educating about thenutritive value of finger millet and the importance of growing and consumingfinger millet. This extension strategy can be integrated with Integrated CerealDevelopment Program (ICDP) that is being implemented by agriculturedepartment. Such initiatives would support indigenous food-based systemsfor alleviating malnutrition.
8.3.5.Strengthening livestock and poultry enterprises
The Animal Husbandry department implements various schemes for thepromotion of dairy and poultry enterprises without much co-ordination withother line departments. Agriculture and Horticulture Departments in co-ordination with Animal husbandry Department can develop an integratedfarming system model suitable to the area taking into account the existingcropping pattern and other resources. Such efforts would maximize theprofit from all the enterprises, including dairy and poultry enterprises. Forthe resource-poor farmers, recycling of agricultural byproducts for theseenterprises would be more cost-effective and sustainable in the long run.Since women are involved considerably in dairy management and backyardpoultry, any additional income gained through these enterprises would directlyensure better food and nutrition as women have a major say in foodexpenditure. Moreover, the improved physical access to milk and egg would

68
help the women to improve their nutrient intake in terms of protein, calcium,and iron.
In brief, effective participatory planning by Agriculture, Horticulture and AnimalHusbandry departments in co-ordination with Health and Social welfaredepartment would help to reorient the existing schemes and subsidies toaddress the issues of agricultural development, economic empowermentand sustainable nutritional security of the vulnerable farming households.
8.3.6. Proactive role by rural institutions
As of now, the rural development agencies like Panchayat Union at Blocklevel and Village Panchayat follow top to down approach. They implementstate level schemes that are routinely routed through them. What is requiredis a more proactive role of these institutions in collaboration with otherdevelopment departments at the grass root level to identify first what aretheir needs and then addressing them through the program implementation.Poverty and food insecurity are highly correlated and therefore, schemesfrom rural development agencies would help to alleviate poverty, as thesewould help improve household nutritional security also.
8.3.7.Promotion of nutrient-rich indigenous crops
The Horticulture Department with the nutrition agencies can jointly identifymicronutrient rich fruits and vegetables that are indigenously available inthe region keeping in mind the beliefs, tastes and preferences of the localcommunity. Special programs to revive the use of ‘forgotten’ indigenousfruits and vegetables rich in vitamin A and iron should be designed as part ofthe renewed nutrition strategy. Distribution of seeds and maintenance ofnursery for such indigenous plants would be beneficial to the local community.For example, “Moringa” trees that are rich in vitamin A and iron can beintroduced again. The horticulture department can provide feed forwardinformation about indigenous plants. In turn, the State Agricultural Universitycan develop nutrient-rich varieties from these indigenous plants.
8.3.8.Nutrition as an agenda in research
The agricultural regional research station can play a greater role in developingregional nutritional security plans and strategies in co-ordination with districtlevel departments. Population living in the rice and sugarcane productionsystems suffers from relatively high level of micronutrient deficiency, likevitamin A. It is a good initiative that research systems at national level are

69
focusing on transferring pro-vitamin A gene into rice through biotechnology.This requires further attention. Such initiatives can be field-tested and theirimpact can be assessed for further refinement at the field level for alleviatingmalnutrition, which may be cost-effective in the long run. A study conductedin Kenya by International Center for Research on Women indicated thatorange-fleshed sweet potatoes grown in on-farm trails performed well withrespect to yield and pest resistance and also had a high beta-carotenecontent. This variety of potato contributed to the alleviation of vitamin Adeficiency in the study area (ICRW 1999). In India also, on-farm experimentscan be conducted at regional research stations of National AgriculturalResearch System. These studies warrant active participation of differentdevelopmental departments. Krishi vigyan Kendras (KVKs) can provide linkwith State Departments of Agriculture, Health Department, and Departmentof nutrition under Directorate of social welfare, etc.
8.3.9.Capacity building
Another area for interdepartmental linkages is capacity building. During thestudy, the discussions with the officials of the Directorate of Social Welfareand nutrition workers revealed that in Anganwadi centers, though the nutritiongardening was given importance as a part of intervention programs, itsimpact wasnegligible. A plausible explanation for the poor impact lies in thelack of technical know-how of nutrition workers and lack of adequate linkwith Horticulture and other departments. The Horticulture Department cantrain the nutrition workers in plant protection measures and othermanagement practices for nutrition gardens. Nutrition gardening schemeneeds to be further reoriented so that it serves the purpose of addressingthe nutritional issues. While promoting nutrition gardening and itsdissemination of related technologies, the nutritive value of fruits andvegetables and its importance in human nutrition need to be highlighted.This would sensitize farmers and village women and enhance greateradoption. Though nutrition gardening is not mainly for economic returns, itreduces household food expenditure and more significantly, the healthexpenditure arising out of malnutrition.
KVKs can train Anganwadi workers and farm women for developing nutritionalgardens in their households. Training on other enterprises like, mushroomcultivation, apiculture and other value-addition activities would greatly benefit‘at-risk’ households to generate additional income. For identification oftrainees for kitchen gardening promotion schemes, health and nutritiondepartment can provide list of ‘at-risk’ households to the horticulturedepartment.

70
The extension functionaries in agriculture and allied departments lackawareness about nutritive value of crops, the knowledge about the cropvarieties which have better nutritive values and the prevailing nutritionalstatus in the area. As a result, this aspect of the message is missed duringtechnology transfer to the farmers. Health Department and Directorate ofSocial Welfare are organizing a number of innovative communicationactivities. Sensitization and awareness creation workshops and orientationsessions are being organized for the beneficiaries as well as for the keyfunctionaries of the project. Similar workshops can be organized for extensionfunctionaries in agriculture and allied departments to increase the awarenesson nutritive value of crops and other products. For the workshops organizedby health and nutrition agencies, those functionaries can be invited toparticipate wherever it is applicable. State Agricultural Universities canorganize joint training programs for nutrition and extension professionals.Nutrition education may be included in the undergraduate courses and atpost-graduate level curriculum in State Agricultural Universities.
8.3.10.Innovative market institutions
It has been observed that resource-poor households living in areas of riceand sugarcane production systems experienced difficulty in physical accessto fruits and vegetables, because, their consumption of these items wasthrough market purchase. The poor economic conditions of these householdslimit their market purchase. Further, they were not in a position to get freshvegetables and fruits because the rural market infrastructure was inadequateto preserve and sell the perishable commodities.
In an another study about horticultural development in Tamil Nadu, conductedby Rajasekaran (2002), marketing of horticultural produces emerged as thefirst and foremost important constraint, primarily due to unorganizedmarketing. Innovative market institutions with social marketing concept canbe introduced. In this kind of marketing, along with sales, the nutritioneducation could also be carried out by displaying appropriate posters andother educational aids highlighting the nutritive value of fruits and vegetables.Horticulture department can start village cooperative sale units exclusivelyfor the sale of fruits and vegetables. Social marketing is a viable technique,which can boost up the consumption of vegetables in non-vegetableproduction systems areas. For instance, Dangoria Charitable Trust, Non-Governmental Organization in Hyderabad, is successfully implementinghome gardening and social marketing of micronutrient-rich fruits andvegetables in Narsapur mandal of Medak district of Andhra Pradesh. Theactivities were carried out jointly by horticulture, health and nutrition
71
functionaries. This project was implemented with the guidance of NationalInstitute of Nutrition and Department of Science of Technology. The healthand nutrition functionaries visit the village, and the nutrition and health valuesof fruits and vegetables are disseminated using educational aids. As a result,the consumption of those commodities by village population has gone up.The agricultural landless laborers, marginal and small farmers were greatlybenefited (Bamji and Murthy 2000). Similar experiments can be carried outby the public sector on a large scale. The agriculture line departments cantie up with health and nutrition agencies in establishing such social marketingunits.
8.3.11.Empowering local community
At present the people are passive receivers of governmental nutritionalprograms. There is a need to initiate people’s participation in this direction.State Departments of Agriculture and Horticulture with Social WelfareDepartment and nutrition agencies can help in forming Self-Help Groups(SHGs) from out of ‘at-risk’ households and they can exchange ideas onimproving their nutritional security. Training programs can also be organizedfor these SHGs. This SHGs approach can be useful for their own financialmanagement, knowledge sharing, establishing grain bank, etc., In stateslike Orissa, Food Grain Banks have been found a useful means to tacklefood insecurity. Households could borrow food grains from these banksduring times of need and return the same amount, with marginal interest, inthe form of food grain later. In some areas, food grain banks have beenstarted with the contribution of food material from the community(Vijayraghavan 2000).
8.3.12. People’s partnership in intervention programs
During the discussion with the ICDS officials, it was found that quality andquantity of supplementary feeding was one of the main concerns inimplementing the schemes in a sustained manner. Even World Food Programendorsed this view. The food component was the largest single expenditurein ICDS. Efficient use of the food allocation is a prerequisite for sustainabilityand expansion of the program. However, many states are unable to provideadequate funding to maintain the level of beneficiaries at the end of the planperiod. Budget constraints often result in reduction of rations and feedingdays. To tackle this problem, at national level, World Food Program (WFP)has introduced Indiamix project to produce a nutritious product that isaffordable for state governments to feed children and mothers at nutritionallycritical times in their lives. Community level production of Indiamix has

72
generated income and employment and has encouraged the local agriculturalproduction (WFP, 1997).
Drawing lessons from such successful experience, the following food-basedmodel has been suggested to encourage people’s participation in nutritionintervention programs with active role of agriculture department along withother departments. The development departments can jointly assist in theformation of large-scale cooperative community operations at the grassroot level. These cooperatives can develop expertise on modern intensivebio-agro technological methods, production and processing of high nutritivevalue varieties of vegetables and fruits. State Department of Agriculture,KVKs, NGOs can organize training programs for rural unemployed youth inthese subject matter areas. These trained youth would function as a liaisonbetween co-operatives and State sponsored supplementary feedingprograms. They would also assist in organizing social marketing concept-based local sale units.
Small scale agro-processing units can be organized. Such units would helpin development of financially self-supporting enterprises producing for localcommercial and institutional markets. These units can produce dehydratedleaf powder of Spinach, Moringa, Agathi, Spirulina, etc., The nutritive-richproducts from these units would be useful in fortification of supplementaryfeeds which is being supplied through Anganwadis, and to supply rural andurban Markets.
8.3.13. Linkages and coordination model
Establishing of a sound institutional mechanism for effective linkage and co-ordination among development departments is a pre-requisite for thesuggested strategies to get translated into action in the field. Such mechanismwould make policy alternatives related to agricultural interventions fornutritional security more dynamic. The linkage and co-ordination model,suggested by Perumal and Ponnusamy (1994), can be conveniently modifiedto effectively implement the agricultural-based interventions for nutritionalsecurity with strong support of health and nutrition agencies, apart fromother agriculture and allied departments. The modified model is given inTable 18. In this table, different interdepartmental coordination committeeshave been suggested at various levels for periodic monitoring and evaluationand to evolve dynamic policy alternatives from time to time. There would betwo way vertical flow of communication among these committees acrossthe hierarchical levels. The main emphasis of this coordinated model is onparticipatory planning, implementation and evaluation of development

73
Table 18. Interdepartmental linkages and the coordination model
State Level Coordination Sub-State Level District Level Sub-division LevelCommittee Co-ordination committee Co-ordination Committee Co-ordination committee
One-day duration One-day duration One or two day duration Two days duration
Half yearly Half yearly Bimonthly Bimonthly(as and when required)
Structure• Chief Secretary (Chairman) • Convenor-to be rotated • Convenor - to be rotated • Convenor - to be rotated• Secretaries and Directors among Directors of among the Joint Directors among Assistant Directors
of Agriculture, Health and Development Departments of Development Departments of DevelopmentSocial Welfare and other • Directors of Agriculture, • Joint Directors of Agriculture, Departmentsdevelopment departments Health and Social Welfare Health, Social Welfare and • Agricultural Development
• Director of Extension and other development other development Officers and officers ofEducation of State departments departments same cadre from otherAgricultural University • Additional Directors of all • Deputy Directors of development departments
• One or two representatives Development Departments Agriculture and other • NGOs and a few selectedof NGO • Director of Extension development departments farmers, farm women, and
• Representatives from Education • SAU Scientists representatives from foodsupporting organizations • Non-Government • NGOs insecure households(if needed) Organizations • Representatives from
• Representative from supporting agenciessupporting organizations • A few selected farmers/
farm women, food-insecurehouseholds representative

74
State Level Co-ordination Sub-State Level District Level Sub-division LevelCommittee Co-ordination committee Co-ordination Committee Co-ordination committee
FunctionsMaking policy decisions on • Preparing action plan for • Preparing an action plan for • Analyzing the outcome ofmajor issues relating to: the State as a whole the district as a whole based the BLP meetings and
• Orienting the overall based on the recommen- on the recommendations checking the interventions/extension work in line dations of the State level of the Sub-Divisional enterprises suitable forwith the policies of the coordination committee Meetings and the outcome introduction in differentgovernment concerning meeting and the proposals of BLP meetings blocksnutritional security received from the District • Synchronizing the activities • Working out the modalities
• Assessing the overall level coordination of the development for involving the extensionrequirement of resources committees departments in line with the functionaries of develop-and modalities of making • Working out the sub-divisional priorities ment departments up tothem available to resource- mechanism for better co- • Assessing and reviewing grass root levelpoor farmers ordination among develop- the progress of the nutritional • Familiarizing the extension
• Considering the recommen- ment departments at status in all the sub divisions workers/ nutrition workersdations and issues emerging district level and making contingency with the schemes/ prioritiesfrom the sub-state level • Prioritizing the district plans whenever required of all line departmentscommittee meeting needs based on nutritional • Working out the modalities • Analyzing the problems
• Suggesting suitable marketing status and other of involving scientists, NGOs, encountered during thestrategies for the benefit of the information received other supporting agencies implementation of interven-poor community, especially for from development and farmers in the planning tion programs and findinggreater access to perishable departments and implementation solutions compatible and
Table 18. (Contd.)

75
nutritious foods • Fixing the goals and • Preparing agenda notes for feasible to all development• Guiding and counselling for targets at district level Sub-State level meetings departments
better co-ordination among • Working out the resource • Mobilizing and making • Assessing the progress ofdevelopment departments (schemes) allocation available the resources nutritional status in terms of
• Evolving short-term and patterns for all the • Assessing the training its sustainability, and thelong term food and nutritional districts in line with the needs of grass root impact of interventionssecurity plans for the State as requirements, as functionaries of each division programs on socio-a whole and at regions/ proposed by the District • Fixing the date of next economic status of thedistricts levels co-ordination Committee meeting and the Convenor ‘at-risk’ households
meetings from among other Joint • Assessing the training• Preparing agenda notes Directors of development needs of grass root level
including major policy departments extension/ nutrition workersissues for placing before • Preparing agenda forthe State level meeting. placing before District level
• Fixing the date of next meetingsmeeting and the convenor • Fixing the date of nextfrom among other Directors meeting and the Convenorof Development from among the Assistantdepartments Directors of other Develop-
ment Departments
State Level Co-ordination Sub-State Level District Level Sub-division LevelCommittee Co-ordination committee Co-ordination Committee Co-ordination committee
Table 18. (Contd.)

76
programs. Coordinated efforts among development department may faceunforeseen problems. Therefore, political will also essential to implementthese polices and strategies to ultimately reach the goal of sustainablenutritional security.
8.3.14.The long-term strategy
Agricultural extension systems can draw policies such that agriculture canhave a major intervention in improving nutritional status. The experiencesand approaches followed by the extension system may be well applicable totranslating food availability into nutrition security at the household level. Itwill be useful to test a system of nutrition extension on a pilot basis, combiningthe resources of several sectors acting at the village levels (Babu 2000).Once nutritional-friendly agricultural policies are framed and programs areimplemented, it would serve as complementary and supplementary to thosedirect nutritional intervention programs. For instance, if the benefit ofsupplementary food component of the intervention programs can besubstituted by the appropriate agricultural interventions having sound policysupport, then the expenditure on such component would come down. Thoseresources could be diverted towards better health care and nutritionaleducation programs. Similarly, if some target group of ‘at-risk’ householdscould be taken care of by the agricultural interventions, resources can bediverted to the more vulnerable group for providing direct interventionprograms. In the long run, the expenditure on food intervention programscould be minimized.

77
REFERENCES
Abbi R., P. Christian, S. Gujaral and T.Gopaldas. 1991. The impact of maternalwork status on the nutrition and health status of children. Food andNutrition Bulletin 13 (1): 20-25.
ACC/SCN (Administrative Committee on Co-ordination/subcommittee onNutrition).1992. Second report on the World Nutrition Situation. Vol. I :Global and Regional Results. Geneva, Switzerland : World HealthOrganization.
Babu S.C. 2000. Nutrition security: development challenge. In. The Hindu:Survey of Indian Agriculture 2000.
Bamji M.S. and P.V.V.S. Murthy. 2000. Promotion of nutrition security in arural community through education and appropriate technologies. In:Proceedings of Conference on “Working with communities to improvenutrition and food security” Organized by Department of Women andChild Development, Government of India and CARE-India, New Delhi,March 6-8.
Behrman J.R. 1995. Household behavior, pre-school child health andnutrition, and the role of information. In. Per Pinstrup-Anderson, Pelletier,D.,and Alderman,Harold (1997) Child growth and nutrition in developingcountries, Oxford University Press, Delhi. pp 97-116.
Behrman J.R. and A.B. Deolalikar.1988. Will developing country’s nutritionimprove with income? A case study for rural South India. Journal ofPolitical Economy 95(3): 108-138.
Birthal P.S. 1996. Nutrient consumption pattern in rural areas of westernUttar Pradesh, Agricultural Economics Research Review. 9(2): 175-188.
Blau D.M., D.K.Guilkey, and B.M.Popkin. 1996. Infant health and the laborsupply of mothers. Journal of Human Resources 31 (1): 90-139.
Blumberg R. 1988. Income under female versus male control: Hypothesesfrom a Theory of Gender Stratification and Data from the Third World.Journal of Family Issues 9(1): 51-84.

78
Bouis H.E. and L.J. Haddad. 1990. Agricultural commercialization, nutrition,and the rural poor: A study of Philippine farm households. Boulder: LynneRienner.
Bouis H.E. and L.J. Haddad.1992. Are estimates of calorie-income elasticitiestoo high? A recalibration of the plausible range. Journal of DevelopmentEconomics 39(2): 333-364.
Brown L. R., Y. Yohannes and P.Webb. 1994. Rural labor-intensive publicworks: Impacts of participation on pre-schooler’s nutrition. Evidence fromNigeria. Journal of Agricultural Economics 76(5): 1213-1218.
Brun T.A., C. Geissler and E. Kennedy.1990. Evaluation of the impact ofagricultural projects on food, nutrition, and health. In. World food issues:Mall development and mall nutrition, Vol 2, ed.
Brun TA and M.C. Latham. Ithaca: Center for analysis of World food issues,Program in International Agriculture, College of Agriculture and Life Sciences,Cornell University.
Cassidy C.M. 1980. Benign neglect and Toddler malnutrition. In Social andbiological predictors of nutritional status, physical growth, and neurologicaldevelopment, ed. F.E.Johnston and L.S.Greene. New York: AcademicPress.
De Groote H., E. Kennedy, E. Payongayong, and L. Haddad.1994. Creditwith education for women in Mali: Impacts on income, food security, andnutrition. Report to the US. Agency for International Development.International Food Policy Research Institute, Washington, D.C. Mimeo.
Dewey K.G. 1989. Nutrition and the commercialization of food systems inLatin America and the Caribbean. Social Science and Medicine. 28(5): 415-424.
Engel P.L., P. Menon and L.J Haddad. 1997. Care and nutrition-conceptsand measurement, International Food Policy Research Institute, WashingtonD.C
Engle P.L. and I.Nieves.1993. Inta-household food distribution patternsamong Guatemalan Families in a supplementary feeding programme:Behavior patterns. Social Science and Medicine 36(12): 1605-1612.

79
Engle P.L. and Pedersen. 1989. Maternal work for earnings and children’snutritional status in urban Guatemala. Ecology of food and nutrition 22(1):211-223.
Engle P.L.1991. Maternal work and child care strategies in Peri-UrbanGustemala: Nutritional effects. Child Development 62:954-965.
Engle P.L.1993.Influences of mother’s and father’s income on children’snutritional status in Guatemala. Social Science and Medicine 37 (11): 1303-1312.
FAO 1992. International conference on nutrition and development-A globalassessment, Food and Agricultural Organization, Rome.
FAO 1996. Food for all, Report by FAO on the occasion of the World FoodSummit, 13-17, November, Food and Agricultural Organization, Rome.
Fleuret P. and A. Fleuret. 1980. Nutrition, consumption and agriculturalchange. Human Organization 39(3): 250-260.
Friedman M. 1952. A theory of the consumption function, Princeton, N.j:Princeton University Press.
Gade J. 2000. Gender issues in nutrition: CHETNA’s experiences and actioninitiatives, In. Proceedings of Conference on “Working with communities toimprove nutrition and food security” Organized by Department of Womenand Child Development, Government of India and CARE-India, New Delhi,March 6-8.
George S.1977. How the other half dies: The real reasons for world hunger(revised edn.) Penguin: Harmondsworth.
Gillespie S and McNeill G.1992. Food, health and survival in India anddeveloping countries. Oxford University Press, Delhi.
Gillespie S. and G. McNeill. 1992. Food, health and survival in India anddeveloping countries. Oxford University Press, Delhi.
Gopalan C.1995.Towards India’s food and nutrition security, Keynote addressat the National Symposium on “Food Security for the Poor” organized by theFAO and Indian Association for the Advancement of Science on October 4.

80
Gopalan C., B.V. Rama Sastri and S.C Balasubramanian.1996. Nutritivevalue of Indian foods, National Institute of Nutrition, Hyderabad.
Government of India. 1993. National Nutrition Policy, Department of Womenand Child Development, Ministry of human resource development, NewDelhi.
Haddad L.J and J. Hoddinott. 1994. Women’s income an boy-girl anthro-pometric status in the Côte d’ Ivoire. Word Development 22(4): 543-553.
Haddad L.J and J.Hoddinott.1991.Gender aspects of householdexpenditures and resource allocation in the Cote d’Ivoire. AppliedEconomics Discussion paper No. 112, Institute of Economics StudiesWorking Paper, Oxford: Oxford University.
Hazell P.B.R. and A. Röell 1993. Rural growth linkages: Householdexpenditure patterns in Malaysia and Nigeria. Research Paper 41.International Food Policy Research Institute, Washington.
Hussain A. 1998. Preventing and controlling micronutrient malnutritionthrough food-based actions in south Asian countries, Food, Nutrition,Agriculture, FAO, Rome.
ICRW 1999. The effects of women farmers’ adoption of orange-fleshed sweetpotatoes: Raising vitamin A intake in Kenya, Research report series 3.International Centre for Research on Women (ICRW), Washington, USA.
Jatrana S and S.K. Sangwan.1996. Sex differentials in the Child-care inrural Mewat of Haryana. Agricultural Economics and Research Review.9(2):189-196.
Kennedy E.T.and B.Cogill.1988. The case of sugarcane in Kenya: Part I,Effects of cash crop production on women’s income, time allocation, andchildcare practices. MSU/WID Working paper No. 167.East LansingMichigan State University.
La Montagne J.,P.L. Engle and M.F. Zeitlin. 1993. Maternal employmentand nutritional status of 12-18 month old children in Managua, Nicaragua.Paper presented at the International Nutrition Mini-symposium II:Malnurition, Growth, and Development, Federation of Societies forExperimental Biology Annual Meeting, Anaheim, California,5-9 April,Abstract No. 3256 in Abstracts FASEB.
81
Leslie J.1988. Women’s work and child nutrition in the Third world. WorldDevelopment.16(11):1341-1362.
Leslie J.1989. Women’s lives and women’s health: Using social scienceresearch to promote better health for women. Journal of Women’s Health.1(4):307-318.
Longhurst R.1981. Rapid rural appraisal. IDS Bulletin 12. Sussex, Eng:Institute for Development Studies.
Maxwell S. and A. Fernando. 1989. Cash crops in developing countries: theissues, the facts, the Policies. World Development 17(II): 1677-1708.
McGuire J. and B.M Popkin. 1989. Beating the Zero-Sum Game; Womenand nutrition in the Third World, Part I. Food and Nutrition Bulletin II(4):38-63.
Mebrahtu S., D. Pelletier and P. Perstrup-Andersen.1995. Agriculture andnutrition. In: Persturp-Andersen, D.Pelletier and H.Alderman (1997),Childand nutrition in developing countries, Oxford university press, Chennai.
MSSRF 2001. Food insecurity atlas of rural India. M S SwaminathanResearch Foundation,Chennai, India.
NAAS 2001. Diversification of agriculture for human nutrition, Policy Paper7,National Academy of Agricultural Sciences, New Delhi, India.
National Institute of Nutrition. 1998. Dietary guidelines for Indians, NationalInstitute of Nutrition, Hyderabad.
National Nutrition Monitoring Bureau.1997. 25 years of NNMB, NationalInstitute of Nutrition, Hyderabad.
NATP 1998.National Agricultural Technology Project-main Document, ICAR,New Delhi.
O’ Gara C. 1989. Breastfeeding and maternal employment in urbanhouseholds. In: Women, work and child welfare in the Third World, ed. J.Leslie and M. Paolisso. Boulder: Westview press.
Palmer I. 1972. The new rice in Indonesia. In: The new rice in Asia:Conclusions from four country studies. Palmer,I (ed.) UNRISD: Geneva.

82
Per Pinstrup-Andersen, D. Pelletier, H. Alderman.1997. Child growth andnutrition in developing countries. Oxford University Press,YMCA LibraryBuilding, Jai Singh Road, New Delhi- 110 001.
Perumal G. and K.A. Ponnusamy. 1994. Integrated extension through satellitemodel farm approach under broad based extension system, Directorateof Agriculture, Chennai, and Tamil Nadu Agricultural University,Coimbatore.
Rabiee F. and C. Geissler.1992. The impact of maternal work load on childnutrition in rural Iran. Food and Nutrition Bulletin 14 (1): 43-48.
Rajasekaran M. 2002. Horticultural Development in Tamil Nadu state-Acase study of Madurai District. Unpublished Thesis, Acharya N.G.RangaAgricultural University, Hyderabad.
Ravindran S. 1986. Health implications of sex discrimination in childhood: Areview paper and an annotated bibliography. Geneva: WHO.
Rosen D.S., N.J. Haslow and N.L. Sloan.1993. How to use the HKI foodfrequency method to assess community risk of vitamin A deficiency,Helen Keller International, New York.
Selvarajan S. and A. Ravishankar.1996. Foodgrain production andconsumption in India: Shifts, trends and implications for food security,Agricultural Economics Research Review. (9) 2, 142-155.
Seshadri S (Ed.) 1996. Use of carotene-rich foods to combat vitamin Adeficiency in India- A multi-centric study, Scientific report no 12. NewDelhi: Media workshop for Nutrition Foundation of India.
Sharif A. A and A.C. Mallick.1998. Dynamics of food intake and nutritionaccording to income class in India, New Delhi: National Council of AppliedEconomics Research, mimeo, June.
Swaminathan M.S., S. Rajagopalan and S.Sharada.1996. Working paper 5June, Hunger-Free area program, The hunger project-India, M.S.Swaminathan research foundation., Chennai.
Taussig M. 1978.Peasant economics and the development of capitalistagriculture in the Cauca Valley, Colombia. Latin American Perspectives5(3): 62-90.

83
Valverde V., R.Martorell, V. Mejia-Pivaral, H. Delgado, A. Lechtig, C.Tellerand R.E. Klein. 1977. Relationship between family land availability andnutritional status. Ecology of Food and Nutrition. 6(1):1-7.
Van Esterik P. 1989. Beyond the breast-bottle controversy. New Brunswick,Nj., USA: Rutgers University Press.
Vial I.E., Muchnik and F.S. Mardones. 1989. Women’s market network,Infant feeding practices, and Infant nutrition among low-income womenin Santiago, Chile. Women, work, and child welfare in the Third world,ed. J. Leslie and M. Paolisso. Boulder: Westview.
Vijayaraghavan K. 2000. Household food security in India- current status,determinants and perspectives. In. Proceedings of the Conference on“Working with communities to improve nutrition and food security”Organized by Department of Women and Child Development,Government of India and CARE-India, New Delhi, March 6-8.
Vine Le. R. 1987. Women’s schooling, patterns of fertility and child survival,Educational Researcher 16(1): 21-27.
Von Brau J. and E. Kennedy.1986. Commercialization of subsistenceagriculture: Income and nutritional effects in developing countries.Working paper on commercialization of agriculture No. 1. Washington,D.C: International Food Policy Research Institute.
Von Braun J., E. Kennedy and H. Bouis. 1988. Commercialization of smallholder agriculture: A comparative analysis of the effects on household-level food security and human nutrition and implications for policy.Washington, D.C: International Food Policy Research Institute.
Wandel M.and G.Holmboe-Ottesen. 1992. Maternal work, child feeding,and nutrition in rural Tanzania. Food and Nutrition Bulletin 14 (1): 49-54.
Wandel M.and G.Holmboe-Ottesen. 1992 Women’s work in agriculture andchild nutrition in Tanzania. Journal of Tropical Paediatrics 38(5):252-255.
WFP 1997. Indiamix-development of a low cost blended food, World FoodProgram ( WFP), New Delhi.
World Bank. 1998. India wasting away- The crisis of malnutrition in India,Report No. 18667-IN.

84
ANNEXURES
Annexure 1. Calorie intake in different states of India
State Average intake Average per Calorie intakeper consumer capita intake of the lowestunit per day per day decile (kcal)
kcal kcal per cu/day
Andhra Pradesh 2559 2052 1858.39
Assam 2406 1983 1842.48
Bihar 2637 2115 1790.88
Gujarat 2470 1994 1788.34
Haryana 3109 2491 2022.33
Himachal Pradesh 2916 2324 2170.65
Karnataka 2575 2073 1803.85
Kerala 2451 1965 1556.33
Madhya Pradesh 2697 2164 1894.03
Maharashtra 2427 1936 1747.75
Orissa 2740 2199 1918.96
Punjab 3007 2418 2116.48
Rajasthan 3090 2470 2249.85
Tamil Nadu 2347 1884 1551.38
Uttar Pradesh 2899 2307 2103.15
West Bengal 2733 2211 2012.57
All India 2683 2153 1954.03
Source: Sarvekshana, Vol XXI, No.2 73rd Issue, (1997)

85
Annexure 2. Deficient calorie intake (per cu/day)
State Percentage of Householdsconsuming less than1890 kcal
Andhra Pradesh 14.10
Assam 13.30
Bihar 14.10
Gujarat 20.40
Haryana 8.70
Himachal Pradesh 5.30
Karnataka 17.40
Kerala 23.70
Madhya Pradesh 12.20
Maharashtra 21.90
Orissa 10.40
Punjab 6.30
Rajasthan 4.20
Tamil Nadu 28.20
Uttar Pradesh 8.00
West Bengal 7.40All India 13.40
Source: Sarvekshana, Vol XXI, No.2 73rd Issue, (1997)

86
Annexure 3. Protein calorie inadequacy
(Percentage of population with proteinand/ or calorie deficiency)
State P- C-
Andhra Pradesh 10.4
Assam 27.9
Bihar 12.3
Gujarat 2.5
Haryana 4.6
Himachal Pradesh 6.7
Karnataka 14.9
Kerala 19.9
Madhya Pradesh 19.7
Maharashtra 19.7
Orissa 24.1
Punjab 3
Rajasthan 15.0
Tamil Nadu 41.0
Uttar Pradesh NA
West Bengal NA
P: Protein C: Calorie + : Adequate – : Inadequate
Calorie Adequacy: 2425 kcal per consumer unit per day
Protein Adequacy: 60 gram per consumer unit per day
Source: Ministry of Human Resource Development, India Nutrition Profile (1998)

87
Annexure 4. Percentage of population with vitamin A deficiency
State Percentage of population withVitamin A deficiency
Andhra Pradesh 0.79
Assam 0.45
Bihar 0.35
Gujarat 0.20
Haryana 0.05
Himachal Pradesh 0.01
Karnataka 0.77
Kerala 0.25
Madhya Pradesh 2.62
Maharashtra 0.72
Orissa 0.86
Punjab 0.13
Rajasthan 0.56
Tamil Nadu 3.11
Uttar Pradesh NA
West Bengal NA
Source: Ministry of Human Resource Development, India Nutrition Profile, (1998)

88
Annexure 5. Profile of Dharmapuri district
Particulars Number
Total population, No 24,28,596
Male, No 12,50,671
Female 11,77,925
Population density (per sq km) 249
Male Female ratio 944
Total workers 1162187
Male 716216
Female 445911
Literacy rate (%) 46.02
Total number of Blocks 10
Total number of Panchayats 588
Total number of villages 1106
Schools
Primary 2120
Middle 217
High 156
Higher Secondary 78
Colleges 4
Hospitals 11
Primary Health Centers 18
Sub Primary Health Centers 62
Banks 40
Post Offices 564
Telephone Connections 9012
Theatres 142
Road length (km) 5796
Vehicles 18640
Rivers 3

89
Annexure 6. Land-use pattern in the study area
Particulars District BlockDharam- Srishna- Kela- Denkani-
puri giri mangalam kotaha ha ha ha
Forest 366231 1648 28834 110762
Uncultivable fallow land 48982 162 2230 5948
Land put intonon-agriculture use 43846 362 1688 4483
Fallow lands 15560 28 1467 3848
Permanent pasturesand other grazing lands 12931 26 2032 3251
Land under miscellaneouscrops. (Crops & grovesnot included in netarea sown) 8558 37 536 7431
Current fallows 44003 197 2369 9997
Other fallow land 11124 26 899 2406
Net cultivable area 410694 2036 20648 56783
Annexure 7. Particulars of Integrated Child Development Service(ICDS) Scheme for Dharmapuri district
No. of Anganwadi Centers 691
No. of Anganwadi workers reporting 335
No. of Children 6 months-2Years 5702
Children (2 to 4) 28253
Mothers 4306

90
Annexure 8. Nutritional status of children in Dharmapuri district(ICDS Project : Krishnagiri)
(in numbers)
Grade Male Female
Normal 5604 7770
I 5026 4661
II 2511 2574
III 31 70
IV 2 4
Annexure 9. Supplementary nutrition to beneficiaries
(in numbers)
Children Women
6 months to 2 years 2 to 4 years ANC/PNC*
En- Spot Total Avg. En- Children Total Avg. En- Actuallyrolled fed W.F con- consum- rolled fed W.F con- con- rolled received
sumed ption sumed sumption
13343 12396 24858 2 27589 25117 50234 2 10276 9603
*ANC: Anti-natal Clinic, PNC: Post-natal Clinic
Annexure 10. Number of Anganwadi workers and beneficiaries
Project AWW Children Mothersreporting 6 months-2 year 2+ to 4Years
Thally 144 2560 5955 2263
Morappur 91 1770 3515 1137
Hosur 100 1372 3794 906

91
Annexure 11: Demography of selected sample villages
Particulars Villages
Periyamuthur Marasandaram Thottanahalli
Number of households 177 354 278Total population 757 1888 1424Male population 390 1046 864Female population 367 842 560Number of SC households 20 40 35Male literacy percentage 70 64 51Female literacy percentage 48 41 38Families below poverty line 47 52 43No. of farm households <0.5ha 25 430 75No. of farm households 0.5-1ha 45 270 50No. of farm households 1-2ha 70 100 60No. of farm households 2-3 ha 6 10 7No. of farm households 3-4 ha 5 10 8No. of farm households >4.0 ha 7 12 10
Annexure 12. Departmental visits for collecting secondary information
State level• Directorate of Agriculture• Directorate of Horticulture• Office of Commissioner of Social Welfare
District level• Office of District collector• Office of Joint Director of Agriculture• Office of Deputy Director of Horticulture• Office of Joint Director of Animal Husbandry• Office of Deputy Director of Health Services
Block level• CDPO• Office Block Development Officer• Primary Health Centres• Office of Agricultural Development Officer• Office of Assistant Director of Animal Husbandry
Village levelAnganwadi centrePanchayat officeOffice of Village Administrative Officer

92
Annexure 13. Activities of Primary Health Center
1. Identification of malnutrition cases
2. Distribution of Vitamin A tablets for 6 month – 6 year old children
3. Distribution of de-worming and folic acid tablets
4. National immunization program: vaccination for DBT, BCG, Polio
5. Health education
6. Family welfare programs
7. National Tuberculosis (TB) Control Program
8. Family Welfare Scheme for Mother and for Child care
9. Eye Vision Scheme
10. School going children welfare scheme
11. ANT Care / Pregnant women care program
Annexure 14. Features of Integrated Child Development Service (ICDS)Scheme
Objectives:
1. To improve nutrition, health and psycho-social status of children of 0-6
years of age with particular emphasis on preventing malnutrition inunder 3 years children and improve child care practices at thehousehold level.
2. To improve nutrition and health of women particularly pregnant andbreast-feeding mothers and adolescent girls, and
3. To empower women and adolescent girls through increased awareness
to take better care of their personal and household health and nutritionissues.
Package of services delivered at Anganwadi Centres:
1. Growth promotion
2. Selective supplementary nutrition
3. Early childhood care and pre-school education
4. Nutrition and health education
5. Health services by health personnel (VHN/MO)
6. Referral services

93
Nutrition delivery services:
1. The children in 0-6 years age group are weighed every month regularly andtheir growth are monitored
2. Supplementary food is given to the children of 6-36 months for those who
have not attained weight for age. The feeding is provided for a period ofthree months or till the child gets graduated.
3. Supplementary feeding is also given to Anti-natal Mother from the 6th month
of pregnancy and up to 6 months after delivery.
The children of 3 to 6 years, Anti Natal mothers and old age pensioners are providedwith noon meal. Nutrition balls are provided to 6-36 months old children based on
their nutritional status.
Age Nutrition status
Normal I and II Grade III and IV
6 – 24 month 50 g 100g
24-36 months 100g 150g
Following nutrition mealas are provided to 37-60 months old children
Rice 80g Rs.0.72
Dal 10g Rs.0.15
Sambar, including vegetables - Rs.0.175
Total expenditure per child Rs.1.045
Vitamin tablets are given to children and women
Annexure 15. Services at Health Sub-centre
1. Registeration of Anti-natal mother
2. Neo-natal care
3. Referral of high risk mother to Primary Health Centre
4. Post-natal Care
5. Immunization
6. Administration of Vitamin A
7. Management of Diarrhoea
8. Supply of Iron and Folic Acid
9. Acute respiratory infection management
10. Deworming

94
Annexure 16. Schemes of Horticulture Department
I. Integrated Horticultural Development Schemes
1. Area Expansion Program
Distribution of vegetables and fruits seeds / seedlings at 50% subsidy
Mango seedling distribution 100 seedlings/ha Rs20/plantSapota seedings 160 seedlings/ha Rs30/plantGuava seedlings 270 seedling/ha Rs8/plantLime seedling 270 seedling/ha Rs2/plantJake fruits / Tamarind seedling 100 plants/ha Rs30/plantTomato seeds * 400 gm/ha Rs60/100gBeans Seeds 12 kg/ha Rs60/kgCabbage seeds - Rs70/10 g
*Subsidy Rs30 per Kg
2. Wasteland Development Scheme• Identification of barren / waste land for improvement• Construction of tanks / check dam with the help of Agricultural
Engineering Department.• Maximum 5 ha. / individual• Coordinated project with Agriculture department. 50% subsidy
to all the inputs
3. IHDS – Special Component Program• Mainly for SC and ST• Providing technical know-how about all the horticultural crops• Other components are same as that of IHDS area expansion
scheme
4. Mango Demonstration• Target groups: Small and Marginal Farmers.• Distribution of inputs worth of Rs2000 per acre for improvement
of orchards• Provision of plant protection chemicals and fertilizers
5. Tree Planting in Educational Institutions• To create awareness about tree planting and its importance
among school children

95
• Provision of Rs500 worth seedlings• Twenty five schools per district• Technical knowledge to be provided to the children by
Horticulture Officers (HO) and Assistant Agricultural Officers
6. Nutrition Garden• Mainly for development of nutritional garden in the farmers
field / homestead• Ten seedlings / house are provided for 50 families• Rs50/- worth seedlings or seeds are provided
7. Tropic Arid Zone• Distribution of specific crops inputs for increasing the area,
production and productivity and in the Tropic Arid Zone• Rs3500/ha worth inputs are given mainly for small and marginal
farmers and SC and ST farmers.
8. Root and Tubers• Rs200 worth seed material is distributed free of cost e.g. Sweet
Potato, Potato
II. Other schemes
9. Improving Productivity
Rs.1200/ha are given as subsidy to improve the productivity of mango,guava, sapota and miscellaneous crops
10. Mushroom Cultivation• Rs500/ beneficiary with 100% subsidy• One-day training with free inputs
11. Vegetable Minikit Program• To popularize the hybrid vegetables• Rs180 worth of inputs with 50% subsidy• Distribution of seeds mainly for small and marginal farmers
and SC and ST farmers

96
Annexure 17. Schemes of Department of Agriculture
1. Bio-fertilizer distribution scheme
(50% subsidy)
Azospirillum Rs5/- packet
Phosphobacteria Rs5/- packet
Rhyzoibum Rs5/- packet
Micronutrient Rs18.50/-kg
Blue green algae (BGA) Rs2/- packet
Green leaf manure seeds Seeds distributed Rs.10/ kg
2. National Pulses Development Program (NPDP)
• Objective: to increase the area, production and productivity of
the pulse crops
• The target groups small and marginal farmers.1. Distribution of black gram, green gram and cow pea seeds:
20 kg of any of the seeds for maximum one ha/farmer.
Black gram Rs37/kg;*
Cow pea Rs27/kg;*
Green gram Rs35/kg;*
* Subsidy Rs3/-kg
2. Distribution of seed treatment chemical:100 gram / ha. ; 50% subsidy.
3. Procurement of foundation Seeds:Procurement from farming community. Local market rate +premium of Rs. 4 for one Kg
4. Compact block demonstrationDemonstrations in 10 ha. in the selected fields with 50% subsidy forall the inputs. Maximum area per farmer is one ha.
3. Integrated Cereal Development Program
Paddy seeds Rs.12/kg with Rs.2/kg subsidy
Finger millet Rs.4/kg
Pearl Millet Rs.4/kg

97
Other schemes
State Schemes:
• Tamil Nadu Women in Agriculture (TANWA)
• Minikit program for coarse cereals
• Intensive cultivation demonstration of coarse cereals in SC/ST areas
Centrally-sponsored Schemes:
• Accelerated maize development program under Technology missionon maize
• Mechanization of agriculture assistance to small and marginal farmers
Annexure 18. Schemes of Block Development Office
1. Anna Marumalaratchi Thittam (AMT)
The village having more than 600 population and predominantlyoccupied by the SC & ST. Based on decision desired by the GramSabha, the development work has been implemented.
2. Namakku Nama Thittam
To involve the people’s participation in the development work, 10% ofthe share is obtained from the people and 90% of the share is providedby Government and the work is implemented by the people themselvesbased on their felt needs.
3. Employment Assurance Scheme
Those who registered their names with the Panchayat Office as alaborer will be benefited through this scheme
4. MLA and MP Area Development Scheme
MLA – 50 lakh alloted by the State Govt. for their constituencydevelopment.MP – 1 crore – for developing their constituency

98
5. Jawahar Grama Sabha Yojana (JGSY)
Central scheme – based on the population and situational needs, thefund will be shared work will be implemented based on the Gramasabha decision
6. Swarana Jayanthi Yojana Scheme (SGY)
SGY as same as that of JGSY.
7. Indira Awaas Yojana (IAY)
It is a special project for home constructions and well diggings
8. Central Rural Sanitation Program
Toilets would be constructed and given to the beneficiaries on a sharingbasis of 50: 50 percentage.
9. State Finance Commission, Tenth Finance Commission, DistrictDecentralized Program
Provision of:• Safe drinking water• Roads• Lights• Drainage facilities.
10. Million Wells Scheme
Providing subsidy for digging of wells for the vulnerable groups
11. Integrated Rural Development Program (IRDP)
Implemented up to 1999
12. Dhoti and Saree Gifts Scheme
Implemented through RDO and VAO, distributing Dhoti and Saree tothe people below poverty line for Pongal festival

99
13. Community TV Programme
Installation of TV and construction of a TV room for every village forthe benefit of community. (village people).
14. Provision of Basic Amenities
• Water supply• Street light• Link road for more than population 500• Bituminus tar road for more than population 1000• School building.• Health campaign• PDS building

NCAP Publications
Policy Papers
3. Jha, D., P, Kumar, Mruthyunjaya. Suresh Pal. S. Selvarajan and Alka Singh. 1995.Research Priorities in Indian Agriculture.
4. Maji, C.C. and A .Bhattacharya. 1995. GATT and Agricultural Exports-Hopes and Realities.5. Maji, C.C., T. Haque and A. Bhattacharya. 1995. Small Farms. Employment and Surplus
Generation : A Case of West Bengal.6. Chand, Ramesh. 1997. Import Liberalization and Indian Agriculture: The Challenge and
Strategy.7. Suresh Pal and Alka Singh. 1997. Agricultural Research and Extension in India:
Institutional Structure and Investments.8. Farrington, J., Rasheed Sulaiman V. and Suresh Pal. 1998. Improving the Effectiveness
of Agricultural Research and Extension in India: An Analysis of Institutional and Socio-Economic Issues in Rainfed Areas.
9. Birthal P. S., Anjani Kumar. A Ravishankar and U. K. Pandey, 1999. Sources of Growth inthe Livestock Sector.
10. Sulaiman V., Rasheed and V. V. Sadamate. 2000. Privatising Agricultural Extension inIndia.
11. Chand, Ramesh. 2000. Emerging Trends and Regional Variations in AgriculturalInvestments and Their Implications for Growth and Equity.
12. Suresh Pal. Robert Tripp. and A. Janaiah. 2000. The Public-Private Interface andInformation Flow in the Rico Seed System of Andhra Pradesh (India)
13. Haque. T. 2001. Impact on Tenancy Reforms on Productivity Improvement and Socio-Economic Status of Poor Tenants.
14. Selvarajan, S. A. Ravishankar, and P. A. Lakshmi Prasanna. 2001. Irrigation Developmentand Equity Impacts in India.
15. Birthal, P. S., P. K. Joshi, and Anjani Kumar. 2002. Assessment of Research Priorities forLivestock Sector in India.
16. Suresh Pal and Derek Byerlee. 2003. The Funding and Organisation of AgriculturalResearch in India: Evolution and Emerging Policy Issues
Policy Briefs
3. Pal, Suresh and D. Jha. 1996. Funding Agricultural Research.4. Ravishankar. A., 1996. Intellectual Property Rights and Indian Agriculture: Some Issues.5. Farrington, J., Rasheed Sulaiman V. and Suresh Pal. 1997. Strengthening Research and
Extension for Rainfed Farming: Role of Social Science and Institutional Factors.6. Jha. D. 1999. On the New Agricultural Policy.7. Ravishankar, A. and Pratap S. Birthal. 1999. Livestock Sector in India: Agenda for the
future.8. Chand, Ramesh and Sonia Chauhan. 1999. Are Disparities in Indian Agriculture Growing?9. Sulaiman V., Rasheed and A. W. van den Ban. 2000. Agricultural Extension in India- The
Next Step.10. Ravishankar, A. and Sunil Archak. 2000. IPRs and Agricultral Technology : Interplay and
Implications for India.11. Ravishankar, A. and Sunil Archak. 2000. Plant Variety Protection Technology: Interplay
and Implications for India.12. Gill, Gerard J., Diana Carney and Suresh Pal. 2000. Improving Competitive Agricultural
Research Funding in India.13. Andy Hall, Norman Clark and Sulaiman, V, Rasheed. MVS Sivamohan and B. Yoganand.
2000. Coping with New Policy Agendas for Agricultural Research: The Role of InstitutionalInnovations.
14. Chand, Ramesh and Linu Mathew Philip. 2001. Subsidies and Support in WorldAgriculture: Is WTO Providing Level Playing Field ?
15. Selvarajan, S. 2001. Sustaining India’s irrigation infrastructure.16. Sulaiman. V., Rasheed and Andy Hall. 2002. Beyond Technology Dissemination-Can
Indian Agricultural Extension re-invent itself?
jk"Vªh; d`f"k vkfFkZdh ,oa uhfr vuqla/kku dsUnz
NATIONAL CENTRE FOR AGRICULTURAL ECONOMICS AND POLICY RESEARCH(Indian Council of Agricultural Research)
POST BOX No. 11305, LIBRARY AVENUE, PUSA, NEW DELHI-110012.Phone : 91-11-25713628, 25819731 Fax : 91-11-25822684 E-mail : [email protected]
http: // www.nic.in/icar/ncap/index.htm
17
Agricultural-based Interventions for
Sustainable Nutritional Security
Agricultural-based Interventions for
Sustainable Nutritional Security
POLICY
PAPER
P Adhiguru
C Ramasamy
NATIONAL CENTRE FOR
AGRICULTURAL ECONOMICS
AND POLICY RESEARCH
NEW DELHI, INDIA
TAMIL NADU
AGRICULTURAL UNIVERSITY
COIMBATORE
INDIA
It is a good piece for publication.
V.Rajagopalan, ChairmanCenter for Development and Policy Studies, Thanjavur and
Former Vice chancellor, Tamil Nadu Agricultural University, Coimbatore
This is a very good paper and brings out fact-based evidence and suggestions for achieving an important objective of sustainable nutritional security.
S.S.Acharya, DirectorInstitute of Development Studies, Jaipur
This manuscript if introduced in a book form will serve as a tool for the policy planners.
A.Susheela Thirumaran, Vice ChancellorThiruvalluvar University. Vellore
Ag
ricu
ltura
l-ba
se
d In
terv
en
tion
s fo
r Su
sta
ina
ble
Nu
trition
al S
ec
urity
NC
AP
PO
LIC
Y P
AP
ER
17
HkkÏvuqiICAR
HkkÏvuqiICAR