A Pitch for School Geo-Demography Richard Lycan Population Research Center Portland State...
28
A Pitch for School Geo- Demography Richard Lycan Population Research Center Portland State University, Oregon Association of Pacific Coast Geographers Olympia, Washington, October, 2012
-
Upload
jasmyn-gregory -
Category
Documents
-
view
221 -
download
0
Transcript of A Pitch for School Geo-Demography Richard Lycan Population Research Center Portland State...

A Pitch for School Geo-Demography
Richard Lycan Population Research CenterPortland State University, Oregon
Association of Pacific Coast GeographersOlympia, Washington, October, 2012

Purpose of paper
Provide a snapshot of the field of school demography as practiced by those of a geographical persuasion.
Briefly outline the major approaches used in school enrollment forecasting.
Show examples of how contract research in this area leads to interesting research issues.
Describe the enterprise and how it can fit into a university setting.

Who we are
The Population Research Center (PRC) is a community service organization in the College of Urban and Public Affairs at Portland State University.
PRC has some legislatively mandated functions, city and county estimates, and liaison with the U.S. Bureau of the Census.
PRC has a staff of 6 full time professionals and support staff and employs graduate student assistants, mainly from Urban Studies and Planning and Geography. About half our income is from contract research.
Most is for public agencies and non-profits.
School demography is our largest source of contract income and employs about 1.5 FTE staff. Charles Rynerson does our school demography work.
We have provided demographic services for school districts for nearly 40 years.
For the last 20 years the school support has made use of GIS providing geographically detailed forecasts.

The types of services to school districts
The most commonly requested projects are enrollment forecasts for school districts, or districts and their attendance areas.
Other services for school districts include:
Attendance area boundary changes and boundary change scenarios
School board member district reapportionment
Estimates of student generation from new housing
Field surveys to determine household composition
The studies typically include a written report and a presentation to a school board committee and/or the general public.
We have provided service to most of the mid to large school districts in Oregon and have a continuing agreement with a few.

Where do school districts get demographic services?
In house staff – Many large school districts have a staff, usually affiliated with facilities planning, that provide demographic services. The staff have skills in demography, GIS, planning, and database management. In a small district sometimes an assistant superintendent who deals with facilities does the forecasting.
Turnkey Software – There are several firms that sell software tools to provide enrollment forecasts. Often they are an appendage to school bus routing software. Examples are Edulog in Montana and Davis Demographics in California.
Private Consultants – There are several consulting firms that provide demographic services to school districts nationally. Examples are Gobalet and Lapkoff in California and McKibben Demographics in South Carolina, as well as some who work at a more local level. A&E firms sometimes provide forecasts as part of a capital plan.
Universities – Several university population research centers provide this type of service. Examples include our center in Oregon and the Applied Demography Lab at the University of Wisconsin.

The data environment
Student record is central to building forecasts.
We need historical data in order to calibrate enrollment forecasts.
The student record data is carefully geo-coded to the students’ residential locations.
Birth records also are geo-coded to mother’s residence and identify potential enrollees some five years later.
Tax-lot data from the assessor’s office provides the information about the housing units and neighborhoods where students live. We link birth records and student records to their tax-lot.
We make use of data from the decennial census and the American Community Survey.
Our forecasts are informed by advice from various other organizations such as:
Local planning departments
The regional economists with the Oregon Employment Department

Enrollment forecasts
Long versus mid-range enrollment forecasts
Long range forecasts - typically required for facilities planning and usually are for about ten years, but may extend as far as 15 or 20 years into the future.
Mid range forecasts – typically required for budget planning, staffing, transportation planning, and use of existing facilities usually include extent five years into the future.
Three types of forecasting models typically used
The grade-progression model – driven by student enrollment trends for short term forecasts and for smaller geographies, such as elementary school attendance areas.
The cohort cohort-component model – driven by births, deaths, and migration and used for larger geographies, such as school districts, and longer term forecasts.
The housing based model – driven by housing types and numbers and neighborhood turnover.
We use combinations of the three types.

Three types of enrollment forecasting models utilized
Cohort-component
Grade progression
Housing based
Combined models used for most of our forecasts
GPR 2008/2007HS | MS | ES 01/00 02/01 03/02 04/03 05/04 06/05 07/06 08/07 09/08 10/09 11/10 12/111146|1144|1136 0.98 0.99 1.02 0.94 0.97 1.07 0.99 1.03 1.10 1.00 1.01 0.891146|1144|1137 1.11 1.02 0.96 1.00 1.02 1.01 1.01 1.04 1.02 1.04 0.95 0.981146|1144|1138 1.06 1.11 0.94 1.57 1.00 1.00 1.30 1.00 1.33 0.63 0.89 0.751146|1144|1140 1.01 0.92 0.93 1.04 0.93 1.02 0.90 0.80 0.92 1.01 0.87 0.971146|1145|1138 1.16 1.08 1.07 1.04 1.00 0.93 0.91 0.93 1.01 0.85 0.98 0.911146|1145|1139 1.12 1.14 1.09 1.10 1.10 1.14 1.21 1.04 1.17 1.05 0.93 0.971146|1145|4364 0.86 1.00 0.82 0.95 1.07 1.37 1.04 1.10 0.95 1.33 0.90 1.111301|1145|1138 1.75 1.35 0.69 1.21 0.80 0.90 1.08 0.58 1.19 1.00 0.93 0.761301|1145|1369 1.14 0.94 0.89 0.92 1.08 0.96 1.07 1.24 0.88 0.88 0.95 0.951301|1145|4364 1.02 1.10 1.18 1.15 1.11 1.04 0.98 0.98 1.07 1.00 0.98 1.001301|1300|1135 1.04 1.12 0.98 1.00 0.96 0.94 0.96 1.00 0.94 0.91 1.08 0.941301|1300|1142 1.18 1.07 0.98 1.09 1.09 1.01 0.98 0.96 1.05 0.95 1.02 0.981301|1300|1143 1.02 0.96 1.01 0.91 1.01 1.01 1.02 1.00 0.93 1.04 0.92 1.021301|1300|1369 1.12 1.00 0.91 0.97 0.96 1.03 0.98 1.21 1.02 1.12 0.94 1.02District 1.07 1.03 1.00 1.02 1.02 1.03 1.01 1.00 1.03 0.99 0.97 0.97
Chart 1
TTSD Students per Single Family Home, Fall 2010
0.00
0.05
0.10
0.15
0.20
0.25
0.30
K-5 6-8 9-12
Grade Level
Stu
den
ts p
er H
om
e
Built 2000-2009
Built 1990-1999
Built before 1990
BirthsEnrollment
KG
01
….
11
12
Deaths
Population
00-04
05-09
10-14
15-17
……….
15-44
……..
75-79
80-84
85+
Migration

The Cohort Concept
Many demographic models based on tracking a cohort over time.
Can be viewed at the level of the individual
Or for groups of common origin
x+4
x+1
x+2
x+3
x+5
x
Age
t t + 1 t + 2 t + 3 t + 4 t + 5
Time
Birth of person
Death of person
Child born
Child born
Lexis Diagram
Cohort Over Time
x+4
x+1
x+2
x+3
x+5
x
Age
t t + 1 t + 2 t + 3 t + 4 t + 5
Time

The 1994 Cohort View
Enrollment History by Grade and Year
1990 1991 1992 1993 1994 1995 1996 1997 1998 1999 2000 2001 2002 2003 2004KG 980 1,011 1,041 1,144 1,175 1,186 1,291 1,195 1,248 1,245 1,296 1,378 1,381 1,504 1,51601 1,220 1,223 1,230 1,250 1,304 1,325 1,342 1,449 1,359 1,393 1,359 1,434 1,523 1,530 1,59602 1,183 1,235 1,224 1,253 1,318 1,343 1,385 1,391 1,527 1,392 1,442 1,424 1,478 1,567 1,61903 1,171 1,203 1,293 1,297 1,304 1,357 1,386 1,428 1,462 1,561 1,433 1,515 1,492 1,566 1,62004 1,154 1,242 1,243 1,352 1,383 1,360 1,391 1,442 1,496 1,488 1,656 1,541 1,536 1,561 1,65205 1,074 1,207 1,287 1,290 1,406 1,401 1,396 1,457 1,490 1,562 1,552 1,722 1,600 1,592 1,65106 1,151 1,148 1,307 1,336 1,420 1,409 1,474 1,431 1,502 1,552 1,614 1,687 1,779 1,667 1,67607 1,159 1,212 1,210 1,327 1,436 1,473 1,466 1,525 1,471 1,587 1,588 1,647 1,707 1,800 1,73008 1,120 1,173 1,259 1,239 1,358 1,453 1,533 1,504 1,550 1,550 1,612 1,679 1,687 1,759 1,85209 1,098 1,132 1,232 1,295 1,303 1,436 1,533 1,587 1,601 1,735 1,632 1,735 1,834 1,815 1,89710 1,029 1,066 1,155 1,233 1,283 1,312 1,428 1,505 1,598 1,600 1,709 1,644 1,708 1,815 1,82811 993 987 1,021 1,099 1,111 1,180 1,214 1,311 1,419 1,531 1,502 1,668 1,613 1,657 1,78212 875 929 949 953 1,028 1,039 1,149 1,138 1,201 1,350 1,435 1,399 1,517 1,470 1,621
Other 30 31 18 13 8 8 19 15 29 35 37 35 57 65 65
K-2 3,383 3,469 3,495 3,647 3,797 3,854 4,018 4,035 4,134 4,030 4,097 4,236 4,382 4,601 4,7313-5 3,399 3,652 3,823 3,939 4,093 4,118 4,173 4,327 4,448 4,611 4,641 4,778 4,628 4,719 4,9237-8 3,430 3,533 3,776 3,902 4,214 4,335 4,473 4,460 4,523 4,689 4,814 5,013 5,173 5,226 5,258
9-12 3,995 4,114 4,357 4,580 4,725 4,967 5,324 5,541 5,819 6,216 6,278 6,446 6,672 6,757 7,128Other 30 31 18 13 8 8 19 15 29 35 37 35 57 39 65Total 14,237 14,799 15,469 16,081 16,837 17,282 18,007 18,378 18,953 19,581 19,867 20,508 20,912 21,342 22,104
1994 KG Cohort
0
200
400
600
800
1,000
1,200
1,400
1,600
1,800
2,000
1994 1995 1996 1997 1998 1999 2000 2001 2002 2003 2004
KG 01 02 03 04 05 06 07 08 09 10
Year, Grade Level
En
rolle
d

Grade Progression ratio for Tigard School District
Grade Progression Ratio for DistrictYear2/Year1 01/00 02/01 03/02 04/03 05/04 06/05 07/06 08/07 09/08 10/09 11/10 12/112008/2007 1.07 1.03 1.00 1.02 1.02 1.03 1.01 1.00 1.03 0.99 0.97 0.972009/2008 1.05 1.01 1.00 0.96 1.00 0.98 0.99 1.01 1.01 1.00 0.96 0.982010/2009 1.07 1.00 1.01 1.02 1.04 1.01 1.01 0.99 1.04 1.01 1.02 1.04
0.90
0.92
0.94
0.96
0.98
1.00
1.02
1.04
1.06
1.08
01/00 02/01 03/02 04/03 05/04 06/05 07/06 08/07 09/08 10/09 11/10 12/11
2008/2007
2009/2008
2010/2009

The grade progression ratio all can be computed spatially
The dots show the location of students enrolled in Tigard Schools in Fall 2010.
The color shades show the ratio of the Fall 2010 enrollment to the same cohort one year earlier.
Green shaded areas show that the cohort declined
Blue shaded areas show growth in the cohort.

The cohort component model
Enrollment is determined as a share of the forecast school age population.
The school age population is determined by earlier births
and net migration of families with school age children.
The model is recursive, the forecast for each time period building on that 5 or ten years previous.
Provides age detail, but best used for larger geographies.
Births
Enrollment
KG
01
….
11
12
Deaths
Population
00-04
05-09
10-14
15-17
……….
15-44
……..
75-79
80-84
85+
Migration

Data that inform the cohort-component model
Fertility rates – by age race and Hispanic status. Shift from births from younger to older mothers.
Net migration rates by age and sex, perhaps the most difficult to estimate
Public school capture rates – the share of the school age population enrolled.
Net Migration Rate 1990-2000Portland Public Schools
-0.4
-0.2
0.0
0.2
0.4
0.6
0.8
1.0
00-04
05-09
10-14
15-19
20-24
25-29
30-34
35-39
40-44
45-49
50-54
55-59
60-64
65-69
70-74
75-79
80-84
85+
5 Year Age Group
Net Migrants as share
of population
In-migration of young households
Out-migration of older households and empty nesters
Out-migration of households with school aged children
2000 Capture Rates - ACS & Student Records
0
10
20
30
40
50
60
70
80
90
100
Age
Per
cen
t
2000 - Student Records
2000 - NCES/Census
2000 - Student Records 35.9 80.2 83.7 83.2 82.7 87.3 84.8 86.2 83.8 86.0 84.7 82.6 80.5 69.6 38.3
2000 - NCES/Census 81.9 80.5 82.7 83.2 84.0 85.5 85.8 85.2 84.9 85.1 84.5 82.6 78.3 64.5 46.1
05 06 07 08 09 10 11 12 13 14 15 16 17 18 19
`

Capture rate for Portland Public Schools
Computed from grid mapping of student record and census block data.
In 2000. Lower values tend to be in high income areas where more students are enrolled in private schools.
In 2010. High values tend to be in low income and minority areas where most students are enrolled in the public school system.
The change from 2000 to 2010.
The housing based model
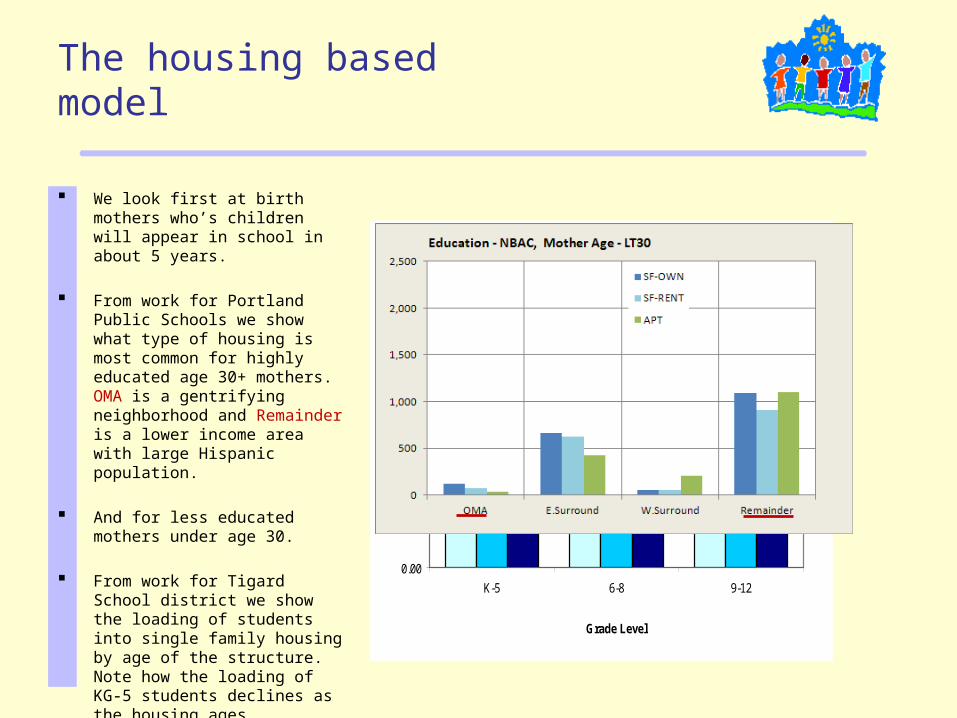
We look first at birth mothers who’s children will appear in school in about 5 years.
From work for Portland Public Schools we show what type of housing is most common for highly educated age 30+ mothers. OMA is a gentrifying neighborhood and Remainder is a lower income area with large Hispanic population.
And for less educated mothers under age 30.
From work for Tigard School district we show the loading of students into single family housing by age of the structure. Note how the loading of KG-5 students declines as the housing ages.
Chart 1
TTSD Students per Single Family Home, Fall 2010
0.00
0.05
0.10
0.15
0.20
0.25
0.30
K-5 6-8 9-12
Grade Level
Stud
ents
per
Hom
e
Built 2000-2009
Built 1990-1999
Built before 1990

Enrollment forecasting leads raises interesting issues worth of further exploration
Example One – The Hillsboro School District in suburban Portland has a large and increasing Hispanic population as well as the families of employees of Intel. It has experienced rapid population, and school enrollment, growth but recently the enrollment growth peaked.
Example Two – In some areas of older but substantial housing in Portland enrollment has been declining and schools have been closed. However in 2006 some of the schools in these neighborhoods began to show enrollment growth in kindergarten and the lower grades. A gentrification process was at work involving older, highly educated, and affluent mothers.

Example One: An enrollment forecast for Hillsboro School District focused on student generation rates
Hillsboro SD has a large Hispanic population many of whom reside in multi-family housing.
Student generation rates are relatively high in Hispanic neighborhoods but also in new suburban areas.
Most areas of newly built housing show high student generation ratios.
Areas where seniors out-migrate result in turnover and in-migration of younger households.
As new housing ages the students advance in age and eventually leave home.

Example Two: Draws from a forecast for Portland Public Schools
School enrollment for the Portland District reflects the economic and housing epochs of the past 150 years, recently declining after the echo of the post WWII baby boom passed through.
However, in just since about 2005 the District’s enrollment has shown a modest uptick.

The setting for the Portland School District
The Portland District is largely built out and surrounded by growing suburban areas.
There has been some infill and replacement single family housing in the District, but most of the construction has been multi-family and does not generate much student enrollment.
Only about 50 students come from the 20,000 units in the trendy Pearl District (A) but high value new housing (such as at B) has contributed some growth.
The recent up-tick in enrollment is due more to turn-over than to new construction.
A
B

An important factor in the turnaround has been the larger share of births to older mothers
In 2001 the number of births in the District to older (age 30+) mothers
equaled those to younger mothers (under age 30)
Total births stayed about the same

1990 1994 1998
2002 20082006
Proportion of Births to Older Mothers
There was growth in the number of births to older mothers across the District, but that on the east side was mainly after 2000
Of particular interest was the “East Older Mothers area (East OMA).
EastOMAEast
OMAEastOMA
EastOMA
EastOMA
EastOMA

Here is a map showing the births per acre for older moms (age 30+) who have a baccalaureate degree of higher (42% of the District’s births from 2007-2009).
The counterpoint map shows mothers under age 30 with less than baccalaureate level of education. This area include the areas with large Hispanic populations (31%).
Mothers under age 30 with baccalaureate level of education. This may be a younger group of gentrifying households, but perhaps many of them are childless (10%).
The group of older mothers age 30 plus with less than a baccalaureate education (16%).
And finally, a combined map of older more educated and younger less educated mothers (combined 73% of births).
The four combinations of mother’s age and education

Gentrification based on Percent College Educated and Employed in MTP Occupations – following Ley, 1996
From 1990 to 2000 the average change in proportion with college degree and employed in MTP occupations rose around the edge of the East OMA.
From 2000 to 2008 the measure of gentrification spread out beyond the East OMA.
Ley depicts gentrifying areas as being in the top 20% of tracts with respect to change in the composite education and MTP employment index.
EastOMA

Conclusions
Yes, the shift in births from younger to older mothers and gentrification of some of Portland’s 100 year old housing did help turn around the decline in the district, and likely saved some schools from closing.
Our school demography work has been successful with many districts returning for new or updated forecasts. PRC has a reputation for unbiased and well thought out forecasts, although we have not always been right.
We support about 1.5 researchers doing enrollment forecasts. The individual projects bring in from $3,000 for a simple update to $60,000 for a metropolitan district.
A large part of the cost of a school forecast is in the database development. This provides employment for students with GIS skills. Repeat business with districts lowers the cost for this part of the work.
Should you take on this type of work?
Good – Learn about the social geography of communities, provide employment for students, satisfaction with providing a valuable service, discover puzzles to be solved.
No so good – Need long term commitment, patience in working with school administrators and committees, may be hard to manage time commitments if teaching.

Sources of information
The website for the Population Research Center. Examples of forecasts: http://www.pdx.edu/prc/school-enrollment Papers and presentations on school demography: http://
www.pdx.edu/prc/publications
Books Plane, David and Peter A. Rogerson. The Geographical Analysis of Population with
Applications to Planning and Business, John Wiley and Sons, 1993. Siegal, Jacob S. and David A. Swanson. The Methods and Materials of Demography,
Second Edition. Elsevier Academic Press, 2004.
Conferences to learn, present AAG, Population Specialty Group Population Association of American, Applied Demography Specialty Group Applied Demography biannual conference ESRI Education Conference Southern Demographic Association Richard Lycan – [email protected]
Charles Rynerson – [email protected]

Fee Schedule
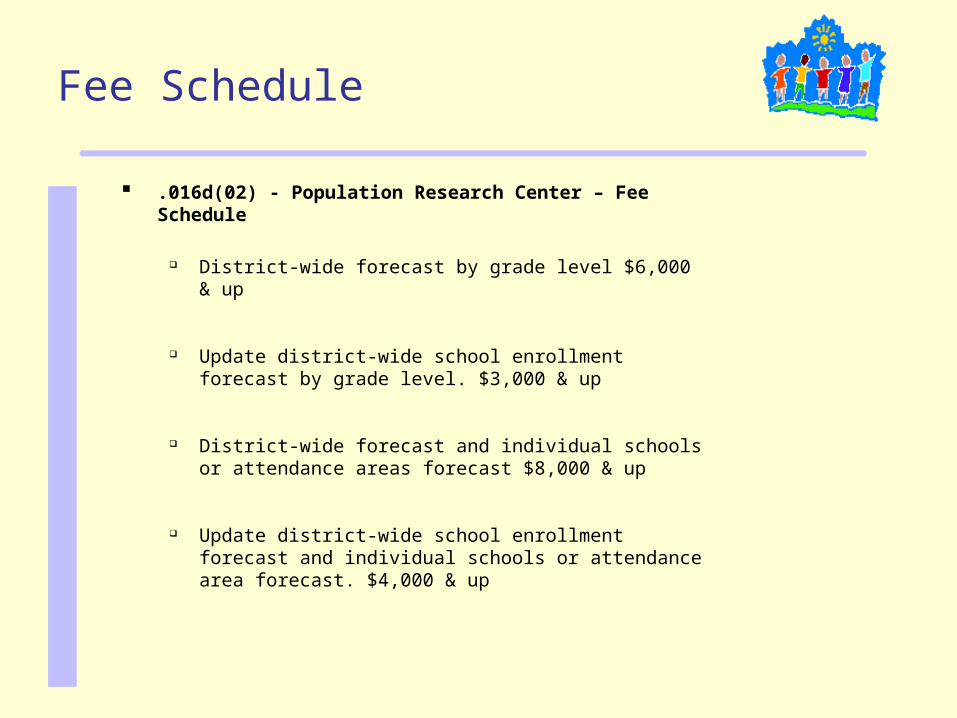
.016d(02) - Population Research Center – Fee Schedule
District-wide forecast by grade level $6,000 & up
Update district-wide school enrollment forecast by grade level. $3,000 & up
District-wide forecast and individual schools or attendance areas forecast $8,000 & up
Update district-wide school enrollment forecast and individual schools or attendance area forecast. $4,000 & up