A Physics-Based Parameterization of Air–Sea Momentum · PDF fileA Physics-Based...
11
A Physics-Based Parameterization of Air–Sea Momentum Flux at High Wind Speeds and Its Impact on Hurricane Intensity Predictions IL-JU MOON,* ISAAC GINIS,TETSU HARA, AND BIJU THOMAS Graduate School of Oceanography, University of Rhode Island, Narragansett, Rhode Island (Manuscript received 12 December 2005, in final form 10 October 2006) ABSTRACT A new bulk parameterization of the air–sea momentum flux at high wind speeds is proposed based on coupled wave–wind model simulations for 10 tropical cyclones that occurred in the Atlantic Ocean during 1998–2003. The new parameterization describes how the roughness length increases linearly with wind speed and the neutral drag coefficient tends to level off at high wind speeds. The proposed parameterization is then tested on real hurricanes using the operational Geophysical Fluid Dynamics Laboratory (GFDL) coupled hurricane–ocean prediction model. The impact of the new parameterization on the hurricane prediction is mainly found in increased maximum surface wind speeds, while it does not appreciably affect the hurricane central pressure prediction. This helps to improve the GFDL model–predicted wind–pressure relationship in strong hurricanes. Attempts are made to provide physical explanations as to why the reduced drag coefficient affects surface wind speeds but not the central pressure in hurricanes. 1. Introduction The transfer of momentum between the atmosphere and the ocean is a crucial subject in atmospheric mod- eling and weather forecasting. In most global and me- soscale atmospheric models the momentum exchange at the sea surface is parameterized using the drag co- efficient (C d ) that increases approximately linearly with wind speed. This behavior of the C d is based on ex- trapolations from field measurements in weak-to- moderate wind regimes less than 25 m s 1 . In strong wind conditions, it has been reported that the Geo- physical Fluid Dynamics Laboratory (GFDL) hurri- cane prediction model, used operationally by the U.S. National Hurricane Center, tends to underestimate the surface wind speed for a given central pressure (Ginis et al. 2004, see their Fig. 2). This may be partly attrib- uted to an insufficient horizontal grid resolution. How- ever, a more likely reason is the inadequate represen- tation of the physical processes that affect air–sea mo- mentum exchanges at high wind speeds. Recently, Moon et al. (2004a,b,c) used a coupled wave–wind (CWW) model to show that the drag coef- ficient levels off (or even decreases) at wind speeds exceeding 30 m s 1 . This behavior of the C d at high wind speeds was also found in recent field observations of Powell et al. (2003), laboratory experiments of Alamaro et al. (2002) and Donelan et al. (2004), and theoretical studies of Emanuel (2003) and Makin (2005). Although physical explanations vary and are not conclusive, there is a general consensus that the C d ceases to increase with wind speed at high wind speeds. Therefore, the present parameterization of the C d in atmospheric models, where the C d linearly increases with wind speed, clearly overestimates the momentum flux at high wind speeds. The overestimated momen- tum flux likely contributes to the limited skill of nu- merical hurricane intensity prediction. Reduced C d at high winds will likely have a significant impact not only on hurricane modeling but also on other atmospheric and oceanic modeling focusing on high wind conditions. However, no studies have been performed to investi- gate the effect of reduced C d at high wind speeds on atmospheric and oceanic modeling. Since direct flux measurements at very high wind speeds are still extremely limited (Kepert 2004; French 2005), theoretical and numerical approaches may pro- * Current affiliation: College of Ocean Science, Cheju National University, Aradong, Jejusi, South Korea. Corresponding author address: Il-Ju Moon, Graduate School of Oceanography, University of Rhode Island, Narragansett, RI 02882. E-mail: [email protected] AUGUST 2007 MOON ET AL. 2869 DOI: 10.1175/MWR3432.1 © 2007 American Meteorological Society MWR3432
-
Upload
hoangkhanh -
Category
Documents
-
view
233 -
download
1
Transcript of A Physics-Based Parameterization of Air–Sea Momentum · PDF fileA Physics-Based...
A Physics-Based Parameterization of Air–Sea Momentum Flux at High Wind Speedsand Its Impact on Hurricane Intensity Predictions
IL-JU MOON,* ISAAC GINIS, TETSU HARA, AND BIJU THOMAS
Graduate School of Oceanography, University of Rhode Island, Narragansett, Rhode Island
(Manuscript received 12 December 2005, in final form 10 October 2006)
ABSTRACT
A new bulk parameterization of the air–sea momentum flux at high wind speeds is proposed based oncoupled wave–wind model simulations for 10 tropical cyclones that occurred in the Atlantic Ocean during1998–2003. The new parameterization describes how the roughness length increases linearly with windspeed and the neutral drag coefficient tends to level off at high wind speeds. The proposed parameterizationis then tested on real hurricanes using the operational Geophysical Fluid Dynamics Laboratory (GFDL)coupled hurricane–ocean prediction model. The impact of the new parameterization on the hurricaneprediction is mainly found in increased maximum surface wind speeds, while it does not appreciably affectthe hurricane central pressure prediction. This helps to improve the GFDL model–predicted wind–pressurerelationship in strong hurricanes. Attempts are made to provide physical explanations as to why the reduceddrag coefficient affects surface wind speeds but not the central pressure in hurricanes.
1. Introduction
The transfer of momentum between the atmosphereand the ocean is a crucial subject in atmospheric mod-eling and weather forecasting. In most global and me-soscale atmospheric models the momentum exchangeat the sea surface is parameterized using the drag co-efficient (Cd) that increases approximately linearly withwind speed. This behavior of the Cd is based on ex-trapolations from field measurements in weak-to-moderate wind regimes less than 25 m s�1. In strongwind conditions, it has been reported that the Geo-physical Fluid Dynamics Laboratory (GFDL) hurri-cane prediction model, used operationally by the U.S.National Hurricane Center, tends to underestimate thesurface wind speed for a given central pressure (Giniset al. 2004, see their Fig. 2). This may be partly attrib-uted to an insufficient horizontal grid resolution. How-ever, a more likely reason is the inadequate represen-
tation of the physical processes that affect air–sea mo-mentum exchanges at high wind speeds.
Recently, Moon et al. (2004a,b,c) used a coupledwave–wind (CWW) model to show that the drag coef-ficient levels off (or even decreases) at wind speedsexceeding 30 m s�1. This behavior of the Cd at highwind speeds was also found in recent field observationsof Powell et al. (2003), laboratory experiments ofAlamaro et al. (2002) and Donelan et al. (2004), andtheoretical studies of Emanuel (2003) and Makin(2005). Although physical explanations vary and arenot conclusive, there is a general consensus that the Cd
ceases to increase with wind speed at high wind speeds.Therefore, the present parameterization of the Cd inatmospheric models, where the Cd linearly increaseswith wind speed, clearly overestimates the momentumflux at high wind speeds. The overestimated momen-tum flux likely contributes to the limited skill of nu-merical hurricane intensity prediction. Reduced Cd athigh winds will likely have a significant impact not onlyon hurricane modeling but also on other atmosphericand oceanic modeling focusing on high wind conditions.However, no studies have been performed to investi-gate the effect of reduced Cd at high wind speeds onatmospheric and oceanic modeling.
Since direct flux measurements at very high windspeeds are still extremely limited (Kepert 2004; French2005), theoretical and numerical approaches may pro-
* Current affiliation: College of Ocean Science, Cheju NationalUniversity, Aradong, Jejusi, South Korea.
Corresponding author address: Il-Ju Moon, Graduate School ofOceanography, University of Rhode Island, Narragansett, RI02882.E-mail: [email protected]
AUGUST 2007 M O O N E T A L . 2869
DOI: 10.1175/MWR3432.1
© 2007 American Meteorological Society
MWR3432
vide a useful and complementary way to develop newflux parameterizations in a wide range of wind condi-tions without the limitations of available observationaldata. This study proposes a simple parameterization ofair–sea momentum fluxes for high wind conditions,based on the CWW model simulations (Moon et al.2004c) for 10 tropical cyclones in the Atlantic Oceanduring 1998–2003. The new parameterization is com-pared with available observations and results fromother theoretical/numerical studies, and is applied tothe GFDL coupled hurricane–ocean prediction systemto investigate its effect on real hurricane simulations.
In section 2, the main features of the CWW modelwill be briefly discussed since the present approachstrongly depends on the results of the CWW modelsimulations. A new parameterization based on hurri-cane simulation results is proposed in section 3. Section4 describes the numerical experiments for real hurri-canes using the new flux parameterization. The sum-mary and conclusion are given in the last section.
2. CWW model
In the CWW model the surface wave directional fre-quency spectrum near the spectral peak is calculatedusing the WAVEWATCH-III (Tolman 2002) modeland the high-frequency part of the spectrum is param-eterized using the theoretical model of Hara andBelcher (2002). The complete wave spectrum is thenintroduced to the wave boundary layer model of Haraand Belcher (2004) to estimate the drag coefficient atdifferent wind and wave conditions. The CWW modeltreats the wind stress as a vector quantity to considerthe influence of dominant waves that propagate at alarge angle to the local wind. Therefore, the methodallows us to estimate the wind stress vectors for anygiven surface wave field, even for the complex seasencountered under tropical cyclones. The details of themodel are provided in Moon et al. (2004a,b).
The CWW model has been applied for constantwinds from 10 to 45 m s�1 (Moon et al. 2004a), ideal-ized hurricanes with various forward speeds (Moon etal. 2004b), and 10 real hurricanes in the Atlantic Oceanduring 1998–2003 (Moon et al. 2004c). The main resultsof these studies are that the neutral drag coefficientlevels off at high wind speeds and the nondimensionalroughness length is mainly determined by two param-eters: the input wave age (wave age determined by thepeak frequency of wind energy input) and the windspeed, regardless of the complexity of the wave field.The model-simulated drag coefficients are generallyconsistent with the recent results of field observations,
laboratory experiments, and theoretical studies at highwind speeds (Powell et al. 2003; Alamaro et al. 2002;Donelan et al. 2004; Emanuel 2003).
3. New parameterization of air–sea momentumflux
At low winds (wind speed less than 12.5 m s�1) thebulk parameterization used in the operational GFDLhurricane model is consistent with previous observa-tions. Therefore, the roughness length (z0) in our pa-rameterization is identical to the bulk parameterizationand is calculated using a constant Charnock coefficientor nondimensional roughness length (zch), defined as
zch �z0g
u2
*� 0.0185, �1�
where u* is the friction velocity and g is the gravita-tional acceleration. In neutral conditions the neutralwind speed (W) at 10-m height is described by the loga-rithmic profile,
W �u*�
ln10z0
, �2�
where � is the von Kármán constant (�0.4) and the unitof z0 is meters. From Eqs. (1) and (2), the friction ve-locity u* (m s�1) can be expressed as a function of W(m s�1) using polynomial fitting,
u* � 0.001W2 � 0.028W, W � 12.5 m s�1, �3�
where the regression coefficient is 0.99. The roughnesslength can be also expressed as a function of W:
z0 �0.0185
g�0.001W2 � 0.028W�2, W � 12.5 m s�1.
�4�
Our parameterization of z0 at higher winds speeds(W � 12.5 m s�1) is based on the CWW simulations of10 tropical cyclones that occurred in the Atlantic Oceanduring 1998–2003, reported by Moon et al. (2004c).Their scatterplot of calculated z0 against wind speed isreproduced in Fig. 1a (plus signs). We then establish anempirical relationship between z0 and W by fitting theCWW results with a linear regression function:
z0 � �0.085W � 0.58� � 10�3, W � 12.5 m s�1,
�5�
where the regression coefficient is 0.87 (see Fig. 1a, blueline).
2870 M O N T H L Y W E A T H E R R E V I E W VOLUME 135
The expressions (4) and (5) match well at W � 12.5m s�1 with the difference of 1 � 10�6 and togethermake up our new parameterization of z0 for all windspeeds. In most ocean models the air–sea momentumflux is calculated using the neutral drag coefficient Cd
(Flather 1994; Tang et al. 1996). An expression of theneutral Cd as a function of W can be obtained by intro-ducing (4) or (5) into
Cd � �2�ln10z0��2
. �6�
In many atmospheric and weather prediction models,the air–sea momentum flux is calculated using z0 as afunction of u* (Charnock 1955; Kurihara and Tuleya1974). Such a formulation is obtained by first express-ing W as a function of u* from (2) and (5),
W � �0.56u2
* � 20.255u* � 2.458, �7�
using polynomial fitting (where the regression coeffi-cient is 0.99), and then combining (1), (5), and (7):
z0 �0.0185
gu2
*, W � 12.5 m s�1 and �8a�
z0 � 0.085��0.56u2
* � 20.255u* � 2.458�
� 0.58 � 10�3, W � 12.5 m s�1. �8b�
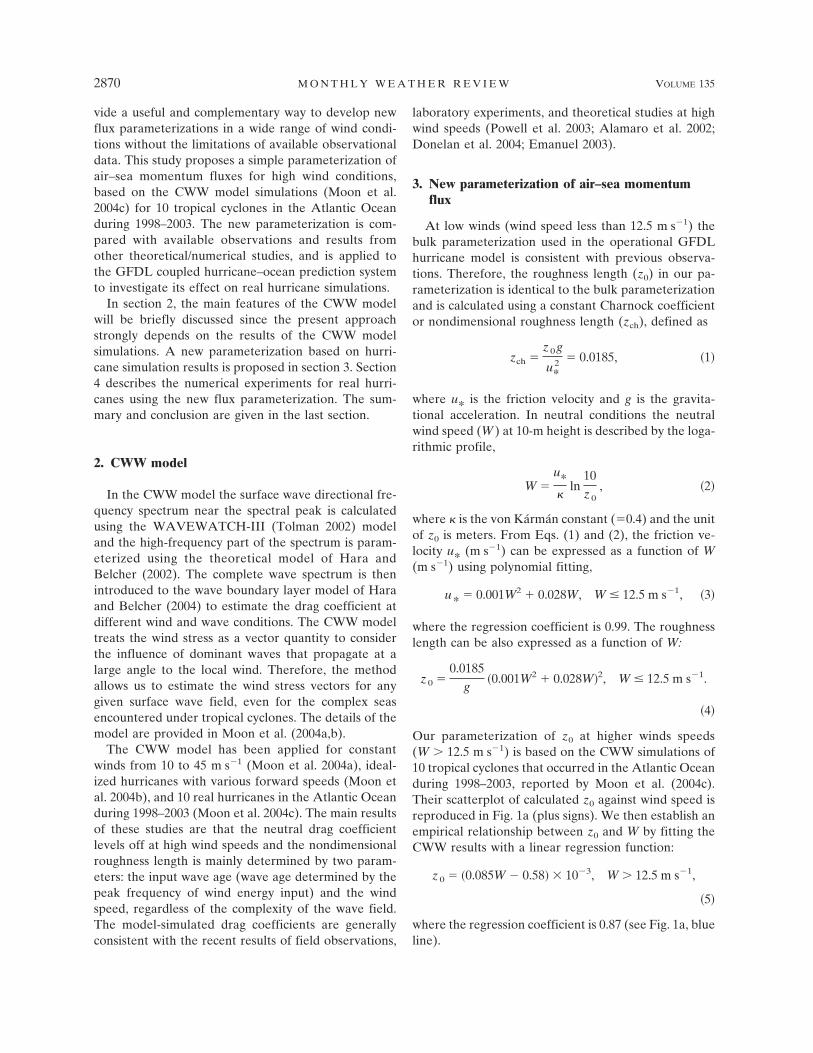
Figure 1b compares the neutral drag coefficient esti-mated from our new formulation (thick blue line) withthe bulk parameterization used in the operationalGFDL model, the results from Wu (1982), Large andPond (1981), Donelan et al. (2004), and Powell et al.(2003). For W � 12.5 m s�1, the new Cd represents amonotonic increase with wind speed as in the opera-tional GFDL model and is similar to that of Wu (1982).But it is slightly higher than those of Large and Pond(1981) and Donelan et al. (2004). For W � 12.5 m s�1,the new Cd tends to level off between 2 and 3. This issimilar to the trend observed by Donelan et al. (2004)and is within the error bars estimated by Powell et al.(2003), although it is somewhat higher than their aver-aged values (squares in Fig. 1b). At 60 m s�1 windspeed, the new Cd is half of the value used in the op-erational GFDL model.
It should be noted that at high wind speeds theboundary layer close to the surface is nearly neutralsince ln z /z0 k fm(z /L), where fm is the universal func-tion and L is the Monin–Obukhov (MO) length. At lowwinds, however, the stability effect may be important.In the following numerical experiments the parameter-ization in (8) is used to define the roughness length, andthen the real 10-m wind speed and exchange coeffi-cients are calculated through the iteration using stabil-ity parameters and universal functions based on theMO similarity theory (Liu et al. 1979; DeCosmo et al.1996).
FIG. 1. (a) Roughness length and (b) drag coefficient vs wind speed in m s�1 at 10 m. Redcircles and gray plus signs are the results of the Hurricane Ivan forecast (initial time: 0000UTC 12 Sep 2004) from the operational GFDL hurricane model and the CWW model,respectively; blue lines in (a) and (b) are the new z0 and Cd formulations based on the neutral10-m wind speed, respectively; the black solid line is data according to Large and Pond (1981);the dashed–dotted line is data according to Donelan et al. (2004); squares are averaged valuesfrom the data of Powell et al. (2003); vertical bars are the range of estimates based on 95%confidence.
AUGUST 2007 M O O N E T A L . 2871
Fig 1 live 4/C
4. Impact of the new momentum fluxparameterization on the GFDL model hurricanepredictions
The proposed parameterization has been tested forreal hurricane predictions using the operational GFDLhurricane prediction model, which is coupled with thePrinceton ocean model. The GFDL model is a primi-tive equation model formulated in latitude, longitude,and sigma coordinates with 42 levels in the vertical.Major features of the model are given by Kurihara et al.(1998). The model includes a multiply nested movablemesh configuration and model initialization by themethod of vortex replacement (Kurihara et al. 1993).The 2005 version of the GFDL model, which has amovable innermost mesh of 1/12°, is used in the presentexperiments. Five-day forecasts are conducted for 11cases of Hurricanes Isabel (2003), Ivan (2004), Frances(2004), Jeanne (2004), and Charley (2004), that is, fourcases for Isabel (0000 UTC 10 September, 1800 UTC 18September, 0000 UTC 12 September, and 0000 UTC 12September), four cases for Ivan (0000 UTC 10 Septem-ber, 0600 UTC 10 September, 0000 UTC 11 September,and 0000 UTC 12 September), and one case each forFrances (0600 UTC 1 September), Jeanne (0000 UTC19 September), and Charley (1800 UTC 11 August).The initial forecast times of each hurricane are carefullyselected to consider various situations. During the fore-cast periods, Hurricanes Isabel and Ivan reached up tocategory 5 on the Saffir–Simpson scale. Charley (cat-egory 4) made landfall and underwent both developingand decaying stages. Frances was in a weakening stagefrom category 4 to 1, while Jeanne was in a developingstage from category 1 to 2.
Two forecast runs are conducted for each case. Inboth experiments, the flux calculations are made usingthe GFDL model original bulk parameterization basedon the MO similarity theory. The neutral drag coeffi-cient is expressed by Eq. (6). The neutral exchangecoefficient of heat and water (assumed equal, Ck) isexpressed as (DeCosmo et al. 1996; Zeng et al. 1998;Kurihara and Tuleya 1974)
Ck � k2�ln10z0��1�ln
10zT��1
, �9�
where zT (m) is the roughness length for heat and hu-midity fluxes (assumed equal).
In the first control run (operational GFDL model),both z0 and zT are defined by Charnock’s relation,0.0185g/u2
*, of the formulation in (1). In the second run,zT is defined by the same Charnock’s relation, but z0 isdefined by new empirical formulation in (8). This im-plies that Ck in the second run is also decreased due to
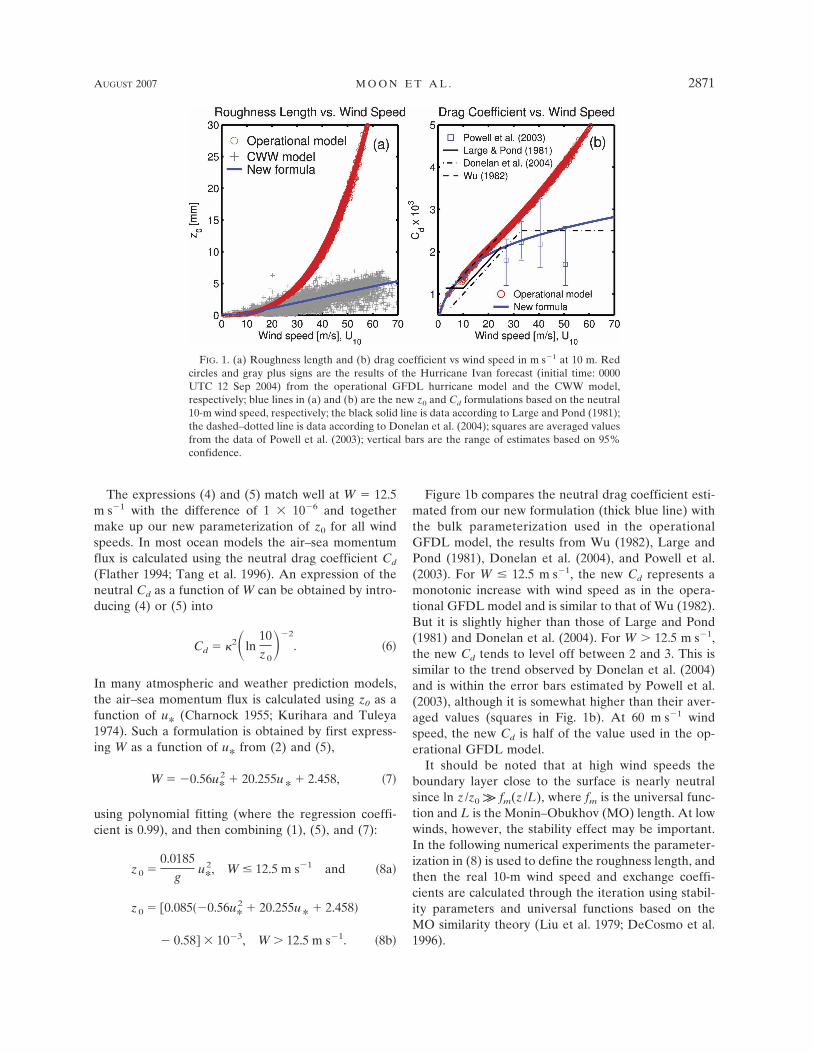
the reduced values of z0 by the new formula at highwind speeds (see Fig. 2), although the heat and humid-ity parameterizations are not modified here. It is cer-tainly possible that the value of zT at high wind speedsis also different from the Charnock’s relation. How-ever, the objective of this study is to focus on the effectof decreased z0, and therefore zT is kept unchanged.
The ratio of the neutral drag and heat/humidity co-efficients, Ck /Cd, is a key parameter in tropical cycloneintensity (Emanuel 1995). Figure 3 shows the scatter-plot of Ck /Cd for two runs. In the first run, Ck /Cd is 1,while in the second run it lies in the range 0.7–1.4 andincreases as wind speed increases. The latter trend isqualitatively consistent with Emanuel (1995) whoshows, using a hurricane model, that the ratio lies in therange 0.75–1.5 and increases with maximum wind whenhurricanes intensify. This, however, contradicts thestudies by Liu et al. (1979) and Geernaert et al. (1987),who show that the ratio Ck /Cd is less than 1 and de-creases with increasing wind. As Bao et al. (2002) pointout, the behavior of Ck /Cd at high winds is still contro-versial due to lack of reliable observation data underhigh wind conditions.
The effect of the new flux parameterization on hur-ricane predictions is investigated in terms of the fore-cast skill for the surface maximum wind speed (MWS),
FIG. 2. Scatterplot of the neutral heat/humidity coefficientagainst wind speed at 10 m from the Hurricane Ivan forecast(initial time: 0000 UTC 12 Sep 2004). Circles are from the opera-tional GFDL hurricane model and plus signs are from the GFDLmodel run using the new momentum flux parameterization.
2872 M O N T H L Y W E A T H E R R E V I E W VOLUME 135
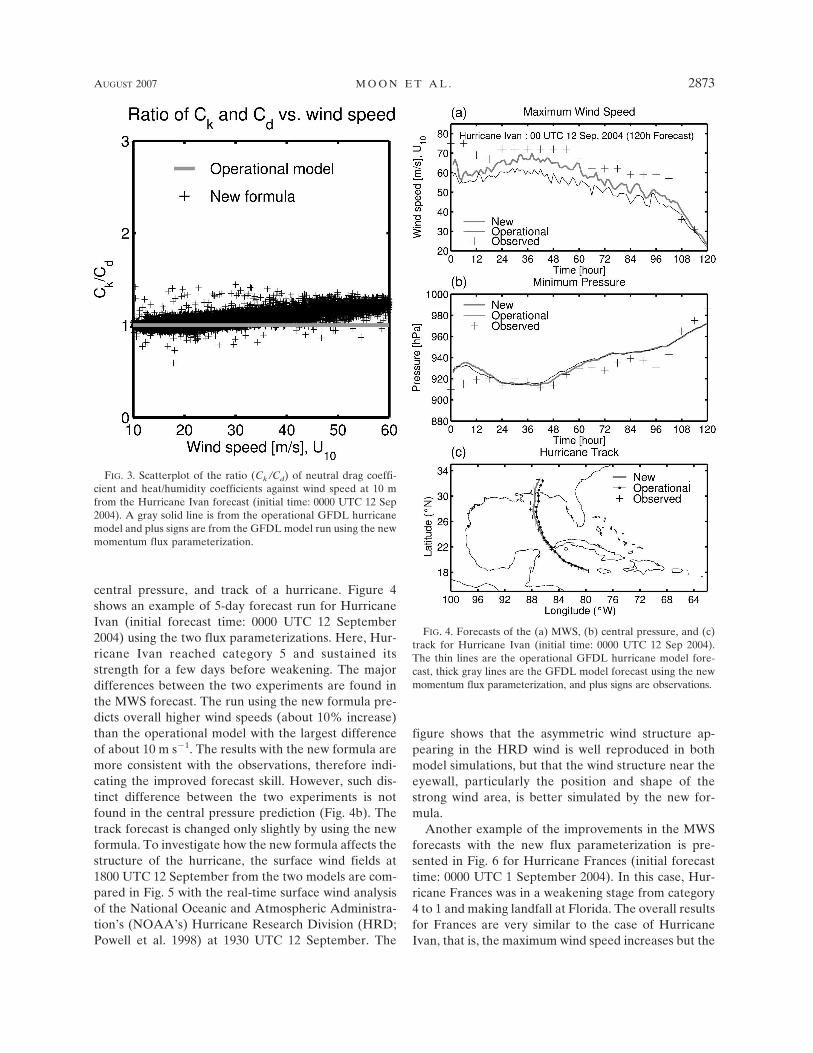
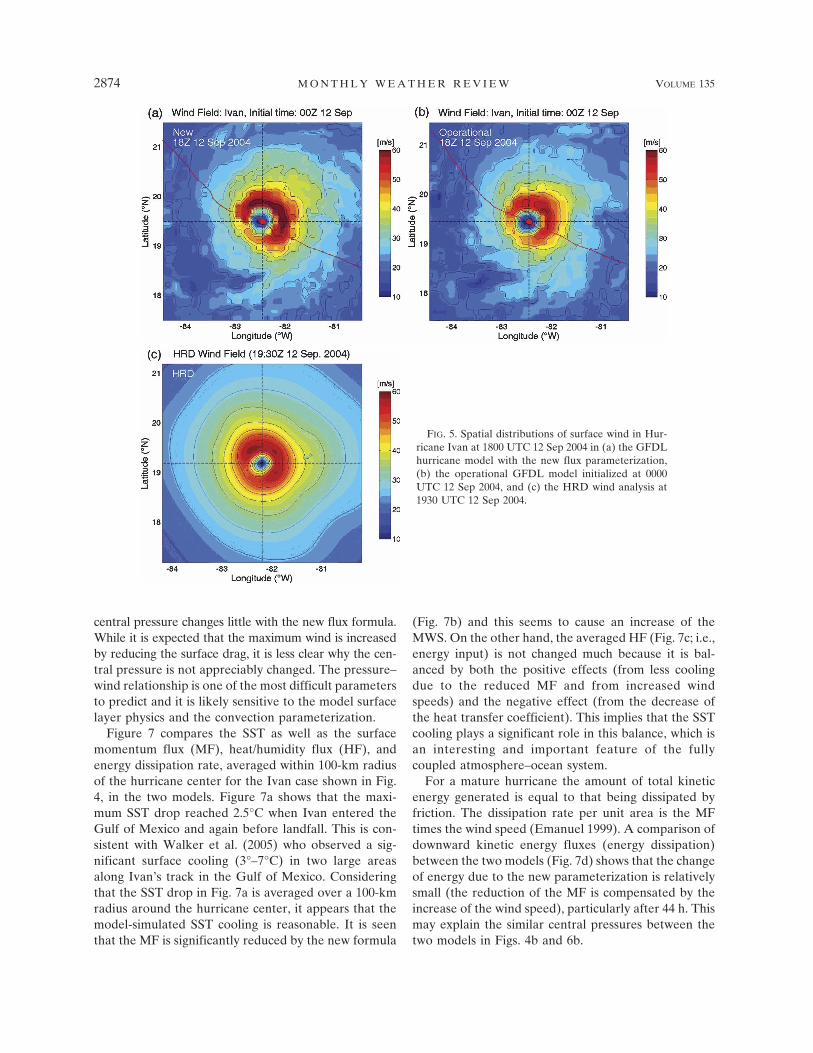
central pressure, and track of a hurricane. Figure 4shows an example of 5-day forecast run for HurricaneIvan (initial forecast time: 0000 UTC 12 September2004) using the two flux parameterizations. Here, Hur-ricane Ivan reached category 5 and sustained itsstrength for a few days before weakening. The majordifferences between the two experiments are found inthe MWS forecast. The run using the new formula pre-dicts overall higher wind speeds (about 10% increase)than the operational model with the largest differenceof about 10 m s�1. The results with the new formula aremore consistent with the observations, therefore indi-cating the improved forecast skill. However, such dis-tinct difference between the two experiments is notfound in the central pressure prediction (Fig. 4b). Thetrack forecast is changed only slightly by using the newformula. To investigate how the new formula affects thestructure of the hurricane, the surface wind fields at1800 UTC 12 September from the two models are com-pared in Fig. 5 with the real-time surface wind analysisof the National Oceanic and Atmospheric Administra-tion’s (NOAA’s) Hurricane Research Division (HRD;Powell et al. 1998) at 1930 UTC 12 September. The
figure shows that the asymmetric wind structure ap-pearing in the HRD wind is well reproduced in bothmodel simulations, but that the wind structure near theeyewall, particularly the position and shape of thestrong wind area, is better simulated by the new for-mula.
Another example of the improvements in the MWSforecasts with the new flux parameterization is pre-sented in Fig. 6 for Hurricane Frances (initial forecasttime: 0000 UTC 1 September 2004). In this case, Hur-ricane Frances was in a weakening stage from category4 to 1 and making landfall at Florida. The overall resultsfor Frances are very similar to the case of HurricaneIvan, that is, the maximum wind speed increases but the
FIG. 3. Scatterplot of the ratio (Ck /Cd) of neutral drag coeffi-cient and heat/humidity coefficients against wind speed at 10 mfrom the Hurricane Ivan forecast (initial time: 0000 UTC 12 Sep2004). A gray solid line is from the operational GFDL hurricanemodel and plus signs are from the GFDL model run using the newmomentum flux parameterization.
FIG. 4. Forecasts of the (a) MWS, (b) central pressure, and (c)track for Hurricane Ivan (initial time: 0000 UTC 12 Sep 2004).The thin lines are the operational GFDL hurricane model fore-cast, thick gray lines are the GFDL model forecast using the newmomentum flux parameterization, and plus signs are observations.
AUGUST 2007 M O O N E T A L . 2873
central pressure changes little with the new flux formula.While it is expected that the maximum wind is increasedby reducing the surface drag, it is less clear why the cen-tral pressure is not appreciably changed. The pressure–wind relationship is one of the most difficult parametersto predict and it is likely sensitive to the model surfacelayer physics and the convection parameterization.
Figure 7 compares the SST as well as the surfacemomentum flux (MF), heat/humidity flux (HF), andenergy dissipation rate, averaged within 100-km radiusof the hurricane center for the Ivan case shown in Fig.4, in the two models. Figure 7a shows that the maxi-mum SST drop reached 2.5°C when Ivan entered theGulf of Mexico and again before landfall. This is con-sistent with Walker et al. (2005) who observed a sig-nificant surface cooling (3°–7°C) in two large areasalong Ivan’s track in the Gulf of Mexico. Consideringthat the SST drop in Fig. 7a is averaged over a 100-kmradius around the hurricane center, it appears that themodel-simulated SST cooling is reasonable. It is seenthat the MF is significantly reduced by the new formula
(Fig. 7b) and this seems to cause an increase of theMWS. On the other hand, the averaged HF (Fig. 7c; i.e.,energy input) is not changed much because it is bal-anced by both the positive effects (from less coolingdue to the reduced MF and from increased windspeeds) and the negative effect (from the decrease ofthe heat transfer coefficient). This implies that the SSTcooling plays a significant role in this balance, which isan interesting and important feature of the fullycoupled atmosphere–ocean system.
For a mature hurricane the amount of total kineticenergy generated is equal to that being dissipated byfriction. The dissipation rate per unit area is the MFtimes the wind speed (Emanuel 1999). A comparison ofdownward kinetic energy fluxes (energy dissipation)between the two models (Fig. 7d) shows that the changeof energy due to the new parameterization is relativelysmall (the reduction of the MF is compensated by theincrease of the wind speed), particularly after 44 h. Thismay explain the similar central pressures between thetwo models in Figs. 4b and 6b.
FIG. 5. Spatial distributions of surface wind in Hur-ricane Ivan at 1800 UTC 12 Sep 2004 in (a) the GFDLhurricane model with the new flux parameterization,(b) the operational GFDL model initialized at 0000UTC 12 Sep 2004, and (c) the HRD wind analysis at1930 UTC 12 Sep 2004.
2874 M O N T H L Y W E A T H E R R E V I E W VOLUME 135
Fig 5 live 4/C

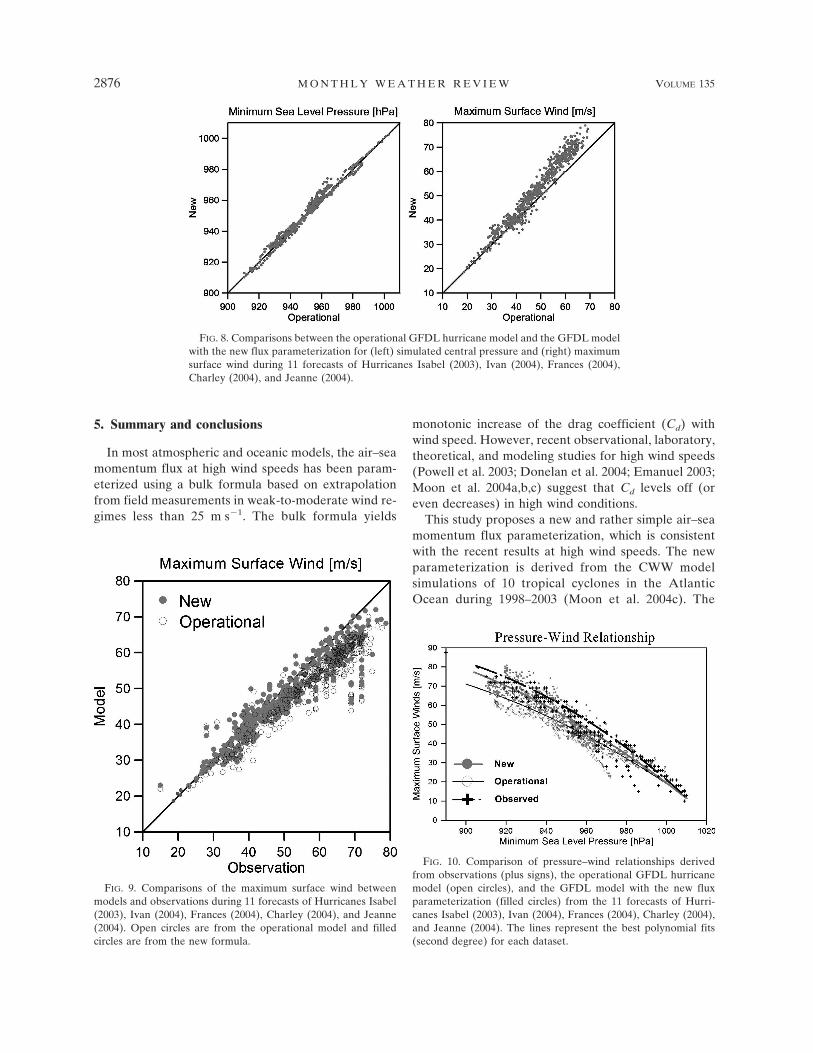
For all 11 cases, predictions of the central pressureand the MWS between 2 models are compared in Fig. 8.The figure shows that the new flux parameterizationtends to increase the MWS but does not affect the cen-tral pressure under a wide range of conditions. Figure 9compares the MWS from 2 models with observationsduring 11 forecasts of 5 hurricanes. This shows that thepredicted MWS with the new formula are more consis-tent with observations than the one from the opera-tional model. In Fig. 10, a pressure–wind relationshipderived from observations is compared with the predic-tions from 2 models for the same 11 cases. It is clearlyseen that the underestimation of the MWS in the op-erational GFDL model is significantly improved by us-ing the new flux parameterization, in particular, forstrong hurricanes.
Therefore, it is expected that the new flux param-eterization contributes to the overall improvement ofthe hurricane MWS forecast in the GFDL model, al-though more real case forecasts are necessary to con-firm these results.
FIG. 6. Same as in Fig. 4 but for Hurricane Frances (initial time:0600 UTC 1 Sep 2004).
FIG. 7. Time series of the (a) SST decrease, (b) momentumfluxes, (c) latent heat fluxes, and (d) downward kinetic energyfluxes, averaged around the hurricane center (radius � 100 km)for the forecast of Hurricane Ivan (initial time: 0000 UTC 12 Sep2004). Thin lines are from the operational GFDL hurricane modeland thick gray lines are from the GFDL model run using the newmomentum flux parameterization.
AUGUST 2007 M O O N E T A L . 2875
5. Summary and conclusions
In most atmospheric and oceanic models, the air–seamomentum flux at high wind speeds has been param-eterized using a bulk formula based on extrapolationfrom field measurements in weak-to-moderate wind re-gimes less than 25 m s�1. The bulk formula yields
monotonic increase of the drag coefficient (Cd) withwind speed. However, recent observational, laboratory,theoretical, and modeling studies for high wind speeds(Powell et al. 2003; Donelan et al. 2004; Emanuel 2003;Moon et al. 2004a,b,c) suggest that Cd levels off (oreven decreases) in high wind conditions.
This study proposes a new and rather simple air–seamomentum flux parameterization, which is consistentwith the recent results at high wind speeds. The newparameterization is derived from the CWW modelsimulations of 10 tropical cyclones in the AtlanticOcean during 1998–2003 (Moon et al. 2004c). The
FIG. 9. Comparisons of the maximum surface wind betweenmodels and observations during 11 forecasts of Hurricanes Isabel(2003), Ivan (2004), Frances (2004), Charley (2004), and Jeanne(2004). Open circles are from the operational model and filledcircles are from the new formula.
FIG. 10. Comparison of pressure–wind relationships derivedfrom observations (plus signs), the operational GFDL hurricanemodel (open circles), and the GFDL model with the new fluxparameterization (filled circles) from the 11 forecasts of Hurri-canes Isabel (2003), Ivan (2004), Frances (2004), Charley (2004),and Jeanne (2004). The lines represent the best polynomial fits(second degree) for each dataset.
FIG. 8. Comparisons between the operational GFDL hurricane model and the GFDL modelwith the new flux parameterization for (left) simulated central pressure and (right) maximumsurface wind during 11 forecasts of Hurricanes Isabel (2003), Ivan (2004), Frances (2004),Charley (2004), and Jeanne (2004).
2876 M O N T H L Y W E A T H E R R E V I E W VOLUME 135
roughness length (z0) in the new formulation linearlyincreases with wind speed at high wind speeds. As aresult, the new Cd tends to level off between the valueof 2 and 3, which is similar to the results of Donelan etal. (2004) and within the error bars estimated by Powellet al. (2003).
The new momentum flux parameterization has beentested in 11 forecasts of 5 real hurricanes in the AtlanticOcean using the operational GFDL hurricane model.While in these experiments the heat and humidity fluxcalculations are made using the GFDL model originalbulk parameterization, the heat/humidity coefficients(Ck) are decreased due to the reduced values of z0 bythe new formula at high wind speeds. The results showthat the new parameterization mainly contributes to anincrease of the maximum wind speed (MWS) predic-tions due to the reduction of the momentum fluxes, butdoes not appreciably affect the central pressure predic-tions in these simulations. The analysis of momentum/heat fluxes and energy dissipation as well as sea surfacetemperature cooling near the hurricane center revealsthat the heat flux remains virtually unchanged by thenew momentum parameterization because it is bal-anced by both the positive effects (from less sea surfacecooling due to the reduced momentum flux and fromincreased wind speeds) and the negative effect (fromthe decrease of the heat transfer coefficient). It is animportant feature of the fully coupled atmosphere–ocean system that the hurricane-induced SST changeplays a significant role in this balance.
The numerical experiments for five hurricanes showthat the new parameterization contributes to overallimprovement of hurricane MWS predictions as well aspressure–wind relationships prediction, especially forstrong hurricanes. In this study, however, the experi-ments were conducted only for the GFDL hurricanemodel which suffers from the underestimation of theMWS for the given central pressure. The underestima-tion of the MWS in high winds may not be true forother numerical prediction models. More simulationswith various models will be necessary to substantiatethe results reported here.
It is believed that the air–sea momentum flux is not afunction of wind speed alone, but depends on the seastate (Toba et al. 1990; Smith et al. 1992). Under hur-ricanes the sea state varies significantly according to therelative position from the storm center even under thesame wind speed (Moon et al. 2003, 2004b). Therefore,the consideration of sea state can lead to an asymmetricdistribution for exchange coefficients and fluxes, whichmay play a significant role in determining the windstructure inside the hurricane core region and may af-fect hurricane forecasts. However, the consideration of
sea state can be accomplished by a full coupling be-tween a hurricane model and a surface wave model thatrequires very intensive computations. Also, it is yet un-clear to what extent hurricane intensity forecasts aresensitive to the sea-state dependence of the exchangecoefficients. The proposed formula here neglects thesea-state dependence of the Cd. Nevertheless, this studyprovides a useful guidance to oceanic and atmosphericmodelers who are interested in the effect of reduceddrag coefficient at high wind regimes. The effect ofsea-state dependence will be a topic of our future in-vestigations.
In this study we have focused on the impact of themodified momentum flux parameterization on hurri-cane predictions. The heat flux parameterization hasnot been modified (except that the roughness length z0
has been replaced by a new formula). This is mainlybecause our understanding of heat flux in high windconditions is severely limited. Unlike recent majorprogress in observational studies of the momentumflux, there are still no reliable observations of the heatflux at high wind speeds. It is certainly questionablewhether the heat flux parameterization in the opera-tional GFDL model remains valid in high wind condi-tions. Bao et al. (2002) have shown that great disparityexists in the response of model-simulated hurricanes todifferent parameterizations. Further studies of the heatflux in high wind conditions (particularly observationalstudies) are needed to address these questions.
Acknowledgments. This work was supported by theU.S. National Science Foundation through GrantsATM 0406895. This work was also supported by theKorea Meteorological Administration Research andDevelopment Program under CATER 2006-2301 forI.-J. Moon. Authors T. Hara and I. Ginis thank the U.S.Office of Naval Research (CBLAST program, GrantN00014-06-10729) for additional support.
REFERENCES
Alamaro, M., K. Emanuel, J. Colton, W. McGillis, and J. B. Ed-son, 2002: Experimental investigation of air–sea transfer ofmomentum and enthalpy at high wind speed. Preprints, 25thConf. on Hurricanes and Tropical Meteorology, San Diego,CA, Amer. Meteor. Soc., 667–668.
Bao, J.-W., S. A. Michelson, and J. M. Wilczak, 2002: Sensitivityof numerical simulations to parameterizations of roughnessfor surface heat fluxes at high winds over sea. Mon. Wea.Rev., 130, 1926–1932.
Charnock, H., 1955: Wind stress on a water surface. Quart. J. Roy.Meteor. Soc., 81, 639–640.
DeCosmo, J., K. B. Katsaros, S. D. Smith, R. J. Anderson, W. A.Oost, K. Bumke, and H. Chadwick, 1996: Air-sea exchange ofwater vapor and sensible heat: The humidity exchange over
AUGUST 2007 M O O N E T A L . 2877

the sea (HEXOS) results. J. Geophys. Res., 101, 12 001–12 016.
Donelan, M. A., B. K. Haus, N. Reul, W. J. Plant, M. Stiassnie,H. C. Graber, O. B. Brown, and E. S. Saltzman, 2004: On thelimiting aerodynamic roughness of the ocean in very strongwinds. Geophys. Res. Lett., 31, L18306, doi:10.1029/2004GL019460.
Emanuel, K. A., 1995: Sensitivity of tropical cyclones to surfaceexchange coefficients and a revised steady-state model incor-porating eye dynamics. J. Atmos. Sci., 52, 3969–3976.
——, 1999: Thermodynamic control of hurricane intensity. Na-ture, 401, 665–669.
——, 2003: A similarity hypothesis for air–sea exchange at ex-treme wind speeds. J. Atmos. Sci., 60, 1420–1428.
Flather, R. A., 1994: A storm surge prediction model for thenorthern Bay of Bengal with application to the cyclone di-saster in April 1991. J. Phys. Oceanogr., 24, 172–190.
French, J., 2005: Flux profile estimates of surface drag in Hurri-canes Isabel and Fabian from BAT and Rosemount sensors.CBLAST-Hurricane Science Meeting, Miami, FL, RSMAS/University of Miami. [Available online at http://www.aoml.noaa.gov/hrd/cblast/cblast4.html.]
Geernaert, G. L., S. E. Larsen, and F. Hansen, 1987: Measure-ments of the wind stress, heat flux and turbulence intensityduring storm conditions over the North Sea. J. Geophys. Res.,92, 13 127–13 139.
Ginis, I., A. P. Khain, and E. Morozovsky, 2004: Effects of largeeddies on the structure of the marine boundary layer understrong wind conditions. J. Atmos. Sci., 61, 3049–3063.
Hara, T., and S. E. Belcher, 2002: Wind forcing in the equilibriumrange of wind-wave spectra. J. Fluid Mech., 470, 223–245.
——, and ——, 2004: Wind profile and drag coefficient over ma-ture ocean surface wave spectra. J. Phys. Oceanogr., 34,2345–2358.
Kepert, J. D., 2004: Models and observations of tropical cycloneboundary-layer winds. Extended Abstracts, The Past, Presentand Future of Numerical Modeling: 16th Annual BMRCModeling Workshop, BMRC Research Rep. 104, Melbourne,Australia, BMRC, 77–82.
Kurihara, Y., and R. E. Tuleya, 1974: Structure of a tropical cy-clone developed in a three-dimensional numerical simulationmodel. J. Atmos. Sci., 31, 893–919.
——, M. A. Bender, and R. J. Ross, 1993: An initialization schemeof hurricane models by vortex specification. Mon. Wea. Rev.,121, 2030–2045.
——, R. E. Tuleya, and M. A. Bender, 1998: The GFDL hurricaneprediction system and its performance in the 1995 hurricaneseason. Mon. Wea. Rev., 126, 1306–1322.
Large, W. G., and S. Pond, 1981: Open ocean momentum fluxmeasurements in moderate to strong wind. J. Phys. Ocean-ogr., 11, 324–336.
Liu, W. T., K. B. Katsaros, and J. A. Businger, 1979: Bulk param-eterization of air-sea exchange of heat and water vapor in-cluding the molecular constraints at the interface. J. Atmos.Sci., 36, 1722–1735.
Makin, V. K., 2005: A note on the drag of the sea surface athurricane winds. Bound.-Layer Meteor., 115, 169–176.
Moon, I.-J., I. Ginis, T. Hara, H. Tolman, C. W. Wright, and E. J.Walsh, 2003: Numerical simulation of sea surface directionalwave spectra under hurricane wind forcing. J. Phys. Ocean-ogr., 33, 1680–1706.
——, T. Hara, I. Ginis, S. E. Belcher, and H. Tolman, 2004a:Effect of surface waves on air–sea momentum exchange. PartI: Effect of mature and growing seas. J. Atmos. Sci., 61, 2321–2333.
——, I. Ginis, and T. Hara, 2004b: Effect of surface waves onair–sea momentum exchange. Part II: Behavior of drag coef-ficient under tropical cyclones. J. Atmos. Sci., 61, 2334–2348.
——, ——, and ——, 2004c: Effect of surface waves on Charnockcoefficient under tropical cyclones. Geophys. Res. Lett., 31,L20302, doi:10.1029/2004GL020988.
Powell, M. D., S. H. Houston, L. R. Amat, and N. Morisseau-Leroy, 1998: The HRD real-time hurricane wind analysis sys-tem. J. Wind Eng. Indust. Aerodyn., 77–78, 53–64.
——, P. J. Vickery, and T. A. Reinhold, 2003: Reduced drag co-efficient for high wind speeds in tropical cyclones. Nature,422, 279–283.
Smith, S. D., and Coauthors, 1992: Sea surface wind stress anddrag coefficients: The HEXOS results. Bound.-Layer Me-teor., 60, 109–142.
Tang, Y. M., R. Grimshaw, B. Sanderson, and G. Holland, 1996:A numerical study of storm surges and tide, with applicationto the north Queensland coast. J. Phys. Oceanogr., 26, 2700–2711.
Toba, Y., N. Iida, H. Kawamura, N. Ebuchi, and I. S. F. Jones,1990: The wave dependence of sea surface wind stress. J.Phys. Oceanogr., 20, 705–721.
Tolman, H. L., 2002: Validation of WAVEWATCH III version1.15 for a global domain. NOAA/NWS/NCEP/OMB Tech.Note 213, 33 pp.
Walker, N. D., R. R. Leben, and S. Balasubramanian, 2005: Hur-ricane-forced upwelling and chlorophyll a enhancementwithin cold-core cyclones in the Gulf of Mexico. Geophys.Res. Lett., 32, L18610, doi:10.1029/2005GL023716.
Wu, J., 1982: Wind-stress coefficients over sea surface from breezeto hurricane. J. Geophys. Res., 87, 9704–9706.
Zeng, X., M. Zhao, and R. E. Dickinson, 1998: Intercomparison ofbulk aerodynamic algorithms for the computation of sea sur-face fluxes using TOGA COARE and TAO data. J. Climate,11, 2628–2644.
2878 M O N T H L Y W E A T H E R R E V I E W VOLUME 135