A Perspective on Value Investing - MicroCapClub Perspective on Value Investing i. ... - uffett in...
56
A Perspective on Value Investing i. Some Thoughts about a Career in Finance: Comparing Private Equity vs. Value Investing (Warren Buffett) ii. Analysis of Multi-bagger Stocks (>10x Returns in the Last 15 Years) Kevin Martelli Martek Partners Lausanne, Switzerland
-
Upload
trinhnguyet -
Category
Documents
-
view
213 -
download
0
Transcript of A Perspective on Value Investing - MicroCapClub Perspective on Value Investing i. ... - uffett in...
A Perspective on Value Investing
i. Some Thoughts about a Career in Finance:Comparing Private Equity vs. Value Investing (Warren Buffett)
ii. Analysis of Multi-bagger Stocks (>10x Returns in the Last 15 Years)
Kevin MartelliMartek PartnersLausanne, Switzerland
2
▪ The present document has been prepared by Martek Partners SA with the purpose of sharing information about some of its general views on business analysis and financial markets. Unless otherwise specifically stated, the information contained herein is made available only for the intended recipient, to which this presentation is addressed, for informational purposes only.
▪ The information contemplated herein will not represent by any means any offer, diligence or recommendation to buy, sell or acquire any sort of securities or investment funds, nor participating in any other operations, or providing any advising or investment service. It is not Martek Partners SA’s intention to provide clients investment advice of any kind. The information contained below shall not be used in isolation to formulate any investment decision nor interest of any other kind. Martek Partners SA recommends you to obtain advice on your investments from a different independent source. Should you have any inquiry regarding your investments, you should seek advice from an independent consultant.
▪ Martek Partners SA expressly declines all responsibility towards any person, action or omission, as well as the total or partial consequences derived from third parties, which may be based total or partially on the contents of the present document and shall not be responsible for any damage or prejudice derived from the use or consequence of the use of the information contained herein, including, with no constraints, any loss of benefit or any other direct or indirect prejudice.
Important Disclosure
3
Key Questions
1. What can be learned by studying how Warren Buffett turned $ 1,000 in Berkshire Hathaway into $18 million over 50 years (1964-2014)? How replicable is Buffett’s value investing approach today? And how does it compare to private equity?
2. In evaluating an investment, what are the factors and risks that need to be addressed carefully?
3. Is there a relationship between the volatility of a security and the risk of permanent loss of value?
4. Why the concept of risk-return is very different if you change the time frame from short-term (12 months) to long term (5-10 years)? Does it makes sense to evaluate investments with a 12-18 months time frame?
$-
$10,000,000
$20,000,000
$30,000,000
$40,000,000
$50,000,000
$60,000,000
$70,000,000
14 15 19 21 26 30 32 33 34 35 36 37 39 43 44 47 52 53 56 58 59 66 72 83 85
4
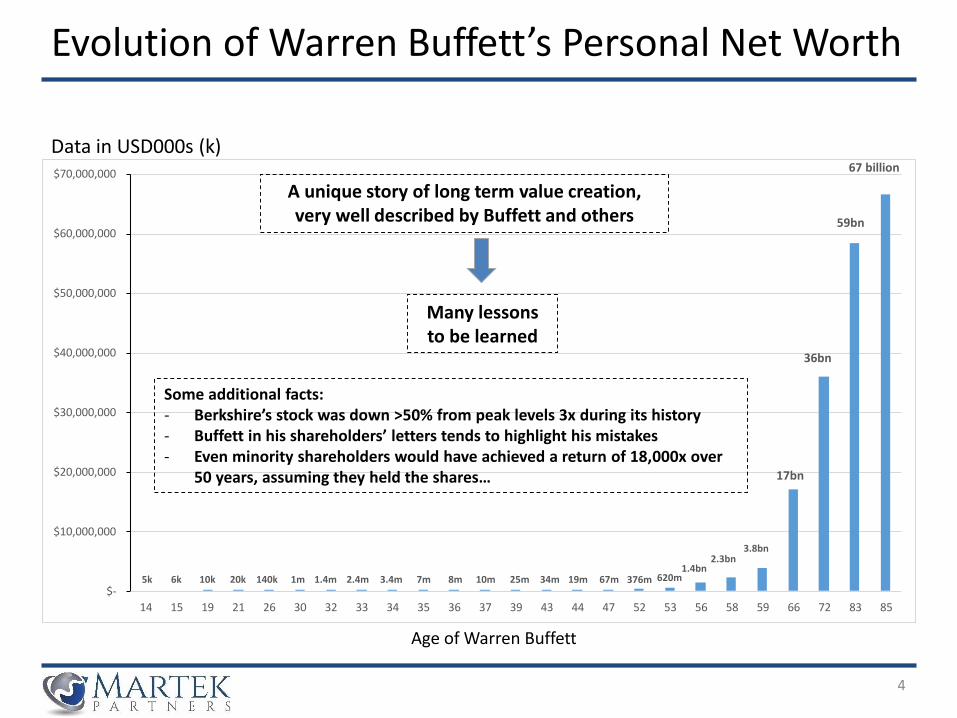
Evolution of Warren Buffett’s Personal Net Worth
Data in USD000s (k)
A unique story of long term value creation, very well described by Buffett and others
Many lessons to be learned
Age of Warren Buffett
59bn
36bn
17bn
3.8bn2.3bn
1.4bn620m376m67m19m34m25m10m8m7m3.4m2.4m1.4m1m140k20k10k6k5k
67 billion
Some additional facts:- Berkshire’s stock was down >50% from peak levels 3x during its history- Buffett in his shareholders’ letters tends to highlight his mistakes- Even minority shareholders would have achieved a return of 18,000x over
50 years, assuming they held the shares…
1. Some Thoughts about a Career in Finance: Comparing Private Equity vs. Value Investing (Warren Buffett)
6
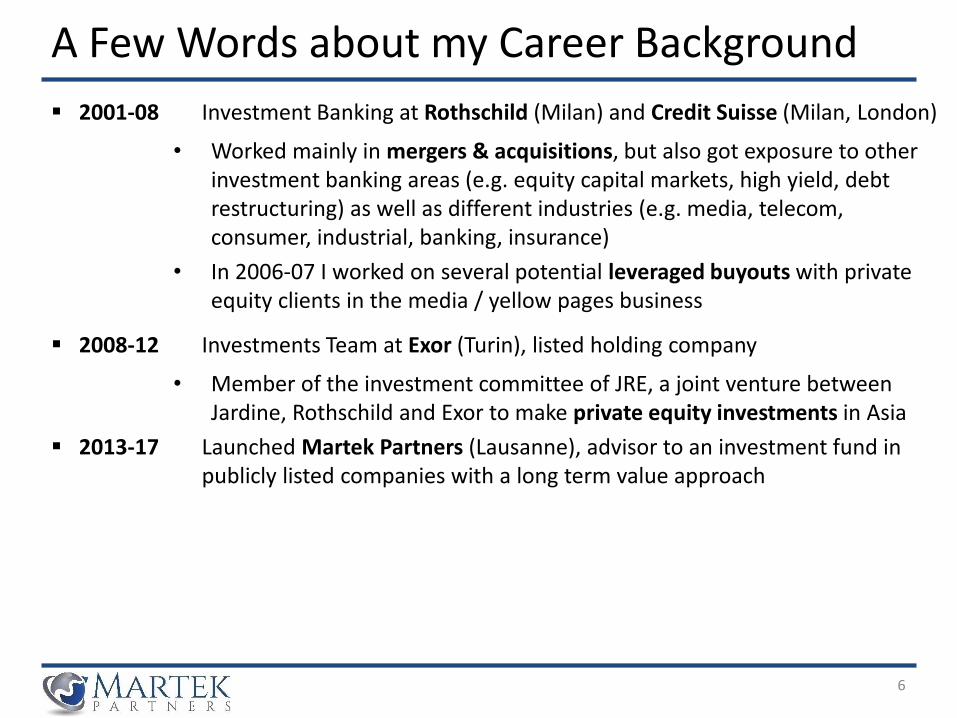
▪ 2001-08 Investment Banking at Rothschild (Milan) and Credit Suisse (Milan, London)
• Worked mainly in mergers & acquisitions, but also got exposure to other investment banking areas (e.g. equity capital markets, high yield, debt restructuring) as well as different industries (e.g. media, telecom, consumer, industrial, banking, insurance)
• In 2006-07 I worked on several potential leveraged buyouts with private equity clients in the media / yellow pages business
▪ 2008-12 Investments Team at Exor (Turin), listed holding company
• Member of the investment committee of JRE, a joint venture between Jardine, Rothschild and Exor to make private equity investments in Asia
▪ 2013-17 Launched Martek Partners (Lausanne), advisor to an investment fund in publicly listed companies with a long term value approach
A Few Words about my Career Background
7
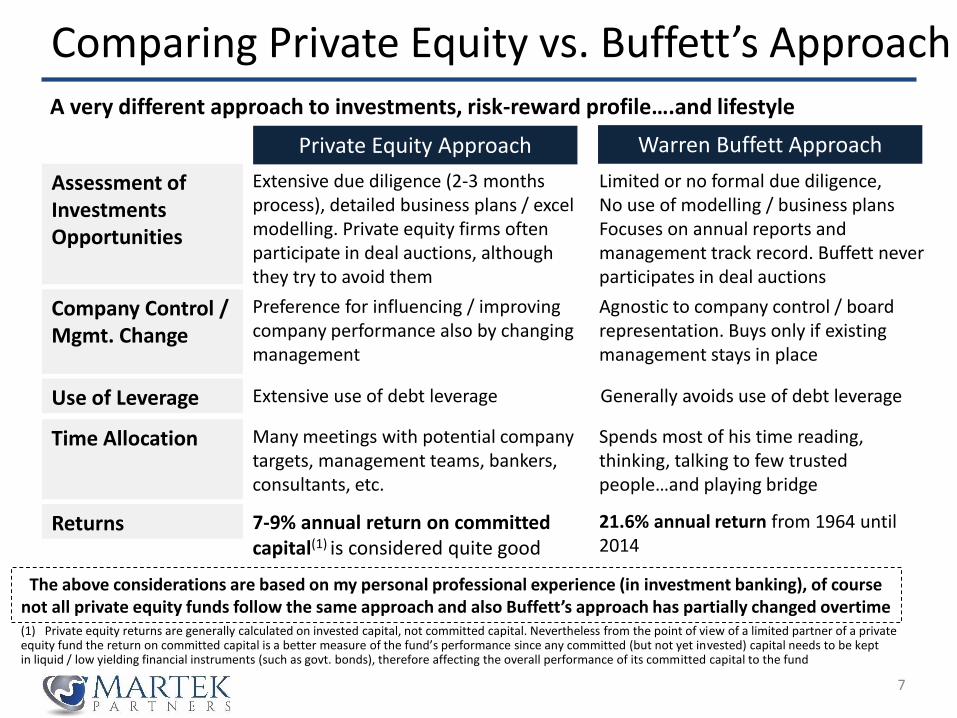
Comparing Private Equity vs. Buffett’s ApproachA very different approach to investments, risk-reward profile….and lifestyle
(1) Private equity returns are generally calculated on invested capital, not committed capital. Nevertheless from the point of view of a limited partner of a private equity fund the return on committed capital is a better measure of the fund’s performance since any committed (but not yet invested) capital needs to be kept in liquid / low yielding financial instruments (such as govt. bonds), therefore affecting the overall performance of its committed capital to the fund
Private Equity Approach Warren Buffett Approach
Extensive due diligence (2-3 months process), detailed business plans / excel modelling. Private equity firms often participate in deal auctions, although they try to avoid them
Limited or no formal due diligence, No use of modelling / business plansFocuses on annual reports and management track record. Buffett never participates in deal auctions
Assessment of Investments Opportunities
Preference for influencing / improving company performance also by changing management
Agnostic to company control / board representation. Buys only if existing management stays in place
Company Control / Mgmt. Change
Extensive use of debt leverage Generally avoids use of debt leverageUse of Leverage
Many meetings with potential company targets, management teams, bankers, consultants, etc.
Spends most of his time reading, thinking, talking to few trusted people…and playing bridge
Time Allocation
7-9% annual return on committed capital(1) is considered quite good
21.6% annual return from 1964 until 2014
Returns
The above considerations are based on my personal professional experience (in investment banking), of course not all private equity funds follow the same approach and also Buffett’s approach has partially changed overtime
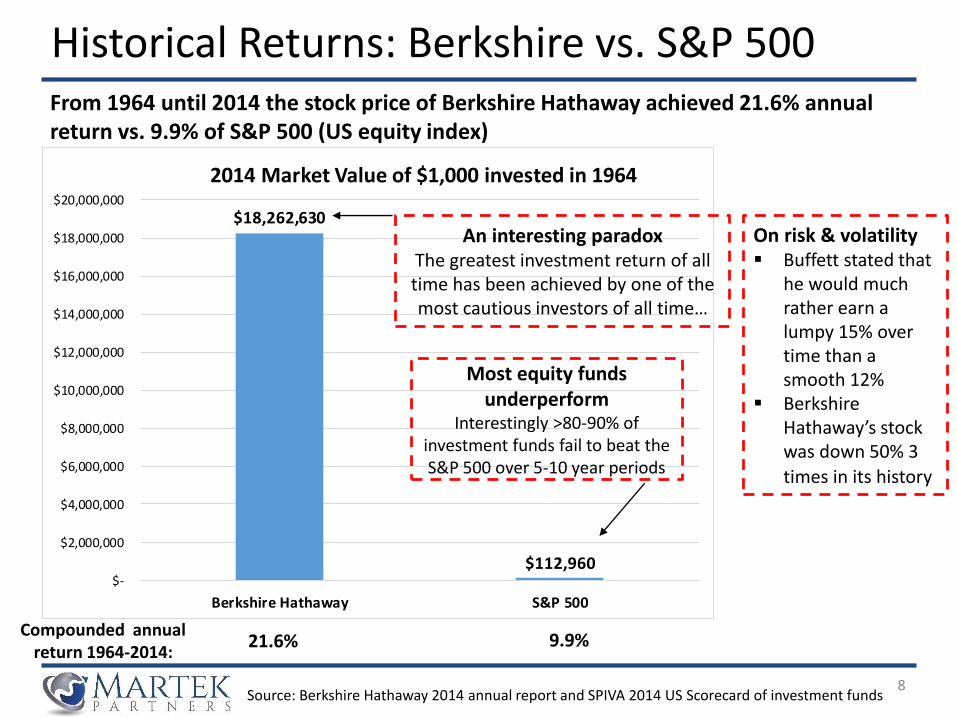
$18,262,630
$112,960 $-
$2,000,000
$4,000,000
$6,000,000
$8,000,000
$10,000,000
$12,000,000
$14,000,000
$16,000,000
$18,000,000
$20,000,000
Berkshire Hathaway S&P 500
2014 Market Value of $1,000 invested in 1964
8
Historical Returns: Berkshire vs. S&P 500From 1964 until 2014 the stock price of Berkshire Hathaway achieved 21.6% annual return vs. 9.9% of S&P 500 (US equity index)
Most equity funds underperform
Interestingly >80-90% of investment funds fail to beat the S&P 500 over 5-10 year periods
An interesting paradoxThe greatest investment return of all time has been achieved by one of the most cautious investors of all time…
Source: Berkshire Hathaway 2014 annual report and SPIVA 2014 US Scorecard of investment funds
21.6% 9.9%Compounded annual
return 1964-2014:
On risk & volatility▪ Buffett stated that
he would much rather earn a lumpy 15% over time than a smooth 12%
▪ Berkshire Hathaway’s stock was down 50% 3
times in its history

9
A Few Quotes from Graham, Buffett and Munger
Warren Buffett on Risk
▪ “It seems, for whatever reason, that volatility is often synonymous with risk for most people. I’ve never viewed it that way. Volatility has never been a proxy for risk,[...] When I think of risk, I think of permanent loss of capital.”
▪ “Risk comes from not knowing what you’re doing.”
▪ “Risk can be greatly reduced by concentrating on only a few holdings.”
Charlie Munger on the Importance of Reading
▪ “In my whole life, I have known no wise people who didn't read all the time - none, zero. You'd be amazed at how much Warren reads - at how much I read.”
Benjamin Graham on Value Investing and Margin of Safety
▪ “Price is what you pay. Value is what you get.”
▪ “The function of the margin of safety is, in essence, that of rendering unnecessary an accurate estimate of the future.”
▪ “The intelligent investor is a realist who sells to optimists and buys from pessimists.”
10
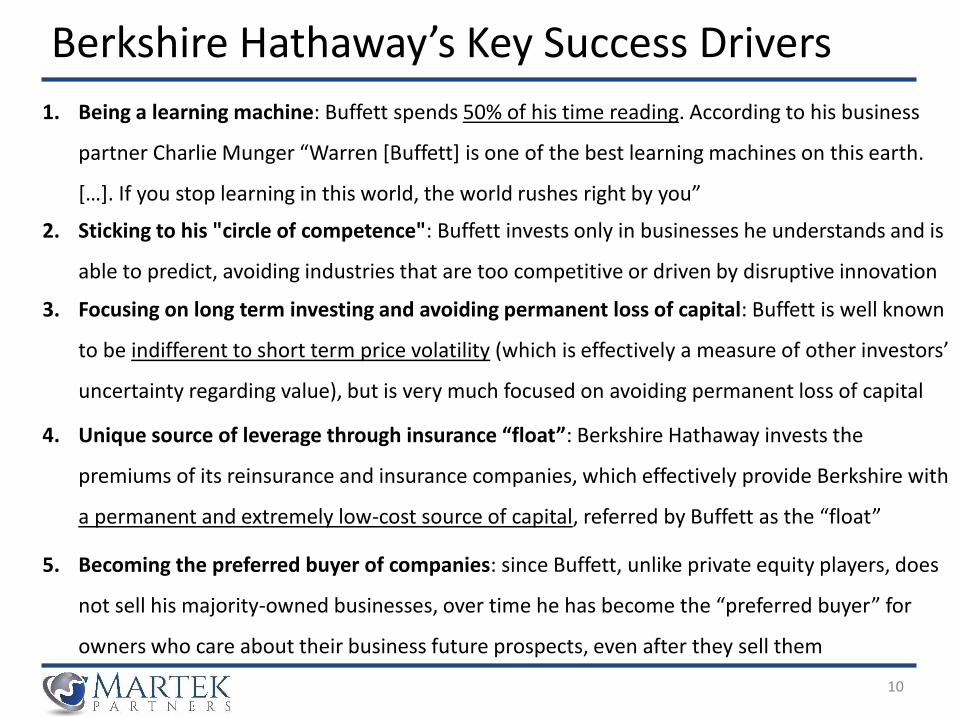
1. Being a learning machine: Buffett spends 50% of his time reading. According to his business
partner Charlie Munger “Warren [Buffett] is one of the best learning machines on this earth.
[…]. If you stop learning in this world, the world rushes right by you”
Berkshire Hathaway’s Key Success Drivers
4. Unique source of leverage through insurance “float”: Berkshire Hathaway invests the
premiums of its reinsurance and insurance companies, which effectively provide Berkshire with
a permanent and extremely low-cost source of capital, referred by Buffett as the “float”
5. Becoming the preferred buyer of companies: since Buffett, unlike private equity players, does
not sell his majority-owned businesses, over time he has become the “preferred buyer” for
owners who care about their business future prospects, even after they sell them
3. Focusing on long term investing and avoiding permanent loss of capital: Buffett is well known
to be indifferent to short term price volatility (which is effectively a measure of other investors’
uncertainty regarding value), but is very much focused on avoiding permanent loss of capital
2. Sticking to his "circle of competence": Buffett invests only in businesses he understands and is
able to predict, avoiding industries that are too competitive or driven by disruptive innovation
11
Warren Buffett is not the only one to have achieved great long term returns, here are some other examples of value investors to learn from
▪ Seth Klarman, Baupost Capital (investment focus: USA, Global)
▪ Mattias Westman, Prosperity Capital Management (investment focus: Russia)
▪ Chetan Parikh, Jeetay Investments (investment focus: India)
▪ Li Lu, Himalaya Capital (investment focus: Global)
▪ Lei Zhang, Hillhouse Capital (investment focus: China)
Other Value Investors with Great Track Records
12
According to value investor Li Lu less of 5% of public equity investors can be considered “real
value investors”. If over time value investing works why is it not more popular?
Why Value Investing is not More Widespread?
▪ Being a “rational contrarian” is tough (in any job….not just investing): as JM Keynes once
said: “Worldly wisdom teaches that it is better for reputation to fail conventionally than to
succeed unconventionally”. This is why most fund managers prefer to “follow the crowd”
rather than trying to evaluate facts with good judgement and try to be right (e.g. tech
bubble in 2000 or subprime mortgage investments in 2006-07)
– Continuous performance benchmarking (vs. indices and other fund managers) pushes
investors to behave in a homogenous way, similarly to sardines’ "swarm behavior" in
front of a shark predator…
▪ The human brain is the result of millions of years of evolution and thus it is not necessarily
“fit for decision making in complex/uncertain situations” (stock exchanges, globalization,
technological disruption), which are a relatively recent phenomenon (say 40-50 years...)
Technological Disruption & Value Investing
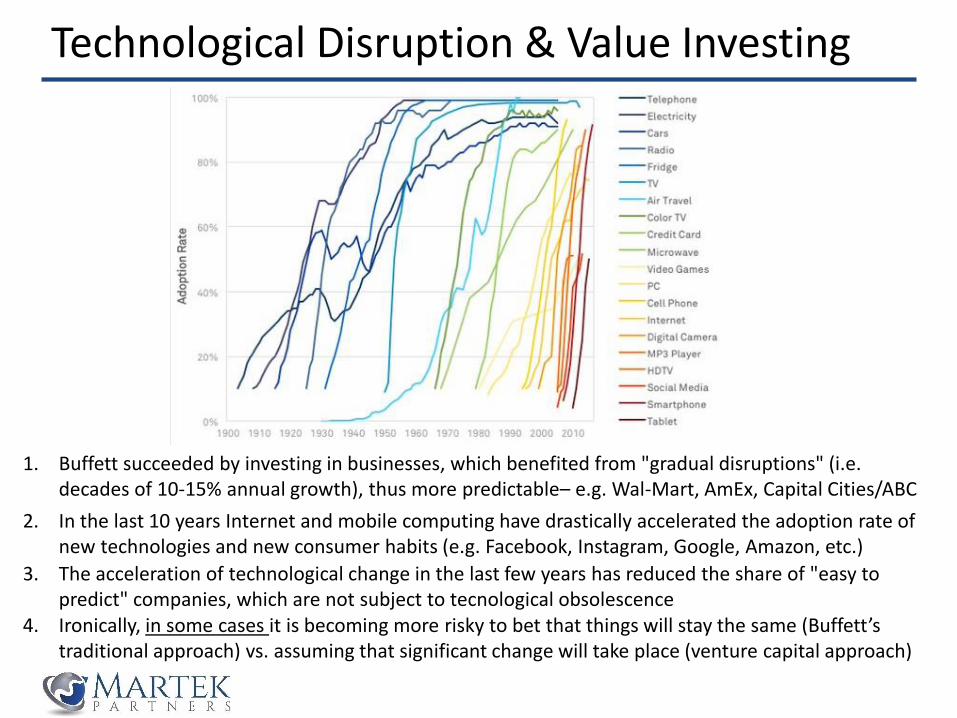
1. Buffett succeeded by investing in businesses, which benefited from "gradual disruptions" (i.e. decades of 10-15% annual growth), thus more predictable– e.g. Wal-Mart, AmEx, Capital Cities/ABC
2. In the last 10 years Internet and mobile computing have drastically accelerated the adoption rate of new technologies and new consumer habits (e.g. Facebook, Instagram, Google, Amazon, etc.)
4. Ironically, in some cases it is becoming more risky to bet that things will stay the same (Buffett’s traditional approach) vs. assuming that significant change will take place (venture capital approach)
3. The acceleration of technological change in the last few years has reduced the share of "easy to predict" companies, which are not subject to tecnological obsolescence
14
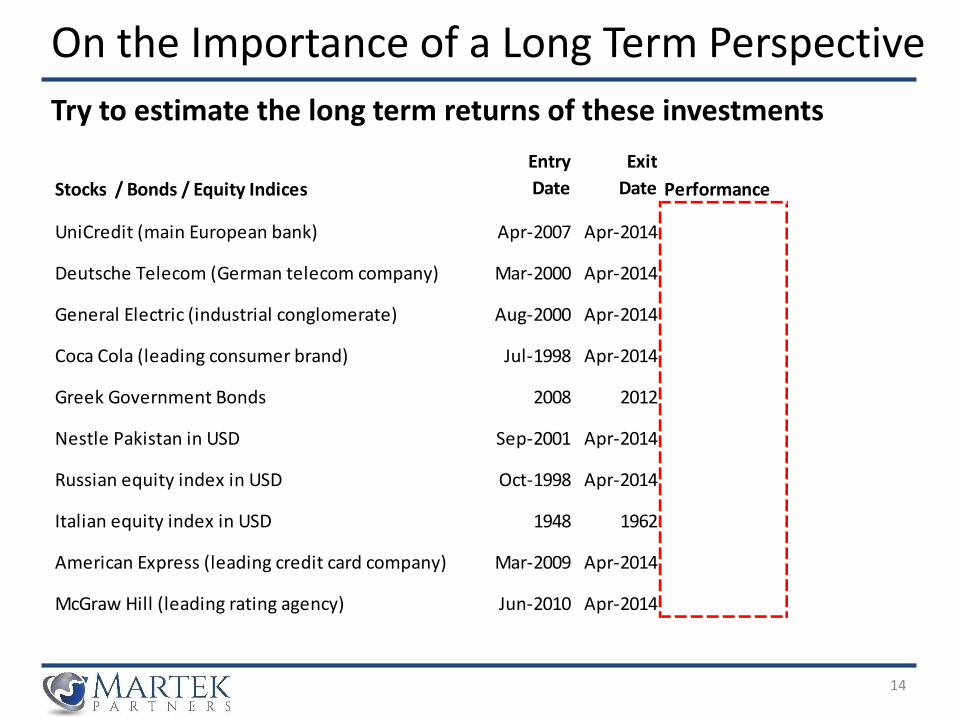
On the Importance of a Long Term Perspective
Try to estimate the long term returns of these investments
Stocks / Bonds / Equity Indices
Entry
Date
Exit
Date Performance
UniCredit (main European bank) Apr-2007 Apr-2014
Deutsche Telecom (German telecom company) Mar-2000 Apr-2014
General Electric (industrial conglomerate) Aug-2000 Apr-2014
Coca Cola (leading consumer brand) Jul-1998 Apr-2014
Greek Government Bonds 2008 2012
Nestle Pakistan in USD Sep-2001 Apr-2014
Russian equity index in USD Oct-1998 Apr-2014
Italian equity index in USD 1948 1962
American Express (leading credit card company) Mar-2009 Apr-2014
McGraw Hill (leading rating agency) Jun-2010 Apr-2014
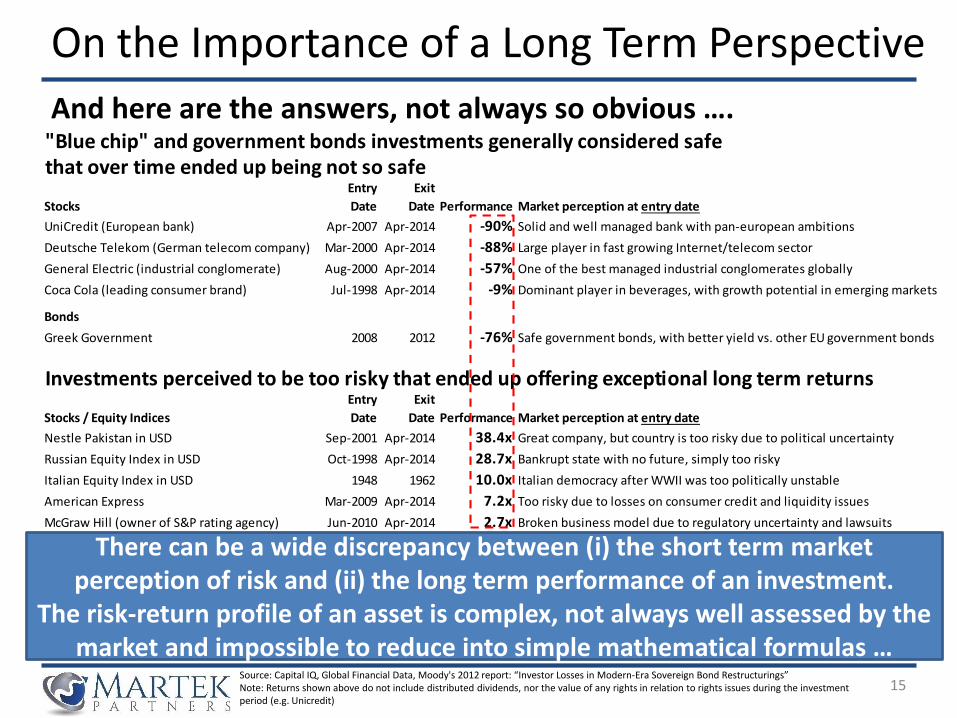
"Blue chip" and government bonds investments generally considered safe that over time ended up being not so safe
Stocks
Entry
Date
Exit
Date Performance Market perception at entry date
UniCredit (European bank) Apr-2007 Apr-2014 -90% Solid and well managed bank with pan-european ambitions
Deutsche Telekom (German telecom company) Mar-2000 Apr-2014 -88% Large player in fast growing Internet/telecom sector
General Electric (industrial conglomerate) Aug-2000 Apr-2014 -57% One of the best managed industrial conglomerates globally
Coca Cola (leading consumer brand) Jul-1998 Apr-2014 -9% Dominant player in beverages, with growth potential in emerging markets
Bonds
Greek Government 2008 2012 -76% Safe government bonds, with better yield vs. other EU government bonds
Investments perceived to be too risky that ended up offering exceptional long term returns
Stocks / Equity Indices
Entry
Date
Exit
Date Performance Market perception at entry date
Nestle Pakistan in USD Sep-2001 Apr-2014 38.4x Great company, but country is too risky due to political uncertainty
Russian Equity Index in USD Oct-1998 Apr-2014 28.7x Bankrupt state with no future, simply too risky
Italian Equity Index in USD 1948 1962 10.0x Italian democracy after WWII was too politically unstable
American Express Mar-2009 Apr-2014 7.2x Too risky due to losses on consumer credit and liquidity issues
McGraw Hill (owner of S&P rating agency) Jun-2010 Apr-2014 2.7x Broken business model due to regulatory uncertainty and lawsuits
15
On the Importance of a Long Term Perspective
And here are the answers, not always so obvious ….
Source: Capital IQ, Global Financial Data, Moody's 2012 report: “Investor Losses in Modern-Era Sovereign Bond Restructurings”Note: Returns shown above do not include distributed dividends, nor the value of any rights in relation to rights issues during the investment period (e.g. Unicredit)
There can be a wide discrepancy between (i) the short term market perception of risk and (ii) the long term performance of an investment.
The risk-return profile of an asset is complex, not always well assessed by the market and impossible to reduce into simple mathematical formulas …
2. Analysis of Multi-bagger Stocks (>10x Returns in the Last 15 Years)Key Insights from an Historical Analysis – April 2014
An earlier version of this analysis was mentioned in Chris Mayer’s book: “100 Baggers: Stocks That Return 100-to-1 and How To Find Them” published in September 2015
17
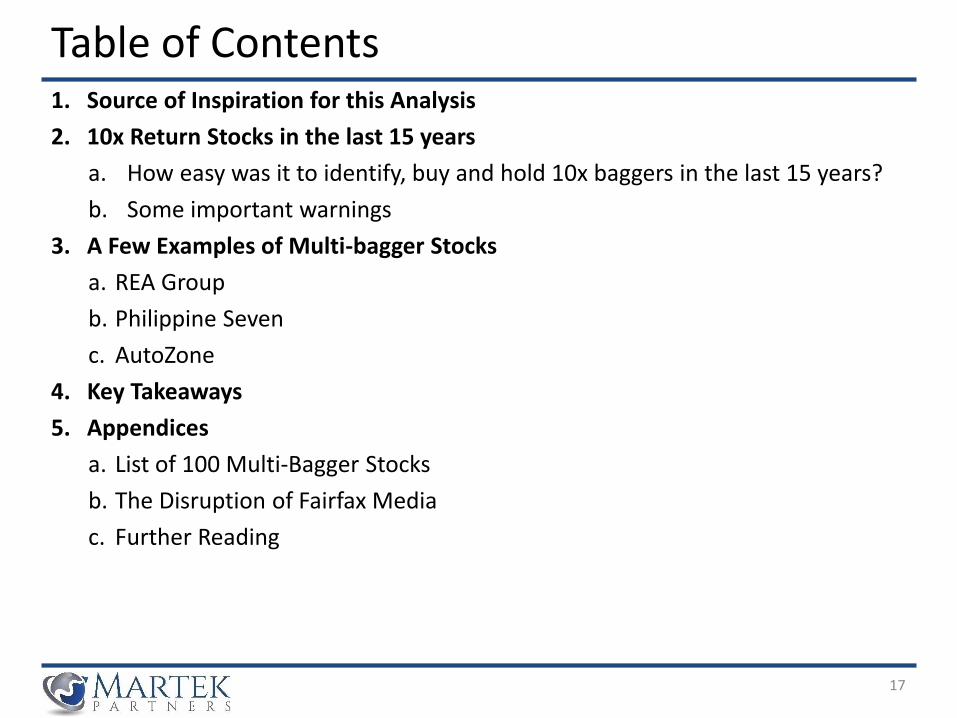
1. Source of Inspiration for this Analysis
2. 10x Return Stocks in the last 15 years
a. How easy was it to identify, buy and hold 10x baggers in the last 15 years?
b. Some important warnings
3. A Few Examples of Multi-bagger Stocks
a. REA Group
b. Philippine Seven
c. AutoZone
4. Key Takeaways
5. Appendices
a. List of 100 Multi-Bagger Stocks
b. The Disruption of Fairfax Media
c. Further Reading
Table of Contents
18
Source of Inspiration for this AnalysisThe Book: 100 to 1 in the Stock Market by Thomas Phelps (1972)
▪ The analysis: in 1972 Thomas Phelps wrote a book about a selection of 360 US-listed securities (both equities or bonds) that achieved at least 100x return from their low point in the 1932-1967 period up to their 1971 market valuation
▪ Key principles: Phelps outlines the principles that are needed to achieve 100x returns, effectively summarized by George F. Baker’s (1840-1931) dictum, mentioned in the book:
– To make money in stocks you must have “The vision to see them. The courage to buy them and the patience to hold them”. According to Phelps, patience is the rarest of the three
▪ One investor who achieved 100x return: Phelps mentions the story of Paul Garrett (public relations manager at General Motors) who after retirement from GM in 1956 at the age of 64 decided to concentrate his savings in 1 stock and achieve extraordinary long term returns. According to Mr. Garrett the selected company must be:
1. Small
2. Relatively unknown
3. Distinguished by a unique and useful product
4. Led by a strong, progressive and research-minded management
– After an initial screen of 50 stocks, Mr. Garrett finally selected Haloid (which then became Xerox) bought at $1 in the 1955-59 period and sold at $125 in 1971
19
10x Return Stocks in the Last 15 YearsHow easy was it to identify, buy and hold 10x baggers in the last 15 years?
(1) Source: Capital IQ
(2) A 10x return in 15 years equals to 17% return p.a. (this is the lowest return in the sample which shows returns ranging from 10x to 1,636x)
▪ Objective of the analysis: to run an empirical analysis of multi-bagger stocks similar to what Phelps had done in 1972, but focused only on stocks (not bonds) and with a shorter timeframe (15 years instead of 40) in order to better study each case and better assess the degree of predictability of the extraordinary long term returns in each case
– Despite the subjectivity of this ex-post analysis, it is still useful to better understand
1. What drives long term outperformance of a stock (earnings growth, trading multiple expansion, good capital allocation?)
2. How cheap can a stock get when it is out of favour?
3. What do most market participants focus on vs. what they should be focusing on?▪ Some key facts about the analysis
– Today there are ~21,000 listed companies with a market cap of at least $100m(1)
– Out of this sample, there are a total of 3,795 listed equities (18% of the initial sample) that achieved >10x returns from their low point in the last 15 years up until their current market valuation (April 2014)(2) – this sample obviously includes many unpredictable multi-baggers...
o Note: returns have been calculated in USD and do not include any distributed dividends
– Out of this second sample, I have selected (with a great degree of subjectivity…), a sample of 100 “more predictable” multi-bagger stocks, which a rational and long term oriented investor had a “reasonable chance” to identify, purchase and hold over the long term
20
10x Return Stocks in the Last 15 YearsSome important warnings
1. This is an unscientific and backward-looking analysis. We are all smarter in retrospect, since it is somewhat easier to analyse the past instead of predicting the future …
– A great book on the pitfalls of backward-looking analysis: The Halo Effect by P. Rosenzweig
2. Only the winners are visible. The losers (i.e. stocks that looked like long term multi-baggers, but ended up being bad investments) are invisible to us and are not present in the sample
– In fact if after this presentation you feel ready to go hunting for the next multi-bagger, I would strongly recommend to read books about investment/business failures such as:
i. The Billion Dollar Mistake by S. Weiss (about mistakes made by great investors)
ii. Billion Dollar Lessons by B. Carroll and C. Mui (about business mistakes)
iii. The Black Swan by N. Taleb (not strictly a book about failure, but read it anyway)
3. The selection of “reasonably predictable” multi-baggers is very subjective, discretionary and depends on one’s circle of competence. Defining the circle of competence is probably one of the most critical factors in determining an investor’s future success…
4. Excessive trading multiple re-rating from the low point until today often is a key component of the extra returns of the multi-baggers, therefore one should discount the extra-returns for this “speculation-related” factor (current market prices in fact are generally quite expensive…)
Despite the pitfalls of a backward-looking analysis, looking at a wide range of empirical cases of multi-baggers can make you a better investor
21
A Few Examples of Multi-bagger Stocks
Case 1: REA Group (Australia)A fast-growing, disruptive business model in online real estate classifieds
▪ Always looked expensive on traditional multiple basis
▪ In 2001-04 period was it already an inevitable, dominant (and profitable) business model?
22
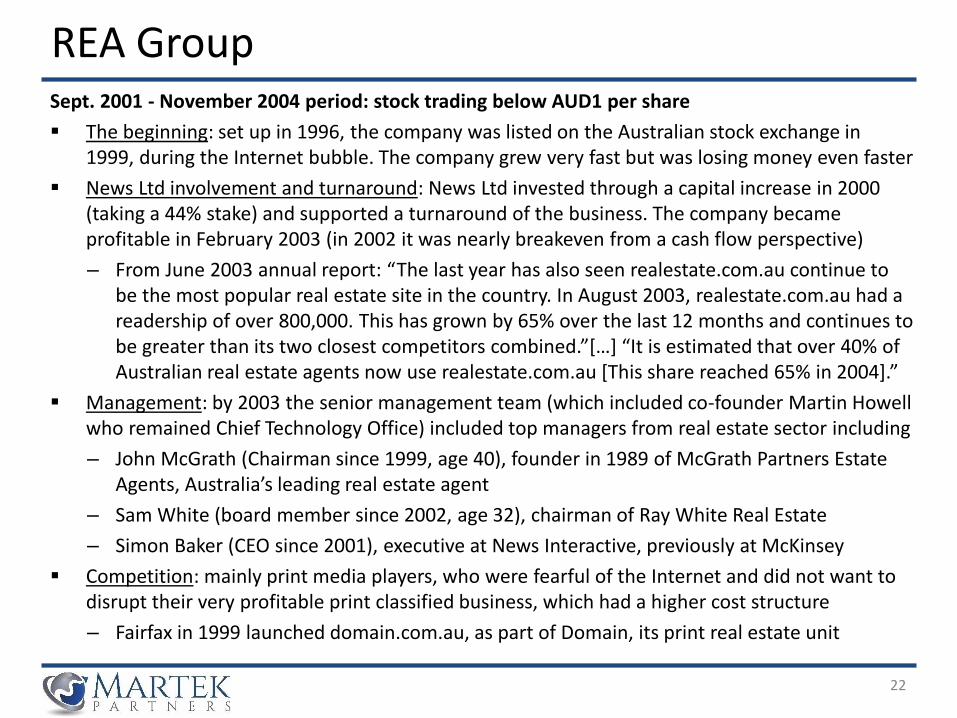
REA GroupSept. 2001 - November 2004 period: stock trading below AUD1 per share
▪ The beginning: set up in 1996, the company was listed on the Australian stock exchange in 1999, during the Internet bubble. The company grew very fast but was losing money even faster
▪ News Ltd involvement and turnaround: News Ltd invested through a capital increase in 2000 (taking a 44% stake) and supported a turnaround of the business. The company became profitable in February 2003 (in 2002 it was nearly breakeven from a cash flow perspective)
– From June 2003 annual report: “The last year has also seen realestate.com.au continue to be the most popular real estate site in the country. In August 2003, realestate.com.au had a readership of over 800,000. This has grown by 65% over the last 12 months and continues to be greater than its two closest competitors combined.”[…] “It is estimated that over 40% of Australian real estate agents now use realestate.com.au [This share reached 65% in 2004].”
▪ Management: by 2003 the senior management team (which included co-founder Martin Howell who remained Chief Technology Office) included top managers from real estate sector including
– John McGrath (Chairman since 1999, age 40), founder in 1989 of McGrath Partners Estate Agents, Australia’s leading real estate agent
– Sam White (board member since 2002, age 32), chairman of Ray White Real Estate
– Simon Baker (CEO since 2001), executive at News Interactive, previously at McKinsey
▪ Competition: mainly print media players, who were fearful of the Internet and did not want to disrupt their very profitable print classified business, which had a higher cost structure
– Fairfax in 1999 launched domain.com.au, as part of Domain, its print real estate unit
23
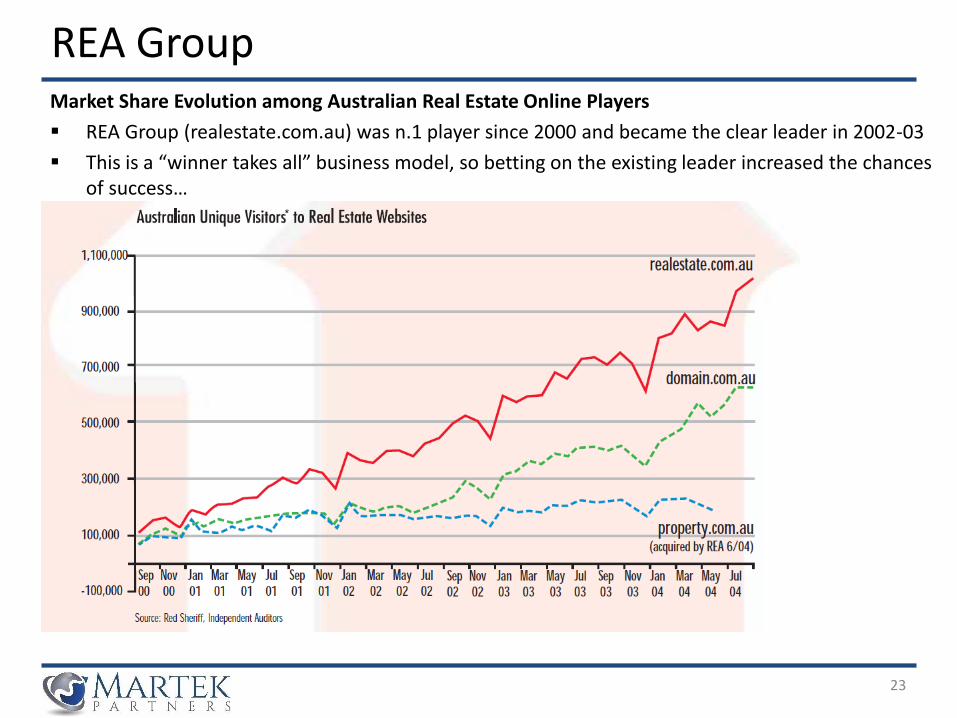
REA GroupMarket Share Evolution among Australian Real Estate Online Players
▪ REA Group (realestate.com.au) was n.1 player since 2000 and became the clear leader in 2002-03
▪ This is a “winner takes all” business model, so betting on the existing leader increased the chances of success…
0x
10x
20x
30x
40x
50x
60x
70x
80x
90x
0
5
10
15
20
25
30
35
40
45
50
55
60
REA Group Limited (ASX:REA) - Share Pricing REA Group Limited (ASX:REA) - TEV/EBIT
REA Group Limited (ASX:REA) - TEV/Total Revenues
24
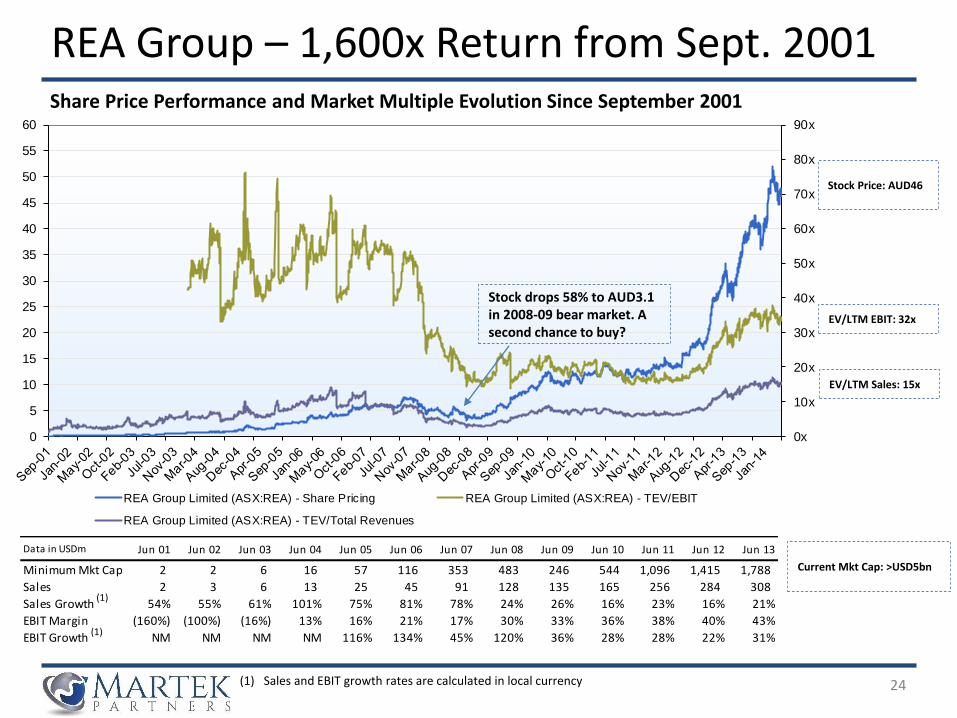
REA Group – 1,600x Return from Sept. 2001 Share Price Performance and Market Multiple Evolution Since September 2001
Stock Price: AUD46
Stock drops 58% to AUD3.1 in 2008-09 bear market. A second chance to buy?
EV/LTM EBIT: 32x
EV/LTM Sales: 15x
Current Mkt Cap: >USD5bn
(1) Sales and EBIT growth rates are calculated in local currency
(1)
(1)
Data in USDm Jun 01 Jun 02 Jun 03 Jun 04 Jun 05 Jun 06 Jun 07 Jun 08 Jun 09 Jun 10 Jun 11 Jun 12 Jun 13
Minimum Mkt Cap 2 2 6 16 57 116 353 483 246 544 1,096 1,415 1,788
Sales 2 3 6 13 25 45 91 128 135 165 256 284 308
Sales Growth 54% 55% 61% 101% 75% 81% 78% 24% 26% 16% 23% 16% 21%
EBIT Margin (160%) (100%) (16%) 13% 16% 21% 17% 30% 33% 36% 38% 40% 43%
EBIT Growth NM NM NM NM 116% 134% 45% 120% 36% 28% 28% 22% 31%
25
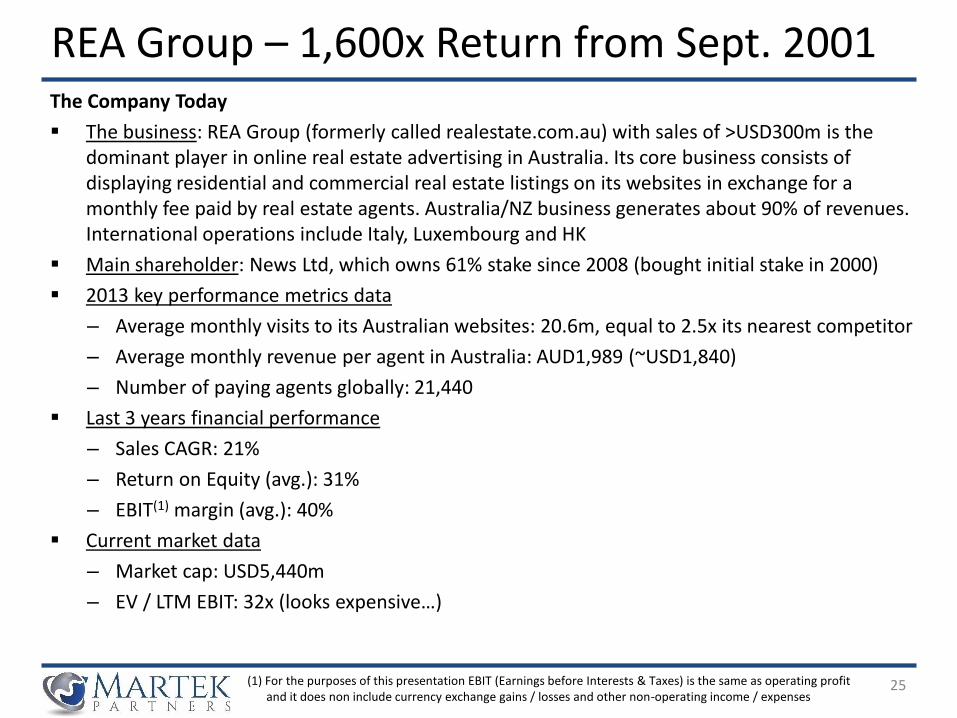
REA Group – 1,600x Return from Sept. 2001 The Company Today
▪ The business: REA Group (formerly called realestate.com.au) with sales of >USD300m is the dominant player in online real estate advertising in Australia. Its core business consists of displaying residential and commercial real estate listings on its websites in exchange for a monthly fee paid by real estate agents. Australia/NZ business generates about 90% of revenues. International operations include Italy, Luxembourg and HK
▪ Main shareholder: News Ltd, which owns 61% stake since 2008 (bought initial stake in 2000)
▪ 2013 key performance metrics data
– Average monthly visits to its Australian websites: 20.6m, equal to 2.5x its nearest competitor
– Average monthly revenue per agent in Australia: AUD1,989 (~USD1,840)
– Number of paying agents globally: 21,440
▪ Last 3 years financial performance
– Sales CAGR: 21%
– Return on Equity (avg.): 31%
– EBIT(1) margin (avg.): 40%
▪ Current market data
– Market cap: USD5,440m
– EV / LTM EBIT: 32x (looks expensive…)
(1) For the purposes of this presentation EBIT (Earnings before Interests & Taxes) is the same as operating profit and it does non include currency exchange gains / losses and other non-operating income / expenses
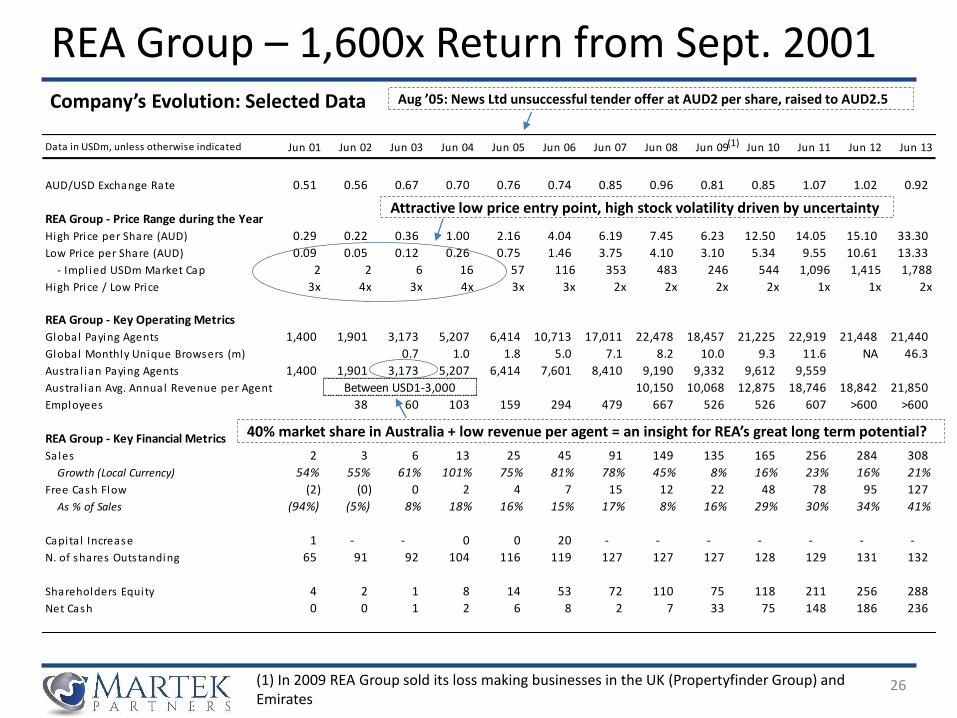
Data in USDm, unless otherwise indicated Jun 01 Jun 02 Jun 03 Jun 04 Jun 05 Jun 06 Jun 07 Jun 08 Jun 09 Jun 10 Jun 11 Jun 12 Jun 13
AUD/USD Exchange Rate 0.51 0.56 0.67 0.70 0.76 0.74 0.85 0.96 0.81 0.85 1.07 1.02 0.92
REA Group - Price Range during the Year
High Price per Share (AUD) 0.29 0.22 0.36 1.00 2.16 4.04 6.19 7.45 6.23 12.50 14.05 15.10 33.30
Low Price per Share (AUD) 0.09 0.05 0.12 0.26 0.75 1.46 3.75 4.10 3.10 5.34 9.55 10.61 13.33
- Impl ied USDm Market Cap 2 2 6 16 57 116 353 483 246 544 1,096 1,415 1,788
High Price / Low Price 3x 4x 3x 4x 3x 3x 2x 2x 2x 2x 1x 1x 2x
REA Group - Key Operating Metrics
Global Paying Agents 1,400 1,901 3,173 5,207 6,414 10,713 17,011 22,478 18,457 21,225 22,919 21,448 21,440
Global Monthly Unique Browsers (m) 0.7 1.0 1.8 5.0 7.1 8.2 10.0 9.3 11.6 NA 46.3
Austra l ian Paying Agents 1,400 1,901 3,173 5,207 6,414 7,601 8,410 9,190 9,332 9,612 9,559
Austra l ian Avg. Annual Revenue per Agent Between USD1-3,000 10,150 10,068 12,875 18,746 18,842 21,850
Employees 38 60 103 159 294 479 667 526 526 607 >600 >600
REA Group - Key Financial Metrics
Sales 2 3 6 13 25 45 91 149 135 165 256 284 308
Growth (Local Currency) 54% 55% 61% 101% 75% 81% 78% 45% 8% 16% 23% 16% 21%
Free Cash Flow (2) (0) 0 2 4 7 15 12 22 48 78 95 127
As % of Sales (94%) (5%) 8% 18% 16% 15% 17% 8% 16% 29% 30% 34% 41%
Capita l Increase 1 - - 0 0 20 - - - - - - -
N. of shares Outstanding 65 91 92 104 116 119 127 127 127 128 129 131 132
Shareholders Equity 4 2 1 8 14 53 72 110 75 118 211 256 288
Net Cash 0 0 1 2 6 8 2 7 33 75 148 186 236
26
REA Group – 1,600x Return from Sept. 2001 Company’s Evolution: Selected Data
Attractive low price entry point, high stock volatility driven by uncertainty
40% market share in Australia + low revenue per agent = an insight for REA’s great long term potential?
Aug ’05: News Ltd unsuccessful tender offer at AUD2 per share, raised to AUD2.5
(1) In 2009 REA Group sold its loss making businesses in the UK (Propertyfinder Group) and Emirates
(1)
27
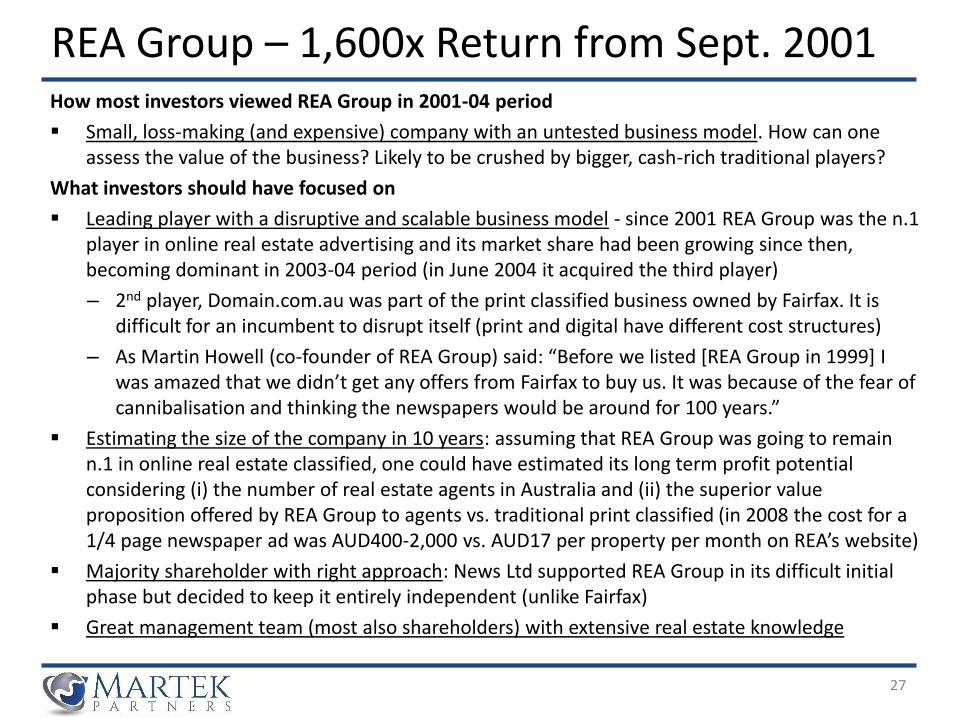
REA Group – 1,600x Return from Sept. 2001 How most investors viewed REA Group in 2001-04 period
▪ Small, loss-making (and expensive) company with an untested business model. How can one assess the value of the business? Likely to be crushed by bigger, cash-rich traditional players?
What investors should have focused on
▪ Leading player with a disruptive and scalable business model - since 2001 REA Group was the n.1 player in online real estate advertising and its market share had been growing since then, becoming dominant in 2003-04 period (in June 2004 it acquired the third player)
– 2nd player, Domain.com.au was part of the print classified business owned by Fairfax. It is difficult for an incumbent to disrupt itself (print and digital have different cost structures)
– As Martin Howell (co-founder of REA Group) said: “Before we listed [REA Group in 1999] I was amazed that we didn’t get any offers from Fairfax to buy us. It was because of the fear of cannibalisation and thinking the newspapers would be around for 100 years.”
▪ Estimating the size of the company in 10 years: assuming that REA Group was going to remain n.1 in online real estate classified, one could have estimated its long term profit potential considering (i) the number of real estate agents in Australia and (ii) the superior value proposition offered by REA Group to agents vs. traditional print classified (in 2008 the cost for a 1/4 page newspaper ad was AUD400-2,000 vs. AUD17 per property per month on REA’s website)
▪ Majority shareholder with right approach: News Ltd supported REA Group in its difficult initial phase but decided to keep it entirely independent (unlike Fairfax)
▪ Great management team (most also shareholders) with extensive real estate knowledge
28
A Few Examples of Multi-baggers Stocks
Case 2: Philippine Seven (Philippines)A neglected, 300+ stores 7-Eleven licensee, waiting to be discovered
▪ Extremely low market valuation combined with relatively poor economics…
▪ ….can lead to outstanding long-term returns driven by financial performance improvements and multiple re-rating
▪ Was it predictable?
29
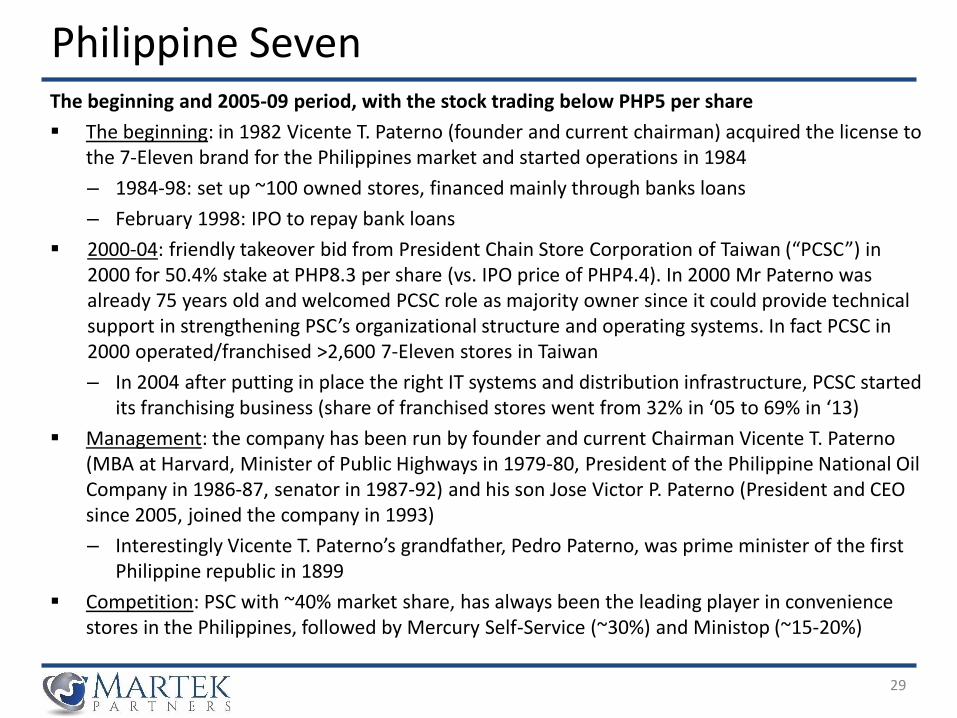
Philippine SevenThe beginning and 2005-09 period, with the stock trading below PHP5 per share
▪ The beginning: in 1982 Vicente T. Paterno (founder and current chairman) acquired the license to the 7-Eleven brand for the Philippines market and started operations in 1984
– 1984-98: set up ~100 owned stores, financed mainly through banks loans
– February 1998: IPO to repay bank loans
▪ 2000-04: friendly takeover bid from President Chain Store Corporation of Taiwan (“PCSC”) in 2000 for 50.4% stake at PHP8.3 per share (vs. IPO price of PHP4.4). In 2000 Mr Paterno was already 75 years old and welcomed PCSC role as majority owner since it could provide technical support in strengthening PSC’s organizational structure and operating systems. In fact PCSC in 2000 operated/franchised >2,600 7-Eleven stores in Taiwan
– In 2004 after putting in place the right IT systems and distribution infrastructure, PCSC started its franchising business (share of franchised stores went from 32% in ‘05 to 69% in ‘13)
▪ Management: the company has been run by founder and current Chairman Vicente T. Paterno (MBA at Harvard, Minister of Public Highways in 1979-80, President of the Philippine National Oil Company in 1986-87, senator in 1987-92) and his son Jose Victor P. Paterno (President and CEO since 2005, joined the company in 1993)
– Interestingly Vicente T. Paterno’s grandfather, Pedro Paterno, was prime minister of the first Philippine republic in 1899
▪ Competition: PSC with ~40% market share, has always been the leading player in convenience stores in the Philippines, followed by Mercury Self-Service (~30%) and Ministop (~15-20%)
30
Philippine SevenAssessing Philippine Seven’s Management and Company Culture
Quotes from Founder and Chairman Paterno
▪ On long term thinking (source: March 2009 article): “We think several years ahead. Take franchising, for example. We only started doing it when we had over 10 years of experience under our belt—we didn’t want to go too fast and get it wrong. It might make our numbers look good in the short term, but there are too many examples of companies who made a mess of things by franchising when they weren’t ready.”
▪ On being conservative on projections (source: 2010 annual report): “We must advise our valued shareholders however not to expect the favourable rates of increase in earnings achieved in the last two years to be sustained. In those years the company reaped the early benefits from improvements management had made in the years since 2005”
Example of Philippine Seven’s early Focus on Best Practises and Procedures in setting up and managing 7-Eleven Stores
▪ In 1983 in order to apply Southland’s technology (Southland was the US company, owner of the 7-Eleven brand) in all phases of managing a 7-Eleven convenience store, PSC sent five of its senior employees to various Southland installations in the US. The so-called Five-Man Team left on February 15, 1983 to undergo a five-week in-depth training in their respective fields. Upon their return to the country, the Five-Man Team immediately set out to practice what they have learned from the functional training: site selection, design and construction of the first 7-Eleven store, negotiation with suppliers, ordering of equipment, recruitment and training of the first batch of employees
-5x
5x
15x
25x
35x
45x
55x
65x
75x
-PHP5
PHP15
PHP35
PHP55
PHP75
PHP95
PHP115
PHP135
Philippine Seven Corp. (PSE:SEVN) - Share Pricing Philippine Seven Corp. (PSE:SEVN) - TEV/Total Revenues
Philippine Seven Corp. (PSE:SEVN) - TEV/EBIT
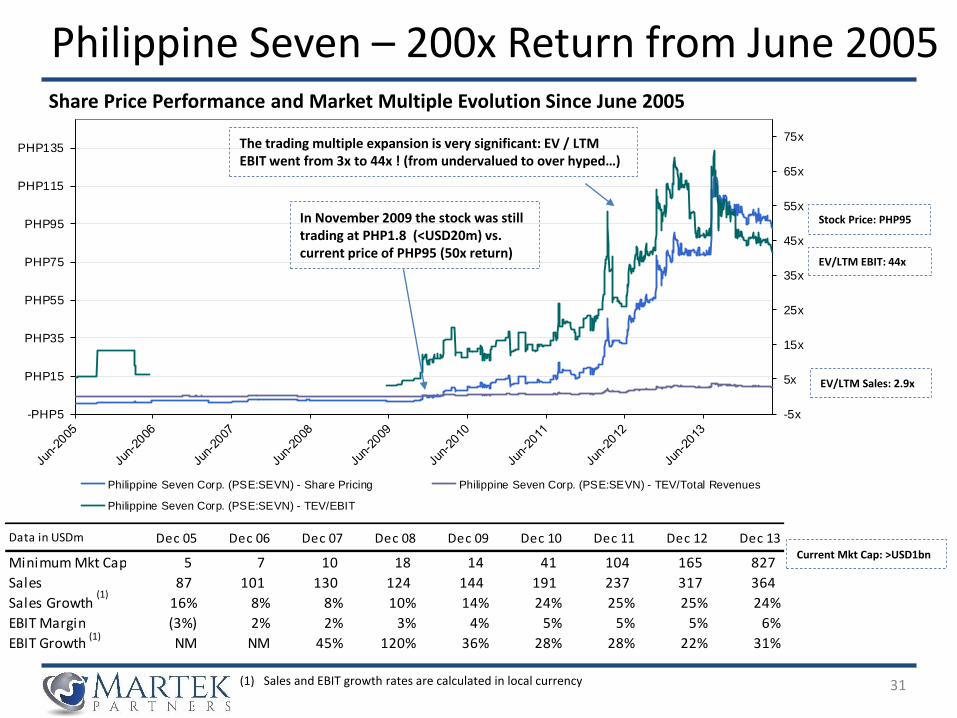
Data in USDm Dec 05 Dec 06 Dec 07 Dec 08 Dec 09 Dec 10 Dec 11 Dec 12 Dec 13
Minimum Mkt Cap 5 7 10 18 14 41 104 165 827
Sales 87 101 130 124 144 191 237 317 364
Sales Growth 16% 8% 8% 10% 14% 24% 25% 25% 24%
EBIT Margin (3%) 2% 2% 3% 4% 5% 5% 5% 6%
EBIT Growth NM NM 45% 120% 36% 28% 28% 22% 31%
31
Share Price Performance and Market Multiple Evolution Since June 2005
In November 2009 the stock was still trading at PHP1.8 (<USD20m) vs. current price of PHP95 (50x return)
The trading multiple expansion is very significant: EV / LTM EBIT went from 3x to 44x ! (from undervalued to over hyped…)
Stock Price: PHP95
EV/LTM Sales: 2.9x
EV/LTM EBIT: 44x
Current Mkt Cap: >USD1bn
(1) Sales and EBIT growth rates are calculated in local currency
(1)
(1)
Philippine Seven – 200x Return from June 2005
32
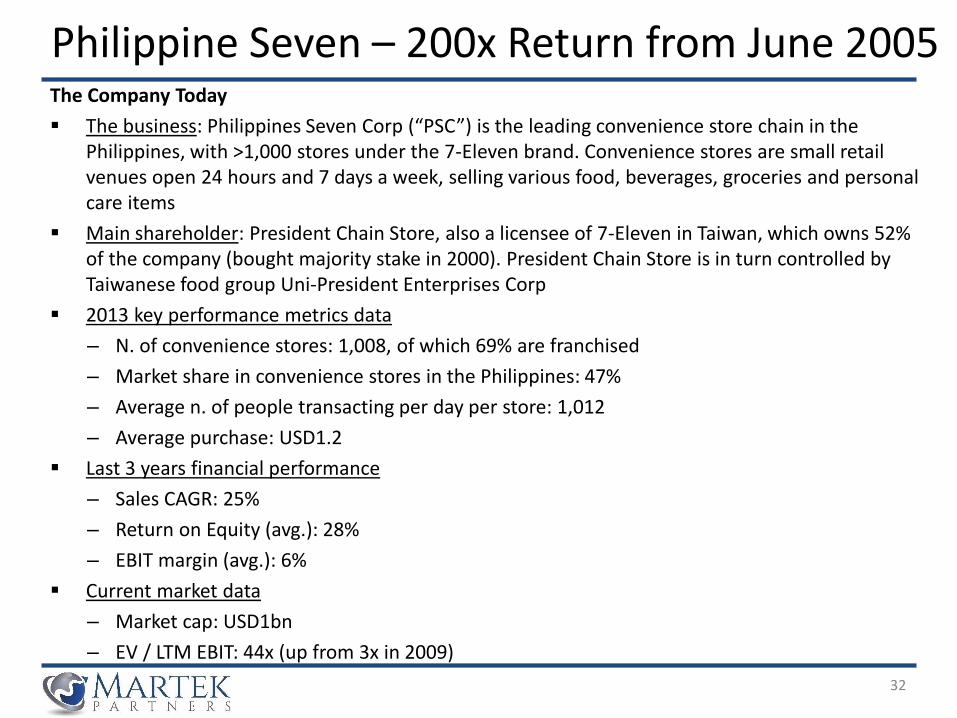
Philippine Seven – 200x Return from June 2005 The Company Today
▪ The business: Philippines Seven Corp (“PSC”) is the leading convenience store chain in the Philippines, with >1,000 stores under the 7-Eleven brand. Convenience stores are small retail venues open 24 hours and 7 days a week, selling various food, beverages, groceries and personal care items
▪ Main shareholder: President Chain Store, also a licensee of 7-Eleven in Taiwan, which owns 52% of the company (bought majority stake in 2000). President Chain Store is in turn controlled by Taiwanese food group Uni-President Enterprises Corp
▪ 2013 key performance metrics data
– N. of convenience stores: 1,008, of which 69% are franchised
– Market share in convenience stores in the Philippines: 47%
– Average n. of people transacting per day per store: 1,012
– Average purchase: USD1.2
▪ Last 3 years financial performance
– Sales CAGR: 25%
– Return on Equity (avg.): 28%
– EBIT margin (avg.): 6%
▪ Current market data
– Market cap: USD1bn
– EV / LTM EBIT: 44x (up from 3x in 2009)
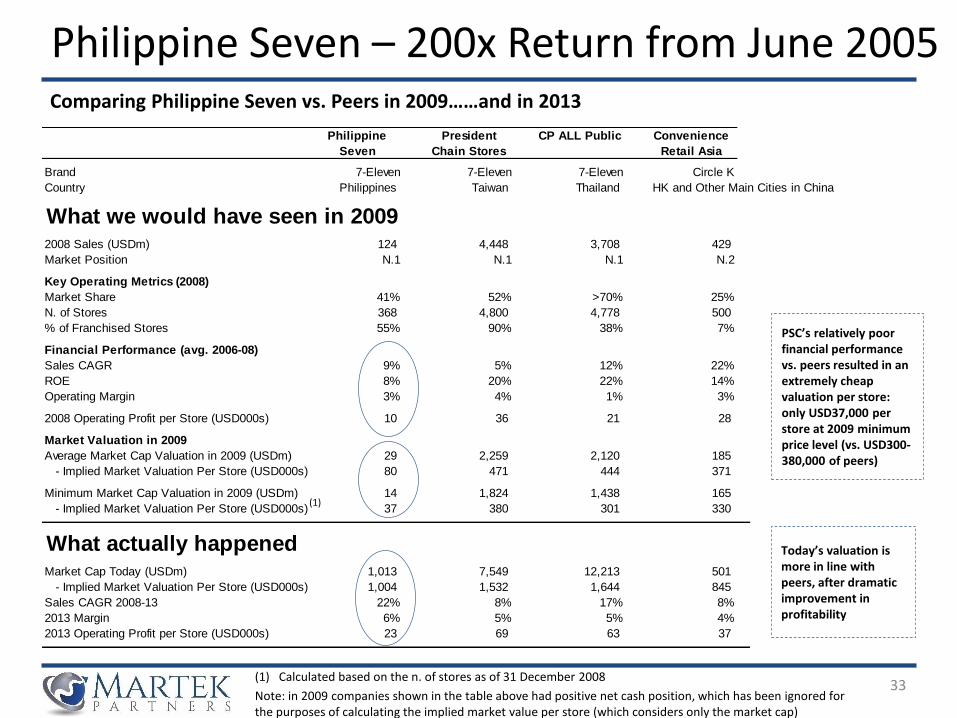
Philippine
Seven
President
Chain Stores
CP ALL Public Convenience
Retail Asia
Brand 7-Eleven 7-Eleven 7-Eleven Circle K
Country Philippines Taiwan Thailand HK and Other Main Cities in China
What we would have seen in 20092008 Sales (USDm) 124 4,448 3,708 429
Market Position N.1 N.1 N.1 N.2
Key Operating Metrics (2008)
Market Share 41% 52% >70% 25%
N. of Stores 368 4,800 4,778 500
% of Franchised Stores 55% 90% 38% 7%
Financial Performance (avg. 2006-08)
Sales CAGR 9% 5% 12% 22%
ROE 8% 20% 22% 14%
Operating Margin 3% 4% 1% 3%
2008 Operating Profit per Store (USD000s) 10 36 21 28
Market Valuation in 2009
Average Market Cap Valuation in 2009 (USDm) 29 2,259 2,120 185
- Implied Market Valuation Per Store (USD000s) 80 471 444 371
Minimum Market Cap Valuation in 2009 (USDm) 14 1,824 1,438 165
- Implied Market Valuation Per Store (USD000s) 37 380 301 330
What actually happened Market Cap Today (USDm) 1,013 7,549 12,213 501
- Implied Market Valuation Per Store (USD000s) 1,004 1,532 1,644 845
Sales CAGR 2008-13 22% 8% 17% 8%
2013 Margin 6% 5% 5% 4%
2013 Operating Profit per Store (USD000s) 23 69 63 37
33
Comparing Philippine Seven vs. Peers in 2009……and in 2013
Today’s valuation is more in line with peers, after dramatic improvement in profitability
PSC’s relatively poor financial performance vs. peers resulted in an extremely cheap valuation per store: only USD37,000 per store at 2009 minimum price level (vs. USD300-380,000 of peers)
(1) Calculated based on the n. of stores as of 31 December 2008
Note: in 2009 companies shown in the table above had positive net cash position, which has been ignored for the purposes of calculating the implied market value per store (which considers only the market cap)
(1)
Philippine Seven – 200x Return from June 2005
Data in USDm, unless otherwise indicated Dec 05 Dec 06 Dec 07 Dec 08 Dec 09 Dec 10 Dec 11 Dec 12 Dec 13
PHP/USD Exchange rate 53 49 41 47 47 44 44 41 44
Philippines Seven - Price Range during the Year
High Price per Share (PHP) 1.0 2.1 2.2 2.6 5.0 15.1 21.9 80.0 120.9
Low Price per Share (PHP) 0.6 0.8 1.1 1.7 1.4 4.1 9.9 15.9 74.8
- Impl ied Market Cap in USDm 5 7 10 18 14 41 104 165 827
- Impl ied Market Cap / Store in USD000s 18 27 33 49 30 74 150 199 820
High Price / Low Price 2x 3x 2x 2x 4x 4x 2x 5x 2x
Market Share in Convenience Stores in the Philippines
Philippine Seven 42% 38% 37% 41% 43% 47% 50% 45% 47%
Mercury 32% 37% 37% 32% 28% 24% 25% 33% 32%
Philippine Seven - Key Operating Metrics
Avg. n. of People transacting per Day per Store 1,225 1,144 1,197 1,136 1,032 1,045 1,000 988 1,012
Average Purchase (USD) 0.8 0.9 1.1 1.0 1.0 1.1 1.1 1.2 1.2
N. of Stores 265 257 311 368 447 551 689 829 1,008
Owned Operated Stores 179 137 151 167 193 210 245 275 317
Franchised Stores 86 120 160 201 254 341 444 554 691
% of Franchised Stores 32% 47% 51% 55% 57% 62% 64% 67% 69%
Operating Profit per Store (USD000s) (9) 8 10 10 13 17 18 21 22
NWC as % of Sales 1% 2% 4% 1% 1% (2%) (1%) 2% 3%
Sales / Capital Employed (E + D) 5x 5x 5x 5x 5x 6x 6x 5x 5x
34
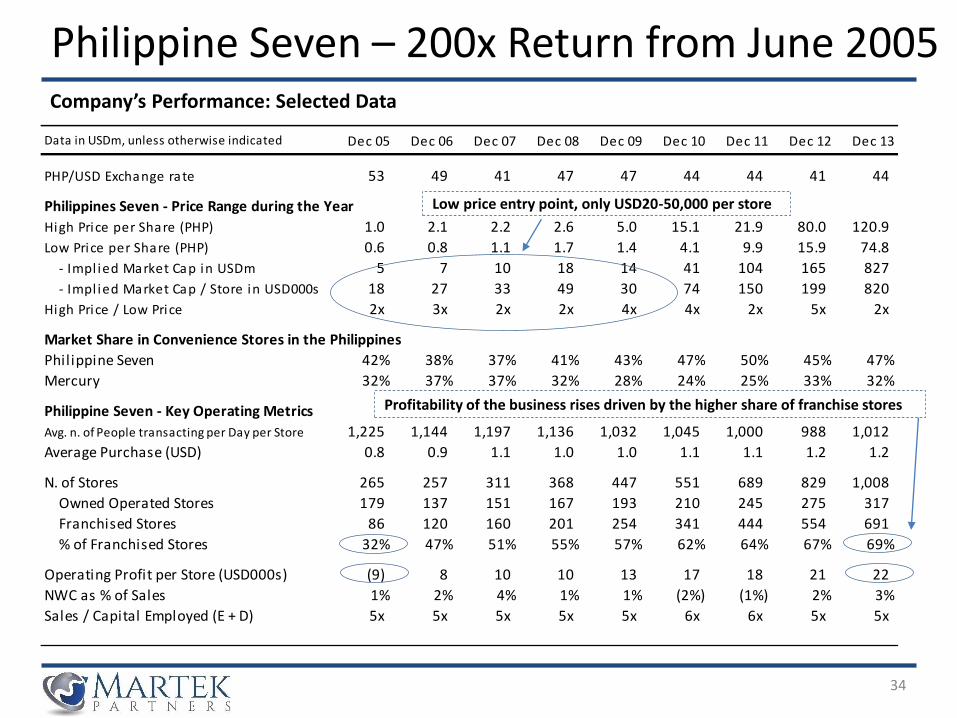
Company’s Performance: Selected Data
Low price entry point, only USD20-50,000 per store
Profitability of the business rises driven by the higher share of franchise stores
Philippine Seven – 200x Return from June 2005
35
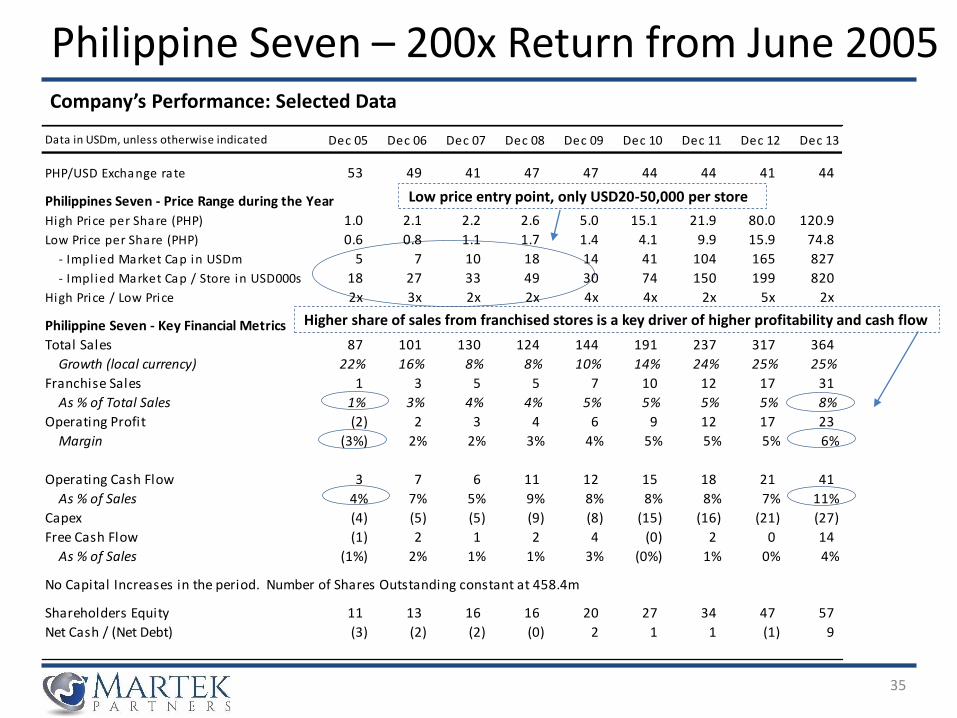
Company’s Performance: Selected Data
Higher share of sales from franchised stores is a key driver of higher profitability and cash flow
Low price entry point, only USD20-50,000 per store
Data in USDm, unless otherwise indicated Dec 05 Dec 06 Dec 07 Dec 08 Dec 09 Dec 10 Dec 11 Dec 12 Dec 13
PHP/USD Exchange rate 53 49 41 47 47 44 44 41 44
Philippines Seven - Price Range during the Year
High Price per Share (PHP) 1.0 2.1 2.2 2.6 5.0 15.1 21.9 80.0 120.9
Low Price per Share (PHP) 0.6 0.8 1.1 1.7 1.4 4.1 9.9 15.9 74.8
- Impl ied Market Cap in USDm 5 7 10 18 14 41 104 165 827
- Impl ied Market Cap / Store in USD000s 18 27 33 49 30 74 150 199 820
High Price / Low Price 2x 3x 2x 2x 4x 4x 2x 5x 2x
Philippine Seven - Key Financial Metrics
Total Sales 87 101 130 124 144 191 237 317 364
Growth (local currency) 22% 16% 8% 8% 10% 14% 24% 25% 25%
Franchise Sales 1 3 5 5 7 10 12 17 31
As % of Total Sales 1% 3% 4% 4% 5% 5% 5% 5% 8%
Operating Profit (2) 2 3 4 6 9 12 17 23
Margin (3%) 2% 2% 3% 4% 5% 5% 5% 6%
Operating Cash Flow 3 7 6 11 12 15 18 21 41
As % of Sales 4% 7% 5% 9% 8% 8% 8% 7% 11%
Capex (4) (5) (5) (9) (8) (15) (16) (21) (27)
Free Cash Flow (1) 2 1 2 4 (0) 2 0 14
As % of Sales (1%) 2% 1% 1% 3% (0%) 1% 0% 4%
No Capital Increases in the period. Number of Shares Outstanding constant at 458.4m
Shareholders Equity 11 13 16 16 20 27 34 47 57
Net Cash / (Net Debt) (3) (2) (2) (0) 2 1 1 (1) 9
Philippine Seven – 200x Return from June 2005
36
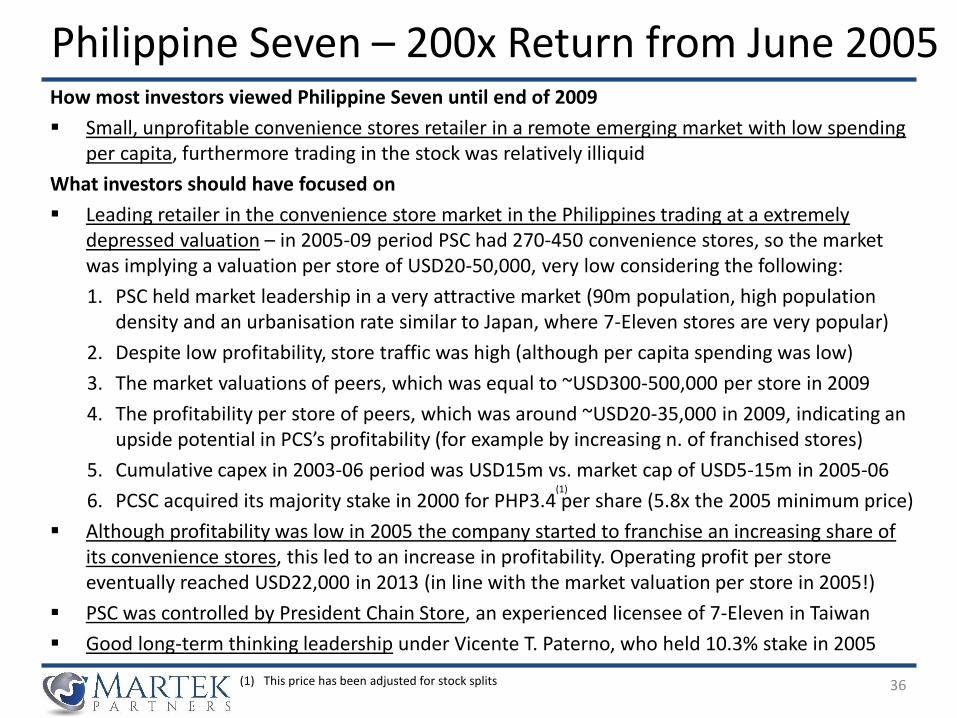
How most investors viewed Philippine Seven until end of 2009
▪ Small, unprofitable convenience stores retailer in a remote emerging market with low spending per capita, furthermore trading in the stock was relatively illiquid
What investors should have focused on
▪ Leading retailer in the convenience store market in the Philippines trading at a extremely depressed valuation – in 2005-09 period PSC had 270-450 convenience stores, so the market was implying a valuation per store of USD20-50,000, very low considering the following:
1. PSC held market leadership in a very attractive market (90m population, high population density and an urbanisation rate similar to Japan, where 7-Eleven stores are very popular)
2. Despite low profitability, store traffic was high (although per capita spending was low)
3. The market valuations of peers, which was equal to ~USD300-500,000 per store in 2009
4. The profitability per store of peers, which was around ~USD20-35,000 in 2009, indicating an upside potential in PCS’s profitability (for example by increasing n. of franchised stores)
5. Cumulative capex in 2003-06 period was USD15m vs. market cap of USD5-15m in 2005-06
6. PCSC acquired its majority stake in 2000 for PHP3.4 per share (5.8x the 2005 minimum price)
▪ Although profitability was low in 2005 the company started to franchise an increasing share of its convenience stores, this led to an increase in profitability. Operating profit per store eventually reached USD22,000 in 2013 (in line with the market valuation per store in 2005!)
▪ PSC was controlled by President Chain Store, an experienced licensee of 7-Eleven in Taiwan
▪ Good long-term thinking leadership under Vicente T. Paterno, who held 10.3% stake in 2005
(1) This price has been adjusted for stock splits
(1)
Philippine Seven – 200x Return from June 2005
37
A Few Examples of Multi-baggers Stocks
Case 3: AutoZone (USA)A leading, well-run retailer with great capital allocation skills
▪ A 6% annual sales growth, combined with a reasonable entry price valuation and a high return on capital retail business model
▪ …can lead to outstanding long-term returns, especially if management has great capital allocation skills
38
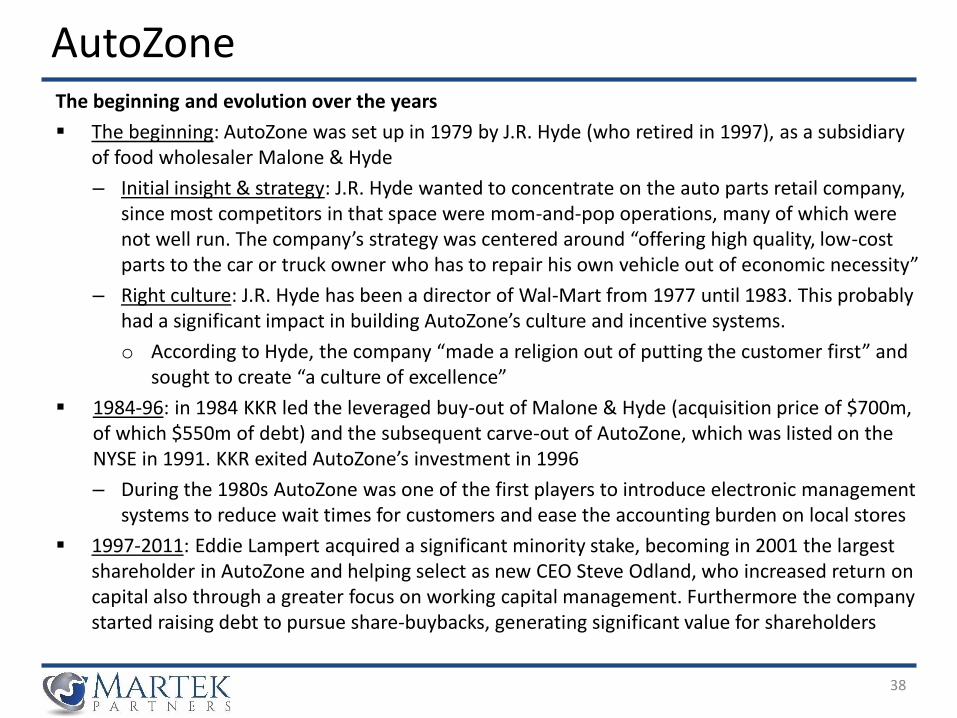
The beginning and evolution over the years
▪ The beginning: AutoZone was set up in 1979 by J.R. Hyde (who retired in 1997), as a subsidiary of food wholesaler Malone & Hyde
– Initial insight & strategy: J.R. Hyde wanted to concentrate on the auto parts retail company, since most competitors in that space were mom-and-pop operations, many of which were not well run. The company’s strategy was centered around “offering high quality, low-cost parts to the car or truck owner who has to repair his own vehicle out of economic necessity”
– Right culture: J.R. Hyde has been a director of Wal-Mart from 1977 until 1983. This probably had a significant impact in building AutoZone’s culture and incentive systems.
o According to Hyde, the company “made a religion out of putting the customer first” and sought to create “a culture of excellence”
▪ 1984-96: in 1984 KKR led the leveraged buy-out of Malone & Hyde (acquisition price of $700m, of which $550m of debt) and the subsequent carve-out of AutoZone, which was listed on the NYSE in 1991. KKR exited AutoZone’s investment in 1996
– During the 1980s AutoZone was one of the first players to introduce electronic management systems to reduce wait times for customers and ease the accounting burden on local stores
▪ 1997-2011: Eddie Lampert acquired a significant minority stake, becoming in 2001 the largest shareholder in AutoZone and helping select as new CEO Steve Odland, who increased return on capital also through a greater focus on working capital management. Furthermore the company started raising debt to pursue share-buybacks, generating significant value for shareholders
AutoZone
39
Assessing AutoZone’s Management and Company Culture
From 1991 William Blair report
▪ “AutoZone's key success ingredient contributing to its competitive strengths is superior execution of a very focused merchandise strategy, which places a much greater emphasis on replacement parts than on accessories or chemicals. The company does not sell tires or operate service bays. We believe AutoZone executes the parts business as well as, if not better than, anyone in the business. This means having the appropriate inventory coverage, along with a good in-stock record and in-store service, well-trained store employees, and consistently low everyday prices. AutoZone's relatively small stores and heavy market saturation strategy result in both convenient locations and dominant market share positions in most of its markets.”
▪ “While we attribute some of the company's superior productivity and returns to the application of advanced distribution and retail technology, there is another important factor at work here which we believe tends to separate the best companies from the pack: a very positive work environment which tends to produce highly motivated and involved employees. This corporate "culture," which we also see in companies such as Wal-Mart, Food Lion, Home Depot, and a handful of others, emanates from several factors including store management compensation which is tied directly to the financial performance of the store; opportunities for career advancement, resulting from growth and promotion from within; and, lastly, widespread ownership of stock and/or options throughout the organization. AutoZone's store managers and assistant managers each can earn an additional 20% of base salary based on store performance, and all store managers are eligible for stock options after their first year.”
AutoZone
5x
7x
9x
11x
13x
15x
17x
19x
$0
$100
$200
$300
$400
$500
$600
AutoZone, Inc. (NYSE:AZO) - Share Pricing AutoZone, Inc. (NYSE:AZO) - TEV/EBIT
40
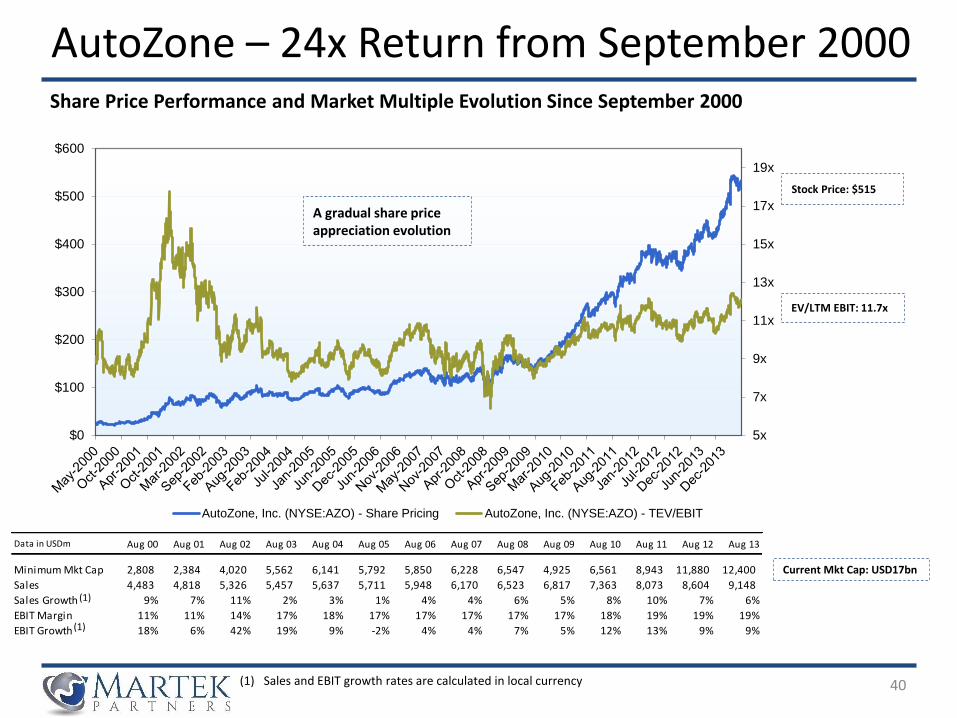
Share Price Performance and Market Multiple Evolution Since September 2000
A gradual share price appreciation evolution
Stock Price: $515
EV/LTM EBIT: 11.7x
Current Mkt Cap: USD17bn
AutoZone – 24x Return from September 2000
Data in USDm Aug 00 Aug 01 Aug 02 Aug 03 Aug 04 Aug 05 Aug 06 Aug 07 Aug 08 Aug 09 Aug 10 Aug 11 Aug 12 Aug 13
Minimum Mkt Cap 2,808 2,384 4,020 5,562 6,141 5,792 5,850 6,228 6,547 4,925 6,561 8,943 11,880 12,400
Sales 4,483 4,818 5,326 5,457 5,637 5,711 5,948 6,170 6,523 6,817 7,363 8,073 8,604 9,148
Sales Growth 9% 7% 11% 2% 3% 1% 4% 4% 6% 5% 8% 10% 7% 6%
EBIT Margin 11% 11% 14% 17% 18% 17% 17% 17% 17% 17% 18% 19% 19% 19%
EBIT Growth 18% 6% 42% 19% 9% -2% 4% 4% 7% 5% 12% 13% 9% 9%
(1) Sales and EBIT growth rates are calculated in local currency
(1)
(1)
41
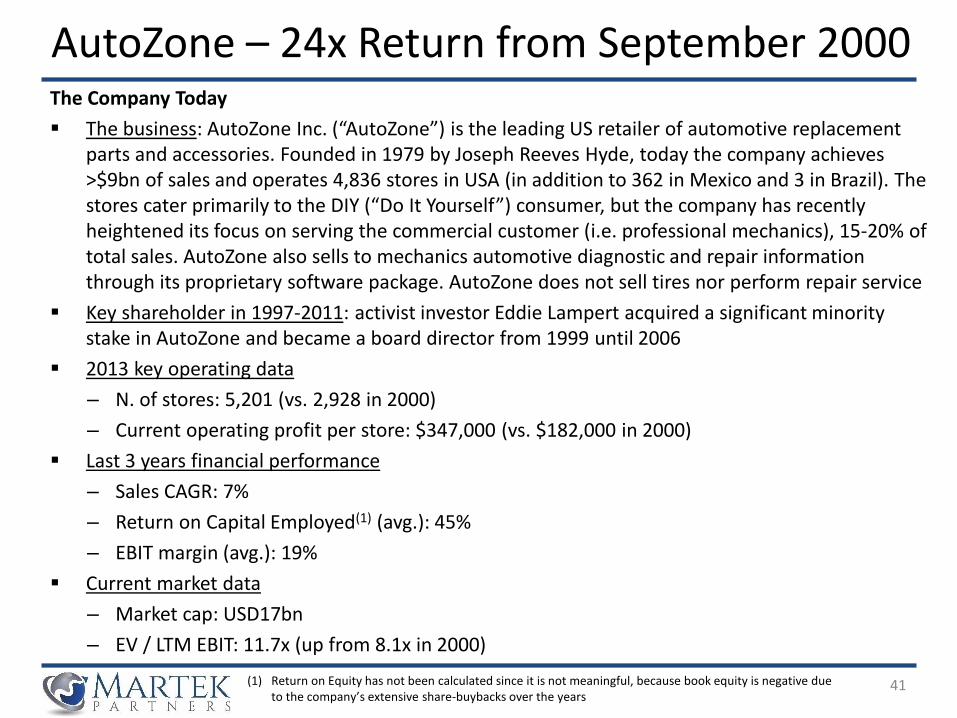
AutoZone – 24x Return from September 2000The Company Today
▪ The business: AutoZone Inc. (“AutoZone”) is the leading US retailer of automotive replacement parts and accessories. Founded in 1979 by Joseph Reeves Hyde, today the company achieves >$9bn of sales and operates 4,836 stores in USA (in addition to 362 in Mexico and 3 in Brazil). The stores cater primarily to the DIY (“Do It Yourself”) consumer, but the company has recently heightened its focus on serving the commercial customer (i.e. professional mechanics), 15-20% of total sales. AutoZone also sells to mechanics automotive diagnostic and repair information through its proprietary software package. AutoZone does not sell tires nor perform repair service
▪ Key shareholder in 1997-2011: activist investor Eddie Lampert acquired a significant minority stake in AutoZone and became a board director from 1999 until 2006
▪ 2013 key operating data
– N. of stores: 5,201 (vs. 2,928 in 2000)
– Current operating profit per store: $347,000 (vs. $182,000 in 2000)
▪ Last 3 years financial performance
– Sales CAGR: 7%
– Return on Capital Employed(1) (avg.): 45%
– EBIT margin (avg.): 19%
▪ Current market data
– Market cap: USD17bn
– EV / LTM EBIT: 11.7x (up from 8.1x in 2000)
(1) Return on Equity has not been calculated since it is not meaningful, because book equity is negative due to the company’s extensive share-buybacks over the years
42
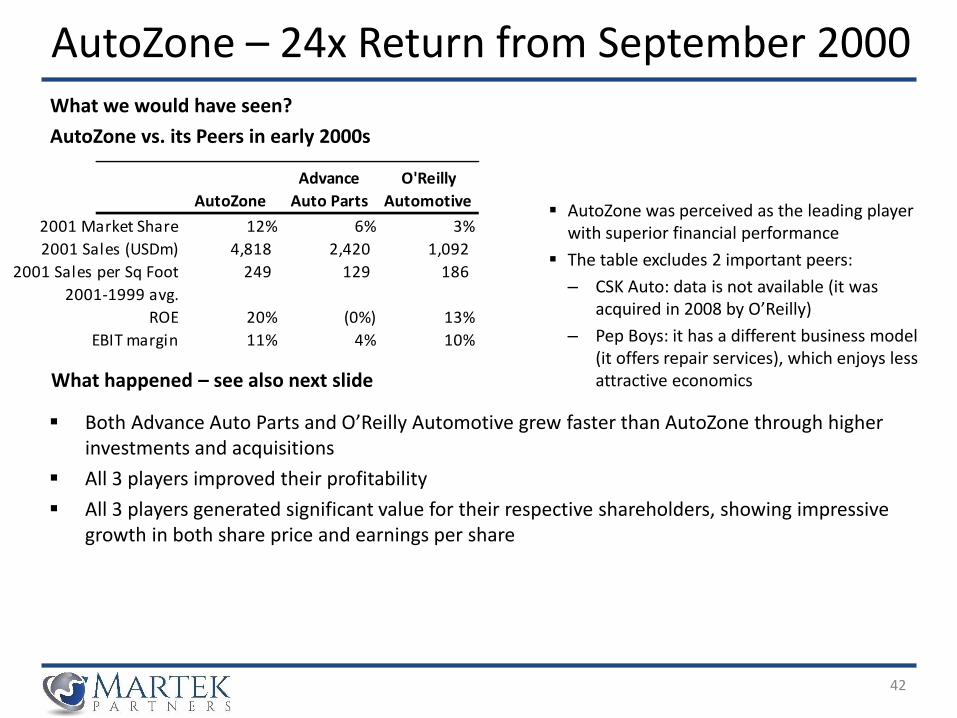
What we would have seen?
AutoZone vs. its Peers in early 2000s
AutoZone – 24x Return from September 2000
What happened – see also next slide
▪ AutoZone was perceived as the leading player with superior financial performance
▪ The table excludes 2 important peers:
– CSK Auto: data is not available (it was acquired in 2008 by O’Reilly)
– Pep Boys: it has a different business model (it offers repair services), which enjoys less attractive economics
▪ Both Advance Auto Parts and O’Reilly Automotive grew faster than AutoZone through higher investments and acquisitions
▪ All 3 players improved their profitability
▪ All 3 players generated significant value for their respective shareholders, showing impressive growth in both share price and earnings per share
AutoZone
Advance
Auto Parts
O'Reilly
Automotive
2001 Market Share 12% 6% 3%
2001 Sales (USDm) 4,818 2,420 1,092
2001 Sales per Sq Foot 249 129 186
2001-1999 avg.
ROE 20% (0%) 13%
EBIT margin 11% 4% 10%
43
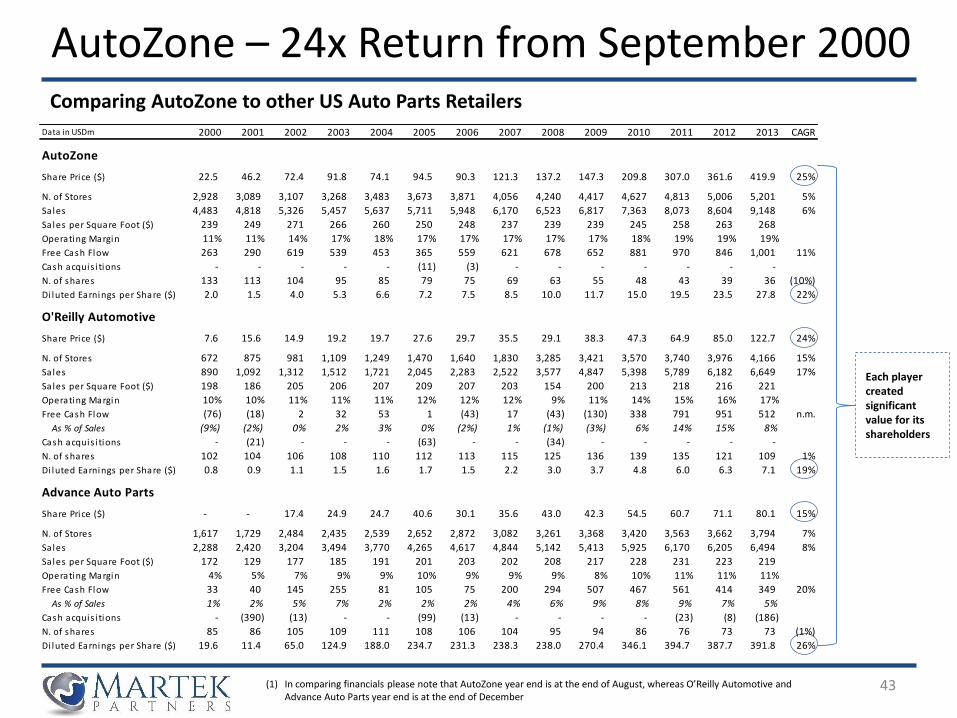
Comparing AutoZone to other US Auto Parts Retailers
AutoZone – 24x Return from September 2000
Data in USDm 2000 2001 2002 2003 2004 2005 2006 2007 2008 2009 2010 2011 2012 2013 CAGR
AutoZone
Share Price ($) 22.5 46.2 72.4 91.8 74.1 94.5 90.3 121.3 137.2 147.3 209.8 307.0 361.6 419.9 25%
N. of Stores 2,928 3,089 3,107 3,268 3,483 3,673 3,871 4,056 4,240 4,417 4,627 4,813 5,006 5,201 5%
Sales 4,483 4,818 5,326 5,457 5,637 5,711 5,948 6,170 6,523 6,817 7,363 8,073 8,604 9,148 6%
Sales per Square Foot ($) 239 249 271 266 260 250 248 237 239 239 245 258 263 268
Operating Margin 11% 11% 14% 17% 18% 17% 17% 17% 17% 17% 18% 19% 19% 19%
Free Cash Flow 263 290 619 539 453 365 559 621 678 652 881 970 846 1,001 11%
Cash acquis i tions - - - - - (11) (3) - - - - - - -
N. of shares 133 113 104 95 85 79 75 69 63 55 48 43 39 36 (10%)
Di luted Earnings per Share ($) 2.0 1.5 4.0 5.3 6.6 7.2 7.5 8.5 10.0 11.7 15.0 19.5 23.5 27.8 22%
O'Reilly Automotive
Share Price ($) 7.6 15.6 14.9 19.2 19.7 27.6 29.7 35.5 29.1 38.3 47.3 64.9 85.0 122.7 24%
N. of Stores 672 875 981 1,109 1,249 1,470 1,640 1,830 3,285 3,421 3,570 3,740 3,976 4,166 15%
Sales 890 1,092 1,312 1,512 1,721 2,045 2,283 2,522 3,577 4,847 5,398 5,789 6,182 6,649 17%
Sales per Square Foot ($) 198 186 205 206 207 209 207 203 154 200 213 218 216 221
Operating Margin 10% 10% 11% 11% 11% 12% 12% 12% 9% 11% 14% 15% 16% 17%
Free Cash Flow (76) (18) 2 32 53 1 (43) 17 (43) (130) 338 791 951 512 n.m.
As % of Sales (9%) (2%) 0% 2% 3% 0% (2%) 1% (1%) (3%) 6% 14% 15% 8%
Cash acquis i tions - (21) - - - (63) - - (34) - - - - -
N. of shares 102 104 106 108 110 112 113 115 125 136 139 135 121 109 1%
Di luted Earnings per Share ($) 0.8 0.9 1.1 1.5 1.6 1.7 1.5 2.2 3.0 3.7 4.8 6.0 6.3 7.1 19%
Advance Auto Parts
Share Price ($) - - 17.4 24.9 24.7 40.6 30.1 35.6 43.0 42.3 54.5 60.7 71.1 80.1 15%
N. of Stores 1,617 1,729 2,484 2,435 2,539 2,652 2,872 3,082 3,261 3,368 3,420 3,563 3,662 3,794 7%
Sales 2,288 2,420 3,204 3,494 3,770 4,265 4,617 4,844 5,142 5,413 5,925 6,170 6,205 6,494 8%
Sales per Square Foot ($) 172 129 177 185 191 201 203 202 208 217 228 231 223 219
Operating Margin 4% 5% 7% 9% 9% 10% 9% 9% 9% 8% 10% 11% 11% 11%
Free Cash Flow 33 40 145 255 81 105 75 200 294 507 467 561 414 349 20%
As % of Sales 1% 2% 5% 7% 2% 2% 2% 4% 6% 9% 8% 9% 7% 5%
Cash acquis i tions - (390) (13) - - (99) (13) - - - - (23) (8) (186)
N. of shares 85 86 105 109 111 108 106 104 95 94 86 76 73 73 (1%)
Di luted Earnings per Share ($) 19.6 11.4 65.0 124.9 188.0 234.7 231.3 238.3 238.0 270.4 346.1 394.7 387.7 391.8 26%
Each player created significant value for its shareholders
(1) In comparing financials please note that AutoZone year end is at the end of August, whereas O’Reilly Automotive and Advance Auto Parts year end is at the end of December
Data in USDm, unless otherwise indicated Aug 00 Aug 01 Aug 02 Aug 03 Aug 04 Aug 05 Aug 06 Aug 07 Aug 08 Aug 09 Aug 10 Aug 11 Aug 12 Aug 13 CAGR
AutoZone - Price Range during the Year
High Price per Share (USD) 32.3 48.3 83.0 91.8 103.5 103.8 101.1 140.1 139.0 166.8 214.7 308.5 397.1 448.6
Low Price per Share (USD) 21.1 21.1 38.5 58.6 72.3 73.8 77.8 90.1 103.4 89.1 135.3 209.8 307.0 345.0
- Impl ied Market Cap 2,772 2,693 4,310 5,800 6,007 6,132 5,958 6,696 6,563 5,165 6,748 9,862 12,511 12,534
- Free Cash Flow / Impl ied Market Cap 9% 11% 14% 9% 8% 6% 9% 9% 10% 13% 13% 10% 7% 8%
High Price / Low Price 2x 2x 2x 2x 1x 1x 1x 2x 1x 2x 2x 1x 1x 1x
AutoZone - Key Operating Metrics
N. of Stores 2,928 3,089 3,107 3,268 3,483 3,673 3,871 4,056 4,240 4,417 4,627 4,813 5,006 5,201 5%
Total Store Square Footage (m) 19 19 20 21 22 23 25 26 27 29 30 31 33 34 5%
N. of Employees (000s) 43 45 44 48 48 52 53 55 57 60 63 65 70 71 4%
Avg. Sa les per Store ($ 000s) 1,590 1,602 1,719 1,712 1,670 1,596 1,577 1,557 1,572 1,575 1,628 1,710 1,752 1,792 1%
Avg. Sa les per Square Foot ($) 236 240 258 264 259 244 241 237 239 239 245 258 263 268 1%
Operating Profi t per Store ($ 000s) 182 181 249 288 296 273 268 266 271 272 292 317 332 347 5%
Gross Margin 42% 42% 45% 46% 49% 49% 49% 50% 50% 50% 50% 51% 52% 52%
Net Working Capita l As % of Sa les 3% 1% (2%) (3%) (2%) 0% (1%) (2%) (2%) (3%) (7%) (9%) (8%) (9%)
Sales / Net Invested Capita l 2.0x 2.3x 2.8x 3.0x 2.9x 2.7x 2.7x 2.7x 2.8x 3.0x 3.4x 3.9x 4.0x 3.9x
Operating Profi t / Net Invested Capita l 23% 26% 41% 50% 51% 46% 46% 47% 49% 52% 62% 72% 77% 75%
44
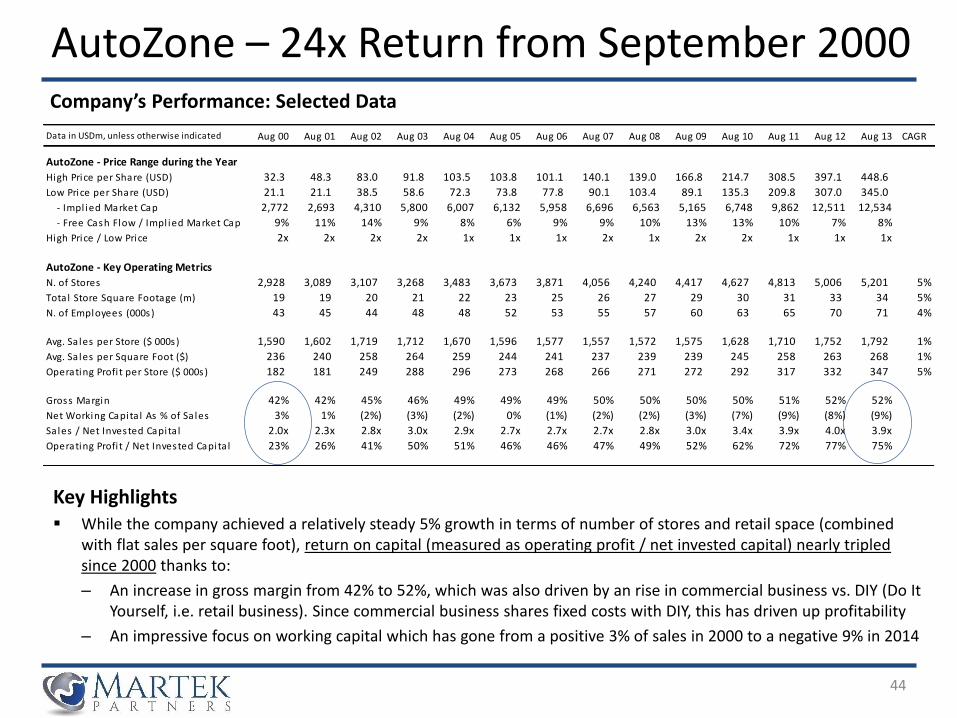
Company’s Performance: Selected Data
AutoZone – 24x Return from September 2000
Key Highlights▪ While the company achieved a relatively steady 5% growth in terms of number of stores and retail space (combined
with flat sales per square foot), return on capital (measured as operating profit / net invested capital) nearly tripled since 2000 thanks to:
– An increase in gross margin from 42% to 52%, which was also driven by an rise in commercial business vs. DIY (Do It Yourself, i.e. retail business). Since commercial business shares fixed costs with DIY, this has driven up profitability
– An impressive focus on working capital which has gone from a positive 3% of sales in 2000 to a negative 9% in 2014
45
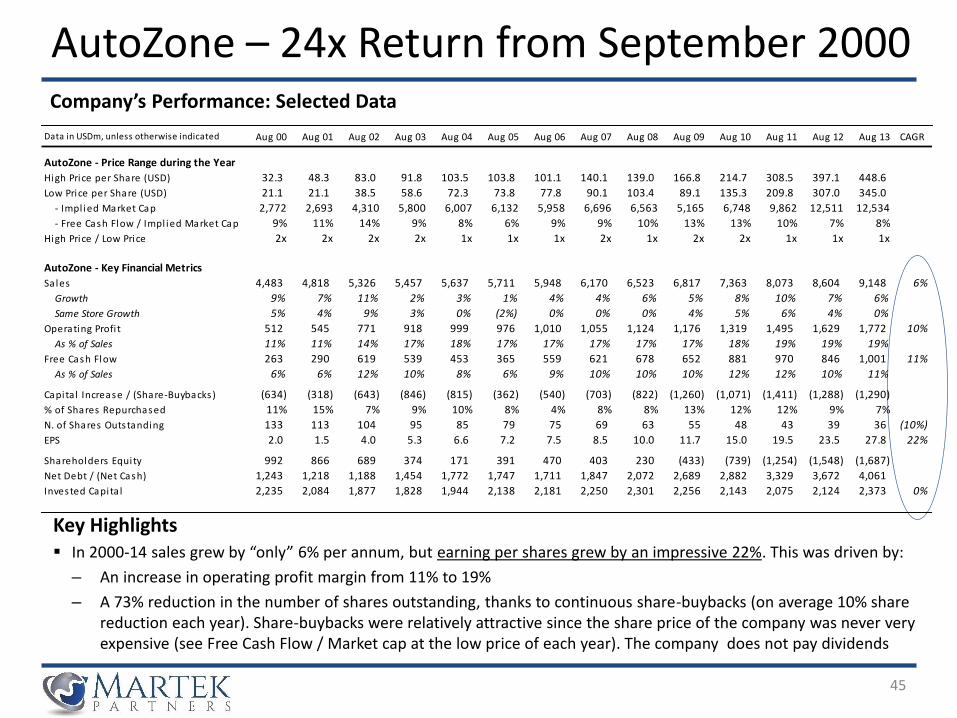
Company’s Performance: Selected Data
AutoZone – 24x Return from September 2000
Key Highlights▪ In 2000-14 sales grew by “only” 6% per annum, but earning per shares grew by an impressive 22%. This was driven by:
– An increase in operating profit margin from 11% to 19%
– A 73% reduction in the number of shares outstanding, thanks to continuous share-buybacks (on average 10% share reduction each year). Share-buybacks were relatively attractive since the share price of the company was never very expensive (see Free Cash Flow / Market cap at the low price of each year). The company does not pay dividends
Data in USDm, unless otherwise indicated Aug 00 Aug 01 Aug 02 Aug 03 Aug 04 Aug 05 Aug 06 Aug 07 Aug 08 Aug 09 Aug 10 Aug 11 Aug 12 Aug 13 CAGR
AutoZone - Price Range during the Year
High Price per Share (USD) 32.3 48.3 83.0 91.8 103.5 103.8 101.1 140.1 139.0 166.8 214.7 308.5 397.1 448.6
Low Price per Share (USD) 21.1 21.1 38.5 58.6 72.3 73.8 77.8 90.1 103.4 89.1 135.3 209.8 307.0 345.0
- Impl ied Market Cap 2,772 2,693 4,310 5,800 6,007 6,132 5,958 6,696 6,563 5,165 6,748 9,862 12,511 12,534
- Free Cash Flow / Impl ied Market Cap 9% 11% 14% 9% 8% 6% 9% 9% 10% 13% 13% 10% 7% 8%
High Price / Low Price 2x 2x 2x 2x 1x 1x 1x 2x 1x 2x 2x 1x 1x 1x
AutoZone - Key Financial Metrics
Sales 4,483 4,818 5,326 5,457 5,637 5,711 5,948 6,170 6,523 6,817 7,363 8,073 8,604 9,148 6%
Growth 9% 7% 11% 2% 3% 1% 4% 4% 6% 5% 8% 10% 7% 6%
Same Store Growth 5% 4% 9% 3% 0% (2%) 0% 0% 0% 4% 5% 6% 4% 0%
Operating Profi t 512 545 771 918 999 976 1,010 1,055 1,124 1,176 1,319 1,495 1,629 1,772 10%
As % of Sales 11% 11% 14% 17% 18% 17% 17% 17% 17% 17% 18% 19% 19% 19%
Free Cash Flow 263 290 619 539 453 365 559 621 678 652 881 970 846 1,001 11%
As % of Sales 6% 6% 12% 10% 8% 6% 9% 10% 10% 10% 12% 12% 10% 11%
Capita l Increase / (Share-Buybacks) (634) (318) (643) (846) (815) (362) (540) (703) (822) (1,260) (1,071) (1,411) (1,288) (1,290)
% of Shares Repurchased 11% 15% 7% 9% 10% 8% 4% 8% 8% 13% 12% 12% 9% 7%
N. of Shares Outstanding 133 113 104 95 85 79 75 69 63 55 48 43 39 36 (10%)
EPS 2.0 1.5 4.0 5.3 6.6 7.2 7.5 8.5 10.0 11.7 15.0 19.5 23.5 27.8 22%
Shareholders Equity 992 866 689 374 171 391 470 403 230 (433) (739) (1,254) (1,548) (1,687)
Net Debt / (Net Cash) 1,243 1,218 1,188 1,454 1,772 1,747 1,711 1,847 2,072 2,689 2,882 3,329 3,672 4,061
Invested Capita l 2,235 2,084 1,877 1,828 1,944 2,138 2,181 2,250 2,301 2,256 2,143 2,075 2,124 2,373 0%
46
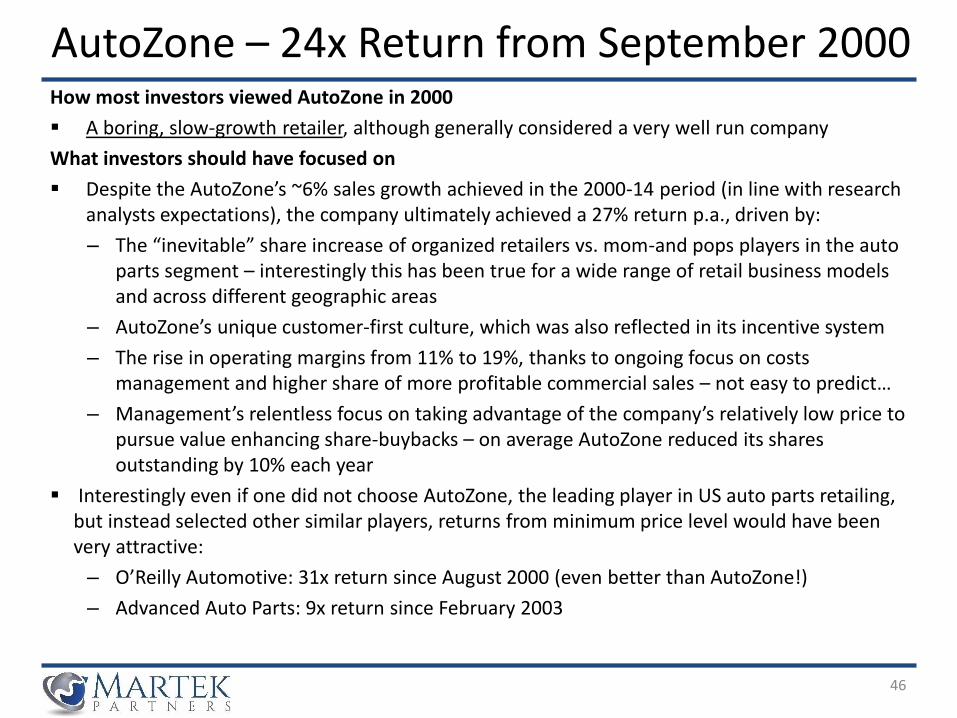
How most investors viewed AutoZone in 2000
▪ A boring, slow-growth retailer, although generally considered a very well run company
What investors should have focused on
▪ Despite the AutoZone’s ~6% sales growth achieved in the 2000-14 period (in line with research analysts expectations), the company ultimately achieved a 27% return p.a., driven by:
– The “inevitable” share increase of organized retailers vs. mom-and pops players in the auto parts segment – interestingly this has been true for a wide range of retail business models and across different geographic areas
– AutoZone’s unique customer-first culture, which was also reflected in its incentive system
– The rise in operating margins from 11% to 19%, thanks to ongoing focus on costs management and higher share of more profitable commercial sales – not easy to predict…
– Management’s relentless focus on taking advantage of the company’s relatively low price to pursue value enhancing share-buybacks – on average AutoZone reduced its shares outstanding by 10% each year
▪ Interestingly even if one did not choose AutoZone, the leading player in US auto parts retailing, but instead selected other similar players, returns from minimum price level would have been very attractive:
– O’Reilly Automotive: 31x return since August 2000 (even better than AutoZone!)
– Advanced Auto Parts: 9x return since February 2003
AutoZone – 24x Return from September 2000
47
Key Takeaways
1. There is no magic formula to find long term multi-baggers. Every case is different with multiple different factors leading to extra returns, although the quality of management remains key. Best thing is to be curious, humble and read a lot…
3. A low entry price vs. the company’s long term profit potential is critical (ultimately multi-baggers can be viewed as cheap long term options), but looking at market multiples and current profitability can sometimes be misleading. It is important to assess the degree of predictability of the long term revenue potential and profitability of the business and quality of the management
▪ This is important also in deciding whether to hold on to the stock year after year
4. Be contrarian, but know what you are buying. It is important to go against the crowd, but do your own homework to identify critical data and reach a rational decision
5. Small is beautiful, 68% of multi-baggers in the selected sample were trading below USD300m of market cap at their low point – for many established investment funds these opportunities are simply inaccessible and this is why they are overlooked (and mispriced by the market)
6. Patience is critical – “The big money is not in the buying and selling… but in the waiting” (C. Munger)
On Multibagger Stocks
2. An investment thesis should be relatively simple. Buffett did not use overly complex excel models to invest in well know companies like Coca-Cola, American Express and Wells Fargo, but he did read carefully their annual reports (>90% of investors do not)
▪ Do not use your intelligence to fool yourself into an overly complex investment
48
Key TakeawaysOn the importance of incentives and interest alignment with management and main shareholder
1. It is critical to understand the quality and the alignment of interests of management (and the main shareholder) with your interests, focusing not on what they say but on what they did in the past and their current incentives. These factors are very often completely ignored by investors
▪ For example, think about an investment fund in which you have invested personally and ask yourself if, at the time of the investment, you knew: (i) the remuneration system of the investment manager ; (ii) if the investment manager was personally invested in the fund; and (iii) if the fund performance fee was subject to the so-called "high water mark“ clause, which implies that no performance fee is paid to the manager if the fund value falls below the previous maximum level
On the concept of risk and volatility
1. Risk of permanent loss of capital is complex and not measurable with simple mathematical metrics(such as Value at Risk). Ultimately risk assessment requires judgment, experience and a lot of work/reading
2. Paying a low price is the key factor in reducing risk
3. Volatility is the friend of the rational long term investor. When stocks are very cheap (and hated) they are often also very volatile - in times of distress in fact price volatility is a useful measure of market participants’ uncertainty/fear, not the value of the underlying business. Interestingly Warren Buffett’s purchase in Washington Post in 1973 was down ~20% in the first 2 years after the initial purchase and then over the years increased by >100x
49
1. List of 100 Multi-Bagger Stocks
2. The Disruption of Fairfax Media
3. Further Reading
Appendices
50
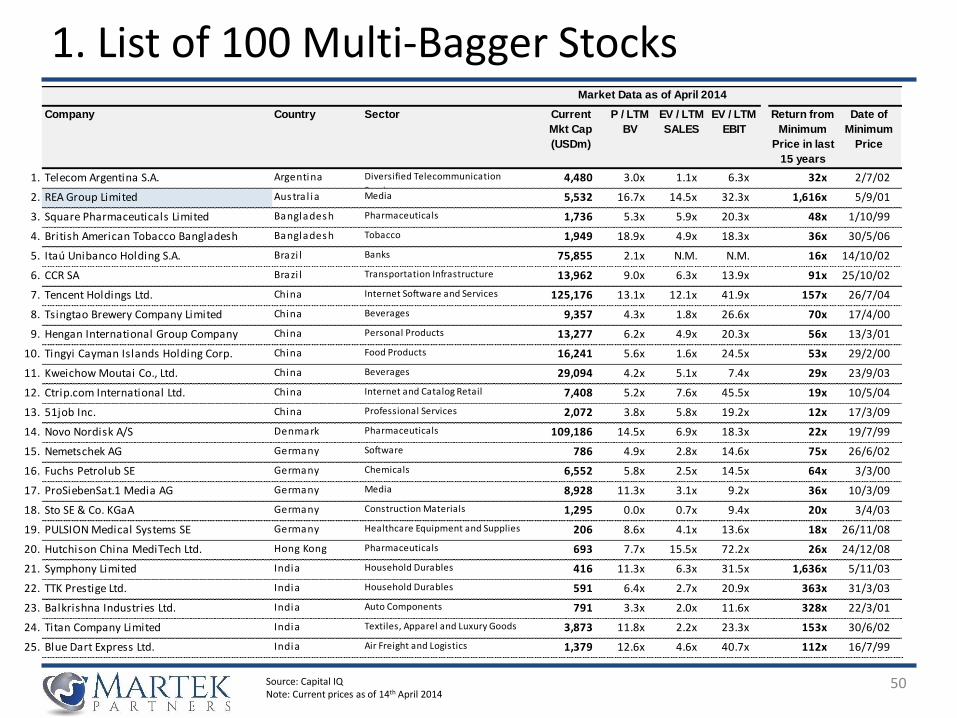
1. List of 100 Multi-Bagger Stocks
Source: Capital IQNote: Current prices as of 14th April 2014
Market Data as of April 2014 Market multiples &
Leverag at Low PointCompany Country Sector Current
Mkt Cap
(USDm)
P / LTM
BV
EV / LTM
SALES
EV / LTM
EBIT
Return from
Minimum
Price in last
15 years
Date of
Minimum
Price
1. Telecom Argentina S.A. Argentina Diversified Telecommunication
Services4,480 3.0x 1.1x 6.3x 32x 2/7/02
2. REA Group Limited Austra l ia Media 5,532 16.7x 14.5x 32.3x 1,616x 5/9/01
3. Square Pharmaceuticals Limited Bangladesh Pharmaceuticals 1,736 5.3x 5.9x 20.3x 48x 1/10/99
4. British American Tobacco Bangladesh
Company Limited
Bangladesh Tobacco 1,949 18.9x 4.9x 18.3x 36x 30/5/06
5. Itaú Unibanco Holding S.A. Brazi l Banks 75,855 2.1x N.M. N.M. 16x 14/10/02
6. CCR SA Brazi l Transportation Infrastructure 13,962 9.0x 6.3x 13.9x 91x 25/10/02
7. Tencent Holdings Ltd. China Internet Software and Services 125,176 13.1x 12.1x 41.9x 157x 26/7/04
8. Tsingtao Brewery Company Limited China Beverages 9,357 4.3x 1.8x 26.6x 70x 17/4/00
9. Hengan International Group Company
Limited
China Personal Products 13,277 6.2x 4.9x 20.3x 56x 13/3/01
10. Tingyi Cayman Islands Holding Corp. China Food Products 16,241 5.6x 1.6x 24.5x 53x 29/2/00
11. Kweichow Moutai Co., Ltd. China Beverages 29,094 4.2x 5.1x 7.4x 29x 23/9/03
12. Ctrip.com International Ltd. China Internet and Catalog Retail 7,408 5.2x 7.6x 45.5x 19x 10/5/04
13. 51job Inc. China Professional Services 2,072 3.8x 5.8x 19.2x 12x 17/3/09
14. Novo Nordisk A/S Denmark Pharmaceuticals 109,186 14.5x 6.9x 18.3x 22x 19/7/99
15. Nemetschek AG Germany Software 786 4.9x 2.8x 14.6x 75x 26/6/02
16. Fuchs Petrolub SE Germany Chemicals 6,552 5.8x 2.5x 14.5x 64x 3/3/00
17. ProSiebenSat.1 Media AG Germany Media 8,928 11.3x 3.1x 9.2x 36x 10/3/09
18. Sto SE & Co. KGaA Germany Construction Materials 1,295 0.0x 0.7x 9.4x 20x 3/4/03
19. PULSION Medical Systems SE Germany Healthcare Equipment and Supplies 206 8.6x 4.1x 13.6x 18x 26/11/08
20. Hutchison China MediTech Ltd. Hong Kong Pharmaceuticals 693 7.7x 15.5x 72.2x 26x 24/12/08
21. Symphony Limited India Household Durables 416 11.3x 6.3x 31.5x 1,636x 5/11/03
22. TTK Prestige Ltd. India Household Durables 591 6.4x 2.7x 20.9x 363x 31/3/03
23. Balkrishna Industries Ltd. India Auto Components 791 3.3x 2.0x 11.6x 328x 22/3/01
24. Titan Company Limited India Textiles, Apparel and Luxury Goods 3,873 11.8x 2.2x 23.3x 153x 30/6/02
25. Blue Dart Express Ltd. India Air Freight and Logistics 1,379 12.6x 4.6x 40.7x 112x 16/7/99
51
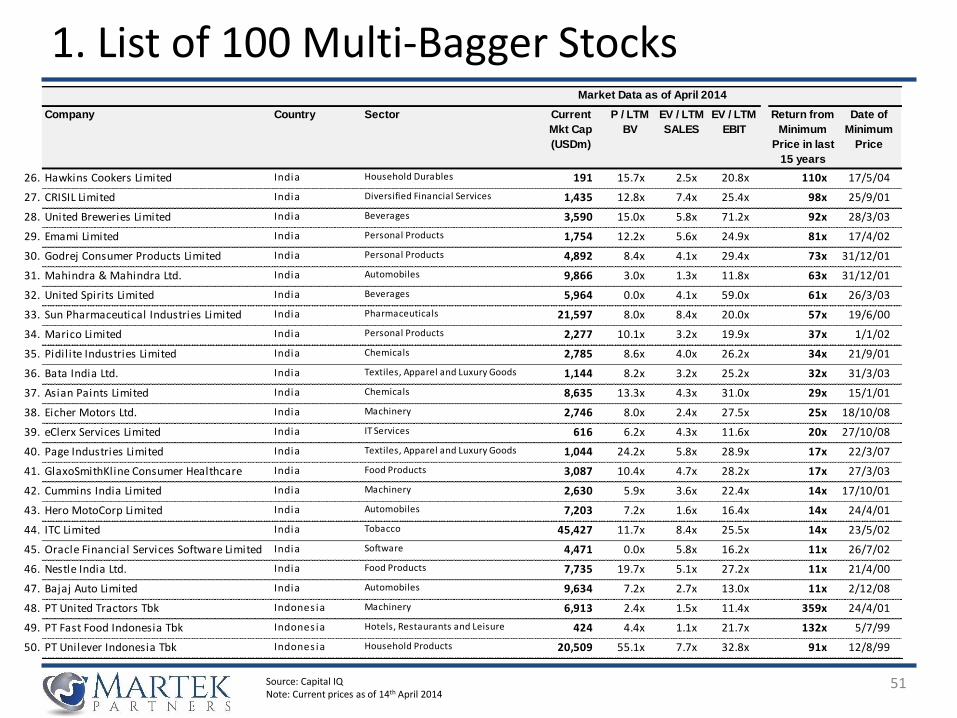
1. List of 100 Multi-Bagger Stocks
Source: Capital IQNote: Current prices as of 14th April 2014
Market Data as of April 2014 Market multiples &
Leverag at Low PointCompany Country Sector Current
Mkt Cap
(USDm)
P / LTM
BV
EV / LTM
SALES
EV / LTM
EBIT
Return from
Minimum
Price in last
15 years
Date of
Minimum
Price
26. Hawkins Cookers Limited India Household Durables 191 15.7x 2.5x 20.8x 110x 17/5/04
27. CRISIL Limited India Diversified Financial Services 1,435 12.8x 7.4x 25.4x 98x 25/9/01
28. United Breweries Limited India Beverages 3,590 15.0x 5.8x 71.2x 92x 28/3/03
29. Emami Limited India Personal Products 1,754 12.2x 5.6x 24.9x 81x 17/4/02
30. Godrej Consumer Products Limited India Personal Products 4,892 8.4x 4.1x 29.4x 73x 31/12/01
31. Mahindra & Mahindra Ltd. India Automobiles 9,866 3.0x 1.3x 11.8x 63x 31/12/01
32. United Spirits Limited India Beverages 5,964 0.0x 4.1x 59.0x 61x 26/3/03
33. Sun Pharmaceutical Industries Limited India Pharmaceuticals 21,597 8.0x 8.4x 20.0x 57x 19/6/00
34. Marico Limited India Personal Products 2,277 10.1x 3.2x 19.9x 37x 1/1/02
35. Pidilite Industries Limited India Chemicals 2,785 8.6x 4.0x 26.2x 34x 21/9/01
36. Bata India Ltd. India Textiles, Apparel and Luxury Goods 1,144 8.2x 3.2x 25.2x 32x 31/3/03
37. Asian Paints Limited India Chemicals 8,635 13.3x 4.3x 31.0x 29x 15/1/01
38. Eicher Motors Ltd. India Machinery 2,746 8.0x 2.4x 27.5x 25x 18/10/08
39. eClerx Services Limited India IT Services 616 6.2x 4.3x 11.6x 20x 27/10/08
40. Page Industries Limited India Textiles, Apparel and Luxury Goods 1,044 24.2x 5.8x 28.9x 17x 22/3/07
41. GlaxoSmithKline Consumer Healthcare
Limited
India Food Products 3,087 10.4x 4.7x 28.2x 17x 27/3/03
42. Cummins India Limited India Machinery 2,630 5.9x 3.6x 22.4x 14x 17/10/01
43. Hero MotoCorp Limited India Automobiles 7,203 7.2x 1.6x 16.4x 14x 24/4/01
44. ITC Limited India Tobacco 45,427 11.7x 8.4x 25.5x 14x 23/5/02
45. Oracle Financial Services Software Limited India Software 4,471 0.0x 5.8x 16.2x 11x 26/7/02
46. Nestle India Ltd. India Food Products 7,735 19.7x 5.1x 27.2x 11x 21/4/00
47. Bajaj Auto Limited India Automobiles 9,634 7.2x 2.7x 13.0x 11x 2/12/08
48. PT United Tractors Tbk Indones ia Machinery 6,913 2.4x 1.5x 11.4x 359x 24/4/01
49. PT Fast Food Indonesia Tbk Indones ia Hotels, Restaurants and Leisure 424 4.4x 1.1x 21.7x 132x 5/7/99
50. PT Unilever Indonesia Tbk Indones ia Household Products 20,509 55.1x 7.7x 32.8x 91x 12/8/99
52
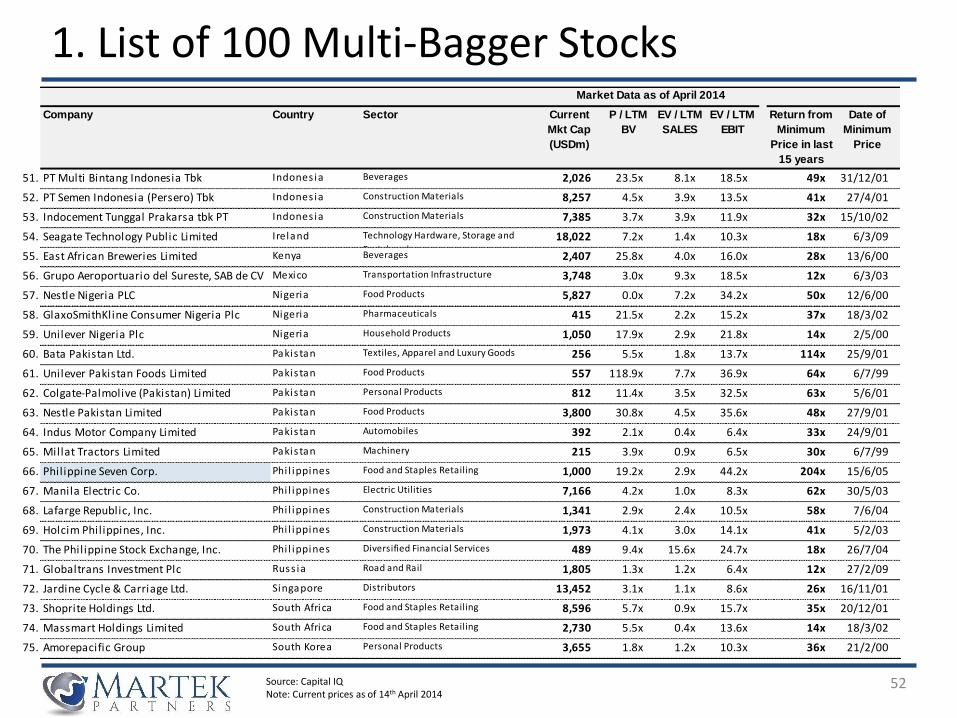
1. List of 100 Multi-Bagger Stocks
Source: Capital IQNote: Current prices as of 14th April 2014
Market Data as of April 2014 Market multiples &
Leverag at Low PointCompany Country Sector Current
Mkt Cap
(USDm)
P / LTM
BV
EV / LTM
SALES
EV / LTM
EBIT
Return from
Minimum
Price in last
15 years
Date of
Minimum
Price
51. PT Multi Bintang Indonesia Tbk Indones ia Beverages 2,026 23.5x 8.1x 18.5x 49x 31/12/01
52. PT Semen Indonesia (Persero) Tbk Indones ia Construction Materials 8,257 4.5x 3.9x 13.5x 41x 27/4/01
53. Indocement Tunggal Prakarsa tbk PT Indones ia Construction Materials 7,385 3.7x 3.9x 11.9x 32x 15/10/02
54. Seagate Technology Public Limited
Company
Ireland Technology Hardware, Storage and
Peripherals18,022 7.2x 1.4x 10.3x 18x 6/3/09
55. East African Breweries Limited Kenya Beverages 2,407 25.8x 4.0x 16.0x 28x 13/6/00
56. Grupo Aeroportuario del Sureste, SAB de CV Mexico Transportation Infrastructure 3,748 3.0x 9.3x 18.5x 12x 6/3/03
57. Nestle Nigeria PLC Nigeria Food Products 5,827 0.0x 7.2x 34.2x 50x 12/6/00
58. GlaxoSmithKline Consumer Nigeria Plc Nigeria Pharmaceuticals 415 21.5x 2.2x 15.2x 37x 18/3/02
59. Unilever Nigeria Plc Nigeria Household Products 1,050 17.9x 2.9x 21.8x 14x 2/5/00
60. Bata Pakistan Ltd. Pakis tan Textiles, Apparel and Luxury Goods 256 5.5x 1.8x 13.7x 114x 25/9/01
61. Unilever Pakistan Foods Limited Pakis tan Food Products 557 118.9x 7.7x 36.9x 64x 6/7/99
62. Colgate-Palmolive (Pakistan) Limited Pakis tan Personal Products 812 11.4x 3.5x 32.5x 63x 5/6/01
63. Nestle Pakistan Limited Pakis tan Food Products 3,800 30.8x 4.5x 35.6x 48x 27/9/01
64. Indus Motor Company Limited Pakis tan Automobiles 392 2.1x 0.4x 6.4x 33x 24/9/01
65. Millat Tractors Limited Pakis tan Machinery 215 3.9x 0.9x 6.5x 30x 6/7/99
66. Philippine Seven Corp. Phi l ippines Food and Staples Retailing 1,000 19.2x 2.9x 44.2x 204x 15/6/05
67. Manila Electric Co. Phi l ippines Electric Utilities 7,166 4.2x 1.0x 8.3x 62x 30/5/03
68. Lafarge Republic, Inc. Phi l ippines Construction Materials 1,341 2.9x 2.4x 10.5x 58x 7/6/04
69. Holcim Philippines, Inc. Phi l ippines Construction Materials 1,973 4.1x 3.0x 14.1x 41x 5/2/03
70. The Philippine Stock Exchange, Inc. Phi l ippines Diversified Financial Services 489 9.4x 15.6x 24.7x 18x 26/7/04
71. Globaltrans Investment Plc Russ ia Road and Rail 1,805 1.3x 1.2x 6.4x 12x 27/2/09
72. Jardine Cycle & Carriage Ltd. Singapore Distributors 13,452 3.1x 1.1x 8.6x 26x 16/11/01
73. Shoprite Holdings Ltd. South Africa Food and Staples Retailing 8,596 5.7x 0.9x 15.7x 35x 20/12/01
74. Massmart Holdings Limited South Africa Food and Staples Retailing 2,730 5.5x 0.4x 13.6x 14x 18/3/02
75. Amorepacific Group South Korea Personal Products 3,655 1.8x 1.2x 10.3x 36x 21/2/00
53
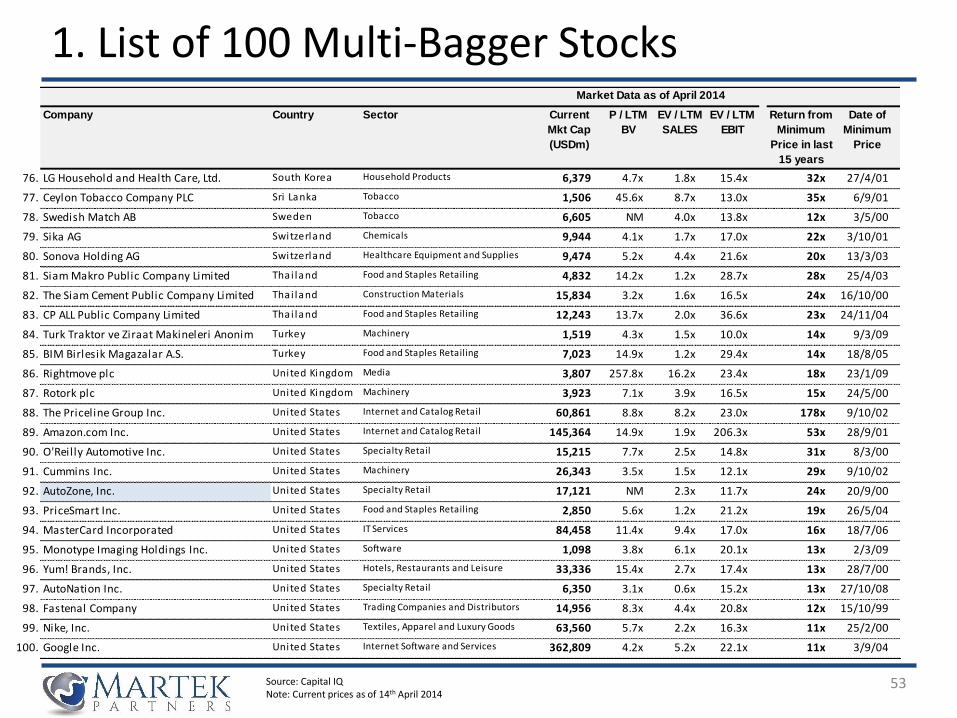
1. List of 100 Multi-Bagger Stocks
Source: Capital IQNote: Current prices as of 14th April 2014
Market Data as of April 2014 Market multiples &
Leverag at Low PointCompany Country Sector Current
Mkt Cap
(USDm)
P / LTM
BV
EV / LTM
SALES
EV / LTM
EBIT
Return from
Minimum
Price in last
15 years
Date of
Minimum
Price
76. LG Household and Health Care, Ltd. South Korea Household Products 6,379 4.7x 1.8x 15.4x 32x 27/4/01
77. Ceylon Tobacco Company PLC Sri Lanka Tobacco 1,506 45.6x 8.7x 13.0x 35x 6/9/01
78. Swedish Match AB Sweden Tobacco 6,605 NM 4.0x 13.8x 12x 3/5/00
79. Sika AG Switzerland Chemicals 9,944 4.1x 1.7x 17.0x 22x 3/10/01
80. Sonova Holding AG Switzerland Healthcare Equipment and Supplies 9,474 5.2x 4.4x 21.6x 20x 13/3/03
81. Siam Makro Public Company Limited Thai land Food and Staples Retailing 4,832 14.2x 1.2x 28.7x 28x 25/4/03
82. The Siam Cement Public Company Limited Thai land Construction Materials 15,834 3.2x 1.6x 16.5x 24x 16/10/00
83. CP ALL Public Company Limited Thai land Food and Staples Retailing 12,243 13.7x 2.0x 36.6x 23x 24/11/04
84. Turk Traktor ve Ziraat Makineleri Anonim
Sirketi
Turkey Machinery 1,519 4.3x 1.5x 10.0x 14x 9/3/09
85. BIM Birlesik Magazalar A.S. Turkey Food and Staples Retailing 7,023 14.9x 1.2x 29.4x 14x 18/8/05
86. Rightmove plc United Kingdom Media 3,807 257.8x 16.2x 23.4x 18x 23/1/09
87. Rotork plc United Kingdom Machinery 3,923 7.1x 3.9x 16.5x 15x 24/5/00
88. The Priceline Group Inc. United States Internet and Catalog Retail 60,861 8.8x 8.2x 23.0x 178x 9/10/02
89. Amazon.com Inc. United States Internet and Catalog Retail 145,364 14.9x 1.9x 206.3x 53x 28/9/01
90. O'Reilly Automotive Inc. United States Specialty Retail 15,215 7.7x 2.5x 14.8x 31x 8/3/00
91. Cummins Inc. United States Machinery 26,343 3.5x 1.5x 12.1x 29x 9/10/02
92. AutoZone, Inc. United States Specialty Retail 17,121 NM 2.3x 11.7x 24x 20/9/00
93. PriceSmart Inc. United States Food and Staples Retailing 2,850 5.6x 1.2x 21.2x 19x 26/5/04
94. MasterCard Incorporated United States IT Services 84,458 11.4x 9.4x 17.0x 16x 18/7/06
95. Monotype Imaging Holdings Inc. United States Software 1,098 3.8x 6.1x 20.1x 13x 2/3/09
96. Yum! Brands, Inc. United States Hotels, Restaurants and Leisure 33,336 15.4x 2.7x 17.4x 13x 28/7/00
97. AutoNation Inc. United States Specialty Retail 6,350 3.1x 0.6x 15.2x 13x 27/10/08
98. Fastenal Company United States Trading Companies and Distributors 14,956 8.3x 4.4x 20.8x 12x 15/10/99
99. Nike, Inc. United States Textiles, Apparel and Luxury Goods 63,560 5.7x 2.2x 16.3x 11x 25/2/00
100. Google Inc. United States Internet Software and Services 362,809 4.2x 5.2x 22.1x 11x 3/9/04
54
2. The Disruption of Fairfax Media Key Considerations
▪ The next slide shows the gradual disruption of the traditional print classified’s business model represented by Australian leading print media player, Fairfax Media, which lost ground to its Australian online competitors, represented by:
– REA Group, the leading online real estate classified player
– Seek, the leading online job recruiting classified player
– Carsales.com, the leading online car sales classified player
▪ During the 2001-13 period Fairfax Media’s share price declined by ~90%. Interestingly as the core print business experienced stagnant/declining sales and deteriorating pricing power due to the rise of the online classified business model, Fairfax Media’s management pursued significant (and often quite expensive) acquisitions, which led to:
1. A rise in the company’s leverage (net debt / EBITDA reached 3.7x in 2007), right before the 2008-09 crisis…
2. Substantial dilution for shareholders (incurred to pursue acquisitions as well as to reduce the excessive leverage) as the number of shares outstanding increased >3x from 2001 to 2013
▪ Looking at the financial performance of the 4 companies in retrospective provides also an interesting perspective on risk: in fact although on traditional valuation metrics (such as P / E) Fairfax Media appeared to be a cheaper (some would say “safer”) investment vs. fast-growing online competitors, ultimately it ended up being a risky (and loss-making) bet
– Of course these things look clearer in a rear-view mirror, but it is always important to be cautious when evaluating an investment of a traditional (and very profitable) business model under the threat of disruptive innovation
55
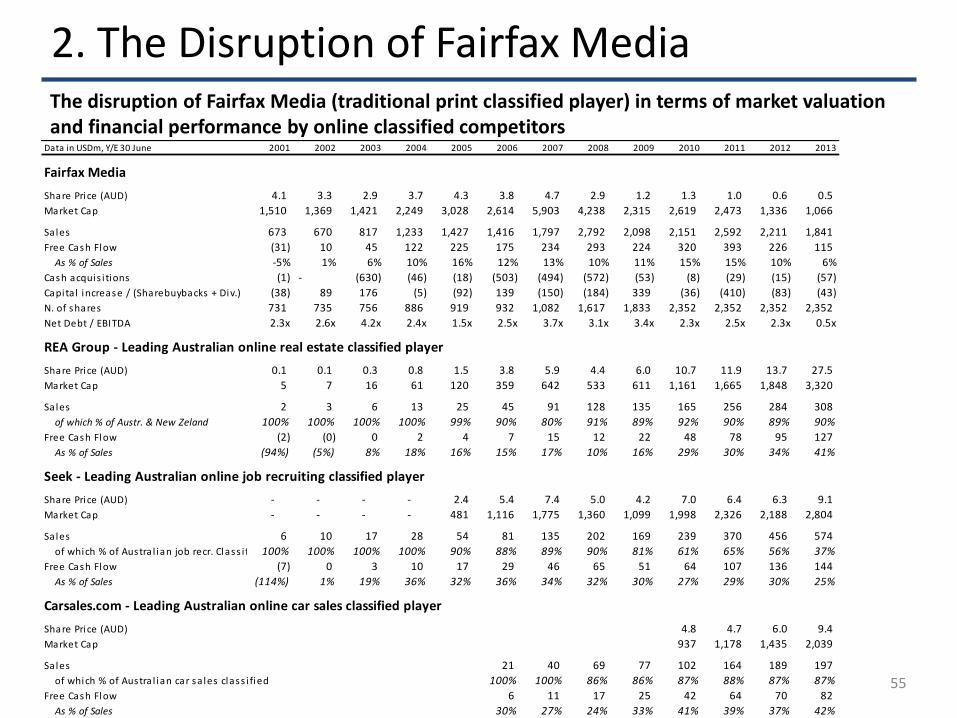
2. The Disruption of Fairfax Media The disruption of Fairfax Media (traditional print classified player) in terms of market valuation and financial performance by online classified competitors
Data in USDm, Y/E 30 June 2001 2002 2003 2004 2005 2006 2007 2008 2009 2010 2011 2012 2013
Fairfax Media
Share Price (AUD) 4.1 3.3 2.9 3.7 4.3 3.8 4.7 2.9 1.2 1.3 1.0 0.6 0.5
Market Cap 1,510 1,369 1,421 2,249 3,028 2,614 5,903 4,238 2,315 2,619 2,473 1,336 1,066
Sales 673 670 817 1,233 1,427 1,416 1,797 2,792 2,098 2,151 2,592 2,211 1,841
Free Cash Flow (31) 10 45 122 225 175 234 293 224 320 393 226 115
As % of Sales -5% 1% 6% 10% 16% 12% 13% 10% 11% 15% 15% 10% 6%
Cash acquis i tions (1) - (630) (46) (18) (503) (494) (572) (53) (8) (29) (15) (57)
Capita l increase / (Sharebuybacks + Div.) (38) 89 176 (5) (92) 139 (150) (184) 339 (36) (410) (83) (43)
N. of shares 731 735 756 886 919 932 1,082 1,617 1,833 2,352 2,352 2,352 2,352
Net Debt / EBITDA 2.3x 2.6x 4.2x 2.4x 1.5x 2.5x 3.7x 3.1x 3.4x 2.3x 2.5x 2.3x 0.5x
REA Group - Leading Australian online real estate classified player
Share Price (AUD) 0.1 0.1 0.3 0.8 1.5 3.8 5.9 4.4 6.0 10.7 11.9 13.7 27.5
Market Cap 5 7 16 61 120 359 642 533 611 1,161 1,665 1,848 3,320
Sales 2 3 6 13 25 45 91 128 135 165 256 284 308
of which % of Austr. & New Zeland 100% 100% 100% 100% 99% 90% 80% 91% 89% 92% 90% 89% 90%
Free Cash Flow (2) (0) 0 2 4 7 15 12 22 48 78 95 127
As % of Sales (94%) (5%) 8% 18% 16% 15% 17% 10% 16% 29% 30% 34% 41%
Seek - Leading Australian online job recruiting classified player
Share Price (AUD) - - - - 2.4 5.4 7.4 5.0 4.2 7.0 6.4 6.3 9.1
Market Cap - - - - 481 1,116 1,775 1,360 1,099 1,998 2,326 2,188 2,804
Sales 6 10 17 28 54 81 135 202 169 239 370 456 574
of which % of Austra l ian job recr. Class i f. 100% 100% 100% 100% 90% 88% 89% 90% 81% 61% 65% 56% 37%
Free Cash Flow (7) 0 3 10 17 29 46 65 51 64 107 136 144
As % of Sales (114%) 1% 19% 36% 32% 36% 34% 32% 30% 27% 29% 30% 25%
Carsales.com - Leading Australian online car sales classified player
Share Price (AUD) 4.8 4.7 6.0 9.4
Market Cap 937 1,178 1,435 2,039
Sales 21 40 69 77 102 164 189 197
of which % of Austra l ian car sa les class i fied 100% 100% 86% 86% 87% 88% 87% 87%
Free Cash Flow 6 11 17 25 42 64 70 82
As % of Sales 30% 27% 24% 33% 41% 39% 37% 42%
56
3. Further ReadingInteresting books on some of the topics discussed in this presentation▪ 100 to 1 in the stock market: A distinguished security analyst tells how to make more of your
investment opportunities by T. W. Phelps
▪ 100 Baggers: Stocks That Return 100-to-1 and How To Find Them by C. Mayer
▪ The Halo Effect by P. Rosenzweig
▪ The Billion Dollar Mistake by S. Weiss
▪ Billion Dollar Lessons by B. Carroll and C. Mui
▪ The Black Swan by N. Taleb
▪ Killing Fairfax: Packer, Murdoch and the Ultimate Revenge by P. Williams
▪ The Innovator's Dilemma: The Revolutionary Book That Will Change the Way You Do Business by C. M. Christensen
▪ How Asia Works: Success and Failure in the World's Most Dynamic Region by J. Studwell