A Peer-Reviewed Publication of the Qualit y Management ...
24
Articles published in The Quality Management Forum may not be reproduced without consent of the author(s). A Peer-Reviewed Publication of the Quality Management Division of the American Society for Quality The Quality Management www.asq-qm.org AS ® Inside This Issue Improvement through People, Processes, and Performance ......... 1 Chair’s Message ......... 2 How a State Government Agency Persevered to Win its Quality Award ..... 4 Enabling Enterprise Six Sigma through Business Process Architecture Modeling Techniques ...... 7 Using Design of Experiments (DoE) to Develop or Improve a Process ....... 11 Quality Management Journal Preview ......... 14 The Customer Alarm: Using SPC to Prevent a Customer Crisis ......... 16 Quality and Sustainability in Turbulent Times ........ 19 Maintaining a Successful Connection! ........... 22 business strategy. Quality managers eager to learn more can begin with the excellent references Furterer has listed. While the first two articles concentrate on the systems approach needed to foster improvement, the next two articles in this issue provide examples of specific improvements achieved through the use of statistical tools. The first of this pair of “stats” articles is a classic case study of improvement using a designed experiment. Judi Kern provides a thorough—and very readable—account of how DoE was used to optimize the parameters on a new piece of laboratory equipment. The full factorial experiment yielded results that ultimately saved her company more than $167K in direct supply costs, as well as a savings in labor costs. The paper demonstrates the type of solid results that can be achieved through planned experimentation. Dr. Helen Bush follows with an example of a novel application of an SPC chart. She describes how her company uses control charts to detect changes in customer service levels. By detecting negative shifts in key service indicators early on, the company can correct the problem before customers take their business elsewhere. Charts can be used to track a variety of metrics for each customer, including on-time deliveries, wait times in the service queue, or billing (IMPROVEMENT THROUGH PEOPLE, PROCESSES, AND PERFORMANCE, continued on page 3) I am honored to be Guest Editor of the Fall issue of the Quality Management Forum, which focuses on the 2010 QMD conference theme, “Improvement through People, Processes and Performance.” I am especially pleased to be able to share five outstanding contributions by six authors who are currently practitioners in the quality field, and who represent the government and the biomedical and health care fields, as well as university-level educators with industry backgrounds. Each was invited to present an aspect of the theme “Improvement.” The results are varied and far-reaching. We begin this issue with an article that stresses the importance of fundamentals: namely, Deming’s systematic approach to improvement, especially the first of his Fourteen Points, “Constancy of Purpose.” In this piece, Bill Bailey and Paul Burks describe how a governmental agency employed these systematic principles over the long term to grow and mature into an award- winning organization. Dr. Sandra Furterer expands on the systems theme of the Bailey and Burks article by introducing us to the relatively new methodology of Business Architecture. Business Architecture melds the fields of quality, productivity, and information technology, allowing organizations to seamlessly link their Six Sigma improvement efforts to their overall Fall 2009 Volume 35, Number 3 Improvement through People, Processes, and Performance By Mary McShane Vaughn, PhD Special Pre-Conference Edition
Transcript of A Peer-Reviewed Publication of the Qualit y Management ...
Articles published in The Quality Management Forum may not be reproduced without
consent of the author(s).
A P e e r - R e v i e w e d P u b l i c a t i o n o f t h e Q u a l i t y M a n a g e m e n t D i v i s i o n o f t h e A m e r i c a n S o c i e t y f o r Q u a l i t y
T h e Q u a l i t y M a n a g e m e n t
www.asq-qm.orgAS
®
Inside This IssueImprovement through
People, Processes,
and Performance . . . . . . . . .1
Chair’s Message . . . . . . . . .2
How a State Government
Agency Persevered to
Win its Quality Award . . . . .4
Enabling Enterprise Six
Sigma through Business
Process Architecture
Modeling Techniques . . . . . .7
Using Design of Experiments
(DoE) to Develop or
Improve a Process. . . . . . . 11
Quality Management
Journal Preview . . . . . . . . . 14
The Customer Alarm:
Using SPC to Prevent a
Customer Crisis. . . . . . . . . 16
Quality and Sustainability in
Turbulent Times . . . . . . . . 19
Maintaining a Successful
Connection! . . . . . . . . . . . 22
business strategy. Quality managers eager to learn more can begin with the excellent references Furterer has listed.
While the first two articles concentrate on the systems approach needed to foster improvement, the next two articles in this issue provide examples of specific improvements achieved through the use of statistical tools.
The first of this pair of “stats” articles is a classic case study of improvement using a designed experiment. Judi Kern provides a thorough—and very readable—account of how DoE was used to optimize the parameters on a new piece of laboratory equipment. The full factorial experiment yielded results that ultimately saved her company more than $167K in direct supply costs, as well as a savings in labor costs. The paper demonstrates the type of solid results that can be achieved through planned experimentation.
Dr. Helen Bush follows with an example of a novel application of an SPC chart. She describes how her company uses control charts to detect changes in customer service levels. By detecting negative shifts in key service indicators early on, the company can correct the problem before customers take their business elsewhere. Charts can be used to track a variety of metrics for each customer, including on-time deliveries, wait times in the service queue, or billing
(Improvement through people, processes, and performance, continued on page 3)
I am honored to be Guest Editor of the Fall issue of the Quality Management Forum, which focuses on the 2010 QMD conference theme, “Improvement through People, Processes and Performance.” I am especially pleased to be able to share five outstanding contributions by six authors who are currently practitioners in the quality field, and who represent the government and the biomedical and health care fields, as well as university-level educators with industry backgrounds. Each was invited to present an aspect of the theme “Improvement.” The results are varied and far-reaching.
We begin this issue with an article that stresses the importance of fundamentals: namely, Deming’s systematic approach to improvement, especially the first of his Fourteen Points, “Constancy of Purpose.” In this piece, Bill Bailey and Paul Burks describe how a governmental agency employed these systematic principles over the long term to grow and mature into an award-winning organization.
Dr. Sandra Furterer expands on the systems theme of the Bailey and Burks article by introducing us to the relatively new methodology of Business Architecture. Business Architecture melds the fields of quality, productivity, and information technology, allowing organizations to seamlessly link their Six Sigma improvement efforts to their overall
Fall 2009
V o l u m e 3 5 , N u m b e r 3
Improvement through People, Processes, and PerformanceBy Mary McShane Vaughn, PhD
S p e c i a l P r e - C o n f e r e n c e E d i t i o n
T H E Q U A L I T Y M A N A G E M E N T F O R U M
2
Chair’s MessageBy Jd Marhevko
Fall 2009
Having been the QMD chair for the past few months has been a tremendous learning experience! The help and support I’ve received from other quality professionals has been incredible.
Our council is currently in the midst of heavy preparations for our 2010 QMD Conference. As such, this edition will be linked to the conference theme of “Improvement through People, Processes and Performance” by highlighting several authors who speak to this theme.
Please mark your calendars for the 22nd Annual Quality Management Conference to be held on March 4–5, 2010 at the Hilton New Orleans Riverside hotel. It’s right on the famous Riverwalk in New Orleans! You can find more details at our QMD website at www.asq-qm.org
While much of the U.S. has been struggling through the current economic downturn, New Orleans has continued to work hard to recover from both the economy and Hurricane Katrina. Hopefully, the QMD can do its share by helping others to realize the beauty and opportunities that are again available in New Orleans—and enhance our professional development at the same time!
Mr. Ron Bane, one of our invaluable WOW-Masters (WOW stands for Words Of Wisdom), is our Conference Chair. Ron, along with some of our key movers and shakers such as Milt Krivokuca (VC of Marketing), Ellen Quinn (Chair of Section & Marketing Communications), Mike Ensby (Program Chair), Thane Russey (Courses Chair), Steve Bogar (Sessions Chair), Bill Hackett (Arrangements Chair), and dozens of others are working hard to put together a memorable event.
We’ve had many talented professionals submit papers, workshops, and courses for the 2010 conference, including practitioners from cross-cutting industries such as logistics, medical, retail, manufacturing, education, and the military. The conference will offer many learning opportunities related to proven approaches, valuable tools, and successful strategies for achieving “Improvement through People, Processes and Performance.”
We will have pre-conference courses from March 2nd to March 3rd. ASQ certification exams will be held after the conference, on Saturday, March 6th. The keynote speakers for the conference include:
• Lori Silverman, owner of Partners for Progress, a management consulting firm dedicated to helping organizations achieve and maintain a sustainable competitive advantage in their marketplace. Ms. Silverman is a speaker, consultant, trainer, and author who strives in her work to connect people to possibilities and to each other. She’s the author of several books, articles, and workbooks. Her latest book, Wake Me Up When the Data is Over: How Organizations Use Stories to Drive Results, debuted in the top one hundred books on Amazon and is already a best seller.
• J. D. Sicilia, Director of the Department of Defense (DoD) Lean Six Sigma Program Office. The LSS Office oversees and directs the largest deployment of LSS ever attempted. The Office also provides training and assists the DoD in establishing and growing its program while capturing the best business practices enterprise-wide. Mr. Sicilia is a retired lieutenant colonel in the U.S. Army.
• Dr. James Levett, Chief Medical Officer at Physicians’ Clinic of Iowa (PCI). He has maintained an active practice in adult cardiac, vascular, and thoracic surgery for the past 20 years and actively works in the areas of process management excellence, outcomes research, and the implementation of quality management system principles in healthcare organizations. In 2003, Dr. Levett led PCI to become ISO 9001:2000-certified, the largest medical group in the U.S. to achieve this distinction
• Joe Stough, founder and EVP of Product Strategy for Syntex Management Systems, Inc. Mr. Stough will focus on the Quality Health Safety Environment (QSHE) Risk Reduction Effort (RRE) and how to quantify and qualify various methodologies and tools that help decision makers validate what has the most impact on QHSE performance.
To help you see what our last two conferences were like, most the sessions have been converted into podcasts and are available on our website. The link to the podcasts from our 2009 QMD Conference is http://www.asq-qmd.org/2009podcasts
I truly hope that you enjoy this special edition of the Quality Management Forum and I hope to see you on the Riverwalk in New Orleans!
Please keep in touch and e-mail any comments or suggestions to me at [email protected].
T H E Q U A L I T Y M A N A G E M E N T F O R U M
3
mistakes. This is a process that readers in any industry can implement to monitor and improve customer satisfaction.
Of course, once improvements are made, companies must sustain them, especially in today’s economy. In the thought-provoking final article, Dr. Kenneth Jackson explores the linkage between the principles of quality and sustainability. He posits that the relationship between the two involves effectiveness, efficiency and durability. Jackson maps out how these quality and sustainability fields will become increasingly important as the economy for the 21st century is forged. Quality managers are uniquely positioned to lead in these efforts.
There is a fortuitous symmetry in our conference issue, since the first and last articles make extensive reference to Dr. Deming. Both Bailey and Burks and Jackson turn to Deming’s Fourteen Points when fleshing out their theses, and they find Deming’s first point is especially applicable. In fact, it is Deming’s first point that sums up the 2010 QMD Conference theme so well:
(Improvement through people, processes, and performance, continued from page 1)
“Create a constancy of purpose toward the improvement of quality and service, with a plan to become competitive and to stay in business” (Deming, 1986).
Enjoy the articles, and safe travels to the 2010 QMD Conference in New Orleans! I look forward to meeting you there.
ReferenceDeming, W.Edwards. (1986). Out of the crisis. Cambridge, MA: MIT Center for Advanced
Engineering Study
Dr. Mary McShane Vaughn is an associate professor at Southern Polytechnic State University, where she directs the MS program in Quality Assurance. She teaches graduates classes in statistics, linear regression and design of experiments. Mary earned her MS in statistics and PhD in industrial engineering from the Georgia Institute of Technology. She has worked as a quality engineer and statistician for more than 15 years in the automotive, medical device, and airline industries. She is a member of the American Statistical Association and ASEE, and a Senior Member of IIE and ASQ. Mary is an ASQ Certified Quality Engineer, Six Sigma Black Belt, and Reliability Engineer. She can be reached at [email protected]. Her mailing address is Southern Polytechnic State University, 1100 S. Marietta Parkway, Marietta, GA 30060.
Register Now and Save $49
Conference and course pricing are available at http://www.asq-qm.org for your planning. If you take advantage of the advance purchase option by October 31, 2009, you can register at $49 below the early-bird discounted prices! See the details at http://www.asq-qm.org.
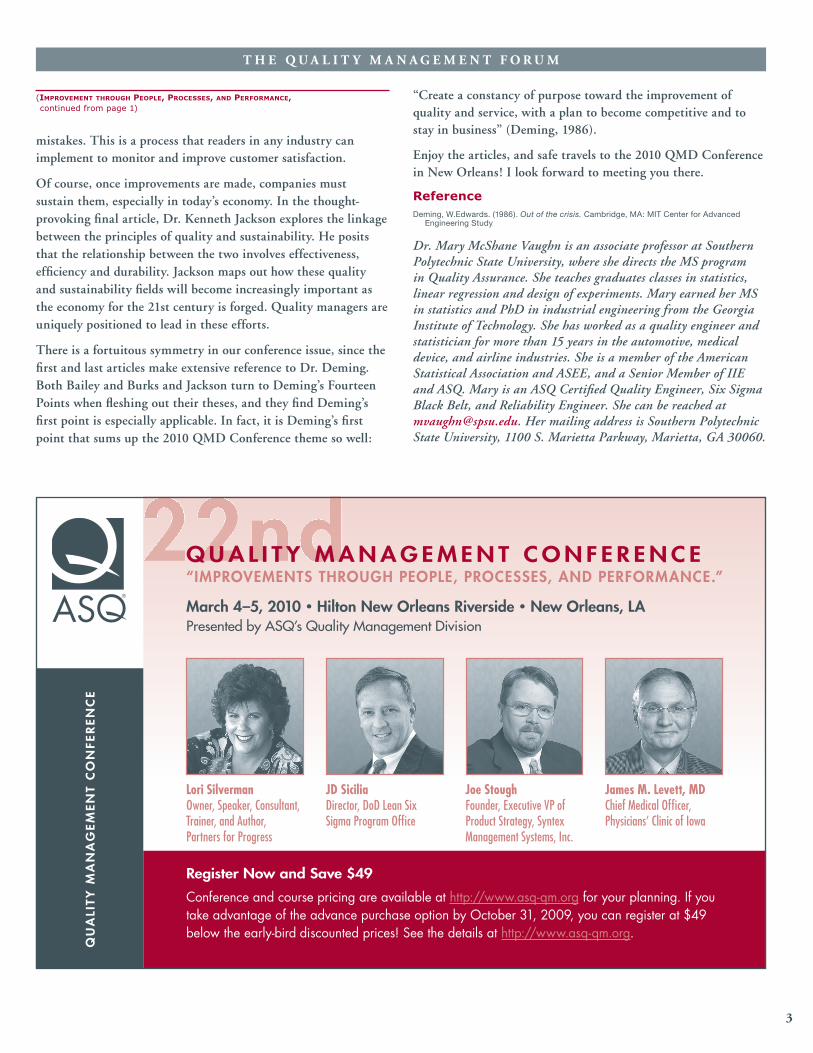
Lori SilvermanOwner, Speaker, Consultant, Trainer, and Author, Partners for Progress
JD SiciliaDirector, DoD Lean Six Sigma Program Offi ce
Joe StoughFounder, Executive VP of Product Strategy, Syntex Management Systems, Inc.
James M. Levett, MDChief Medical Offi cer, Physicians’ Clinic of Iowa
QU
ALI
TY M
AN
AG
EM
EN
T C
ON
FER
EN
CE
Q U A L I T Y M A N A G E M E N T C O N F E R E N C E“IMPROVEMENTS THROUGH PEOPLE, PROCESSES, AND PERFORMANCE.”
March 4–5, 2010 • Hilton New Orleans Riverside • New Orleans, LAPresented by ASQ’s Quality Management Division
AS®
T H E Q U A L I T Y M A N A G E M E N T F O R U M
4
When faced with the need to improve or transform, organizations have an array of tools on which they can draw. Some tools, such as the statistical methods associated with Six Sigma, can be quite daunting and require a high level of sophistication. But improvement, though never easy, does not always have to be complicated. A focus on fundamental quality principles and adherence over time can transform an organization. One tool that can be used to facilitate this transformation is the assessment of an organization against an accepted standard (Gyrna, 2007). One standard that closely approximates the Deming philosophy is the Malcolm Baldrige National Quality Award.
Conjoining the Deming Philosophy and the Baldrige Criteria
Over the last twenty years or so, we have witnessed the extension of quality philosophies from manufacturing to service industries, healthcare, education, and even government. Success in these various segments has been decidedly mixed. Yet, despite the best of intentions and initial success in improvement initiatives, many organizations lose focus and regress to previous levels of performance (Womack, 2009). Quality leaders and most top managers are by now quite familiar with Dr. Deming’s Fourteen Points (Deming, 1982). However, there seems to be less awareness that these Fourteen Points represent a systematic approach to management. Too often, managers pick and choose the points they find most appealing or convenient. For example, some Deming points, such as the elimination of mass inspection and continuous improvement, are widely implemented. But it is illogical to think that we can adopt only parts of the system and still realize the benefits of the entire system (Blazey, 2007).
Constancy of purpose, the first of Deming’s Fourteen Points, is probably the most ignored. Constancy of purpose seems so simple. But how can we have constancy of purpose when we have frequent leadership changes (Walton, 1986); or when leaders are too impatient, driven by short term goals and a desire to make their mark quickly, to begin a course of action and see it through? Even today managers often drift (or leap) from fad to fad or crisis to crisis, in search of quick fixes and magic bullets. Constancy of purpose is the exception rather than the rule. But constancy of purpose, when it is grounded in solid quality principles, can lead to sustainable performance over the long term.
Another important element of the Deming philosophy is making decisions based on data (Walton, 1996). Government agencies are often awash in data for reporting purposes. But data and analysis for the purpose of improving operations may be harder to find. More specifically, the Baldrige criteria require measures that are aligned with the organization’s mission and strategy (Blazey, 2007).
The idea of employee involvement for purposes of improvement is broadly accepted and is supported by several of Deming’s Fourteen Points. Deming advocated putting everyone to work to accomplish the organizational transformation (Scherkenbach, 1992). The Baldrige criteria devote an entire category to workforce engagement and workforce environment (Blazey, 2007). The involvement of the workforce is implicit in many of the other categories as well. But employee involvement may be a special challenge in government, where employees often spend their entire careers, and which historically has a rigid hierarchical structure. Such a structure has not been conducive to leveraging employees’ ideas and involving them in the improvement process.
Case in Point: GEFA
Evidence of the successful application of these principles can be found in the case of the Georgia Environmental Facilities Authority (GEFA). A concerted effort over time, the effective use of organizational data for decision making, and the involvement and engagement of employees transformed the culture and greatly enhanced the performance of this organization.
Constancy of Purpose
GEFA is a small state government agency. Its original purpose was to provide funding for local municipalities to build or upgrade water and sewage systems. In 1993 this organization had one program, eight employees, and a new manager. In 1994, the agency was given responsibility for the Division of Energy Resources, which among other tasks managed the state program to weatherize homes of low-income residents. The following year, the Fuel Storage Tank Division was added. This division is responsible for upgrading, replacing, or removing all of state-owned fuel tanks. In 1997, the governor suggested that state agencies consider participating in the newly-formed state quality award process, based on the Malcolm Baldrige National Quality Award criteria—the Georgia Oglethorpe Award. GEFA decided to apply, and in doing so the agency embarked on a nine year journey that changed the entire organization.
How a State Government Agency Persevered to Win its Quality AwardBy Bill D. Bailey and Paul Burks

T H E Q U A L I T Y M A N A G E M E N T F O R U M
5
organization became a 2004 Progress Award winner, the second highest level of recognition. Inspired by this success, the agency spent another year focusing on improvement and gathering results before applying again. By this time, they had several years of valuable trend data. They had defined their processes, and they also had several years of systematic process improvement. The 2005 application proved easier to write, and GEFA was awarded the Georgia Oglethorpe Award in 2006, after applying six times in eight years.
Results
By now GEFA was not the same agency as when the journey started. Staff headcount had doubled from the start of the process, not because they had become a bloated state bureaucracy, but because through the use of the Georgia Oglethorpe Award process they had become more customer-focused and effective. State policy-makers continued to give GEFA responsibility for new programs. Veteran employees who did not want to change or improve left. New employees were empowered to excel, and veteran employees, enjoying new ways of operating, did their best work. The best senior managers were those who embraced the Oglethorpe process. And the organization prospered—through the administrations of three different governors with differing philosophies and from different political parties.
GEFA became an employer of choice for state government employees. While the organization’s productivity had improved, employee satisfaction had risen as well; internal promotions and retention measures continued to trend upward. Employee satisfaction improved over an eight-year period on 32 of 38 measures. Ninety-six percent of GEFA employees believed that their supervisor cared about them as a person. The turnover rate was never more than 10%, although half of the employees were dissatisfied with their pay—a standard complaint from government employees. The external customers were happy, too: GEFA achieved satisfaction rates of 85% or better in a variety of factors such as staff professionalism, availability, timeliness, flexibility, and knowledge. Ninety-three percent of customers indicated they were satisfied or very satisfied with the overall performance of the organization. The changes from 1993 were impressive (see Table 1).
Table 1: Comparison of GEFA Results, 1993/2006
1993 2006
$260 million in loans $1.9 billion in loans
260 projects over 1000 projects
20% market share 50% market share
8 staff members 40+ staff members
(how a state government agency persevered to wIn Its QualIty award, continued on page 6)
Need for Data
In 1998, GEFA completed the 55-page application form for the Georgia Oglethorpe Award. In state government circles, GEFA was considered a well-run agency. At this point, GEFA had already developed a legitimate strategic planning process and had used it to set goals and objectives. However, the agency had collected little data. They knew who their basic customers were, but they had only anecdotal information about their satisfaction levels. The agency had not developed a leadership strategy or a team approach to deploying its values. Agency processes were informal and lacked any significant documentation to show systematic approaches so crucial to the Oglethorpe Award process. No continuous improvement methodology had been implemented, and there were only a few results measures to present.
Instead of winning the award in 1998, GEFA received a feedback report that was not at all favorable. After some initial resistance to the substance of the report, the agency went to work addressing the opportunities for improvement. Progress was glacial, and the results from their 1999 application were only marginally better than the year before. Encouraged by recognition for the agency's efforts from the Georgia Oglethorpe Award process and from the governor, improvement efforts continued. Some employees who were most resistant to the process left the agency and were replaced by staff who were more involved and supportive. Through the process of writing the application, management began to get a deeper understanding of the organization. Incremental improvements continued through 2001.
Involve Employees
After receiving the results of the 2000 assessment, management decided that although the organization was moving forward, it was not progressing enough with regard to the Baldrige criteria. In 2001, GEFA’s management team rethought its processes—or lack thereof—and reengineered the agency. During this effort, they developed what would become a key ingredient in their success. They created seven Continuous Improvement Teams (CITs), one for each functional area, whether focused externally or internally, including administrative staff. Now employees met on a regularly scheduled basis to discuss progress on their strategic goals and to update and change their plans as needed. They were given autonomy. Self-management and open, honest communication were encouraged. Often the best ideas and suggestions came from those doing the work. Now the agency had a way to mine those ideas. The CITs were moderated by the Human Resources Director. Using this approach, good discussions could be encouraged and staff members were not muffled by an intimidating boss.
After putting the CIT process into place, the agency began to move forward more quickly. They decided to skip the 2002 application cycle to maintain focus on their improvement processes and to have time to establish three years of data for their results measures. In 2003, the agency submitted its fifth application for the Georgia Oglethorpe Award. This time they met with some success. Based on GEFA’s 2003 application, the

T H E Q U A L I T Y M A N A G E M E N T F O R U M
6
In the five years leading up to the award, funding of infrastructure loans increased in size and in number. Meanwhile, funding from bond sales decreased and funding from repayments increased; this moved the agency toward self-funding for its loan programs. Loan processing times were reduced from 75 days to 18 days. The average cost of environmental clean up at fuel tank sites was below state and national averages.
Epilogue
Since winning the Georgia Oglethorpe Award in 2006, GEFA has continued to grow. Twelve additional government programs have been assigned to the agency since it won the award (GEFA, 2009a). The agency has been given responsibility for the state’s water resources division, and now consists of four divisions with 45 employees (GEFA, 2009b). Driven by the Oglethorpe Award process, GEFA has maintained a focus on value, customers, strategic planning, continuous improvement, and of course results. This focus has continued in spite of a management change after winning the award. Dedication to this approach over time, constancy of purpose, has helped to make performance improvements sustainable.
W. Edwards Deming suggested that his ideas could be applied to most types of organizations beyond the manufacturing contributions for which he is so well known (Deming, 1982). He advocated that the public sector should search out and use appropriate techniques from the private sector. Deming also argued for the need to balance short-term demand with long-term needs (Deming, 1982). We often think of five years as the long term. But sustainable improvement does not come easily, and often it does not come quickly. It took GEFA eight years to win its award, but it was worth it—for GEFA, and for the taxpayers of Georgia.
ReferencesBlazey, M. L (2007). Insights to performance excellence 2007: An inside look at the 2007
Baldrige Award Criteria. Milwaukee, WI: Quality Press.
Deming, W. E. (1982). Out of the crisis. Cambrige, MA: M.I.T. Center for Advanced Educational Services.
GEFA. (2009a). GEFA news quarterly. Atlanta: Georgia Environmental Facilities Authority.
GEFA. (2009b). Georgia environmental facilities authority. Retrieved February 24, 2009, from www.GEFA.org
Gyrna, F. M., et al. (2007). Juran's quality planning & analysis for enterprise quality (5th ed.). New York: McGraw-Hill.
Scherkenbach, W. W. (1992). The Deming route to quality and productivity. Milwaukee, WI: Quality Press.
Walton, M. (1986). The Deming management method. New York: Putnam Publishing Group.
Womack, J. (2009). Constancy of purpose. Retrieved February 24, 2009, from www.lean.org
Bill D. Bailey is an educator and consultant who is currently a PhD candidate in technology management (quality systems specialization) at Indiana State University. He earned his MS in industrial technology at North Carolina A&T State University, and undergraduate degrees in psychology and English from the University of North Carolina at Greensboro. Bill’s research interests include the improvement of organizational performance
through quality initiatives such as the Baldrige criteria, Six Sigma and Lean, and the application of these initiatives in manufacturing, education, service and healthcare. He is a member of the American Society for Quality, the Association of Technology, Management, and Applied Engineering, and a Senior Member of the Society of Manufacturing Engineers. Bill can be reached at [email protected]. His mailing address is 1599 McLendon Ave. NE, Atlanta GA 30307.
Paul Burks is a graduate of the University of Virginia and served in the U.S. Air Force. He worked over 30 years in state government before retiring as the executive director of the Georgia Environmental Facilities Authority (GEFA). Paul received several state government service awards, including the State Government Service Award from the Georgia Municipal Association, and the Excellence in Public Service Award presented by the Carl Vinson Institute of the University of Georgia.. Since his retirement, Paul has formed Paul Burks LLC, a consulting firm providing management consulting services to government agencies, non-profits, and private business. In 2007, he was selected as a member of the Georgia Oglethorpe Award Process Board of Examiners. Paul can be reached at [email protected]. His mailing address is 1143 St. Charles Pl. NE, Atlanta GA 30306-4522.
(how a state government agency persevered to wIn Its QualIty award, continued from page 5)
T H E Q U A L I T Y M A N A G E M E N T F O R U M
7
alignment between the business strategies and goals and the organization’s improvement plans.
I will first describe the concepts that helped to evolve the Business Architecture methods and tools. I will then discuss the activities that can be used to integrate Business Architecture methods and models to gain alignment among an enterprise’s Six Sigma improvement efforts, key processes, and the business’s strategic goals.
Underlying Concepts of Business Architecture
Business Architecture modeling techniques incorporate the concepts of quality management, business process management, and information systems analysis.
Quality management encompasses the evolution from Statistical Process Control (SPC), Total Quality Management (TQM), Business Process Reengineering (BPR), and Six Sigma bodies of knowledge. Business Process Management (BPM) encompasses documenting, understanding, managing and controlling key processes in the business enterprise. The goal of BPM is to improve products and services through a structured approach to performance improvement that centers on systematic design and management of a company’s business processes (Chang, 2006). Business processes and workflow are more easily automated through off-the-shelf Business Process Management Systems (BPMS). These systems evolved through stages from material requirements planning and material resource planning applications through enterprise resource
identified from a bottom-up approach, not one that is top-down and aligned with the enterprise goals and strategic plans. In some organizations, people who want to get certified as a Green or Black Belt will often choose a project themselves based on a perceived need for process improvement. Although such projects often achieve improvement and financial savings, there is no direct visibility or traceability to the organization’s strategic goals.
Business Architecture is a relatively recent body of knowledge that comes out of the information systems realm (Bieberstein, Laird, Jones and Mitra, 2008). Business Architecture can provide an enterprise-wide understanding of the business. A key objective of Business Architecture is to connect the business strategies to planned change initiatives, especially those initiatives that provide information technology automation of business processes. In many organizations, the Business Architecture is documented and developed by the IT organization as a way to understand the business processes. Understanding the business processes enables the extraction of key business elements that support capabilities required to meet customers’ needs. Extracting these business capabilities from the business processes enables the ability to trace the IT capabilities to the business processes that they support. Demonstrating the alignment between IT initiatives and the business strategies helps to ensure that resources of people, time, and money are applied appropriately.
Business Architecture modeling techniques and methods can also be used to provide prioritized alignment with the Six Sigma program goals and the enterprise’s Six Sigma projects and improvement initiative. The Business Architecture models can demonstrate
Introduction
Six Sigma is both a quality management philosophy and a methodology that focuses on reducing variation, measuring defects, and improving the quality of products, processes and services.
There are several critical factors in a successful Six Sigma program:
• Basing the Six Sigma project selection on key business priorities (Furterer, 2008)
• Focusing on key business areas (Furterer, 2008)
• Aligning the program with strategic initiatives and prioritizing the projects based on business strategy (Furterer, 2008)
• Defining a vision of what the organization will look like after implementing Lean Six Sigma and embracing the change (Sureshchandar, Chandrasekharan, and Anantharaman, 2001)
• Receiving top management support, including management’s setting of goals and providing leadership and direction (Hoffman and Mehra, 1999)
• Developing strategy that is complementary and integrated with existing policies and strategies (Dale, 1994)
• Establishing clear links between strategic goals and the change strategies (Newman, 1994)
These critical success factors point to the need to align an organization’s Six Sigma program with the organization’s strategic plan and to the key business processes that enable the enterprise to meet customers’ needs and expectations. These factors also include the need to understand the Six Sigma program’s vision. Oftentimes an organization’s Six Sigma projects are
Enabling Enterprise Six Sigma through Business Process Architecture Modeling TechniquesBy Sandy Furterer, PhD
(enablIng enterprIse sIx sIgma through busIness process archItecture modelIng technIQues,
continued on page 8)

T H E Q U A L I T Y M A N A G E M E N T F O R U M
8
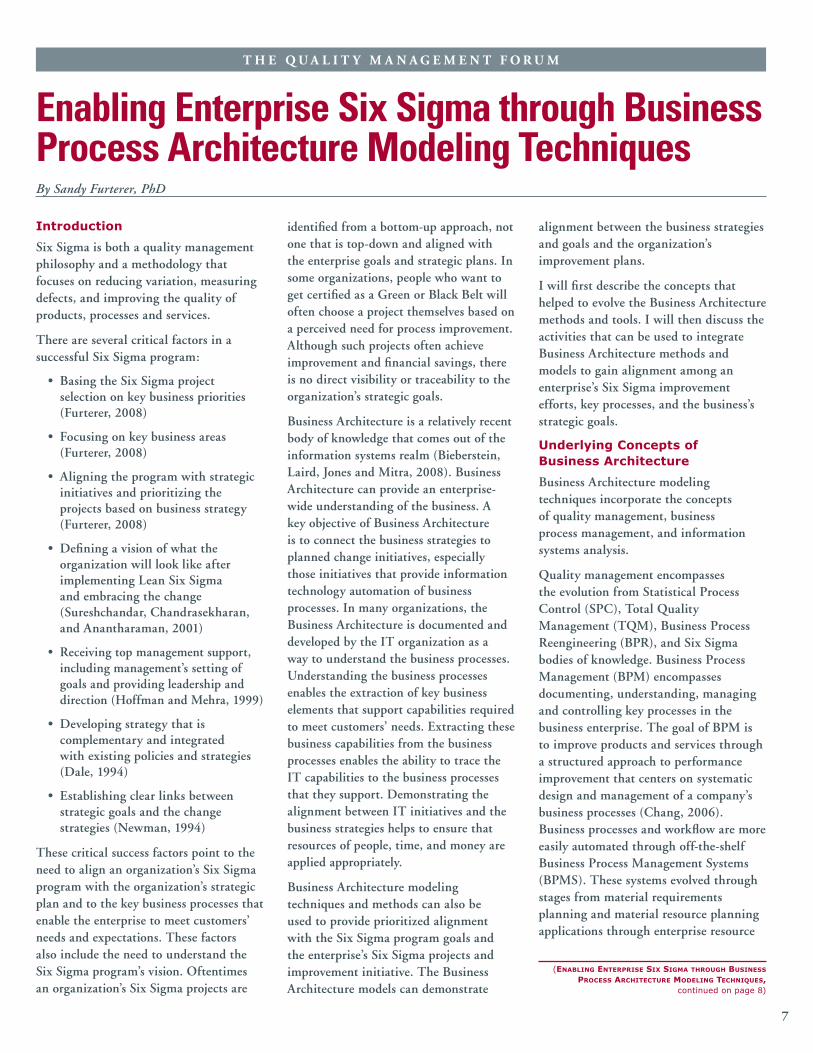
planning and customer resource management, as well as supply chain systems. Lean concepts evolved from the Ford and Toyota production systems. Business Architecture has components of many of these concepts, providing for the synthesis of business processes and information systems methodologies. Figure 1 shows the interrelationships among these concepts.
BPM and BPMS both support Six Sigma process improvement through documentation of processes and automated collection of process metrics. An enterprise can use Business Architecture principles and methods as the foundation for identifying the processes that need to be improved
the needs of our customers and to understand the business capabilities that provide business functionality to meet these needs. Business Architecture helps us to define the optimized business components that support the business functionality and the factors that contribute to variability in the business processes (Rosen, 2008).
Business Architecture provides models that describe the business entities (business processes and relevant business information), their relationships, their dynamics, and the rules that govern their interaction to achieve enterprise-wide objectives.
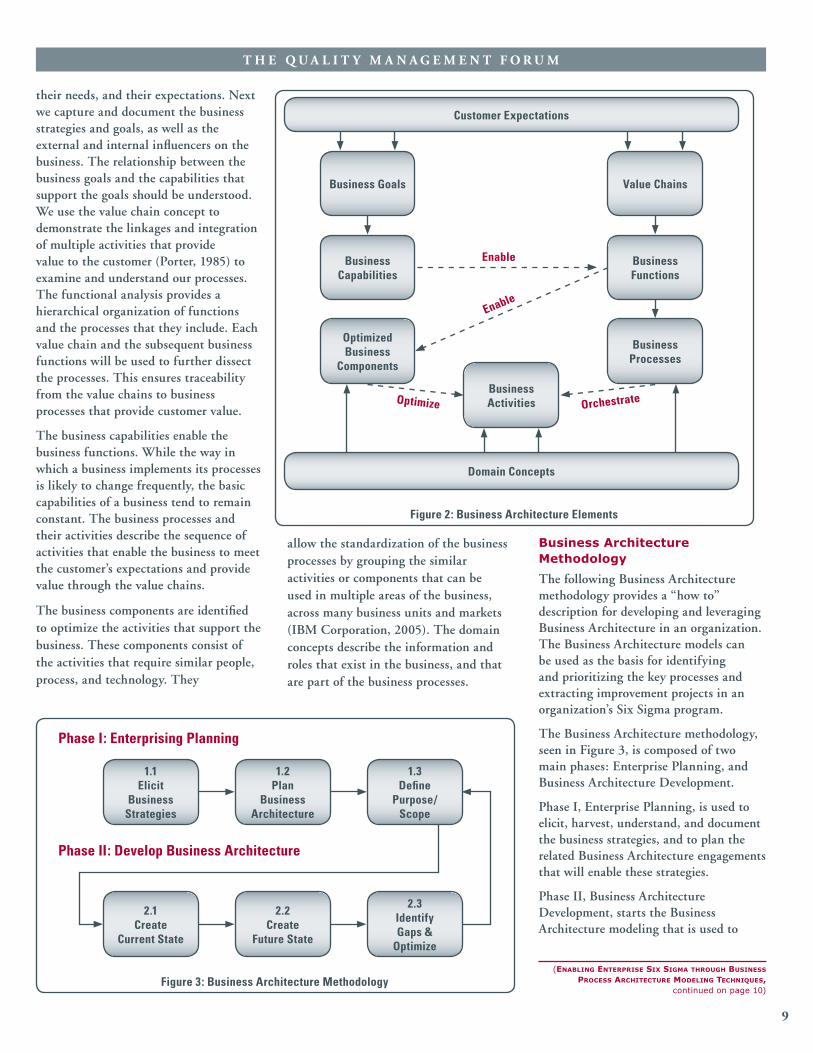
Business Architecture Elements
The elements of Business Architecture describe the business enterprise, shown in Figure 2. Business Architecture first includes understanding the customers,
to enable the business strategies. Business Architecture provides the documentation of the business processes and the identification of the optimized business processes and components that can be used across multiple business units, markets, and processes. It also enables standardization of processes and alignment of process improvement initiatives with the key processes that enable the business’s strategic plan.
Business Architecture is helping to provide a context and prioritization of business strategies that can help to focus Six Sigma improvement efforts.
Business Architecture
Business Architecture helps us to understand the business processes and the three- to five-year strategies of the business. It helps us to understand the business processes that enable meeting
Quality:
Productivity:
Information Technology:
Business Architecture
Lean Six Sigma
Business Process
Management
MRP, MRP II
Supply Chain
ERP CRMBusiness Process
Management
Lean Six Sigma Supply Chain
Business Process
Reengineering
Total Quality Management
Statistical Quality Control
Toyota Production
System
Just In Time
Ford Production System
Six Sigma
Lean
Figure 1: Evolutionary Concepts of Business Architecture Modeling
(enablIng enterprIse sIx sIgma through busIness process archItecture modelIng technIQues, continued from page 7)
T H E Q U A L I T Y M A N A G E M E N T F O R U M
9
Business Architecture Methodology
The following Business Architecture methodology provides a “how to” description for developing and leveraging Business Architecture in an organization. The Business Architecture models can be used as the basis for identifying and prioritizing the key processes and extracting improvement projects in an organization’s Six Sigma program.
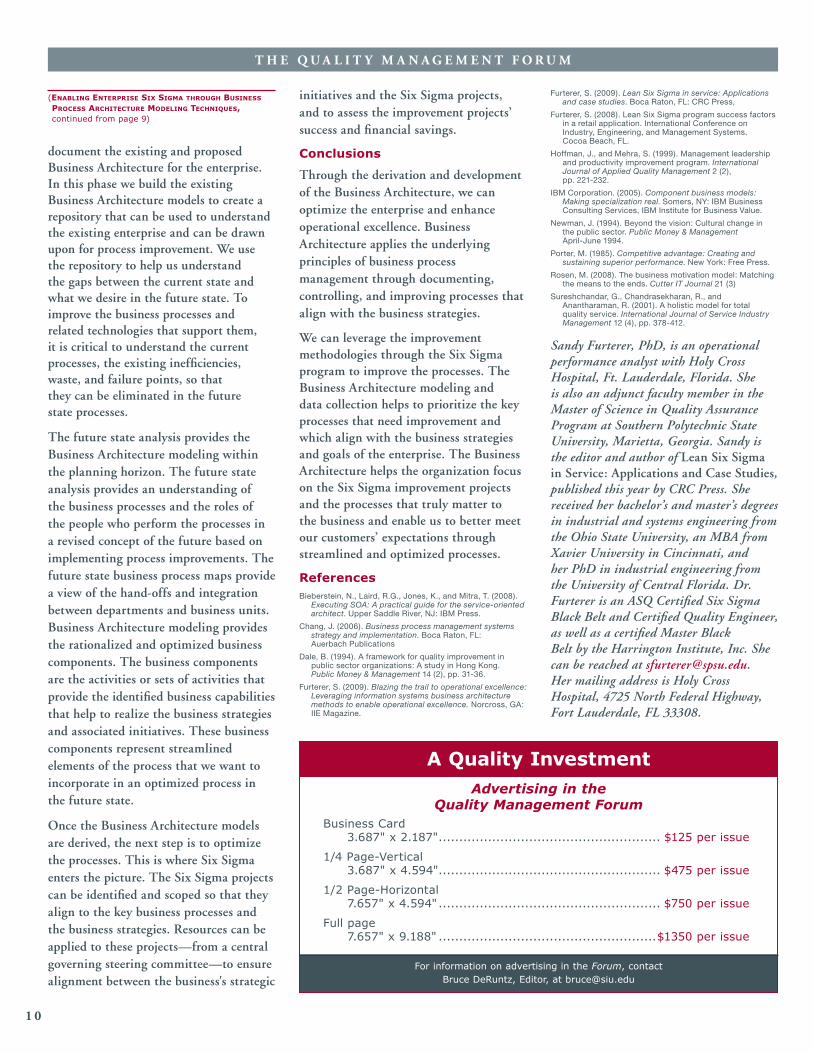
The Business Architecture methodology, seen in Figure 3, is composed of two main phases: Enterprise Planning, and Business Architecture Development.
Phase I, Enterprise Planning, is used to elicit, harvest, understand, and document the business strategies, and to plan the related Business Architecture engagements that will enable these strategies.
Phase II, Business Architecture Development, starts the Business Architecture modeling that is used to
allow the standardization of the business processes by grouping the similar activities or components that can be used in multiple areas of the business, across many business units and markets (IBM Corporation, 2005). The domain concepts describe the information and roles that exist in the business, and that are part of the business processes.
their needs, and their expectations. Next we capture and document the business strategies and goals, as well as the external and internal influencers on the business. The relationship between the business goals and the capabilities that support the goals should be understood. We use the value chain concept to demonstrate the linkages and integration of multiple activities that provide value to the customer (Porter, 1985) to examine and understand our processes. The functional analysis provides a hierarchical organization of functions and the processes that they include. Each value chain and the subsequent business functions will be used to further dissect the processes. This ensures traceability from the value chains to business processes that provide customer value.
The business capabilities enable the business functions. While the way in which a business implements its processes is likely to change frequently, the basic capabilities of a business tend to remain constant. The business processes and their activities describe the sequence of activities that enable the business to meet the customer’s expectations and provide value through the value chains.
The business components are identified to optimize the activities that support the business. These components consist of the activities that require similar people, process, and technology. They
Enable
Enable
Optimize Orchestrate
Customer Expectations
Business Goals
Business Capabilities
Optimized Business
Components
Value Chains
Business Functions
Domain Concepts
Business Activities
Business Processes
Figure 2: Business Architecture Elements
Phase I: Enterprising Planning
Phase II: Develop Business Architecture
1.1 Elicit
Business Strategies
1.2 Plan
Business Architecture
1.3 Define
Purpose/ Scope
2.1 Create
Current State
2.2 Create
Future State
2.3 Identify Gaps &
Optimize
Figure 3: Business Architecture Methodology(enablIng enterprIse sIx sIgma through busIness
process archItecture modelIng technIQues, continued on page 10)
T H E Q U A L I T Y M A N A G E M E N T F O R U M
1 0
initiatives and the Six Sigma projects, and to assess the improvement projects’ success and financial savings.
Conclusions
Through the derivation and development of the Business Architecture, we can optimize the enterprise and enhance operational excellence. Business Architecture applies the underlying principles of business process management through documenting, controlling, and improving processes that align with the business strategies.
We can leverage the improvement methodologies through the Six Sigma program to improve the processes. The Business Architecture modeling and data collection helps to prioritize the key processes that need improvement and which align with the business strategies and goals of the enterprise. The Business Architecture helps the organization focus on the Six Sigma improvement projects and the processes that truly matter to the business and enable us to better meet our customers’ expectations through streamlined and optimized processes.
ReferencesBieberstein, N., Laird, R.G., Jones, K., and Mitra, T. (2008).
Executing SOA: A practical guide for the service-oriented architect. Upper Saddle River, NJ: IBM Press.
Chang, J. (2006). Business process management systems strategy and implementation. Boca Raton, FL: Auerbach Publications
Dale, B. (1994). A framework for quality improvement in public sector organizations: A study in Hong Kong. Public Money & Management 14 (2), pp. 31-36.
Furterer, S. (2009). Blazing the trail to operational excellence: Leveraging information systems business architecture methods to enable operational excellence. Norcross, GA: IIE Magazine.
document the existing and proposed Business Architecture for the enterprise. In this phase we build the existing Business Architecture models to create a repository that can be used to understand the existing enterprise and can be drawn upon for process improvement. We use the repository to help us understand the gaps between the current state and what we desire in the future state. To improve the business processes and related technologies that support them, it is critical to understand the current processes, the existing inefficiencies, waste, and failure points, so that they can be eliminated in the future state processes.
The future state analysis provides the Business Architecture modeling within the planning horizon. The future state analysis provides an understanding of the business processes and the roles of the people who perform the processes in a revised concept of the future based on implementing process improvements. The future state business process maps provide a view of the hand-offs and integration between departments and business units. Business Architecture modeling provides the rationalized and optimized business components. The business components are the activities or sets of activities that provide the identified business capabilities that help to realize the business strategies and associated initiatives. These business components represent streamlined elements of the process that we want to incorporate in an optimized process in the future state.
Once the Business Architecture models are derived, the next step is to optimize the processes. This is where Six Sigma enters the picture. The Six Sigma projects can be identified and scoped so that they align to the key business processes and the business strategies. Resources can be applied to these projects—from a central governing steering committee—to ensure alignment between the business's strategic
Furterer, S. (2009). Lean Six Sigma in service: Applications and case studies. Boca Raton, FL: CRC Press,
Furterer, S. (2008). Lean Six Sigma program success factors in a retail application. International Conference on Industry, Engineering, and Management Systems. Cocoa Beach, FL.
Hoffman, J., and Mehra, S. (1999). Management leadership and productivity improvement program. International Journal of Applied Quality Management 2 (2), pp. 221-232.
IBM Corporation. (2005). Component business models: Making specialization real. Somers, NY: IBM Business Consulting Services, IBM Institute for Business Value.
Newman, J. (1994). Beyond the vision: Cultural change in the public sector. Public Money & Management April-June 1994.
Porter, M. (1985). Competitive advantage: Creating and sustaining superior performance. New York: Free Press.
Rosen, M. (2008). The business motivation model: Matching the means to the ends. Cutter IT Journal 21 (3)
Sureshchandar, G., Chandrasekharan, R., and Anantharaman, R. (2001). A holistic model for total quality service. International Journal of Service Industry Management 12 (4), pp. 378-412.
Sandy Furterer, PhD, is an operational performance analyst with Holy Cross Hospital, Ft. Lauderdale, Florida. She is also an adjunct faculty member in the Master of Science in Quality Assurance Program at Southern Polytechnic State University, Marietta, Georgia. Sandy is the editor and author of Lean Six Sigma in Service: Applications and Case Studies, published this year by CRC Press. She received her bachelor’s and master’s degrees in industrial and systems engineering from the Ohio State University, an MBA from Xavier University in Cincinnati, and her PhD in industrial engineering from the University of Central Florida. Dr. Furterer is an ASQ Certified Six Sigma Black Belt and Certified Quality Engineer, as well as a certified Master Black Belt by the Harrington Institute, Inc. She can be reached at [email protected]. Her mailing address is Holy Cross Hospital, 4725 North Federal Highway, Fort Lauderdale, FL 33308.
For information on advertising in the Forum, contactBruce DeRuntz, Editor, at [email protected]
A Quality InvestmentAdvertising in the
Quality Management ForumBusiness Card 3.687" x 2.187" ...................................................... $125 per issue
1/4 Page-Vertical 3.687" x 4.594" ...................................................... $475 per issue
1/2 Page-Horizontal 7.657" x 4.594" ...................................................... $750 per issue
Full page 7.657" x 9.188" .....................................................$1350 per issue
(enablIng enterprIse sIx sIgma through busIness process archItecture modelIng technIQues, continued from page 9)

T H E Q U A L I T Y M A N A G E M E N T F O R U M
1 1
Table 1: Guidelines of Experimental Design
Guidelines of Experimental Design
1. Objectives
2. Response variables
3. Control variables
4. Factors held constant
5. Nuisance factors
6. Restrictions on experiment
7. Need for pilot runs
8. Experimental procedure
9. Definition of statistical analysis tools
Our study objective was to achieve complete removal of protein deposits and residue from all product contact surfaces. The results of this experiment will determine the preliminary parameters to use not only during the Factory Acceptance Testing (FAT), but also those to use during cycle development studies performed on the machine. The response variable is defined as what we could measure and analyze (i.e., time, yield). The response variable selected for this experiment is the amount of residual protein remaining on a coupon surface following a simulated cleaning cycle. Protein removal is a measure of cleaning efficacy; ideally, there should be no detectable protein residue remaining after the cleaning process. We measured the protein level using a refractometer. Gauge precision must be determined in the planning stages in order to mitigate the effects of any measurement error. Control variables are those factors that we wanted to test (each at two levels—low and high). The three factors and the proposed low and high settings used for this study appear in Table 2. We determined the ranges selected for each parameter based on knowledge of the final product composition and characteristics and on the equipment manufacturer’s recommended cleaning parameters.
Table 2: Control Factors and Ranges for Study
Control Factor Identifier Low Setting High Setting
Water Temperature A 25 C 75 C
Detergent Concentration B 1% solution 6% solution
Wash Time C 1 minute 10 minutes
In order to become and remain successful in the current global economy, any operation, be it manufacturing or service-oriented, must optimize its use of available resources. Any area of waste increases the cost of goods or services and thereby decreases the bottom line. Design of Experiments (DoE) is an excellent tool to use for improving or developing any process. These improvements can take the form of increased process yield (for a manufacturing process); reduced variability; decreased time or increased efficiency; or decreased costs. This article outlines a study performed in order to develop parameters for a new step in a manufacturing process. The experiment was designed to measure the effects of pre-rinse water temperature, detergent concentration, and wash (dwell) time using a 23 full factorial design. The analysis determined which factors have a significant effect on the cleaning efficacy as measured by residual protein levels.
Relevant Background
The company is a medical device manufacturer, producing in-vitro diagnostic reagents and instruments for the blood band and transfusion service sectors of the health care industry. The major goal of this study was to help determine the optimal cleaning process parameters for the filling apparatus of a new piece of automated equipment. Determining the optimal process parameters was required prior to validating the integrated Clean-In-Place (CIP) system. The CIP system, after validation, will eliminate the need to dismantle the filling machine for manual cleaning between product runs. This automatic cleaning will result in savings of valuable resources, including time and personnel.
Due to the criticality of the product line, no detectable level of carry-over or contamination is acceptable after the cleaning process. No previous experiments are available for this type of equipment used in the industry. The current equipment utilizes a peristaltic pump and tubing to fill the reagent vials. The filling apparatus of the new equipment consists of a stainless steel piston assembly with a built-in cleaning mechanism. Higher rinse water temperatures and longer wash cycles are typically more effective in cleaning, as indicated by less residual protein on product contact surfaces. Due to the nature and the protein content of the products, higher rinse and wash water temperatures can lead to a viscous protein deposit that is difficult to remove in normal wash cycles.
Experimental Planning Methodology
Design of Experiment methodology requires detailed planning prior to performing any analysis or study. The model (Montgomery) used to develop this experimental plan appears in Table 1.
Using Design of Experiments (DoE) to Develop or Improve a ProcessBy Judi Kern
(usIng desIgn of experIments (doe) to develop or Improve a process, continued on page 12)
T H E Q U A L I T Y M A N A G E M E N T F O R U M
1 2
Held-constant variables are those factors that may affect the experiment but are not currently of interest and can be held constant or controlled (i.e., operator, raw material). The variables that we identified as also having an impact on the results were detergent concentration preparation, testing variability, and gauge reproducibility. We chose to control each by preparing sufficient detergent solutions to perform all experimental replicates and by having the same person perform all protein determinations on a single refractometer. We anticipated that each of these factors would have only a slight effect or none at all.
Nuisance factors are those variables that may have some effect on the experiment but are of no interest. We identified only one nuisance factor, ambient temperature. The final location of the filling equipment in the product will be in a temperature-controlled clean room, so the location for this experiment simulated that environment. As the entire experiment was developed as a small-scale simulation, we identified no restrictions. We performed pilot runs to confirm the proposed settings for this experiment. The confirmation runs were required since this is a new piece of equipment and a new process; there are no existing ranges or nominal values for the control variables. The results of the pilot runs confirmed the setting selected for the experiment.
We chose to perform a full 23 factorial design with two replicates of each corner point and three center points. We performed all runs in random order on a single day, so that blocking the experiment was not required. (Blocking experiments compensates for the variability introduced by separating the runs—for example, performing on different days, using different equipment, or operators.) A synopsis of the experimental procedure appears in Table 3.
Table 3: Experimental Procedure
Experimental Procedure
1. Place 1 mL of 22% Bovine Serum Albumin (BSA) on stainless steel coupon and allow to dry
2. Immediately prior to performing the experiment, add an additional 1 mL of 22% BSA
3. Perform simulated cleaning cycle
4. Add 0.5 mL deionized water to coupon, mix with applicator stick, and collect in test tube
5. Measure residual protein using refractometer
Data Analysis
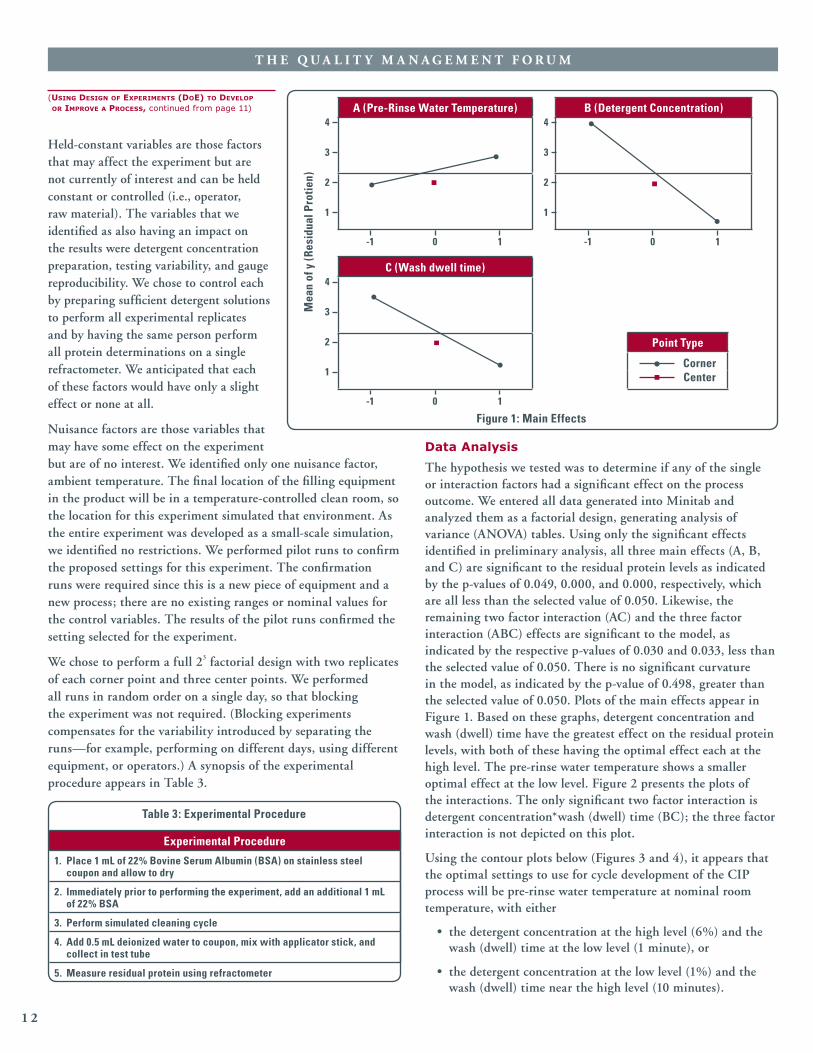
The hypothesis we tested was to determine if any of the single or interaction factors had a significant effect on the process outcome. We entered all data generated into Minitab and analyzed them as a factorial design, generating analysis of variance (ANOVA) tables. Using only the significant effects identified in preliminary analysis, all three main effects (A, B, and C) are significant to the residual protein levels as indicated by the p-values of 0.049, 0.000, and 0.000, respectively, which are all less than the selected value of 0.050. Likewise, the remaining two factor interaction (AC) and the three factor interaction (ABC) effects are significant to the model, as indicated by the respective p-values of 0.030 and 0.033, less than the selected value of 0.050. There is no significant curvature in the model, as indicated by the p-value of 0.498, greater than the selected value of 0.050. Plots of the main effects appear in Figure 1. Based on these graphs, detergent concentration and wash (dwell) time have the greatest effect on the residual protein levels, with both of these having the optimal effect each at the high level. The pre-rinse water temperature shows a smaller optimal effect at the low level. Figure 2 presents the plots of the interactions. The only significant two factor interaction is detergent concentration*wash (dwell) time (BC); the three factor interaction is not depicted on this plot.
Using the contour plots below (Figures 3 and 4), it appears that the optimal settings to use for cycle development of the CIP process will be pre-rinse water temperature at nominal room temperature, with either
• the detergent concentration at the high level (6%) and the wash (dwell) time at the low level (1 minute), or
• the detergent concentration at the low level (1%) and the wash (dwell) time near the high level (10 minutes).
C (Wash dwell time)4
3
2
1
-1 0 1
Mea
n of
y (R
esid
ual P
rotie
n)
A (Pre-Rinse Water Temperature) B (Detergent Concentration)4 4
3 3
2 2
1 1
-1 0 1 -1 0 1
Point Type
CornerCenter
Figure 1: Main Effects
(usIng desIgn of experIments (doe) to develop or Improve a process, continued from page 11)

T H E Q U A L I T Y M A N A G E M E N T F O R U M
1 3
We determined as optimal the low level for water temperature to eliminate the cost and time of heating the water for no appreciable effect with either high detergent and shorter time, or low detergent and longer time. The preliminary settings selected for validation are low water temperature, high detergent concentration, and high wash (dwell) time.
Summary
We designed this experiment to determine the effects that pre-rinse water temperature, detergent concentration, and wash (dwell) time have on the cleaning efficacy of a Clean-In-Place (CIP) system as measured by the amount of residual protein remaining on a stainless steel surface following a simulated cleaning cycle.
We determined that all three main factors analyzed within this experiment have a significant effect on the amount of residual protein remaining after the simulation of a CIP cleaning cycle. The interaction of detergent concentration*wash (dwell) time and of pre-rinse water temperature*detergent concentration*wash (dwell) time were also determined to have significant effects.
We found that the preliminary parameters to begin the determination of the cleaning cycle are:
• pre-rinse water temperature at the low level (25 C),
• detergent concentration at the high level (6%), and
• wash (dwell) time at the high level (10 minutes).
B (Detergent Concentration) Point Type
-1 Corner 0 Center 1 Corner
A (Pre-Rinse Water Temperature) Point Type
-1 Corner 0 Center 1 Corner
C (Wash dwell time) Point Type
-1 Corner 0 Center 1 Corner
A (Pre-Rinse Water Temperature)
B (Detergent Concentration)
C (Wash dwell time)
-1 0 1
-1 -10 01 1
5.0
5.0
2.5
2.5
0.0
0.0
5.0
2.5
0.0
Figure 2: Interaction Plot
B (D
eter
gent
Con
cent
ratio
n)
1.0
0.5
0.0
-0.5
-1.0-1.0 -0.5 0.0 0.5 1.0
C (Wash dwell time)
Contour PlotA = +1
1
2
3
54
Figure 4: Contour Plot
B (D
eter
gent
Con
cent
ratio
n)
1.0
0.5
0.0
-0.5
-1.0-1.0 -0.5 0.0 0.5 1.0
C (Wash dwell time)
Contour PlotA = -1
1
3
45
2
Figure 3: Contour Plot
(usIng desIgn of experIments (doe) to develop or Improve a process, continued on page 14)
T H E Q U A L I T Y M A N A G E M E N T F O R U M
1 4
These settings will be used as the baseline for cycle development; however, additional experiments are required to further optimize these settings, using as a guide the contour plots generated during this experiment.
In our experience, using DoE as a process development tool was an effective and efficient method for determining the optimal process settings. We completed this entire experiment in less than one day, and it yielded valuable data. The automation of the cleaning process saves valuable resources in both personnel and time. In addition, the determination that ambient water temperature allows for efficient cleaning eliminates the need for heating, saving energy as well as additional time. The use of this CIP system will eliminate the need to purchase, assemble, and sterilize supplies for filling sets, along with all associated labor costs, for a savings of approximately $167,700 in direct supply
costs, plus labor costs of approximately 0.5–0.75 FTE (Full-Time Equivalent). Such labor savings will result in staff redeployment to other duties, gaining efficiency.
ReferenceMontgomery, D. C. (2005). Design and analysis of experiments. Sixth Edition. Hoboken, NJ:
John Wiley & Sons, Inc.
Judi Kern is currently a quality systems specialist at Immucor, Inc., Norcross, GA. She earned her BS degree in medical technology from Rutgers University/Newark College of Arts and Sciences, and her MS degree in quality assurance from Southern Polytechnic State University. Judi has over 30 years of experience as a clinical laboratory scientist working in hospital transfusion services, community blood centers, and medical device manufacturers. She also volunteers as a quality assessor for AABB (formerly known as the American Association of Blood Banks). She is a senior member of the American Society for Quality and holds certifications as a Quality Auditor and a Manager of Quality/Operational Excellence. Judi can be contacted at [email protected]. Her mailing address is Immucor, Inc., 3130 Gateway Drive, Norcross, GA 30091.
QMJ vol. 16, no. 3 Executive Briefs
Quality Snags in the Mortgage-Finance Supply Chain and Subsequent Discussions. Paul Zipkin, Duke University, with commentaries by John R. Latham, Kenneth Stephens, Gregory H. Watson, and Peter Kolesar
This essay looks at the current financial crisis from a quality management perspective. Solving the crisis will require careful management of quality in financial institutions and across financial supply chains.
Quality practitioners have learned a few things about the reasons for quality problems in large manufacturing enterprises and how to handle them; perhaps those lessons could be applied to the financial industry as well.
How do successful industrial firms ensure quality? The fundamental principles are fairly simple. Everyone needs basic problem-solving and communication skills, including outlines for conducting a project and reporting the results. Another main principle is to measure and record important things and to monitor the results over time. And to make sure this happens, people need training.
(usIng desIgn of experIments (doe) to develop or Improve a process, continued from page 13)
As a new feature of the QMF, we will be showcasing the most recent articles in our sister publication, the Quality Management Journal (QMJ). As most of you might know, the QMF focuses on the practical application of quality principles, and the QMJ focuses on the research aspect of quality. We hope that you will visit their website and begin the synthesis process of merging theory with application to advance the field of quality. http://www.asq.org/pub/qmj/index.html
The QMJ provides relevant knowledge about quality management practice that is grounded in rigorous research. They seek:
• Empirical articles that provide objective evidence concerning actual quality management practice and its effectiveness.
• Research case studies that consider either a single application or a small number of cases.
• Management theory articles that present significant new insight and demonstrated practice.
• Review articles that create links to the existing academic literature and aid in the development of an identifiable quality management academic literature.
Here is a summary of their most recent articles.
Quality Management Journal Preview

T H E Q U A L I T Y M A N A G E M E N T F O R U M
1 5
The data for the study were drawn from a Web-based survey of 95 plants that had implemented Six Sigma as a formal quality management method. The Six Sigma and HRM constructs were measured using a seven-point Likert scale.
Results of this study indicate that the three HRM practices significantly affect the use of Six Sigma methodology. In addition, it was found that Six Sigma role structure integrates with the traditional quality-oriented HRM practices in supporting the use of Six Sigma methodology.
Paradoxes of ISO 9000 Performance: A Configurational Approach. Olivier Boiral and Nabil Amara, Université Laval
There has been a rapid increase worldwide in the number of ISO 9000-certified organizations, yet its real impact on performance remains controversial. While some studies highlight the benefits of certification in improving quality and commercial performance, others question these improvements or attempt to showcase some of the negative effects.
This article explores different performance configurations resulting from the implementation of an ISO 9000 system in 872 certified organizations. The configurations are based on the crossing of traditional performance criteria related to the implementation of ISO 9000 and organizational problems stemming from the implementation of the standard. Such crossing leads to the definition of four effectiveness configurations that reflect the paradoxes and degrees of success of ISO 9000 implementation: effective certification, ceremonial certification, managerial certification, and ineffective certification.
These configurations make it possible to paint a broad picture of the effectiveness and relevance of ISO 9000 implementation, while making allowances for the benefits as well as for the perverse effects of the standard.
The study involved sending a six-page questionnaire to all of the ISO 9000 certified companies in the Province of Quebec, Canada. The results of the study confirm the multidimensional and paradoxical character of effectiveness in the wake of ISO 9000 implementation. The traditional variables were found to be insufficient to assess the various impacts resulting from the adoption of the standard. These variables need to be considered in the larger context of the overall consequences of certification, including ensuing organizational problems. The study also revealed that it is not so much the standard itself or the moment of its implementation that has a positive or negative impact on performance, but rather the way in which ISO 9000 is implemented.
Most industrial firms use a hybrid approach to quality, combining features of quality control, total quality management, and Six Sigma. Financial institutions have paid little attention to the aforementioned principles. Their methods of measuring the quality of securities are primitive and their arrangements for assessing and controlling quality internally are flawed. In general, a layered approach is probably the best way to improve financial quality.
The organizations that insure mortgages should aggressively manage quality over their supply chains. And, on the demand side, there should be a broad effort to better educate the public about financial decisions and risks. Also, it is proper for the government to set limits to the kinds of loans offered and the ways in which they are sold. These suggestions, among other things, could help to make financial quality more reliable
Enhancing Six Sigma Implementation through Human Resource Management. Xingxing Zu, Morgan State University, and Lawrence D. Fredendall, Clemson University
Many companies claim to have achieved remarkable improvements as a result of implementing Six Sigma methodology. Not all organizations, however, have had the same success. Organizations that have implemented Six Sigma successfully claim that the best way to manage the change that results from the implementation is through issues related to human resource management (HRM). This article presents a study that investigates the role of HRM practices on Six Sigma implementation.
Prior research identified three HRM practices—employee involvement, employee training, and employee performance and recognition—that are important in forming a quality culture and influencing the attitudes of employees in favor of quality.
Three hypotheses were proposed to determine if the traditional HRM practices significantly affect the level to which an organization applies Six Sigma methods such as the structured improvement procedure and performance metrics:
• Hypothesis 1: The three traditional quality-oriented HRM practices have a positive direct effect on the use of Six Sigma methodology.
• Hypothesis 2: The Six Sigma role structure has a positive direct effect on the use of Six Sigma methodology.
• Hypothesis 3: The Six Sigma role structure has a positive direct effect on the three traditional quality-oriented HRM practices.

T H E Q U A L I T Y M A N A G E M E N T F O R U M
1 6
stating that you have noticed that the customer’s current level of service from you is not up to your usual standard and stating what you are doing to fix it may buy you time to resolve the problem before the customer chooses to take his or her business elsewhere.
In some businesses, it is easy to identify the customers whose experience is not up to your standards: they are the ones who have been in the waiting room for an hour, or whose flight has been delayed, or whose bill is incorrect. However, identifying these customers is not always simple. This article will show how the Customer Alarm uses Statistical Process Control (SPC) to identify these customers.
It should be noted that the Customer Alarm is not a substitute for customer satisfaction surveys, which provide insight into macro trends within your industry, your customer’s evolving needs, and how you fare against your competitors. Instead, it is a tool that tells you which customer needs to be contacted now.
Change in Experience Can Make Your Customer Vulnerable
Do you know how often you are late in filling orders? You may understand the average percentage of late shipments, but you may not know how often you are late with any particular customer. The average may be steady, but one customer may be experiencing more late shipments than others. Each customer has an individual experience with you; each customer is used to a particular level of service from you. Tracking the overall average is important and necessary to understand what is going on within your business as a whole, but tracking only the averages means that you have a blind spot with respect to individual customers.
Statistical Process Control (SPC) is a powerful tool that can be used in a large variety of applications beyond the manufacturing floor. It tells us when a “shift” or “change” has occurred in a variety of business situations, and that we must act. In this application it is a powerful ally in decision-making that is used to tell us when we should contact our customers.
Introduction
In an economic downturn, everyone is scrambling for customers: for your customers. It is given that you are already working to lower costs while keeping your product and customer service quality high. Customer loyalty can be increased by always exceeding expectations. Perfection is the goal, but it is not always possible. Companies have procedures for resolving customer problems, but you will take action only if you are aware of those problems. The Customer Alarm is a tool that can potentially alert you to problems before the customer does.
A proactive response is more likely to keep a customer satisfied. Consider your own experiences in doctors’ offices, traveling, or at restaurants. Practically everyone has experienced long waits, lost luggage, or poor service. While these are unfortunate outcomes, they are unplanned and may or may not have been preventable. But it is often the way service providers treat their customers that colors their perception of the experience. Does being told what the problem is, what is being done to resolve it, and an estimated time of when the problem will be resolved influence your likelihood of returning to that service provider? Certainly, this recourse is not sufficient to keep all customers, but
Each customer has different expectations regarding the quality of the experience he or she has with you and different tolerance levels of failure to meet those expectations. When a customer is aware of a decline in service from you, that customer may become vulnerable to your competitor. Customers will respond uniquely to problems. Some may divert their business to one of your competitors as soon as they notice a problem. Others may call to complain and end the business relationship only if you fail to resolve the problem within a reasonable length of time. Some may give a portion of their business to a competitor, while still other customers may never take any action at all. It is impossible to predict how or when any particular customer will respond to problems, but you can identify the customers whose experience has changed. A proactive response from you could prevent damaging your business relationship, and an effective solution could possibly win loyalty.
Procedure
Statistical Process Control is used to detect changes in internal processes. A signal from a control chart triggers activity focused on eliminating the cause of the change and on preventing the same circumstances from occurring again. This can be applied to your processes with your customers. A signal from the Customer Alarm indicates that the customer’s experience has changed, and such a signal should trigger similar activity focused on eliminating the cause of the customer’s problems. The steps below will guide you in its development.
1. Determine the metrics that comprise your customer’s experience. A customer’s experience includes every point of contact with your
The Customer Alarm: Using SPC to Prevent a Customer CrisisBy Helen M. Bush, PhD

T H E Q U A L I T Y M A N A G E M E N T F O R U M
1 7
company and your company’s goods and services. These are unique to your line of business, but examples may include:
Time—Time to fulfill order or provide service or other waiting times.
Quality of Service/Product—Correctness of order, condition or quality of product.
Communication/Contact—Customer call center contacts, order submission process, sales person contact, mailings/email.
Billing—Surcharges, billing correctness, billing consistency, late payments.
While not all experiences are measurable, you should make an effort to quantify the ones you can. Focus your effort on collecting variables that you know are related to customer satisfaction.
2. Establish SPC charts for each customer for the experiences you can measure. These may be monitored through a computer program. The charts will signal when the customer’s experience has changed. The number of customers, the number of quality metrics, and the demand on your available resources should be taken into consideration during the design phase. You might be able to determine an optimal design through simulation or operations research techniques. It is important to recall the relationship between the width of the control limits and responsiveness to shifts. Control limits that are closer together, such as at 2s, will detect changes faster, but will increase the number of signals the account agent (an account manager or other appropriate staff with customer service responsibilities) must address. Likewise, control limits that are further apart, such as at 3s, will have fewer false alarms but will not be as quick to detect changes in a customer’s experience. The expected number of signals
Example
The Customer Alarm is illustrated here using the time it takes to fulfill customer orders. Different customers will have different expectations of this time, depending on the order size, the product variety, the shipping distance, and contractual obligations. Figure 1 shows the average time to fill an order per month for three different customers over the last two years.
It is clear that each customer has a different experience and therefore different expectations with respect to the time it takes to fill an order. Customer A is used to a one-day turnaround, Customer B is used to anything from one to five days, while Customer C is used to about six days. Note that Customers A and C are likely to notice changes faster than Customer B, who is used to a wider variety of order fulfillment times. An increase in the average time to fill orders can come from a multitude of sources and may affect some but not all customers. Changes may or may not be controllable or preventable, but they are measurable. Figure 2 shows an EWMA control chart applied to the time to fill orders for Customer A.
The chart detects a change in the average time to fill orders by April. An immediate internal investigation reveals a change in
will have to be appropriate with respect to the account agent’s responsibilities. Therefore if you have ten customers per agent, you may consider 2.5s limits, but if there are hundreds of customers per agent, you may want to use 3s limits, which will have fewer signals. Also consider the nature of how these metrics are likely to change. Cumulative Sum (CuSum) charts and Exponentially Weighted Moving Average (EWMA) charts are known to work better for detecting small and gradual changes over time, while standard Shewhart charts are better for sudden, larger shifts. If your quality metrics are correlated to each other, you may want to consider reducing the number of metrics you track or use a multivariate chart.
3. Establish procedures for investigating and addressing out-of-control signals. When one of the charts gives a signal, a customer agent should be notified. Internally investigate and eliminate the causes of the change, then reach out to the customer. A procedure for communicating with the customer should include elements of addressing the problem, determining the degree of impact, and where you are in your internal investigation. Promise to follow up with more information as soon as possible and then do it.
Customer A Customer B Customer C
Ave
rage
Day
s to
Fill
Ord
er
8
7
6
5
4
3
2
1
0
JanJan
FebFeb
MarMar
AprApr
MayMay
JunJunJul
JulAug
AugSep
SepOct
OctNov
NovDec
Dec
Figure 1: Average Number of Days to Fill Orders
(the customer alarm: usIng spc to prevent a customer crIsIs, continued on page 18)
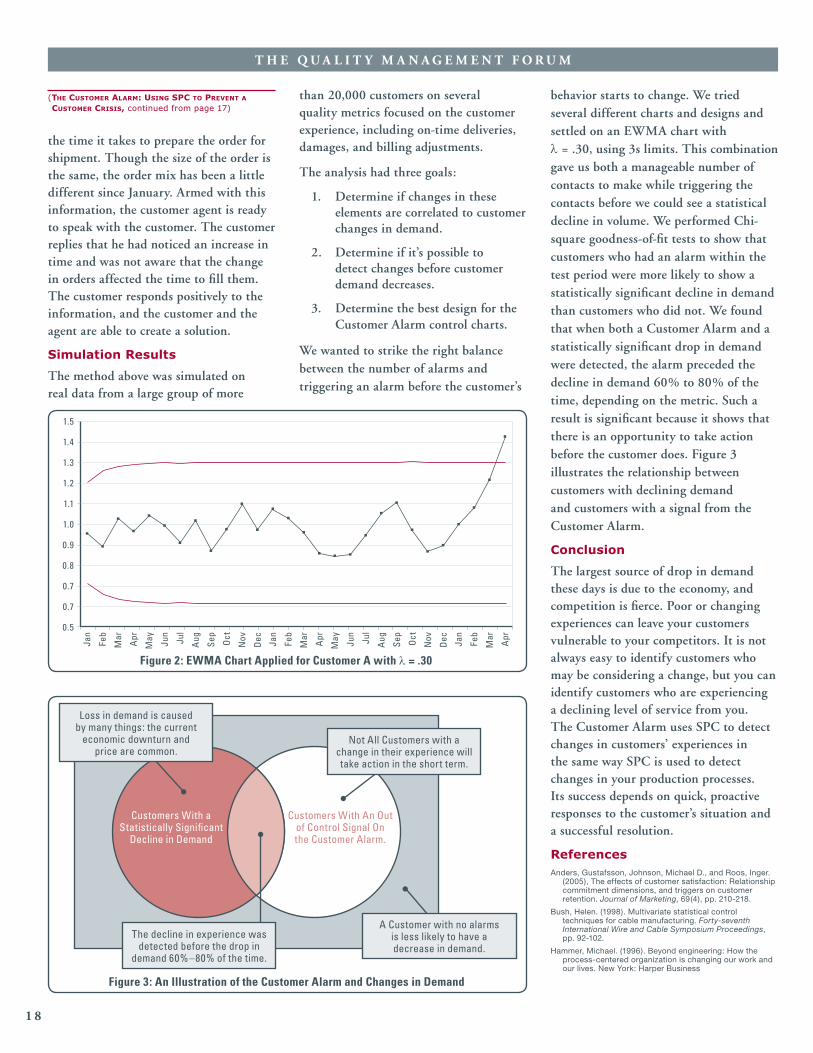
T H E Q U A L I T Y M A N A G E M E N T F O R U M
1 8
behavior starts to change. We tried several different charts and designs and settled on an EWMA chart with l = .30, using 3s limits. This combination gave us both a manageable number of contacts to make while triggering the contacts before we could see a statistical decline in volume. We performed Chi-square goodness-of-fit tests to show that customers who had an alarm within the test period were more likely to show a statistically significant decline in demand than customers who did not. We found that when both a Customer Alarm and a statistically significant drop in demand were detected, the alarm preceded the decline in demand 60% to 80% of the time, depending on the metric. Such a result is significant because it shows that there is an opportunity to take action before the customer does. Figure 3 illustrates the relationship between customers with declining demand and customers with a signal from the Customer Alarm.
Conclusion
The largest source of drop in demand these days is due to the economy, and competition is fierce. Poor or changing experiences can leave your customers vulnerable to your competitors. It is not always easy to identify customers who may be considering a change, but you can identify customers who are experiencing a declining level of service from you. The Customer Alarm uses SPC to detect changes in customers’ experiences in the same way SPC is used to detect changes in your production processes. Its success depends on quick, proactive responses to the customer’s situation and a successful resolution.
ReferencesAnders, Gustafsson, Johnson, Michael D., and Roos, Inger.
(2005), The effects of customer satisfaction: Relationship commitment dimensions, and triggers on customer retention. Journal of Marketing, 69(4), pp. 210-218.
Bush, Helen. (1998). Multivariate statistical control techniques for cable manufacturing. Forty-seventh International Wire and Cable Symposium Proceedings, pp. 92-102.
Hammer, Michael. (1996). Beyond engineering: How the process-centered organization is changing our work and our lives. New York: Harper Business
than 20,000 customers on several quality metrics focused on the customer experience, including on-time deliveries, damages, and billing adjustments.
The analysis had three goals:
1. Determine if changes in these elements are correlated to customer changes in demand.
2. Determine if it’s possible to detect changes before customer demand decreases.
3. Determine the best design for the Customer Alarm control charts.
We wanted to strike the right balance between the number of alarms and triggering an alarm before the customer’s
the time it takes to prepare the order for shipment. Though the size of the order is the same, the order mix has been a little different since January. Armed with this information, the customer agent is ready to speak with the customer. The customer replies that he had noticed an increase in time and was not aware that the change in orders affected the time to fill them. The customer responds positively to the information, and the customer and the agent are able to create a solution.
Simulation Results
The method above was simulated on real data from a large group of more
1.5
1.4
1.3
1.2
1.1
1.0
0.9
0.8
0.7
0.7
0.5
Jan
Jan
Jan
Feb
Feb
Feb
Mar
Mar
Mar
Apr
Apr
Apr
May
MayJu
n
Jun
Jul
Jul
Aug
AugSe
p
Sep
Oct
Oct
Nov
Nov
Dec
Dec
Figure 2: EWMA Chart Applied for Customer A with l = .30
Customers With a Statistically Significant
Decline in Demand
Customers With An Out of Control Signal On the Customer Alarm.
Not All Customers with a change in their experience will take action in the short term.
A Customer with no alarms is less likely to have a decrease in demand.
Loss in demand is caused by many things: the current
economic downturn and price are common.
The decline in experience was detected before the drop in
demand 60%–80% of the time.
Figure 3: An Illustration of the Customer Alarm and Changes in Demand
(the customer alarm: usIng spc to prevent a customer crIsIs, continued from page 17)

T H E Q U A L I T Y M A N A G E M E N T F O R U M
1 9
Helen Bush, PhD, is an advanced analytics manager at UPS, where she is responsible for projects spanning industrial engineering, revenue management, automotive, new product development, and problem resolution. Helen is also an adjunct professor at Southern Polytechnic State University in Marietta, Georgia,
she was a President’s Fellow and taught undergraduate engineering statistics and quality control. She graduated summa cum laude in industrial engineering at Mississippi State University in 1992. She can be reached at [email protected] Her mailing address is 55 Glenlake Parkway NE, Atlanta, GA 30328-3498.
teaching statistical process control and Six Sigma black belt concepts. She began her career at Lucent Technologies, where she worked in manufacturing in process improvement before advancing to technical manager. She received her doctorate in industrial engineering at the Georgia Institute of Technology, where
bubble burst and was followed by 9/11. Roughly eight years later, we are in another economic crisis where sustainability has emerged as an explicit concern.
Financial sustainability is a huge problem in the banking industries, primarily because of lack of quality standards. Energy and materials sustainability are national security concerns, and the sustainability of our education and health care systems is in question (Greenspan, 2007). Against this backdrop, geopolitical events continue to strongly influence, if not direct, the course of events. However, sustainability in the face population growth and resource scarcity will likely present a new economics for the 21st century. Projections indicate that without a massive Malthusian catastrophe or other population controls, the planet will have roughly nine billion inhabitants by about 2050. The solutions to our present problems are strongly linked to how the leaders of our institutions view and manage both quality and sustainability.
Defining Sustainability is Difficult
Defining sustainability in an operational way that connects with common sense is quite difficult because, like quality, the concept has several complex aspects. Among these are economic, technological, energy, material, environmental and social sustainability. The dictionary defines the verb sustain as “to maintain, to keep in existence or to provide nourishment for.” Thus, our common sense notion of sustainability is that it is a desirable condition. However, sustainability does not mean without change because change and adaptability are essential to survival itself. Sustainability seems to suggest maintaining a desirable state within certain limits by a dynamic balance of competing forces, like a process in a state of control or the physiological condition of homeostasis. Excess variation or volatility is contrary to a common sense notion of sustainability. In a technological sense, sustainability does not mean static because we desire that new and improved technology displace the old. Environmental sustainability has been defined as “development that meets the needs of the present without
The financial and social crises caused by recessions often reflect the result of unsustainable economic activity that signals the emergence of a new perspective for the ever-expanding meaning of quality. The turbulent times that ushered in the 21st century are forcing industry, government, education and health care to reexamine and reformulate the application of quality fundamentals for a new reality, much like what happened in the mid-1980s. In the future, sustainability will likely assume greater importance to quality professionals than ever before.
This article discusses the close relationships between quality and sustainability for systems, products and services. The traditional foundations of the quality discipline—namely its systems orientation, multidisciplinary approach, and core value of eliminating all forms of waste—can make many important and unique contributions to achieving increased sustainability in an era of accelerating scarcity of resources. Today’s concept of waste itself may even become obsolete (Friedman, 2008). Those who wish to pursue a professional career in sustainability would do well to learn the fundamentals of the quality discipline. I believe that not only can the nation’s institutions sustain the quality gains made in the 20th century, but also that the principles and values of the quality discipline will provide the foundation of a more sustainable future and quality of life.
Background
In the mid 1980s, the U.S. automotive industry (and other industries) were experiencing a period of prolonged decline due to a lapse of focus on quality fundamentals and investment in quality. Deming’s insights became a catalyst for new managerial practices. Management leaders attended to Deming’s insights and helped successfully steer the nation’s economy “Out of the Crisis” and into the era of “The New Economics” (Deming, 1986, 1993). About a decade later, the revolution in computers, software, and broadband technologies engendered an era of “time-based competition.” The race against time became paramount because of new global supplies of relatively cheap labor, raw materials, and energy. Maximizing financial performance and unlocking shareholder value became the strategy and professed “duty” for many corporate leaders. Entering the 21st century, the Internet
Quality and Sustainability in Turbulent TimesBy Kenneth Jackson, PhD
(QualIty and sustaInabIlIty In turbulent tImes, continued on page 20)
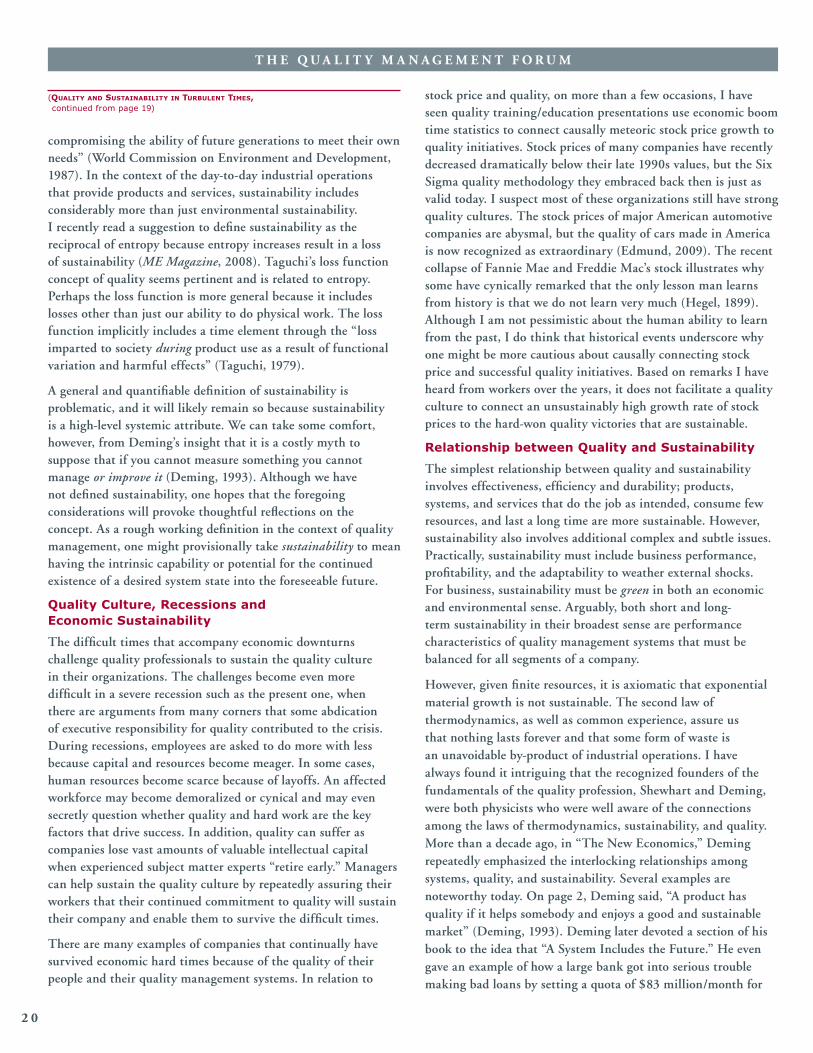
T H E Q U A L I T Y M A N A G E M E N T F O R U M
2 0
stock price and quality, on more than a few occasions, I have seen quality training/education presentations use economic boom time statistics to connect causally meteoric stock price growth to quality initiatives. Stock prices of many companies have recently decreased dramatically below their late 1990s values, but the Six Sigma quality methodology they embraced back then is just as valid today. I suspect most of these organizations still have strong quality cultures. The stock prices of major American automotive companies are abysmal, but the quality of cars made in America is now recognized as extraordinary (Edmund, 2009). The recent collapse of Fannie Mae and Freddie Mac’s stock illustrates why some have cynically remarked that the only lesson man learns from history is that we do not learn very much (Hegel, 1899). Although I am not pessimistic about the human ability to learn from the past, I do think that historical events underscore why one might be more cautious about causally connecting stock price and successful quality initiatives. Based on remarks I have heard from workers over the years, it does not facilitate a quality culture to connect an unsustainably high growth rate of stock prices to the hard-won quality victories that are sustainable.
Relationship between Quality and Sustainability
The simplest relationship between quality and sustainability involves effectiveness, efficiency and durability; products, systems, and services that do the job as intended, consume few resources, and last a long time are more sustainable. However, sustainability also involves additional complex and subtle issues. Practically, sustainability must include business performance, profitability, and the adaptability to weather external shocks. For business, sustainability must be green in both an economic and environmental sense. Arguably, both short and long-term sustainability in their broadest sense are performance characteristics of quality management systems that must be balanced for all segments of a company.
However, given finite resources, it is axiomatic that exponential material growth is not sustainable. The second law of thermodynamics, as well as common experience, assure us that nothing lasts forever and that some form of waste is an unavoidable by-product of industrial operations. I have always found it intriguing that the recognized founders of the fundamentals of the quality profession, Shewhart and Deming, were both physicists who were well aware of the connections among the laws of thermodynamics, sustainability, and quality. More than a decade ago, in “The New Economics,” Deming repeatedly emphasized the interlocking relationships among systems, quality, and sustainability. Several examples are noteworthy today. On page 2, Deming said, “A product has quality if it helps somebody and enjoys a good and sustainable market” (Deming, 1993). Deming later devoted a section of his book to the idea that “A System Includes the Future.” He even gave an example of how a large bank got into serious trouble making bad loans by setting a quota of $83 million/month for
compromising the ability of future generations to meet their own needs” (World Commission on Environment and Development, 1987). In the context of the day-to-day industrial operations that provide products and services, sustainability includes considerably more than just environmental sustainability. I recently read a suggestion to define sustainability as the reciprocal of entropy because entropy increases result in a loss of sustainability (ME Magazine, 2008). Taguchi’s loss function concept of quality seems pertinent and is related to entropy. Perhaps the loss function is more general because it includes losses other than just our ability to do physical work. The loss function implicitly includes a time element through the “loss imparted to society during product use as a result of functional variation and harmful effects” (Taguchi, 1979).
A general and quantifiable definition of sustainability is problematic, and it will likely remain so because sustainability is a high-level systemic attribute. We can take some comfort, however, from Deming’s insight that it is a costly myth to suppose that if you cannot measure something you cannot manage or improve it (Deming, 1993). Although we have not defined sustainability, one hopes that the foregoing considerations will provoke thoughtful reflections on the concept. As a rough working definition in the context of quality management, one might provisionally take sustainability to mean having the intrinsic capability or potential for the continued existence of a desired system state into the foreseeable future.
Quality Culture, Recessions and Economic Sustainability
The difficult times that accompany economic downturns challenge quality professionals to sustain the quality culture in their organizations. The challenges become even more difficult in a severe recession such as the present one, when there are arguments from many corners that some abdication of executive responsibility for quality contributed to the crisis. During recessions, employees are asked to do more with less because capital and resources become meager. In some cases, human resources become scarce because of layoffs. An affected workforce may become demoralized or cynical and may even secretly question whether quality and hard work are the key factors that drive success. In addition, quality can suffer as companies lose vast amounts of valuable intellectual capital when experienced subject matter experts “retire early.” Managers can help sustain the quality culture by repeatedly assuring their workers that their continued commitment to quality will sustain their company and enable them to survive the difficult times.
There are many examples of companies that continually have survived economic hard times because of the quality of their people and their quality management systems. In relation to
(QualIty and sustaInabIlIty In turbulent tImes, continued from page 19)

T H E Q U A L I T Y M A N A G E M E N T F O R U M
2 1
their loan agents. The first of Deming’s Fourteen Points states, “Create constancy of purpose toward the improvement of quality and service, with a plan to become competitive and to stay in business” (Deming, 1982).
The foregoing examples illustrate that sustainable success has always been integral to quality improvement and performance. In the 21st century, sustainability will likely become an explicit constraint that will provide a new context to the old saw about the ever-increasing competition for scarce resources. Moreover, national security may mandate that managers include sustainability explicitly as a part of their quality strategy. There will be tighter linkages between physical, financial, and human resource scarcity. Financial sustainability considerations, with a degree of risk, may become an intrinsic aspect of the quality management of the banking and investment industries (Kumiega, 2008). Effectiveness and efficiency have been ubiquitous in the quality literature and textbooks for years, but perhaps we will need also to include the term enduring. The degree to which a system, product, or service will have quality in the 21st century is the degree to which it will be effective, efficient, and enduring.
Sustainability and Quality Education
As consumers, we temporarily forget that we have to balance our infinite wants against the reality that our resources are finite. In recent years, the external environmental costs associated with a waste-driven economy have come to the fore as creating unsustainable losses to society. The title of Friedman’s book, Flat, Hot, and Crowded, provides a cogent metaphor for the some of the overarching realities of the 21st century (Friedman, 2008). In the future, unavoidable by-products from a process, once considered “waste,” may have to be considered as a new supply for downstream customers in some other segment of an economy. The “era of green” may challenge all institutions—industry, government, health care, and education—to rethink the very meaning of waste.
The level of concern may even give birth to a new professional discipline in sustainability. Many courses in “green” are already appearing in engineering studies. A professional discipline in sustainability fits naturally within graduate studies for quality professionals. Sustainability, like quality, is a systems science that seeks to optimize the behavior of the whole. The aim of both fields is to avoid local optimization and externalizing cost and loss to the rest of society. Statistical sciences and variation control are the quantitative foundations of both fields, and waste reduction is their common thread. Both fields are multidisciplinary, involving systems analysis and design, principles of management, psychology of human behavior, organizational culture, and resistance to change. Both fields recognize that the laws of nature are unyielding and place
fundamental constraints and limits on the performance of real systems, whether production or environmental. Both fields will use cross-functional process management methods.
Quality and sustainability require the integration of people with technology to achieve success. Both fields recognize that human-made systems, if left to themselves, will fall eventually into chaos and maximal waste generation. The founders of the quality discipline recognized many years ago that sustainability was a fundamental organizing principle of our field. Perhaps Shewhart and Deming saw that part of their role as physicists and quality professionals was to help us resist this natural drift into chaos and waste.
Conclusion
Poor quality in the traditional sense did not lead us into the present economic quagmire, as it did in the 1980s. The spirit of Deming’s Fourteen Points and other teachings, TQM, and the Six Sigma problem-solving methodology are as valid today as ever. Moreover, the quality management systems of American institutions, being grounded in the principles of Shewhart, Deming, Juran, and many others, will help these institutions to survive the present economic difficulties. For example, the Internet’s design does not ensure that major nodes will not fail randomly on occasion, but its packet routing architecture does guarantee that the system is survivable. In addition, the Internet is sustainable because its architecture provides the robustness and flexibility needed to accommodate technological innovation and shocks in the future.
The architectural glue of the quality discipline is its systems orientation, multidisciplinary approach, and core value of eliminating all forms of waste. Sustainability and reduction of variation are its key organizing principles. Sustaining 20th century gains in quality in times of scarcity will require that today’s quality professionals and educators transmit the lessons learned from their experience to the new generation of quality professionals. It will require the constant application of intelligence, a sense of ethical responsibility, and hard work to address quality’s ever-broadening perspectives.
There are several ways that quality professionals can address the sustainability dimension of quality. First is to analyze a system for its robustness, flexibility, and adaptability. Second, employees at all levels need to be educated on how sustainability is a key part of quality. They should be encouraged to seek out opportunities to reduce, reuse, and recycle. The FMEA tool would also seem to be useful when applied to sustainability analysis. Finally, management should frequently review Deming’s Fourteen Points in the context of policy guidelines for both quality and sustainability.
(QualIty and sustaInabIlIty In turbulent tImes, continued on page 22)

T H E Q U A L I T Y M A N A G E M E N T F O R U M
2 2
Kumiega, A., and Van Vliet, B. E. (2008). In crisis, give credit to quality, Quality Progress, December, pp. 8-9.
Letter to the Editor. (2008). Mechanical Engineering 130 (9), p.10.
Taguchi. G., and Yu, Y. (1979). Introduction to off-line quality control. Meieki Nakmura-Ku, Magaya, Japan: Central Japan Quality Control Association.
The World Commission on Environment and Development. (1987). Our Common Future. Oxford University Press.
Kenneth W. Jackson received his PhD and MS in mechanical engineering from the Georgia Institute of Technology and his BSME from Auburn University. He also received an MS in industrial engineering from Georgia Tech. Dr. Jackson teaches quality assurance, systems engineering, and industrial engineering technology courses at Southern Polytechnic State University. Before coming to the university, Dr. Jackson had a long and distinguished career at Bell Laboratories and Western Electric Company. He holds 20 patents and is a Registered Professional Engineer in Georgia, as well as a member of the American Statistical Association, ASQ, ASEE and ASME. Dr. Jackson can be reached at [email protected]. His mailing address is Southern Polytechnic State University, 1100 S. Marietta Parkway, Marietta, GA 30060.
Including sustainability explicitly as a fundamental organizing principle of quality management in the 21st century can help our nation’s institutions survive and maintain the quality of life we treasure. University-level graduate studies in quality assurance will provide a strong foundation for those who wish to pursue a professional career in sustainability.
ReferencesDeming, W. E. (1993). The new economics. Cambridge, MA: MIT Center for Advanced
Engineering Study.
Deming, W. E. (1986). Out of the crisis. Cambridge, MA: MIT Center for Advanced Engineering Study.
Deming. W.E. (1982). Quality Productivity and Competitive Position (Seminar Notes). Cambridge, MA: MIT Center for Advanced Engineering Study,
Edmund, M. (2009). The big three: Will a bailout be enough? Quality Progress, January, pp.14-15.
Friedman, T. L. (2008). Hot, flat and crowded. New York: Farrar, Straus and Giroux.
Greenspan, A. (2007). The age of turbulence: Adventures in a new world. New York: Penguin Press.
Hegel, G.W. F. (1956). The Philosophy of History. Mineola, NY: Dover Publications.
Maintaining a Successful Connection! As you will see from the Quality Management Forum and various other communications from ASQ, the Quality Management Division has many advantages to offer! To ensure we maintain a successful connection and thereby provide an increasing range of benefits to you, please take the time to contact us and update your information when necessary. Here’s how:
• For any changes to your email address, telephone numbers, or any other contact data, log on to www.asq.org
• Click on Manage my account
• Then click on My Contact Information
• And follow the instructions to update your information.
We thank you for taking the time to do this, and we look forward to a long and happy engagement with you.
Jan Tucker
VOC Analyst for the Quality Management Division
(QualIty and sustaInabIlIty In turbulent tImes, continued from page 21)

T H E Q U A L I T Y M A N A G E M E N T F O R U M
2 3
ChairJd Marhevko,SPX Test & MeasurementVP Operational Excellence7121 N Haggerty RoadCanton, MI 48187Office Phone: (734) 582-2386Cell: (419) 704-5603E-Mail: [email protected]
Chair ElectH. Fred WalkerRochester Institute of TechnologyRoss Building 10; Room 111615 Lomb Memorial DriveRochester, NY 14623-5603Office Phone: (585) 475-5955Fax: (585) 475-7080E-Mail: [email protected]
Past ChairHeather McCainGarmin International1200 East 151st StreetOlathe, KS 66062Office Phone: (913) 440-2236Cell: (913) 302-9350E-Mail: [email protected]
SecretaryKatrina HarrisEMSIPO Box 2505Waco, TX 76710Office Phone: (254) 299-3513 Home Phone: (254) 495-2935 Fax: (254) 853-3733E-Mail: [email protected]
TreasurerKenneth F. SadlerSadler Consulting388 Ridgevale DriveBedford, Nova Scotia.Canada B4A 3L7Office Phone: 902 835-7482Fax: 902 835-7482E-Mail: [email protected]
Vice-Chair, MembershipJohn Sharp Commercial & Inventive SolutionsMail Stop 258-0302900 Pulling Mill RoadHarrisburg, PA 17105Office Phone: (717) 986-7692E-Mail:
Vice-Chair, MarketingMilt Krivokuca9 OlympusIrvine, CA 92603Cell: (949) 892-7994E-Mail: [email protected]
Vice-Chair, Print InitiativesBruce DeRuntz, PhDCollege of EngineeringSouthern Illinois University CarbondaleCarbondale, IL 62901Office Phone: (618) 453-7829E-Mail: [email protected]
Vice-Chair, Face-to-Face InitiativesDavid M. Little Tyco Electronics MS 18-11 PO Box 3608 Harrisburg, PA 17105-3608 Office Phone: (717) 810-3741 E-Mail: [email protected]
Vice-Chair, e-Based InitiativesRonald L. MeierIllinois State UniversityCampus Box 5100Normal, IL 61790Office Phone: (309) 438-2905E-Mail: [email protected]
Vice-Chair, OperationsGrace DuffyManagement and Performance SystemsOffice Phone: (352) 343-9267E-Mail: [email protected]
Vice-Chair, Technical CommitteesSteve BabbREAL Balanced Solutions, Inc. 9126 Maple Court Seminole, FL 33777Office Phone: (727) 543-9513 Fax: (727) 392-6041E-Mail: [email protected]
QMD Officers
To see a QMD organization chart and complete roster of QMD officers, committee chairs, and volunteers, go to the QMD Organization pages on the QMD Web site at www.asq-qmd.org.
QMD AUDIT CHAIR
Dick M a t t hew s
SECRETARY
K a t r ina Har r isTREASURER
Ken S adler
CHAIR QMD
J d M ar hev ko
CHAIR-ELECT
H . F r ed WalkerPAST-CHAIR
Hea t her M cC ain
Conf Marketing Chair- Ellen Quinn
Section & Marketing Communications- Ellen Quinn
Market &VOC Chair- Jan Tucker
Sponsors & Partners Coordinator- Ken DeVane
International Liaison Coordinator- Dr. Ramakrishnan
Awards Chair- Dan Zrymiak
Member Data Analyst- Wayne Paupst
Member & Volunteer Support- Virginia Carr
Examining- Fred Hammond
Forum Editor- Bruce DeRuntz
Deputy Editor- Open
Editorial Review- Denis Leonard
Quality Press Liaison- Fred Walker
- OICGroup Inc.
VICE-CHAIRMARKETING
Milt Krivokuca
VICE-CHAIRMEMBERSHIP
John Sharp
VICE-CHAIRPRINT
INITIATIVES
Bruce DeRuntz
Conferences- 2010/Ron Bane- WCQ&I/Steve Babb
Speakers List- Steve Bogar
Training & Workshops- Claud Russey
Arrangements- Bill Hackett- Pete Johnson
Booth Management- Lois Cowden
Operations Manual- Al Arif
CMQ/OE Exam- Grant Short
CMQ/OE Exam Liaison- Jerry Rice
By-Laws- David Little
VICE-CHAIRFACE-TO-FACE
INITIATIVES
David Little
VICE-CHAIRE-BASED
INITIATIVES
Ron Meier
VICE-CHAIROPERATIONS
Grace Duffy
Performance ExcellenceChair – Jonathon Andell
- Stephen Marsh- James Schlichting- Glenn Strausser- Jim Christensen
Globalization & Supply Chain ManagementChair – John Cachat
- Brent Grazman- Tim Parrent
Risk ManagementChair – Ron Meier
- Mike Williams- Rodger Singley- Jim Toney
Social ResponsibilityChair – Vivian Hollifield
- Michelle Bernhart- Debra Baldwin
People & SystemsChair – Peggy Milz
- Doug Wood- Pat Townsend
Baldrige Criteria for Performance ExcellenceChair – Bill Denney
- Over 25 Subject Matter Experts
VICE-CHAIRTECHNICAL
COMMIT TEES
Steve Babb
DEPUT Y TREASURER
T BD
Program ManagementChair – Doug Wood
- Klaus Schmidt- Dan Yeomans
- Geoffery Withnell
Innovation & Value CreationChair – Jane Keathley
- Alexis Goncalves- Noor Al-Shaikh
- Willibert Fabritius- Kevin Posey
ADVISORY COMMIT TEE (WOW)
R on B aneBil l Denney
A r t Tr epanierGr ace Du f f y
R u s s We s t co t t

Quality Management Division Vice-Chair, Print Initiatives
Bruce DeRuntz
Quality Management Forum EditorBruce DeRuntz
Chair, Editorial Review BoardDenis Leonard, Business Excellence Consulting
Editorial Review BoardSuzanne Andrews, Metropolitan Life Insurance CompanyHank Campbell, University of Arkansas at Pine BluffMark R. Chandler, Federal Highway Administration
Eleanor Chilson, Chilson Quality ServicesDeepak Dave, Bobcat – Ingersoll Rand Company
William Denney, Quality Texas FoundationMac McGuire, McGuire & Associates Consulting
Pradip V. Mehta, Mehta Consulting LLCOz Rahman, Boston-Power Inc
Matthew J. Roe, Dow ChemicalMustafa Shraim, SQPS Ltd
Chad Vincent, Baxter Health CorporationGabriel Smith, John Deere
Consulting EditorDave Roberts, PhD
The Quality Management Forum is a peer-reviewed publication of the Quality Management Division of the American Society for Quality. Published quarterly, it is QMD’s primary channel for communicating quality management information and Division news to Quality Management Division members. The Quality Management Division of ASQ does not necessarily endorse opinions expressed in The Quality Management Forum. Articles, letters and advertisements are chosen for their general interest to Division members, but conclusions are those of the individual writers.
Address all communications regarding The Quality Management Forum, including article submissions, to:
Bruce DeRuntzCollege of Engineering Southern Illinois University CarbondaleCarbondale, IL 62901Office Phone: (618) 453-7829E-Mail: [email protected]
Address all communications regarding the Quality Management Division of ASQ to:
Jd Marhevko,SPX Test & MeasurementVP Operational Excellence7121 N Haggerty RoadCanton, MI 48187Office Phone: (734) 582-2386Cell: (419) 704-5603E-Mail: [email protected]
Address all communications regarding QMD membership including change of address to:
American Society for QualityCustomer Service CenterP.O. Box 3005Milwaukee, WI 53201-30051-800-248-1946 or (414) 272-8575
For more information on how to submit articles or advertise in The Quality Management Forum see the Quality Management Division Web site at www.asq-qm.org. Articles must be received ten weeks prior to the publication date to be considered for that issue.
Contact the ASQ Customer Service Center at 1-800-248-1946 or (414) 272-8575 to replace issues lost or damaged in the mail.
American Society for Quality, Inc.Customer Service Center600 N. Plankinton Ave.Milwaukee, WI 53201-3005
T h e Q u a l i t y M a n a g e m e n t
Every quarter, the Forum can convey your advertising message to nearly 20,000 Quality Management Division members. These members include many of ASQ’s
quality executives, managers, supervisors, and team and project managers. Most are decision makers or influencers for products and services such as:
√ Consulting √ Training Publications √ ISO Registration√ Conferences √ Business Shows √ Software ... and more
For information on advertising in the Forum, contactBruce DeRuntz, Editor, at [email protected]
Advertise in The Quality Management Forum
If you provide products
or services to the
quality profession,
The Quality Management Forum
will help you reach
your target market.


![The starred publications are in Peer-reviewed Congress ... · The starred publications are in Peer-reviewed Congress Proceedings, the others are in Peer- Reviewed Journals 2018 [178]](https://static.fdocuments.us/doc/165x107/5ead514d568d9a70b57151ef/the-starred-publications-are-in-peer-reviewed-congress-the-starred-publications.jpg)