A%: OTHER: KMH 4UJr0 9 4 - US EPA · EPA has determined that the HRS score of any site that is...
65
Stmerfttfid Records CeF' SITE INSPECTION WORKSlffiEfS- W | U ™" (Region I version 6/30/95^ A%: -} 1 " OTHER: KMH 4UJr0 9 4 WARNING!! EPA has determined that the HRS score of any site that is progressing towards listing on the NPL is confidential. Deliberations regarding scoring or listing issues, the site specific status, and HRS scores cannot be released or discussed with non-Agency persons. For additional guidance see the April 30, 1993 OSWER Directive 9320.1-11. SITE LOCATION Site Name: Covitch Property/Former ATF Davidson Co. Street Address: Main Street City: Northbridge State: MA Zip Code: 01588 Telephone: (508) 234-6301 CERCLIS ID No.: MAD046128559 Coordinates: Latitude: 42° 05' 34.5" N Longitude: 71° 40' 34" W OWNER/OPERATOR IDENTIFICATION Owner: Whitinsville Redevelopment Trust and Arcade Realty Trust Operator: Whitinsville Redevelopment Trust and Arcade Realty Trust Owner Address: 1 Main Street Operator Address: 1 Main Street City: Northbridge City: Northbridge State: MA Zip Code: 01588 Telephone: (508) 234-6301 State: MA Zip Code: 01588 Telephone: (508) 234-6301 SITE EVALUATION Agency/Organization: WESTON/START TDD No.: 95-07-0065 Investigator: Michael G. Jennings Date: 6 March 1997 EPA CONTACT EPA SAM: Nancy Smith Address: JFK Federal Building City: Boston State: MA Zip Code: 02203 Telephone: (617) 573-9697 EPA Reviewer: Date: Covitch Property / Former ATF Davidson Co. CERCLIS No. MAD046128559 SDMS DocID 557639 6 March 1997
Transcript of A%: OTHER: KMH 4UJr0 9 4 - US EPA · EPA has determined that the HRS score of any site that is...

Stmerfttfid Records CeF'
SITE INSPECTION WORKSlffiEfS- W | U ™ " (Region I version 6/30/95^A%: -}1 "
OTHER: KMH 4UJr0 9 4 WARNING!! EPA has determined that the HRS score of any site that is progressing towards listing on the NPL is confidential. Deliberations regarding scoring or listing issues, the site specific status, and HRS scores cannot be released or discussed with non-Agency persons. For additional guidance see the April 30, 1993 OSWER Directive 9320.1-11.
SITE LOCATION
Site Name: Covitch Property/Former ATF Davidson Co.
Street Address: Main Street
City: Northbridge State: MA
Zip Code: 01588
Telephone: (508) 234-6301
CERCLIS ID No.: MAD046128559 Coordinates: Latitude: 42° 05' 34.5" N Longitude: 71° 40' 34" W
OWNER/OPERATOR IDENTIFICATION
Owner: Whitinsville Redevelopment Trust and Arcade Realty Trust
Operator: Whitinsville Redevelopment Trust and Arcade Realty Trust
Owner Address: 1 Main Street Operator Address: 1 Main Street
City: Northbridge City: Northbridge
State: MA
Zip Code: 01588
Telephone: (508) 234-6301
State: MA
Zip Code: 01588
Telephone: (508) 234-6301
SITE EVALUATION
Agency/Organization: WESTON/START TDD No.: 95-07-0065
Investigator: Michael G. Jennings Date: 6 March 1997
EPA CONTACT
EPA SAM: Nancy Smith
Address: JFK Federal Building
City: Boston State: MA Zip Code: 02203
Telephone: (617) 573-9697
EPA Reviewer: Date:
Covitch Property / Former ATF Davidson Co. CERCLIS No. MAD046128559
SDMS DocID 557639 6 March 1997
GENERAL INFORMATION
Site Description and Operational History: Provide a brief description of the site and its operational history. State the site name, owner, operator, type of facility and operations, size of property, active or inactive status, and years of waste generation. Summarize waste treatment, storage, or disposal activities that have or may have occurred at the site; note whether these activities are documented or alleged. Identify all source types and prior spills, floods, or fires. Summarize highlights of the PA and other investigations. Cite references.
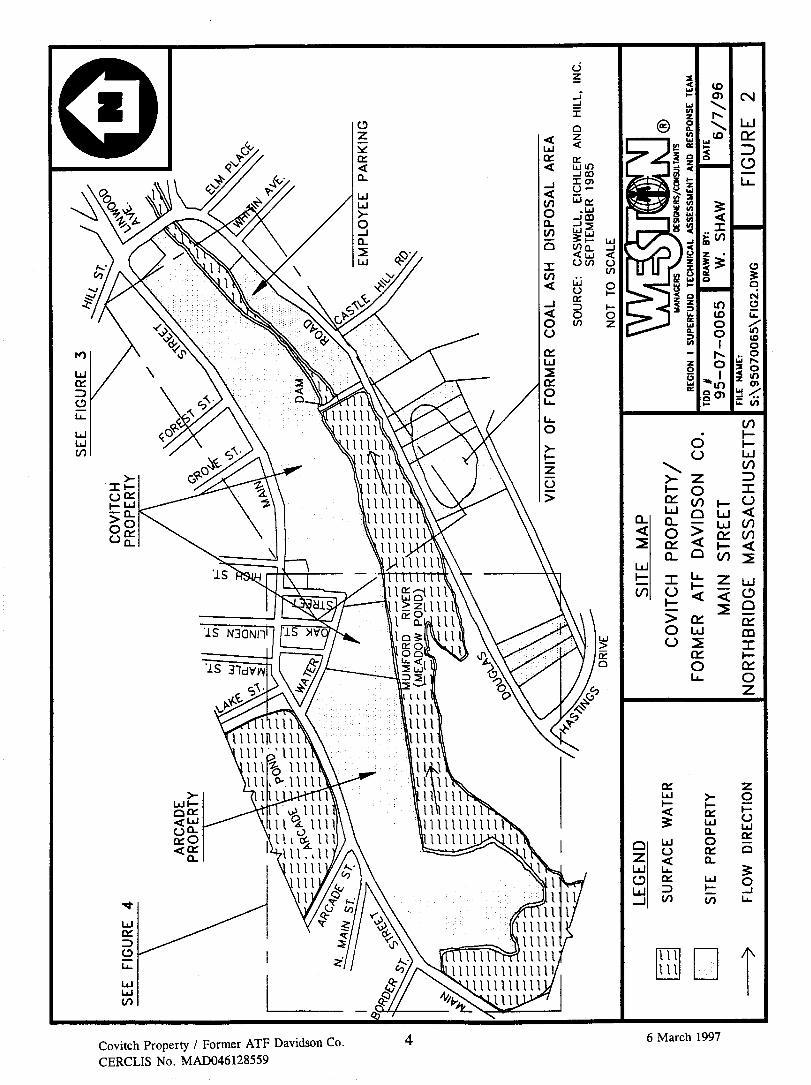
The Covitch Property/Former ATF Davidson Co. property (the property) consists of approximately 65 acres of land on numerous parcels in Northbridge, Worcester County, Massachusetts at the following coordinates (measured from the center of the property): 42° 05' 34.5" north latitude and 71° 40' 34" west longitude (Figure 1). Parcels associated with the property are located on both the north and south side of the Mumford River, which bisects the property (Figure 2). The exact chronology of ownership is difficult to determine; however, the following is known. The property was originally developed in the late-1800s as a foundry and metal fabrication mill by Whitin Machine Works (Whitin). Whitin operated on the property for a number of years. At some point Whitin ceased operations on the property and White Consolidated Industries (WCI) commenced on-site operations. A second company, ATF Davidson, Co., a subsidiary of WCI, also operated on the property in the same time frame. WCI and ATF Davidson, Co. ceased operations on the property sometime in the late-1970s or early-1980s. The property is presently owned by the Whitinsville Redevelopment Trust (WRT) and the Arcade Realty Trust (ART). The property is currently operated as leased manufacturing and commercial warehouse space to approximately 30 companies.
For this evaluation, the eastern developed portion of the property, on the north side of the Mumford River, will be referred to as the Covitch property (Figure 3). The remaining portion of the property on the north side of the Mumford River will be referred to as the Arcade property (Figure 4). There are also two parcels of land on the south side of the Mumford River, a small partially paved employee parking lot and a former coal ash disposal area. For this evaluation, the employee parking lot will be considered as part of the Covitch property, while the former coal ash disposal area will be considered part of the Arcade property. The term the property refers to both the Covitch property and the Arcade property as a whole.
As previously mentioned, the property formerly operated as a foundry. Approximately 30 acres of the property, consisting of the entire Arcade property, is land that has been graded and filled with foundry waste. The 1991 Environmental Protection Agency (EPA) Site Inspection (SI) for the property, completed 19 June 1991 by the Massachusetts Department of Environmental Protection (MA DEP), describes the landfilled material as consisting of 90% spent foundry sand, 5% coal ash, and 5% paint, plating sludge, plating rinsewater, bromide salt baths, solvents and cutting oils. According to the 1991 EPA SI, the filled area has a surficial extent of approximately 730,000 square feet, containing approximately 40,000 cubic yards of material.
The Mumford River flows through the property in an easterly direction. With the exception of the employee parking lot and the former coal ash disposal area, the Mumford River forms the southern boundary of the property. The property is perched approximately 5 feet above the river. A large dam on the Mumford River, connecting the main portion of the property to the employee parking lot, was formerly used to power the on-site manufacturing operations and later to generate hydroelectricity.
Covitch Property / Former ATF Davidson Co. CERCLIS No. MAD046128559
2 6 March 1997

Whitins Pond
Boat( 5 3 5 Ramp
3S^&£i*~ ^ X * Arcade* \ ^ WrUUmjVItfcEfc £ / \ • j V
i ^ f ^ ^ » r̂ g? " \ I — — 1 - : > I N E A R E S T RESIDENCE
BASE MAP IS A PORTION OF THE FOLLOWING 7.5 X 15 ' U.S.G.S. QUADRANGLE(S):
WORCESTER SOUTH. MA 1983 AND UXBRIDGE. MA 1982
1/2 0 1 MILE
1000 2000 3000 4O00 5000 6000 7000 FEET
I—I I—I ' QUADRANGLE LOCATION
SITE LOCATION MAP
COVITCH PROPERTY EORMER ATE DAVIDSON CO.
MAIN STREET NORTHBRIDGE, MASSACHUSETTS
® MANAGERS DESIGNERS/CONSULTANTS
REGION I SUPERFUND TECHNICAL ASSESSMENT AND RESPONSE TEAM
TDD #
95-07-0065 DRAWN BY:
M. JENNINGS
FILE NAME:
S:\95070065\F1G1
DATE
2 /96
FIGURE 1
Covitch Property / Former ATF Davidson Co. CERCLIS No. MAD046128559
3 6 March 1997
Covitch Property / Former ATF Davidson Co. CERCLIS No. MAD046128559
6 March 1997

Covitch Property / Former ATF Davidson Co. CERCLIS No. MAD046128559
5 6 March 1997

Covitch Property / Former ATF Davidson Co. CERCLIS No. MAD046128559
6 6 March 1997
GENERAL INFORMATION (Continued)
The dam creates an impoundment reservoir which stretches to the western extent of the property and beyond. This portion of the Mumford River is commonly referred to as Meadow Pond. A man-made "Raceway" and a series of locks and gates, which were formerly utilized to divert water from the impoundment reservoir in order to directly power the manufacturing equipment, runs beneath the property and several of the on-site buildings. When the power generation system was in use, the diverted water would be returned to the Mumford River below the dam. The dam, Raceway, locks, and gates still exist on the property; although the locks and gates are currently closed isolating the Raceway from the Mumford River.
On 24 April 1985, an oil sheen was observed on the surface water in the Raceway by an unnamed party. The Massachusetts Department of Environmental Quality Engineering (MA DEQE) conducted an investigation of an oil release. On 30 April 1985 the MA DEQE issued a Written Notice of Responsibility (WNOR) to ATF Davidson Co. The WNOR stated that "there is/has been a release/threat of release of oil/hazardous materials including waste oil and mercury at the former ATF Davidson Co. facility, Main Street, Northbridge, Massachusetts." No further reference to mercury contamination could be found by START personnel.
WCI and ATF Davidson Co. retained Caswell, Eichler, and Hill, Inc. (CEH) to conduct an auger probe investigation of the oil release. In a letter report dated 30 May 1985, CEH reported that in the area between Building No. 9 and the Raceway the soil was saturated with oil, both above and below the water table.
As a result of the findings contained within the 30 May 1985 letter report, MA DEQE requested that a hydrogeological investigation of the property be conducted, due to the presence of oil contamination on the property. CEH conducted the investigation in two parts, with the Covitch property and Arcade property investigated separately.
The Covitch property hydrogeological investigation, which included the proposed installation of 15 groundwater monitoring wells, was completed first. Of the 15 proposed wells, five were unable to be completed, primarily due to drill refusal above the water table. The 10 overburden groundwater monitoring wells which were completed are referred to by the "MC" designation on Figure 3 and throughout this report. Two of the monitoring wells (MC-1 and MC-2) were installed on the former coal ash disposal area. Due to the fact that the exact location of MC-1 and MC-2 could not be determined by START personnel, these wells are not located on Figure 3.
Groundwater samples were collected from the 10 completed wells by Environmental Field Services (EFS), a CEH subcontractor, on 30 July 1985. The samples were analyzed by Resource Analysts Inc. (RAI) for volatile organic compounds (VOCs) (EPA Method 624), priority pollutant metals, barium, and total cyanide. Two well samples (MC-7 and MC-14) were also analyzed for oil, grease, and phenols.
CEH stated in a September 1985 report for the Covitch property investigation that no problem levels of VOCs, priority pollutant metals, cyanide, barium, or phenol were detected in the groundwater samples. The analysis indicated that groundwater collected from MC-14 contained
Covitch Property / Former ATF Davidson Co. CERCLIS No. MAD046128559
7 6 March 1997
GENERAL INFORMATION (Continued)
24 milligrams per liter (mg/L) of oil and grease. Monitoring well MC-14 is located along the northern extent of the property which adjoins Main Street. MC-14 is upgradient of the area of oil contamination located in the vicinity of the Raceway. START personnel chose the groundwater sample collected from monitoring well MC-7 as the reference sample for the oil and grease analysis due to the fact that it was the only other sample to receive the analysis. The oil and grease concentration in the MC-7 sample was less than 2 mg/L.
CEH addressed possible sources of oil contamination near the Raceway in the September 1985 investigation report. According to the CEH report there have been documented oil releases on both the north and south side of the Raceway. The northern release, occurring over a period of years, was a result of the temporary outdoor storage of metal turnings in the vicinity of Building No. 9 prior to their off-site disposal. The southern release occurred in the basement of the powerhouse, Building No. 19. No further information regarding the oil releases was given in the CEH report.
On 9 December 1985, New England Pollution Control Corporation, Inc. (NEPCCO) was contracted by WCI to install a cut-off trench/well system with a double pump recovery unit in order to remediate the groundwater contamination problem in the vicinity of Building No. 9, the Raceway, and the Mumford River. The system was installed between 23 December 1985 and 20 June 1986.
Three overburden observation wells (OW-1 through OW-3) were also installed as part of the remediation system. The only analytical data that START personnel were able to locate, relative to the collection of groundwater samples from the observation wells, is contained within the Project Summary Report prepared by NEPCCO. A data table contained within the report indicates that groundwater samples were collected from the wells on 17 February 1987 and analyzed by an unknown laboratory for VOCs by EPA Methods 601 and 602. According to the data table, seven VOCs were detected in one or more of the observation wells at concentrations greater than the reference concentration. Detected concentrations ranged from 3 to 57 parts per billion (ppb). START personnel chose the groundwater sample collected from observation well OW-2 as the background location due to its minimal contamination.
The project report indicated that the recovery system was operational from 13 June 1996 until approximately 11 February 1987. According to the 1991 EPA SI report, the recovery and treatment system was shut down in the spring of 1987 at the request of NEPCCO due to decreased levels of VOCs detected in the influent groundwater samples collected from the recovery system. START personnel did not find any information indicating that the treated effluent ever exceeded discharge permit standards.
The Arcade property hydrogeological investigation was conducted by CEH during summer 1985. On 18 July 1985, EFS collected groundwater samples from the eight groundwater monitoring wells (M-l through M-8) installed on the Arcade property (Figure 4). These samples were analyzed by RAI for VOCs (EPA Method 624), priority pollutant metals, barium, and total cyanide. The results of the investigation, as stated in the 1985 Arcade property investigation report, entitled Monitoring Well Installation and Ground Water and River Bottom Sediment
Covitch Property / Former ATF Davidson Co. CERCLIS No. MAD046128559
8 6 March 1997

GENERAL INFORMATION (Continued)
Quality Analyses, ATF Davidson Company Arcade Facility (October 1985 CEH report), indicated that the groundwater below the Arcade property contained detectable levels of four VOCs. Vinyl chloride, trans-1,2-dichloroethene, trichloroethene, and tetrachloroethene were detected in one or more of the monitoring well samples at concentrations greater than the reference concentrations. Detected concentrations ranged from 10 ppb for trichloroethene (M-3) to 950 ppb for tetrachloroethene (M-6). Barium was also detected in several groundwater samples at concentrations three times greater than the barium concentration of the reference sample (M-l). Barium was present at the highest concentration (2,900 ppb) in the sample from monitoring well M-5. START personnel chose the groundwater sample collected from monitoring well M-l as the background location due to its crossgradient location and uncontaminated condition.
As a result of the detection of VOCs in the groundwater below the Arcade property, an additional round of groundwater samples were collected on 13 November 1985 and sent to RAJ for VOC analysis by EPA Method 624. The results of the analysis were documented in a CEH report entitled Additional Investigations ATF/Davidson Arcade Facility, Covitch Properties, Mumford River (January 1986 CEH report). The January 1986 CEH report indicated that some of the VOCs previously detected in several of the monitoring wells were not detected in the 13 November 1985 samples collected from the same wells. However, the January 1986 CEH report further indicated that the concentration of vinyl chloride and trans-1,2-dichloroethene detected in monitoring well M-8 were increasing. The concentrations detected in the 13 November 1985 groundwater samples collected from monitoring well M-8 ranged from 380 ppb for vinyl chloride to 1,100 ppb for trans-1,2-dichloroethene. No VOCs were detected in the background sample (M-l) collected with the November 1985 groundwater samples.
A third round of groundwater samples was collected by CEH from the Arcade property on 24 January 1987, as part of an additional investigation of the area around monitoring well M-8. This investigation included the installation and sampling of three additional overburden groundwater monitoring wells (M-9 through M-l l ) . The new wells were located radially in the vicinity of monitoring well M-8. The groundwater samples collected on 24 January 1987 were submitted to RAI for VOC analysis by EPA Method 624. Results of the analysis of the 24 January 1987 groundwater samples were documented in a report CEH report entitled Additional M-8 Investigations, ATF Davidson Arcade Facility (March 1987 CEH report).
The March 1987 CEH report stated that only one of the newly installed wells (M-9) contained VOC contamination. Tetrachloroethene was detected in this monitoring well at a concentration greater than the reference concentration. START personnel chose the groundwater sample collected from monitoring well M-10 as the background location due to its upgradient location and its uncontaminated condition. Tetrachloroethene was detected in monitoring well M-9 at a concentration of 48 ppb. This compound had previously only been detected in monitoring well M-6.
The March 1987 CEH report also stated that the concentrations of vinyl chloride (280 ppb) and trans-1,2-dichloroethene (640 ppb) detected in monitoring well M-8 were decreasing. However, trichloroethene was detected at 17 ppb in the March 1987 groundwater samples collected from monitoring well M-8. This compound had not been detected in monitoring well M-8 groundwater samples prior to January 1987.
Covitch Property / Former ATF Davidson Co. CERCLIS No. MAD046128559
9 6 March 1997

GENERAL INFORMATION (Continued)
In July 1987 CEH submitted a risk assessment report entitled Risk Assessment of Area Surrounding M-8 at the ATF/Davidson Arcade Facility (July 1987 CEH report). The July 1987 CEH report stated that the VOC-contaminated plume in the vicinity of monitoring well M-8 covered approximately 13,100 square feet. In the July 1987 CEH report, CEH theorized that the plume consisted predominantly of a parent compound (trichloroethene) and two weathered species (vinyl chloride and trans-1,2-dichloroethene). The report further stated that the mass balance of chemical compounds present in monitoring well M-8 shifted towards the weathered species. CEH attributed this to a long period of emplacement or an accelerated weathering process. According to the July 1987 CEH report, the chemical contamination detected in the Arcade property groundwater samples was migrating towards the Mumford River where the contamination would ultimately be diluted, diminishing its impact on human health and the environment.
In June 1991, MA DEP completed an SI on the property for EPA. No environmental samples were collected.
On 2 May 1996 Roy F. Weston, Inc. (WESTON®) Superfund Technical Assessment and Response Team (START) personnel conducted an on-site reconnaissance of the property. It was observed, at the time of the reconnaissance, that there was a general lack of vegetation on the Covitch property due to extensive development, with the exception being a small strip of land bordering the northern bank of the Mumford River. Grass, shrubs, and some small trees were found in this area. The Arcade property also contained a general lack of vegetation at the time of the reconnaissance. The surficial soils of the foundry sand landfill tended to support sporadic grasses and some small trees and shrubs. A former island, which is now connected via landfilled material to the northern shore of the Mumford River at the western extent of the Arcade property, showed thick vegetation; consisting of large trees and shrubs. This condition can be considered typical of the native vegetation of the area.
During the on-site reconnaissance, START personnel attempted to locate the former coal ash disposal area. According to historical information, the former coal ash disposal area is located south of Douglas Road and west of Castle Hill Road. An area of landfilled material was observed in the general vicinity of the historical location of the former coal ash disposal area. The landfilled material consisted of a black uniform grained, non-native material with a surficial extent of approximately 7,500 square feet. However, START personnel were unable to locate monitoring wells MC-1 and MC-2, installed on the former coal ash disposal area in conjunction with the September 1985 CEH report. Locating the two monitoring wells would have verified that the area in question was the former coal ash disposal area.
START personnel noted several piles of debris on both the Covitch property and Arcade property during the on-site reconnaissance. On the Covitch property several piles of concrete, brick, metal, and wood debris, associated with the on-going renovation of the property were observed south of the Mumford River. The total surficial extent of these piles was approximately 300 square feet.
Covitch Property / Former ATF Davidson Co. CERCLIS No. MAD046128559
10 6 March 1997

GENERAL INFORMATION (Continued)
On the Arcade property several piles of scrap metal were observed on the foundry sand landfill. These piles were also associated with the on-going renovation of the property. Several electric motors and an above-ground storage tank (AST) were strewn in among the debris. The tank volume appeared to be approximately 300 gallons. The total surficial extent of the debris piles was approximately 30,000 square feet. The surficial soils of the foundry sand landfill in the vicinity of the metal debris piles appeared stained with an oily-type material. This stained area will be evaluated as a component of the landfill.
During the on-site reconnaissance, START personnel observed an additional AST in the northwest corner of the Covitch property. The volume of the AST was 275 gallons, according to representatives of WRT. The AST is used to store diesel fuel for vehicles utilized on the property. The AST was situated on a concrete pad. Access to the AST was restricted by a 6-foot chain-link fence.
During the on-site reconnaissance, START personnel observed several 55-gallon drums in various conditions, throughout the property. Outside, six 55-gallon metal drums and one 55-gallon plastic drum were observed. Of these seven drums, one crushed and rusted metal drum was observed under a metal walkway in the vicinity of the former powerplant, two empty and rusted metal drums were observed on the western extent of the property, and three empty metal and one empty plastic 55-gallon drums were observed on the unpaved portion of the employee parking lot located on the south side of the Mumford River.
START personnel observed several large pipes (plastic, metal, and reinforced concrete) protruding from the northern shoreline of the Mumford River, where the shoreline borders the property. The large pipes were noted above and below the water surface. The 1991 EPA SI report for the property stated that untreated electroplating wastewater had been discharged to the Mumford River from the property between 1930 to 1965. According to the EPA SI report, an on-site wastewater treatment plant was installed on the property in 1965 and treated wastewater was discharged to the Mumford River from 1965 until September 1982. Between 1974 and 1982 discharge of treated wastewater was carried out under a National Pollution Discharge Elimination System (NPDES) permit (No. MA0001252). The 1991 EPA SI report indicated that the wastewater treatment plant ceased operations in September 1982. The SI report did not indicate why operations ceased. The present owners of the property were unable to provide any additional information concerning the discharge of industrial wastewater to the Mumford River. START personnel were unable to find any additional information concerning the discharge of treated or untreated wastewater to the Mumford River.
Inside the mill complex, approximately 70 55-gallon drums were observed in the manufacturing areas of several of the current tenant companies. Labels on the drums indicated that the drums contained both virgin material and waste products associated with the various operations conducted on the premises by each business. Approximately 50 metal drums were observed with labels indicating that they contained "hazardous waste" or "waste oil".
Many of the companies leasing space within the property utilize flammable material in their manufacturing operations. Numerous explosion-proof flammable materials storage cabinets were
Covitch Property / Former ATF Davidson Co. CERCLIS No. MAD046128559
11 6 March 1997

GENERAL INFORMATION (Continued)
observed in various buildings throughout the property. Additionally, several spray booths were observed operating in several of the manufacturing areas located throughout the on-site buildings. Several hazardous materials were observed in use during the on-site reconnaissance. These materials consisted of paints, thinners, solvents, inks, wood stains, adhesives, and cutting fluids/coolants.
According to information START personnel received from WRT after the on-site reconnaissance, seven underground storage tanks (USTs) and two additional ASTs exist/existed on the property. Some of the tanks have been removed, some have been filled in place, and some are still in use. A summary of the information concerning the ASTs and USTs is presented in the following Table.
Summary of Underground and Above-ground Storage Tanks on the Covitch Property/Former ATF Davidson Co.
Underground Storage Tanks
Location Size (gallons) Contents Status
Adjacent to Bldg. 4 500 Fuel Oil Removed 1985
Adjacent to Bldg. 23 1,000 No. 6 Fuel Oil Filled 1987
Adjacent to Bldg. 23 1,000 No. 6 Fuel Oil Filled 1987
Adjacent to Bldg. 23 1,000 No. 6 Fuel Oil Filled 1987
Adjacent to Bldg. 12 20,000 Fuel Oil Filled 1984
Adjacent to Bldg. 4 5,000 Fuel Oil Active
Above-ground Storage Tanks
Location Size (gallons) Contents Status
Adjacent to Bldg. 16 30,000 No. 6 Fuel Oil Removed 1995
Adjacent to Bldg. 12 275 Diesel Fuel Active
Adjacent to Bldg. 11 5,000 No. 6 Fuel Oil Removed 1984
Bldg = Building
The information START personnel received from WRT after the on-site reconnaissance also indicated that eight transformers which contained polychlorinated biphenyls (PCBs) were formerly located on the property. These transformers were verified by Transformer Service, Inc. (TSI) to contain PCBs. A TSI inspection on 15 April 1989 indicated that only one of the transformers was potentially leaking. No further information concerning transformer leakage was available to START personnel. All of the PCB-containing transformers have been removed from the property. A summary of the transformers formerly located on the property is presented below.
Covitch Property / Former ATF Davidson Co. CERCLIS No. MAD046128559
12 6 March 1997
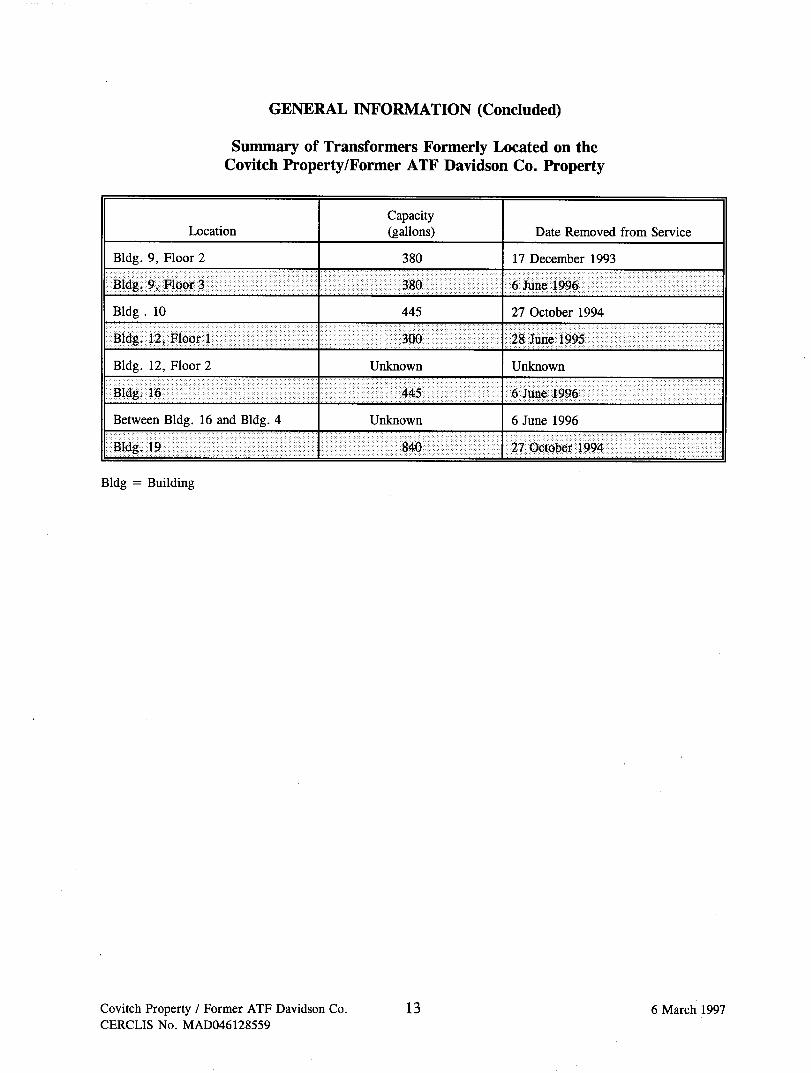
GENERAL INFORMATION (Concluded)
Summary of Transformers Formerly Located on the Covitch Property/Former ATF Davidson Co. Property
Location Capacity (gallons) Date Removed from Service
Bldg. 9, Floor 2 380 17 December 1993
Bldg. 9, Floor 3 380 6 June 1996
Bldg . 10 445 27 October 1994
Bldg, 12, Floor 1 300 28 June 1995
Bldg. 12, Floor 2 Unknown Unknown
Bldg. 16 445 6 June 1996
Between Bldg. 16 and Bldg. 4 Unknown 6 June 1996
Bldg, 19 840 27 October 1994
Bldg = Building
Covitch Property / Former ATF Davidson Co. CERCLIS No. MAD046128559
13 6 March 1997

SOURCE EVALUATION
Description of each Source: Identify each source area by name and number, and classify each source into a source type category (see SI Table 1). Describe the dimensions of each source. Identify the hazardous substances associated with each source. Determine the containment characteristics for each source by pathway (see HRS Tables 3-2, 4-2, 6-3 and 6-9).
Source No. 1: Foundry Sand Landfill (Landfill) The Arcade property is built on a foundry sand landfill. The 1991 EPA SI report stated that the landfill consists of 40,000 cubic yards of foundry sand (90%), coal ash (5%), and other material consisting of paint, plating sludge, plating rinsewater, bromide salt baths, solvents and cutting oils. The 1991 EPA SI Report also estimated that the surficial extent of the landfill is approximately 730,000 square feet. There is no containment associated with this source. The source is available to all pathways.
Source No. 2: VOC Plume-Arcade Property (Contaminated Soil) A VOC plume exists/existed within the foundry sand landfill. A risk assessment on the plume was conducted by CEH in 1987. As part of the risk assessment, it was determined by CEH that the plume occupied approximately 13,100 square feet. There is no containment associated with this source. The source is available to all pathways.
Source No. 3: Oil/VOC Plume-Covitch Property (Contaminated Soil) There is/was an area of contaminated soil and groundwater in the vicinity of the Raceway on the Covitch property. A groundwater remediation system was installed in late 1985/early 1986 to address VOC contamination detected in this area. The specific dimensions for the extent of contamination in this area were unable to be determined; therefore, this source will be listed but not evaluated. There is no containment associated with this source. The source is available to all pathways.
Source No. 4: Coal Ash Disposal Area (Landfill) An area of landfilled material exists, south of Douglas Road, on land owned by WRT. This land corresponds to property formerly owned by Whitin and WCI where coal ash was reportedly disposed. During the START on-site reconnaissance, a surface area of approximately 7,500 square feet of landfilled material was observed. START personnel were unable to locate monitoring wells MC-1 and MC-2, which would have verified that the area in question was the actual location of the former coal ash landfill. There is no containment associated with this source. The source is available to all pathways.
Source No. 5: 55-gallon Drums-Exterior (Drums) Six metal 55-gallon drums and one plastic 55-gallon drum was observed on the exterior portion of the property during the START on-site reconnaissance. All of the drums appeared to be empty. These drums are considered a source due to their unknown contents. There was no containment associated with this source and the source was available to all pathways.
Source No. 6: 55-gallon Drums-Interior (Drums) Approximately 70 metal drums were observed throughout the on-site buildings during the START on-site reconnaissance. Many of the drums appeared to contain virgin material and as
Covitch Property / Former ATF Davidson Co. CERCLIS No. MAD046128559
14 6 March 1997
SOURCE EVALUATION (Continued)
such would not be considered for this evaluation. However, approximately 50 drums were observed to be labeled as "hazardous waste" and "waste oil". These drums were located in the various metal processing businesses which lease space on the Covitch property. There is no containment associated with the drums and the source is available to all pathways.
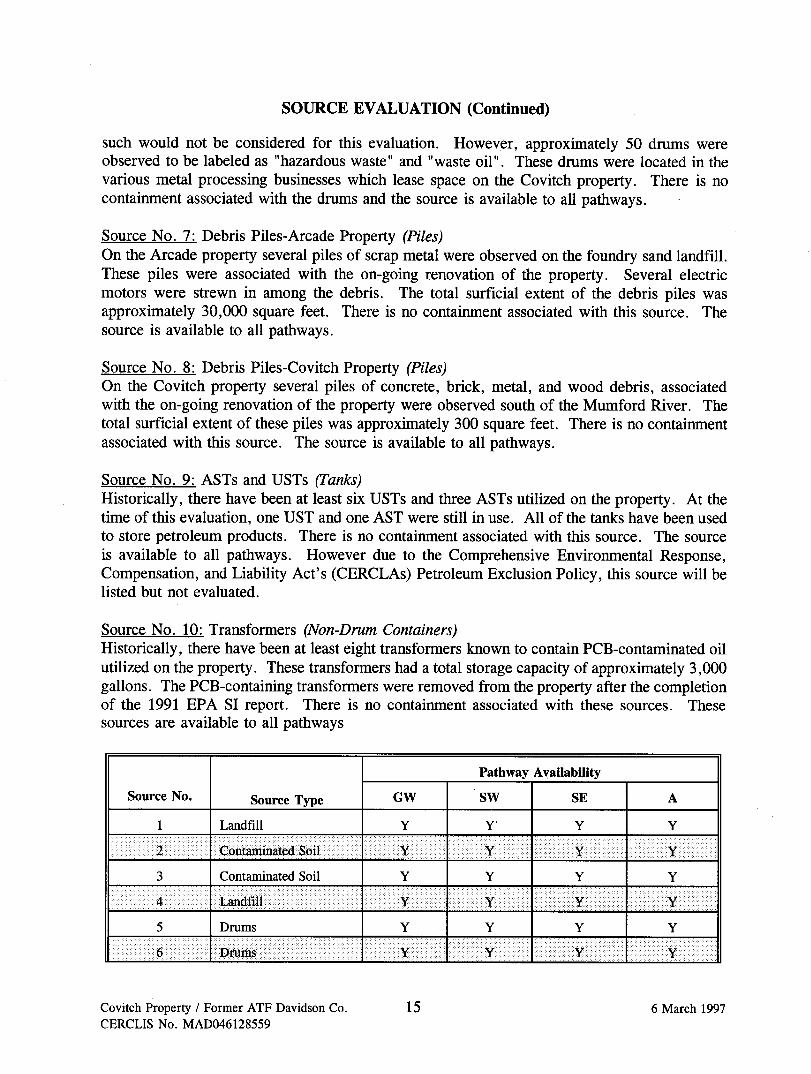
Source No. 7: Debris Piles-Arcade Property (Piles) On the Arcade property several piles of scrap metal were observed on the foundry sand landfill. These piles were associated with the on-going renovation of the property. Several electric motors were strewn in among the debris. The total surficial extent of the debris piles was approximately 30,000 square feet. There is no containment associated with this source. The source is available to all pathways.
Source No. 8: Debris Piles-Covitch Property (Piles) On the Covitch property several piles of concrete, brick, metal, and wood debris, associated with the on-going renovation of the property were observed south of the Mumford River. The total surficial extent of these piles was approximately 300 square feet. There is no containment associated with this source. The source is available to all pathways.
Source No. 9: ASTs and USTs (Tanks) Historically, there have been at least six USTs and three ASTs utilized on the property. At the time of this evaluation, one UST and one AST were still in use. All of the tanks have been used to store petroleum products. There is no containment associated with this source. The source is available to all pathways. However due to the Comprehensive Environmental Response, Compensation, and Liability Act's (CERCLAs) Petroleum Exclusion Policy, this source will be listed but not evaluated.
Source No. 10: Transformers (Non-Drum Containers) Historically, there have been at least eight transformers known to contain PCB-contaminated oil utilized on the property. These transformers had a total storage capacity of approximately 3,000 gallons. The PCB-containing transformers were removed from the property after the completion of the 1991 EPA SI report. There is no containment associated with these sources. These sources are available to all pathways
Source No. Source Type
Pathway Availability
GW SW SE
Landfill Y
Contaminated Soil
Contaminated Soil
Landfill
Drums
Drums
Covitch Property / Former ATF Davidson Co. CERCLIS No. MAD046128559
15 6 March 1997

SOURCE EVALUATION (Continued)
Source No. Source Type
Pathway Availability
GW SW SE
Piles
Piles
Tanks
10 Non-Drum Containers
Legend: Y = available to pathway N = not available to pathway ? = availability unknown I = ineligible waste
Covitch Property / Former ATF Davidson Co. CERCLIS No. MAD046128559
16 6 March 1997

SOURCE EVALUATION (Continued)
Hazardous Waste Quantity (HWQ) Calculations: SI Tables 1 and 2 (See HRS Tables 2-5, 2-6, and 5-2).
For each source, provide HWQ calculations by tier and provide assumptions. Note: HWQ calculations may be different for the soil exposure pathway.
This is a multiple source site. Due to insufficient data, Tier A (Hazardous Constituent Quality) and B (Hazardous Wastestream Quality) could not be evaluated.
Source No. 1: Landfill Tier C: The 1991 EPA SI Report states that the landfill is approximately 40,000 cubic yards. 40,000 2,500 = 16.0 Tier D: The 1991 EPA SI Report states that the surficial extent of the landfill is approximately 730,000 square feet.
730,000 3,400 = 214.71 WQ = 214.71
Source No. 2: Contaminated Soil Tier C: Insufficient information is available to evaluate the source on this tier. Tier D: The July 1987 CEH report states that the VOC plume comprises approximately 13,100 square feet.
13,100 + 34.000 = 0.39 WQ = 0.39
Source No. 3: Not evaluated.
Source No. 4: Landfill. Tier C: Insufficient information is available to evaluate the source on this tier. Tier D: During the START on-site reconnaissance, an area of approximately 7,500 square feet of landfilled material was observed.
7,500 ^ 3,400 = 2.21 WQ = 2.21
Source No. 5: Drums. Tier C: During the START on-site reconnaissance, seven 55-gallon drums were observed on the exterior portion of the property. 7 - 10 = 0.7 Tier D: Insufficient information is available to evaluate the source on this tier.
WQ = 0.7 Source No. 6: Drums. Tier C: During the START on-site reconnaissance, approximately 50 55-gallon drums, labeled as containing waste material, were observed on the interior portion of the property. 50 - 10 = 5.0 Tier D: Insufficient information is available to evaluate the source on this tier.
WQ = 5
Covitch Property / Former ATF Davidson Co. CERCLIS No. MAD046128559
17 6 March 1997

SOURCE EVALUATION (Concluded)
Source No. 7: Piles Tier C: Insufficient information is available to evaluate the source on this tier. Tier D: According to on-site observations made during the START reconnaissance, the total surficial extent of the piles is approximately 30,000 square feet.
30,000 - 13 = 2,307.69 WQ = 2,307.69
Source No. 8: Piles Tier C: Insufficient information is available to evaluate the source on this tier. Tier D: According to on-site observations made during the START reconnaissance, the total surficial extent of the piles is approximately 300 square feet.
300 13 = 23.08 WQ = 23.08
Source No. 10: Non-Drum Container Tier C: The total storage capacity of the eight transformers was approximately 3,000 gallons of PCB-contaminated oil. 3,000 - 500 = 6 Tier D: Insufficient information is available to evaluate the source on this tier.
WQ = 6
All of the sources evaluated are available to all pathways. The multiple source site Hazardous Waste quantity value is calculated as follows:
214.71 + 0.39 + 2.21 + 0.70 + 5 + 2,307.69 + 23.08 + 6 = 2,559.78 100 < 2,559.78 < 10,000
HWQ = 100
GW HWQ = 100 SW HWQ = 100 SE HWQ = 100
AIR HWQ = 100
Covitch Property / Former ATF Davidson Co. CERCLIS No. MAD046128559
18 6 March 1997

SI TABLE 1: HAZARDOUS WASTE QUANTITY (HWQ) SCORES FOR SINGLE SOURCE SITES AND FORMULAS FOR MULTIPLE SOURCE SITES
Single Source Sites (assigned HWQ scores)
Multiple Source Sites
Tier Source Type HWQ = 10 HWQ = 100 HWQ = 10,000 HWQ = 1,000,000 Divisors for Assigning
Source WQ Values
A Hazardous Constituent
Quantity N/A
HWQ = 1 if Hazardous Constituent Quantity data are complete
HWQ = 10 if Hazardous Constituent Quantity data are not complete
> 100 to 10,000 lbs > 10,000 to 1 million lbs > 1 million lbs lbs + 1
B Hazardous
Wastestream Quantity
N/A < 500,000 lbs > 500,000 to 50 million lbs >50 million to 5 billion lbs >5 billion lbs lbs H- 5,000
C Volume
Landfill
Surface impoundment
Drums
Tanks and non-drum containers
Contaminated soil
Pile
Other
<6.75 million f t 3
<250,000 yd3
< 6,750 ft 3
<250 yd 3
< 1,000 drums
< 50,000 gallons
<6.75 million f t 3
<250,000 yd3
< 6,750 ft 3
<250 yd3
< 6,750 ft 3
<250 yd3
>6.75 million to 675 million f t 3
>250,000 to 25 million yd 3
> 6,750 to 675,000 f t 3
>250 to 25,000 yd 3
> 1,000 to 100,000 drums
> 50,000 to 5 million gallons
>6.75 million to 675 million ft3
>250,000 to 25 million yd 3
> 6,750 to 675,000 f t 3
>250 to 25,000 yd 3
>6,750 to 675,000 f t 3
>250 to 25,000 yd 3
>675 million to 67.5 billion f t 3
>25 million to 2.5 billion yd 3
> 675,000 to 67.5 million f t 3
>25,000 to 2.5 million yd 3
> 100,000 to 10 million drums
>5 million to 500 million gallons
>675 million to 67.5 billion f t 3
>25 million to 2.5 billion yd 3
> 675,000 to 67.5 million f t 3
>25,000 to 2.5 million yd 3
>675,000 to 67.5 million f t 3
> 25,000 to 2.5 million yd 3
>67.5 billion f t 3
>2.5 billion yd 3
>67.5 million f t 3
>2.5 million yd 3
> 10 million drums
>500 million gals.
>67.5 billion ft3
>2.5 billion yd 3
>67.5 million f t 3
>2.5 million yd 3
>67.5 million f t 3
>2.5 million yd 3
f t 3 + 67,500 yd 3 + 2,500
f t 3 + 67.5 yd 3 2.5
drums 10
gallons -s- 500
ft 3 67,500 yd 3 -s- 2,500
ft 3 - 67.5 yd 3 ^2 .5
f t 3 -s- 67.5 yd 3 -s- 2.5
Covitch Property / Former ATF Davidson Co. CERCLIS No. MAD046128559
19 6 March 1997

SI TABLE 1: HAZARDOUS WASTE QUANTITY (HWQ) SCORES FOR SINGLE SOURCE SITES AND FORMULAS FOR MULTIPLE SOURCE SITES
Single Source Sites (assigned HWQ scores)
Multiple Source Sites
Tier Source Type HWQ = 10 HWQ = 100 HWQ = 10,000 HWQ = 1,000,000 Divisors for Assigning
Source WQ Values
D Area
Landfill
Surface Impoundment
Contaminated Soil
Pile
Land treatment
< 340,000 ft 2
<7.8 acres
< 1,300 ft 2
<0.029 acres
<3.4 million ft 2
<78 acres
< 1,300 ft 2
<0.029 acres
< 27,000 ft 2
<0.62 acres
> 340,000 to 34 million f t 2
>7.8 to 780 acres
> 1,300 to 130,000 f t 2
>0.029 to 2.9 acres
>3.4 million to 340 million f t 2
>78 to 7,800 acres
> 1,300 to 130,000 f t 2
>0.029 to 2.9 acres
>27,000 to 2.7 million f t 2
>0.62 to 62 acres
>34 million to 3.4 bil. f t 2
>780 to 78,000 acres
> 130,000 to 13 million f t 2
>2.9 to 290 acres
>340 million to 34 bil. f t 2
>7,800 to 780,000 acres
> 130,000 to 13 million f t 2
> 2.9 to 290 acres
>2.7 mil. to 270 million f t 2
>62 to 6,200 acres
>3.4 billion f t 2
>78,000 acres
>13 million f t 2
> 290 acres
> 34 billion f t 2
> 780,000 acres
>13 million f t 2
>290 acres
>270 million f t 2
> 6,200 acres
ft 2 ^ 3,400 acres 0.078
f t 2 - j - 13 acres H- 0.00029
ft 2 - 34,000 acres -r 0.78
ft 2 -5- 13 acres -s- 0.00029
ft 2 -5- 270 acres -s- 0.0062
1 ton = 2,000 lbs = 1 yd3 = 4 drams = 200 gallons
SI TABLE 2: HWQ SCORES FOR MULTIPLE SOURCE SITES
Site WQ Total HWQ Score
0 l a to 100 > 100 to 10,000 > 10,000 to 1,000,000 > 1,000,000
0 l b
100 10,000 1,000,000
a I f the HWQ total is between 0 and 1, round it to 1. b I f the hazardous constituent quantity data are not complete, assign the score of 10.
Covitch Property / Former ATF Davidson Co. CERCLIS No. MAD046128559
20 6 March 1997

SI TABLE 3: WASTE CHARACTERIZATION WORKSHEET Enter "NA" for substances which are not available to a pathway. Enter "NL" for substances values not listed in SCDM. Enter "- -" for values not calculated due to substances values not listed in SCDM. Provide footnote for substances listed in table but not used for scoring purposes (e.g. BTEX substances attributable to a gasoline tank.)
Sources: * 1. Foundry Sand Landfill (Landfill) 3. Oil/VOC Plume-Covitch Property (Contaminated Soil)
2. VOC Plume-Arcade Property (Contamianted Soil)
GROUNDWATER PATHWAY
SURFACE WATER PATHWAY
OVERLAND/FLOOD MIGRATION
Source Hazardous Substance Toxicity
GW Mobility
(HRS Table 3-8)
Tox. x Mobility
Value (HRS Table 3-9)
Pers. (HRS Tables
4-10 and 4-11)
Tox. x Pers. Value (HRS Table 4-12)
Bioacc. Pot.
(HRS Table 4-15)
Tox. x Pers. x Bioacc.
Value (HRS Table 4-16)
Ecotox. (HRS Table 4-19)
Ecotox. x Pers. (HRS Table 4-20)
Eco. Bioacc.
Pot. (HRS Table 4-20)
Ecotox. x Pers. x Eco.
Bioacc. Value (HRS
4-21)
Barium 10,000 0.01 100 1 10,000 0.5 5000 1 1 0.5 0.5
1,2,3 Benzene 100 100 0.4 40 5,000 2E+05 100 40 500 20,000
1£A_ Chloroethane (Ethyl chloride) 0.0007 0.0007 0.0035 NL
Dichloroethane, 1,1- 10 10 0.4 20 NL
1AA. Dichloroethylene, trans-1,2- 100 100 0.4 40 50 2,000 0.4 50 20
1,2,3 Tetrachloroethylene 100 100 0.4 40 50 2,000 100 40 50 2,000
1,2,3 Toluene 10 10 0.4 50 200 100 40 50 2,000
Trichloroethane, 1,1,1- 0.4 0.4 10 20
1,2,3 Trichloroethylene 10 10 0.4 50 200 100 40 50 2,000
1,2,3 Vinyl chloride 10,000 10,000 0.0007 35 NL
! A 3 _ Xylene, p- (also use for total) 10 10 0.4 50 200 100 40 50 2,000
1.2,3 Zinc 10 0.01 0.1 1 10 500 5,000 10 10 500 5,000
BCF
NOTES: SCDM Version: JUN96
SI Table 3 assumptions: liquid-phase waste disposed of in non-karst terrane, fresh-water river environment values.
* For this evaluation, chemical contamiantion will be attributed to Sources 1 through 3 only.
Covitch Property / Former ATF Davidson Co. CERCLIS No. MAD046128559
21 6 March 1997

SI TABLE 3: WASTE CHARACTERIZATION WORKSHEET (Continued)
Sources: 1. Foundry Sand Landfill (Landfill) 3. Oil/VOC Plume-Covitch Property (Contaminated Soil)
2. VOC Plume-Arcade Property (Contamtanted Soil)
SURFACE WATER PATHWAY
GROUNDWATER TO SURFACE WATER AIR PATHWAY
Source Hazardous Substance Toxicity
Tox. x Mob. x Pers. Value (HRS
Table 4-26)
Tox. x Mob. x Pers. x Bioacc.
Value (HRS Table 4-28)
Ecotox. x Mob. x Pers. Value (HRS Table 4-29)
Ecotox. x Mob. x Pers. x Ecobioacc. Value (HRS
Table 4-29)
Gaseous/ Particulate (HRS Table
6-13) (indicate Gor P)
Mobility (HRS Table 6-11,6-12)
Tox. x Mob. Value
(HRS Table 6-13)
1.2,3 Barium 10,000 100 50 0.01 0.005 8E-05 0.8
1.2.3 Benzene 100 40 2E+05 40 20,000 100
AAA. Chloroethane (Ethyl chloride) 0.0007 0.0035
AAA. Dichloroethane, 1,1- 10 20 G 10
1,2,3 Dichloroethylene, trans-1,2- 100 40 2,000 0.4 20 100
1.2.3 Tetrachloroethylene 100 40 2.000 40 2,000 100
1,2,3. Toluene 10 200 40 2,000 G 10
AAA. Trichloroethane, 1,1,1- 0.4 20
AAA. Trichloroethylene 10 200 40 2,000 10
AAA. Vinyl chloride 10,000 35 10,000
AAA. 1.2,3
Xylene, p- (also use for total)
Zinc
10
10 0.1
200
50
40
0.1
2,000
50 8E-05
10
0.0008
Covitch Property / Former ATF Davidson Co. CERCLIS No. MAD046128559
22 6 March 1997

GROUNDWATER PATHWAY
Pathway Description and Scoring Notes: Describe the Groundwater Migration Pathway. Include the names and brief descriptions of the aquifers underlying the site, the depth to groundwater, the locations of the nearest private and public drinking water supplies and the aquifers from which they draw, and the population relying upon groundwater drawn from within four miles of the site for their drinking water supplies.
Briefly discuss any sampling events relative to the Groundwater Pathway; provide dates of sampling events and a summary of the analytical results and whether an observed release and/or actual contamination targets were documented.
Indicate any assumptions you have made in scoring the Groundwater Pathway for this site, or any key factors which influence your scoring rationale.
Two separate hydrogeological investigations were conducted on the property during the summer of 1985, one on the Covitch property which included the attempted installation of 15 overburden groundwater monitoring wells and a separate investigation of the Arcade property which included the installation of eight overburden groundwater monitoring wells. Both investigations were conducted by CEH.
The Covitch property is almost entirely developed with a large industrial mill complex which dates back to the 1800s. Due to this, overburden encountered on this portion of the property is considered borrow fill. CEH described this material in the 1985 monitoring well installation report for the Covitch property investigation as consisting of brown (grayish below the water table) silty fine to medium sand with occasional coarse gravel, cobbles, and small boulders. CEH further reported that this material closely resembled the native till of the region. Groundwater depths on the Covitch property ranged from 5 to 8 feet below grade. CEH determined that groundwater in this area generally flows south towards the Mumford River. CEH calculated that the groundwater seepage velocity below the Covitch property varied from a minimum of approximately 3.5 feet per year (eastern extent) to a maximum of approximately 52 feet per year (western extent).
Two of the monitoring wells installed as part of the 1985 Covitch property investigation were located in the former coal ash disposal area south of Douglas Road. CEH reported that the overburden encountered during the installation of these monitoring wells was similar to that encountered on the Covitch property. Groundwater was encountered on the former coal ash disposal area property approximately 5 feet below grade. CEH estimated that groundwater below the former coal ash disposal area was flowing north towards the Mumford River. CEH calculated that the groundwater seepage velocity below the former coal ash disposal area was approximately 3.5 feet per year.
To the west of the mill buildings the overburden is comprised of foundry fill. CEH described the foundry fill in the 1985 monitoring well installation report for the Arcade property investigation as consisting of fine to coarse sand and gravel with some pumice like material, foundry bed glass, and ash. The fill material is a result of the large foundry which operated on the property. The spent foundry sand was graded into the river creating a large land mass which stretches approximately 3,200 feet west of the former foundry building. The filled area contains approximately 40,000 cubic yards of material in an area approximately 730,000 square feet. CEH reported that groundwater was encountered on the Arcade property at depths varying between 3 and 7 feet below grade. CEH determined that groundwater below this portion of the property was flowing south towards the Mumford River.
Covitch Property / Former ATF Davidson Co. CERCLIS No. MAD046128559
23 6 March 1997
GROUNDWATER PATHWAY (Continued)
CEH calculated that the groundwater seepage velocity below the Arcade property was approximately 23 feet per year.
During the hydrogeological investigation of the Covitch property five of the monitoring well locations met refusal above the water table, preventing the installation of these wells. As a result, only ten monitoring wells were completed. CEH theorized that refusal was a result of a bedrock surface or a boulder layer above the bedrock. According to CEH this theory was reinforced by the presence of a dam and large smoke stack adjacent to the attempted monitoring well locations, both of which require a shallow bedrock foundation.
One of the monitoring wells that CEH installed on the Arcade property was required by the MA DEQE to be advanced until refusal was encountered. CEH chose the monitoring well located on the former island for this purpose. Split-spoon and hollow-stem auger refusal was encountered 18 feet below grade. CEH theorized that this corresponded to the bedrock surface in this area. According to CEH this decision was supported by a visible bedrock outcrop approximately 200 feet south of the area of interest.
No bedrock formations mapped within a 4-mile radius of the property exhibit karst characteristics.
On 24 April 1985, an oil sheen was observed by an unknown party on the surface water contained within the Raceway. As a result of this observation an investigation was initiated to determine the cause of the oil sheen. CEH completed a solid stem auger probe investigation in the area of concern in May 1985. This investigation indicated that a layer of oil and grease was present both above and below the water table in the vicinity of the Raceway. As a result of the presence of the oil and grease layer the hydrogeological investigation of the Covitch property was initiated.
As previously mentioned, the Covitch property investigation included the proposed installation of 15 groundwater monitoring wells, 10 of which were actually completed. EFS collected groundwater samples from these wells on 30 July 1985. The samples were analyzed by RAI for VOCs (EPA Method 624), priority pollutant metals, barium and total cyanide. Two well samples (MC-7 and MC-14) were also analyzed for oil, grease, and phenols. The September 1985 CEH report for the investigation indicated that no problem levels of VOCs, priority pollutant metals, cyanide, barium, or phenol were detected. CEH further stated that monitoring well MC-14 contained 24 mg/l of oil and grease. This well is not located in the vicinity of the Raceway.
The September 1985 CEH report also details the results of an auger probe investigation in the vicinity of the Raceway. This investigation confirmed other findings which indicated that there was an area of oil and grease contamination both above and below the water table in the vicinity of the Raceway.
Covitch Property / Former ATF Davidson Co. CERCLIS No. MAD046128559
24 6 March 1997
GROUNDWATER PATHWAY (Continued)
According to the September 1985 CEH report there have been documented oil releases on both sides of the Raceway, one in the basement of the powerhouse and one in an area between Building No. 9 and the Raceway where oil-soaked metal turnings were temporarily stored prior to off-site disposal. CEH stated in the report that a source on the powerhouse side of the Raceway was strongly suspected of causing the oil and grease contamination.
On 9 December 1985, NEPCCO was contracted by WCI to install a cut-off trench/well system with a double pump recovery unit, in order to remediate the groundwater contamination problem in the vicinity of Building No. 9, the Raceway, and the Mumford River. The system was installed between 23 December 1985 and 20 June 1986.
Three overburden observation wells (OW-1 through OW-3) were also installed as part of the remediation system. The only analytical data that START personnel were able to locate, relative to the collection of groundwater samples from the observation wells, is contained within the Project Summary Report prepared by NEPCCO. A data table contained within the report indicates that groundwater samples were collected from the wells on 17 February 1987 and analyzed by an unknown laboratory for VOCs by EPA Methods 601 and 602. According to the data table, seven VOCs were detected in one or more of the observation wells at concentrations greater than the reference concentration. START personnel chose the groundwater sample collected from observation well OW-2 as the background location due to its minimal contamination. Detected concentrations ranged from 3 to 57 ppb.
The project report indicated that the recovery system was operational from 13 June 1996 until approximately 11 February 1987. According to the 1991 EPA SI report, the recovery and treatment system was shut down in the spring of 1987 at the request of NEPCCO due to decreased levels of VOCs detected in the influent groundwater samples collected from the recovery system. START personnel did not find any information indicating that the treated effluent ever exceeded discharge permit standards.
The hydrogeological investigation of the Arcade property was conducted by CEH during the summer 1985. On 18 July 1985, EFS collected groundwater samples from the eight groundwater monitoring wells (M-l through M-8) installed on the Arcade property. These samples were analyzed by RAI for VOCs (EPA Method 624), priority pollutant metals, barium, and total cyanide. The October 1985 CEH report indicated that the groundwater below the Arcade property contained detectable levels of four VOCs. Vinyl chloride, trans-1,2-dichloroethene, trichloroethene, and tetrachloroethene were detected in one or more of the monitoring well samples at concentrations greater than the reference concentration. START personnel chose the groundwater sample collected from monitoring well M-l as the background location due to its crossgradient location and its uncontaminated condition. Detected concentrations ranged from 10 ppb for trichloroethene (M-3) to 950 ppb for tetrachloroethene (M-6). Barium was also detected in several groundwater samples at concentrations three times greater than the barium concentration of the reference sample (M-l). Barium was present at the highest concentration (2,900 ppb) in the sample from monitoring well M-5.
Covitch Property / Former ATF Davidson Co. CERCLIS No. MAD046128559
25 6 March 1997

GROUNDWATER PATHWAY (Continued)
As a result of the detection of VOCs in the groundwater below the Arcade property, an additional round of groundwater samples were collected on 13 November 1985 and sent to RAI for VOC analysis by EPA Method 624. The groundwater samples were also analyzed by RAI for arsenic, barium, and zinc. The January 1986 CEH report indicated that some of the VOCs previously detected in several of the monitoring wells were not detected in the 13 November 1985 samples collected from the same wells. However, the January 1986 CEH report further indicated that the concentrations of vinyl chloride and trans-1,2-dichloroethene detected in monitoring well M-8 were increasing. The concentrations detected in the 13 November 1985 groundwater samples collected from monitoring well M-8 ranged from 380 ppb for vinyl chloride to 1,100 ppb for trans-1,2-dichloroethene. No VOCs were detected in the background sample (M-l) collected with the November 1985 groundwater samples. Barium and zinc were also detected at concentrations three times greater than reference sample (M-l) concentrations. Barium was present at the highest concentration (3,100 ppb) in the monitoring well M-5 sample. Zinc was also present at the highest concentration (11 ppb) in the M-5 sample.
A third round of groundwater samples were collected by CEH from the Arcade property on 24 January 1987, as part of an additional investigation of the area around monitoring well M-8. This investigation included the installation and sampling of three additional monitoring wells (M-9 through M-l l ) . The new wells were located radially in the vicinity of monitoring well M-8. The groundwater samples collected on 24 January 1987 were submitted to RAI for VOC analysis by EPA Method 624.
The March 1987 CEH report stated that only one of the newly installed wells (M-9) contained VOC contamination. Tetrachloroethene was detected in monitoring well M-9 at a concentration greater than the reference concentration. START personnel chose the groundwater sample collected from monitoring well M-10 as the background location due to its upgradient location and its uncontaminated condition. Tetrachloroethene was detected in M-9 at a concentration of 48 ppb. This compound had previously only been detected in monitoring well M-6.
The March 1987 report also stated that the concentrations of vinyl chloride (280 ppb) and trans-1,2-dichloroethene (640 ppb) detected in monitoring well M-8 were decreasing. In addition, trichloroethene was detected at 17 ppb in the March 1987 monitoring well M-8 groundwater sample. Trichloroethene had not been present in monitoring well M-8 prior to this sampling round.
In July 1987 CEH submitted a risk assessment report concerning the area around monitoring well M-8. This report stated that the VOC-contaminated plume covered approximately 13,100 square feet. CEH also theorized in the report that the plume consisted predominantly of a parent compound (trichloroethene) and two weathered species (vinyl chloride and trans-1,2-dichloroethene). The report further stated that the mass balance of chemical compounds present in monitoring well M-8 had shifted towards the weathered species. CEH attributed this to a long period of emplacement or an accelerated weathering process. The CEH report further stated that the chemicals were migrating towards the Mumford River where the contamination would ultimately be diluted, diminishing its impact on human health and the environment.
Covitch Property / Former ATF Davidson Co. CERCLIS No. MAD046128559
26 6 March 1997

GROUNDWATER PATHWAY (Continued)
There are approximately 19,466 people relying upon municipal drinking water wells located within 4-radial miles of the property. These wells are located in the towns of Douglas, Grafton, Northbridge, Sutton, and Uxbridge. The nearest municipal well is the Whitinsville Station located in Northbridge, Massachusetts. This well is located approximately 0.9 miles northwest of the property. The well is operated by the Whitinsville Water Company and serves approximately 2,814 people in the Town of Northbridge.
The population served by each municipal well was estimated by multiplying the average number of persons per household in each household by the approximate number of year-round water department accounts in each respective town. The average number of persons per household was obtained from 1990 U.S. Census data, and the approximate number of year-round water department accounts were obtained in telephone conversations with the respective town water departments.
Private groundwater supplies within 4-radial miles of the property were estimated using equal distribution calculations of U.S. Census CENTRACTS data identifying population, households, and private water wells for "Block Groups" which lie within or partially within individual radial distance rings of the property. According to the CENTRACTS report there are approximately 4,879 people relying upon private groundwater wells for drinking water purposes within 4-radial miles of the property. The Northbridge Board of Health and the Whitinsville Water Company were unable to provide information regarding the exact location of the nearest private well. The CENTRACTS report indicates that there are 16 people utilizing private wells within 0.25-radial miles of the property.
The following Tables summarize public and private groundwater usage within 4-Radial miles of the property.
Public Groundwater Supply Sources Within 4-Radial Miles of the Covitch Property /Former ATF Davidson Co. Property.
Distance/Direction from Site Source Name
Location of Source3
Estimated Population
Served Source Type"
0.9 miles Northwest Whitinsville Station Northbridge, MA 2,814 Unknown
1.9 miles Northwest Sutton Station Sutton, MA 6,056 Unknown
3.3 miles Southeast S. Main Street Wells (3) Uxbridge, MA 5,372* Unknown
3.4 miles Southwest West Street Well No. 2 Douglas, MA 1,162 Unknown
3.5 miles Southwest West Street Well No. 1 Douglas, MA 1,338 Unknown
3.7 miles North Providence Road Well Grafton, MA 918 Unknown
3.8 miles South-Southwest Putnam Hill Road Wells (3)
Sutton, MA 496* Unknown
3.9 miles Southeast Blackstone Street Wells (3)
Uxbridge, MA 1,310* Unknown
a Indicates Town in which well is located. b Overburden, Bedrock, or Unknown. •Combined total population served by the three wells.
Covitch Property / Former ATF Davidson Co. CERCLIS No. MAD046128559
27 6 March 1997
GROUNDWATER PATHWAY (Continued)
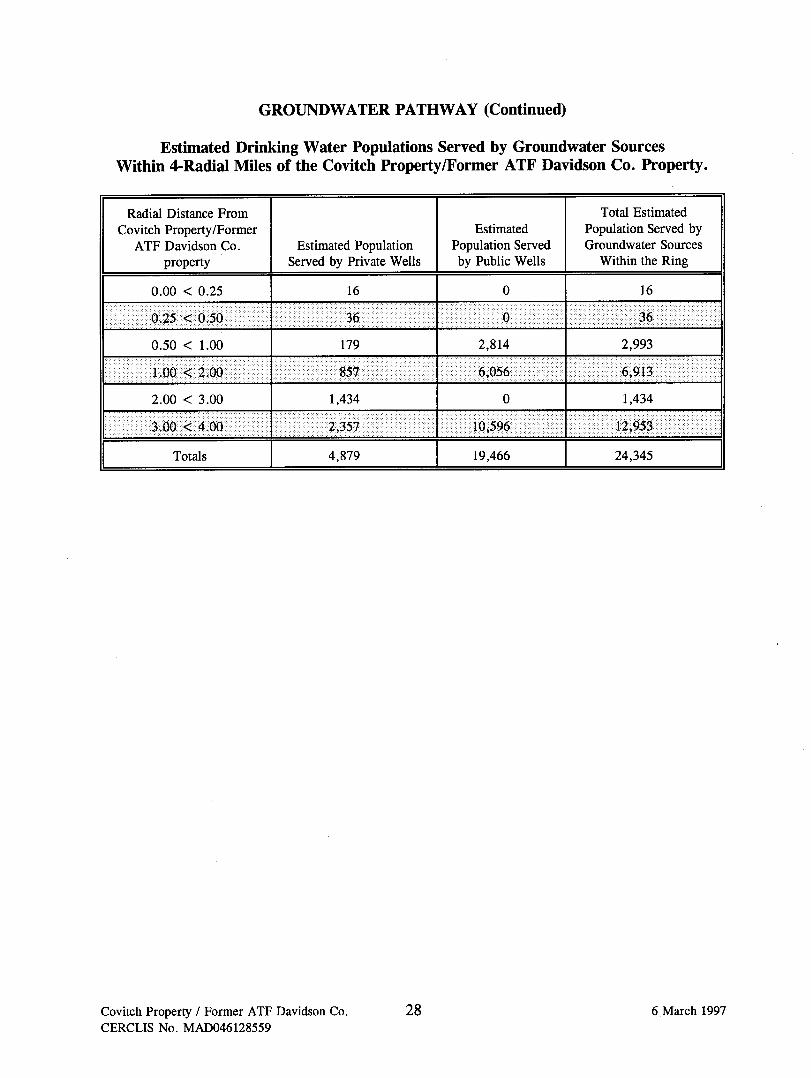
Estimated Drinking Water Populations Served by Groundwater Sources Within 4-Radial Miles of the Covitch Property/Former ATF Davidson Co. Property.
Radial Distance From Covitch Property/Former
ATF Davidson Co. property
0.00 < 0.25
0.25 < 0.50
0.50 < 1.00
1.00 < 2.00
2.00 < 3.00
3.00 < 4.00
Totals
Estimated Population Served by Private Wells
16
36 |
179
857
1,434
2,357
4,879
Estimated Population Served by Public Wells
0
2,814
6,056
0
10,596
19,466
Total Estimated Population Served by Groundwater Sources
Within the Ring
16
36
2,993
6,913
1,434
12,953
24,345
Covitch Property / Former ATF Davidson Co. CERCLIS No. MAD046128559
28 6 March 1997
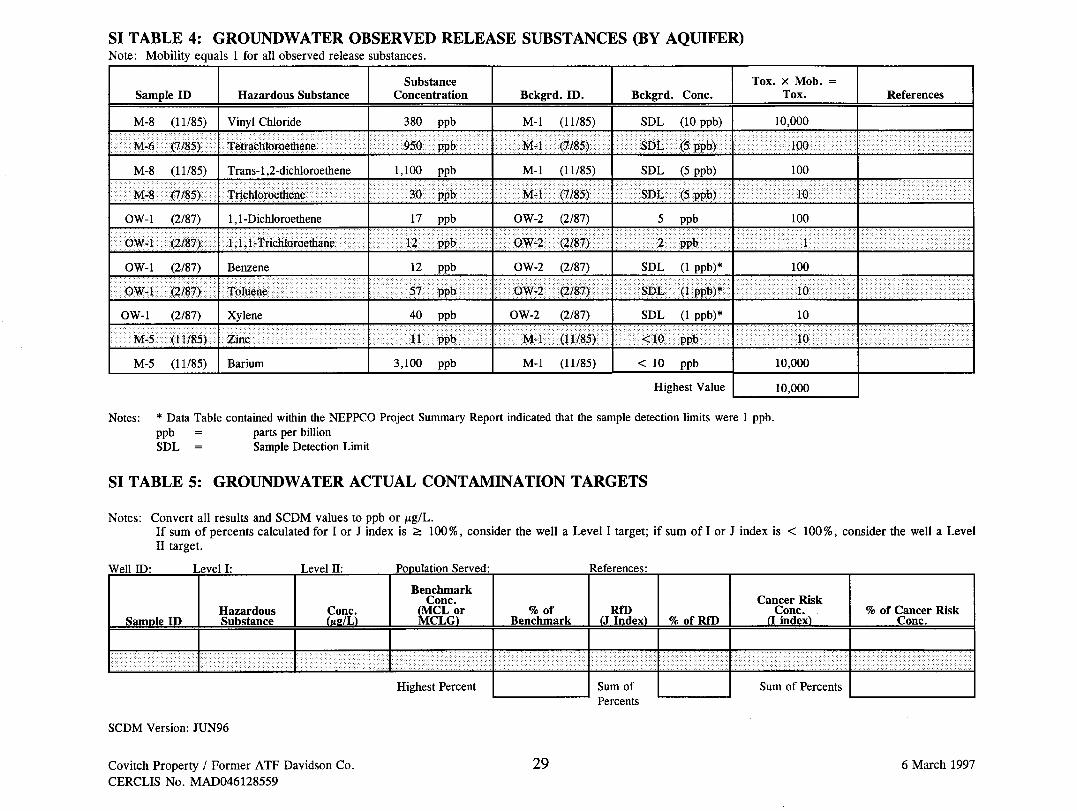
SI TABLE 4: GROUNDWATER OBSERVED RELEASE SUBSTANCES (BY AQUIFER) Note: Mobility equals 1 for all observed release substances.
Sample ID Hazardous Substance Substance
Concentration Bckgrd. D3. Bckgrd. Cone. Tox. x Mob.
Tox. References
M-8 (11/85) Vinyl Chloride 380 ppb M - l (11/85) SDL (10 ppb) 10,000
M-6 (7/85) Tetrachloroethene 950 ppb M - l (7/85) SDL (5 ppb) 100
M-8 (11/85) Trans-1,2-dichloroethene 1,100 ppb M - l (11/85) SDL (5 ppb) 100
M-8 (7/85) Trichloroethene 30 ppb M - l (7/85) SDL (5 ppb) 10
OW-1 (2/87) 1,1 -Dichloroethene 17 ppb OW-2 (2/87) PPb 100
OW-1 (2/87) 1, L1 -Trichloroethane 12 ppb OW-2 (2/87) 2 ppb
OW-1 (2/87) Benzene 12 ppb OW-2 (2/87) SDL (1 ppb)* 100
OW-1 (2/87) Toluene 57 ppb OW-2 (2/87) SDL (1 ppb)' 10
OW-1 (2/87) Xylene 40 ppb OW-2 (2/87) SDL (1 ppb)' 10
M-5 (11/85) Zinc 11 ppb M- l (11/85) < 10 ppb 10
M-5 (11/85) Barium 3,100 ppb M - l (11/85) < 10 ppb 10,000
Highest Value 10,000
Notes: * Data Table contained within the NEPPCO Project Summary Report indicated that the sample detection limits were 1 ppb. ppb = parts per billion SDL = Sample Detection Limit
SI TABLE 5: GROUNDWATER ACTUAL CONTAMINATION TARGETS
Notes: Convert all results and SCDM values to ppb or fig/L. I f sum of percents calculated for I or J index is > 100%, consider the well a Level I target; i f sum of I or J index is < 100%, consider the well a Level I I target.
Well ID: Level I : Level H: Population Served: References:
Sample ID Hazardous Substance
Cone. ( / j g / L )
Benchmark Cone.
(MCL or MCLG)
% of Benchmark
RfD (J Index) % of RfD
Cancer Risk Cone.
(I index) % of Cancer Risk
Cone.
Highest Percent Sum of Percents
Sum of Percents
SCDM Version: JUN96
Covitch Property / Former ATF Davidson Co. CERCLIS No. MAD046128559
29 6 March 1997
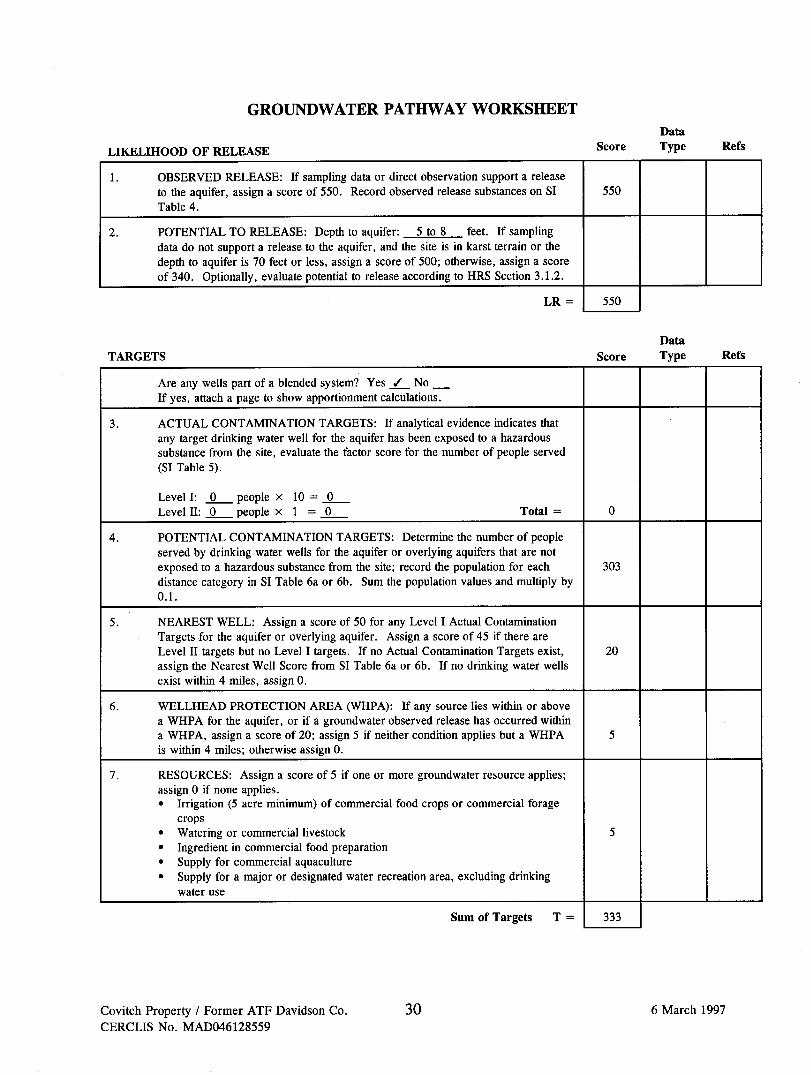
GROUNDWATER PATHWAY WORKSHEET
LIKELIHOOD OF RELEASE Score Data Type Refs
OBSERVED RELEASE: If sampling data or direct observation support a release to the aquifer, assign a score of 550. Record observed release substances on SI Table 4.
550
POTENTIAL TO RELEASE: Depth to aquifer: 5 to 8 feet. If sampling data do not support a release to the aquifer, and the site is in karst terrain or the depth to aquifer is 70 feet or less, assign a score of 500; otherwise, assign a score of 340. Optionally, evaluate potential to release according to HRS Section 3.1.2.
LR = 550
TARGETS Score Data Type Refs
No Are any wells part of a blended system? Yes / If yes, attach a page to show apportionment calculations.
ACTUAL CONTAMINATION TARGETS: If analytical evidence indicates that any target drinking water well for the aquifer has been exposed to a hazardous substance from the site, evaluate the factor score for the number of people served (SI Table 5).
Level I : Level I I :
0 0 0
people x 10 = _ people x 1 = _0 Total =
POTENTIAL CONTAMINATION TARGETS: Determine the number of people served by drinking water wells for the aquifer or overlying aquifers that are not exposed to a hazardous substance from the site; record the population for each distance category in SI Table 6a or 6b. Sum the population values and multiply by 0.1.
303
NEAREST WELL: Assign a score of 50 for any Level I Actual Contamination Targets for the aquifer or overlying aquifer. Assign a score of 45 if there are Level I I targets but no Level I targets. If no Actual Contamination Targets exist, assign the Nearest Well Score from SI Table 6a or 6b. If no drinking water wells exist within 4 miles, assign 0.
20
WELLHEAD PROTECTION AREA (WHPA): If any source lies within or above a WHPA for the aquifer, or if a groundwater observed release has occurred within a WHPA, assign a score of 20; assign 5 if neither condition applies but a WHPA is within 4 miles; otherwise assign 0.
RESOURCES: Assign a score of 5 if one or more groundwater resource applies; assign 0 if none applies. • Irrigation (5 acre minimum) of commercial food crops or commercial forage
crops • Watering or commercial livestock • Ingredient in commercial food preparation • Supply for commercial aquaculture • Supply for a major or designated water recreation area, excluding drinking
water use
Sum of Targets T = 333
Covitch Property / Former ATF Davidson Co. CERCLIS No. MAD046128559
30 6 March 1997
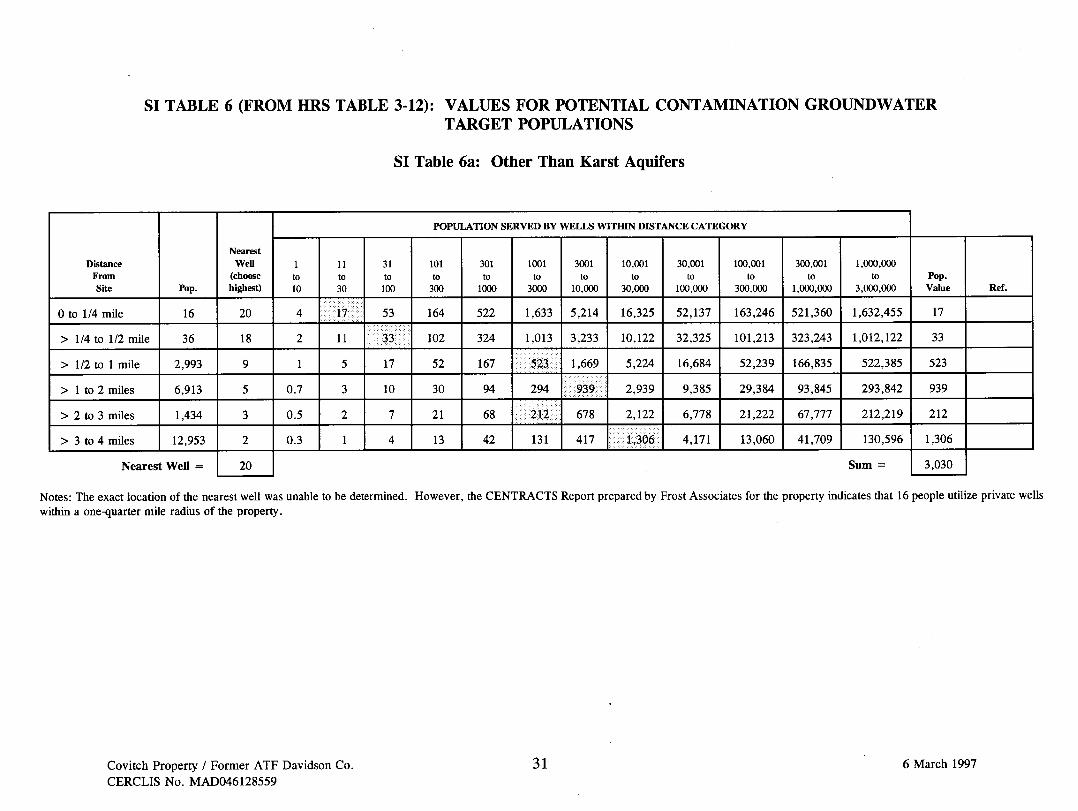
SI TABLE 6 (FROM HRS TABLE 3-12): VALUES FOR POTENTIAL CONTAMINATION GROUNDWATER TARGET POPULATIONS
SI Table 6a: Other Than Karst Aquifers
Distance From Site Pop.
Nearest Well
(choose highest)
POPULATION SERVED BY WELLS WITHIN DISTANCE CATEGORY
1 to 10
11 to 30
31 to 100
101 to
300
301 to
1000
1001 to
3000
3001 to
10,000
10,001 to
30,000
30,001 to
100,000
100,001 to
300,000
300,001 to
1,000,000
1,000,000 to
3,000,000 Pop. Value Ref.
0 to 1/4 mile 16 20 17 53 164 522 1,633 5,214 16,325 52,137 163,246 521,360 1,632,455 17
> 1/4 to 1/2 mile 36 18 11 33 102 324 1,013 3,233 10,122 32,325 101,213 323,243 1,012,122 33
> 1/2 to 1 mile 2,993 17 52 167 523 1,669 5,224 16,684 52,239 166,835 522,385 523
> 1 to 2 miles 6,913 0.7 10 30 94 294 939 2,939 9,385 29,384 93,845 293,842 939
> 2 to 3 miles 1,434 0.5 21 68 212 678 2,122 6,778 21,222 67,777 212,219 212
> 3 to 4 miles 12,953 0.3 13 42 131 417 1,306 4,171 13,060 41,709 130,596 1,306
Nearest Well = 20 Sum = 3,030
Notes: The exact location of the nearest well was unable to be determined. However, the CENTRACTS Report prepared by Frost Associates for the property indicates that 16 people utilize private wells within a one-quarter mile radius of the property.
Covitch Property / Former ATF Davidson Co. CERCLIS No. MAD046128559
31 6 March 1997

SI TABLE 6 (FROM HRS TABLE 3-12): VALUES FOR POTENTIAL CONTAMINATION GROUNDWATER TARGET POPULATIONS (Continued)
SI Table 6b: Karst Aquifers
Distance From Site Pop.
Nearest Well
(choose highest)
POPULATION SERVED BY WELLS WITHIN DISTANCE CATEGORY
11 to 30
31 to 100
101 to
300
301 to
1000
1001 to
3000
3001 to
10,000
10,001 to
30,000
30,001 to
100,000
100,001 to
300,000
300,001 to
1,000,000
1,000,000 to
3,000,000 Pop. Value
0 to 1/4 mile 20 17 53 164 522 1,633 5,214 16,325 52,137 163,246 521,360 1,632,455
> 1/4 to 1/2 mile 20 11 33 102 324 1,013 3,233 10,122 32,325 101,213 323,243 1,012,122
> 1/2 to 1 mile 20 26 82 261 817 2,607 8,163 26,068 81,623 260,680 816,227
> 1 to 2 miles 20 26 82 261 817 2,607 8,163 26,068 81,623 260,680 816,227
>2 to 3 miles 20 26 82 261 817 2,607 8,163 26,068 81,623 260,680 816,227
> 3 to 4 miles 20 26 82 261 817 2,607 8,163 26,068 81,623 260,680 816,227
Nearest Well = Sum =
Covitch Property / Former ATF Davidson Co. CERCLIS No. MAD046128559
32 6 March 1997

GROUNDWATER PATHWAY WORKSHEET (Concluded)
WASTE CHARACTERISTICS Score Data Type
Does Not Apply
If any Actual Contamination Targets exist for the aquifer or overlying aquifers, assign the calculated hazardous waste quantity score or a score of 100, whichever is greater; if no Actual Contamination Targets exist, assign the hazardous waste quantity score calculated for sources available to migrate to groundwater.
100
Assign the highest groundwater toxicity/mobility value from SI Table 3 or 4.
Substance(s): Vinyl Chloride Barium
Value:
From Table:
10,000 10.000
Tetrachloroethene
100 10,000
10. Multiply the groundwater toxicity/mobility and hazardous waste quantity scores. Assign the Waste Characteristics score from the table below: (from HRS Table 2-7)
Product
>0 to <10
> 10 to < 100
> 100 to < 1,000
> 1,000 to < 10,000
> 10,000 to <lE+05
>lE+05 to < lE+06
>lE+06 to < lE+07
>lE+07 to < lE+08
>lE+08 or greater
WC Score
10
18
32
56
100
*check (•") the WC score calculated for the pathway
WC = 32
Multiply LR by T and by WC. Divide the product by 82,500 to obtain the groundwater pathway score for each aquifer. Select the highest aquifer score. If the pathway score is greater than 100, assign 100.
GROUNDWATER PATHWAY CALCULATION: LR x T x WC 82,500
Notes: (Maximum of 100) Calculation: (550 x 333 x 32) -s- 82,500 = 71.04
Covitch Property / Former ATF Davidson Co.
CERCLIS No. MAD046128559 33 6 March 1997
SURFACE WATER PATHWAY
Pathway Description and Scoring Notes: Describe the Surface Water Migration Pathway. Identify the nearest source area with non-zero containment for the Surface Water Pathway and the location of the PPE. Include the length of the overland segment. Describe the in-water segment up to the target distance limit noting the stream flow characteristics of each reach and the locations of drinking water intakes, fisheries and sensitive environments along the 15-mile pathway.
Briefly discuss any sampling events relative to the Surface Water Pathway; provide dates of sampling events and a summary of the analytical results and whether an observed release and/or actual contamination targets were documented.
Indicate any assumptions you have made in scoring the Surface Water Pathway for this site, or any factors which influenced your scoring rationale.
Note: If a site has more than one watershed or has both overland/flood and groundwater to surface water migration potential, document each scenario and use the higher scoring water shed/migration route to calculate the surface water migration pathway score. Provide a summary of the scores for all other watershed/migration routes.
The property is primarily located along the northern shore of the Mumford River, bordering the river for approximately 1.1 miles. There is also a land parcel located along the southern shore of the river which is associated with the property. A paved parking area (eastern extent) and an unpaved area used to store piles of renovation debris (western extent) border the southern shore of the Mumford River. A dam, owned by WRT, is located between the Covitch property on the northern shore and the parking lot on the southern shore. The impoundment reservoir created by this dam is referred to as Meadow Pond. The property is located in portions of both the 100-year and 500-year floodplain.
This length of the Mumford River frontage contains numerous Probable Point of Entry (PPE) areas. There are various discharge pipes and drainage swales located along the northern shore of the Mumford River. For this evaluation, the most-upstream PPE area is the western extent of the filled area containing spent foundry sand and other materials. The most downstream PPE area is the Raceway outfall below the dam. This has the consequence of extending the 15-mile downstream surface water pathway (downstream pathway) for an additional mile.
The downstream pathway includes flow along the Mumford River for approximately 4.5 miles until its convergence with the Blackstone River and flow for approximately 10.5 miles along the Blackstone River, until the 15-mile terminus is reached in Woonsocket, Rhode Island. The Mumford River flows through several ponds including Meadow Pond, Linwood Pond, Whitin Pond, Caprons Pond, and several unnamed ponds prior to converging with the Blackstone River. The mean annual flowrate of the Mumford River is approximately 45 cubic feet per second (cfs) and the mean annual flowrate of the Blackstone River is 433 cfs.
There are no known municipal drinking water intakes located along the downstream pathway. However, a surface water intake, used for the irrigation of commercial food crops at the Sherman-Baker Farm, is located along the Mumford River in North Uxbridge, Massachusetts. The surface water intake is approximately 2 miles downstream of the large dam on the Covitch property.
Covitch Property / Former ATF Davidson Co. CERCLIS No. MAD046128559
34 6 March 1997

SURFACE WATER PATHWAY (Continued)
There are no sensitive environments located along the approximately 1.1 miles of Mumford River frontage which bisects the property. The nearest sensitive environment is an approximate 6-acre Palustrine forested wetland located approximately 0.8 miles downstream of the property. There are approximately 2.86 miles of wetland frontage along the Mumford River portion of the downstream pathway and approximately 5.44 miles of wetland frontage along the Blackstone River portion of the downstream pathway. There are two occurrences of State-listed Species of Concern along the Mumford River portion of the downstream pathway. Along the Blackstone River portion of the downstream pathway, there are two occurrences of State-listed Threatened/Endangered Species and six occurrences of State-listed Species of Concern.
Visual evidence observed during the START on-site reconnaissance indicates that the Mumford River is a recreational fishery. The evidence consisted of a handwritten sign on the property pointing out a good fishing location and a number of fishing poles which were utilized by WRT personnel. Also, the representative of WRT indicated that employees of the businesses located on the property often fish from the northern shore of the Mumford River during their lunch periods. START personnel assume for this evaluation that the Blackstone River is a recreational fishery, as well.
The Covitch property has operated as a large industrial mill complex since the 1800s. Several of the manufacturing processes carried out within the mill complex have potentially impacted the Mumford River. A large foundry operated on the property through approximately the mid-1970s. Foundry wastes were mixed with spent foundry sand and disposed of by landfilling the material on the property and grading the material into the river. As a result of this disposal practice a channel within the river was filled; connecting a small island to the northern shore of the river. The 1991 EPA SI report for the property details the landfilled material as consisting of 90% spent foundry sand, 5% coal ash, and 5% paint, plating sludge, plating rinsewater, bromide salt baths, solvents and cutting oils. According to the 1985 CEH report, approximately 3,200 feet of river frontage on the property consisted of filled material. Additionally, the 1991 EPA SI report indicated that the filled area contained approximately 40,000 cubic yards of material in an area of approximately 730,000 square feet.
The 1991 EPA SI report for the property stated that untreated electroplating wastewater had been discharged to the Mumford River from the property between 1930 to 1965. According to the EPA SI report, an on-site wastewater treatment plant was installed on the property in 1965 and treated wastewater was discharged to the Mumford River from 1965 until September 1982. Between 1974 and 1982 discharge of treated wastewater was carried out under a NPDES permit (No. MA0001252). The 1991 EPA SI report indicated that the wastewater treatment plant ceased operations in September 1982. The SI report did not indicate why operations ceased. The present owners of the property were unable to provide any additional information concerning the discharge of industrial wastewater to the Mumford River. START personnel were unable to find any additional information concerning the discharge of treated or untreated wastewater to the Mumford River.
Covitch Property / Former ATF Davidson Co. CERCLIS No. MAD046128559
35 6 March 1997

SURFACE WATER PATHWAY (Continued)
An additional area associated with the on-site mill complex, which has potentially impacted the Mumford River/Meadow Pond is the Raceway located on the Covitch property. The Raceway was used for on-site power generation for manufacturing operations during the 1800s. Water from the impoundment reservoir, created by the on-site dam, was diverted inland under several of the on-site buildings via the Raceway. This water was used to directly power manufacturing equipment. The water was then discharged back to the Mumford River below the dam. The Raceway was later used to generate electricity in an on-site power plant.
In April 1985, an oily sheen was observed by an unknown party on the surface of the water in the Raceway. This discovery led to the CEH hydrogeological investigation of the Covitch property. In the September 1985 CEH report it was determined that the sheen observed in the Raceway was the result of draining metal turnings outside between Building No. 9 and the Raceway. No record of surface water or sediment samples being collected from the Raceway or the Mumford River as a result of the oily sheen could be found by START personnel.
In spring 1985, MA DEQE requested that a hydrogeological investigation be completed for the Arcade property. WCI retained CEH to collect five benthic core/sediment samples from the Mumford River/Meadow Pond. The sediment samples were collected from the Mumford River on 18 July 1985 by representatives of CEH. These samples were analyzed for priority pollutant metals and barium by RAI between 23 July 1985 and 12 August 1985. Results of the analyses indicated that there were high levels of several metals in the sediments of the Mumford River. Cadmium, chromium, copper, lead, nickel, and zinc were all detected at more than three times the concentration in the upstream reference sample. The concentrations of these metals ranged from 1.9 parts per million (ppm) for cadmium to 920 ppm for zinc.
Additional sediment samples were collected from the Mumford River on 13 November 1985 by representatives of CEH. Eleven sediment samples were collected and sent to RAI for analysis during this sampling round. The samples were analyzed for chromium via EPA Method 3050. The samples were also subjected to an Extraction Procedure for Toxicity (EP Toxicity) test for chromium. Results of the Method 3050 analyses indicated that chromium concentrations ranged from 49 to 2,300 ppm. No background (reference) sample was collected for the summer 1985 sediment sampling event.
CEH reported that the EP Toxicity results indicated that a retardation agent was affecting the mobility of the chromium present in the river bottom sediments. CEH based this on the fact that even though chromium was detected via EPA Method 3050 procedures, virtually none of the chromium was extractable.
The 1985 metals analyses conducted on the river bottom sediments will not be used for this evaluation. No analytical evidence has been found by START personnel, to date, that links the metals found in the river bottom sediment samples to materials utilized on the property.
Covitch Property / Former ATF Davidson Co. CERCLIS No. MAD046128559
36 6 March 1997

MUMFORD RIVER (45 CFS)
. WHITIN ± \ ± POND
SURFACE WATER INTAKE -(IRRIGATION)
NORTH UXBRIDGE
CAPRONS POND
si RICE CITY POND
BLACKSTONE RIVER (100-1OOO CFS)
4.5 MILES
UNNAMED POND
STATE-UNE
BLACKSTONE RIVER (100-1000 CFS)
SOURCE: USGS BOSTON, MASSACHUSETTS 1:100,000 1:100,000 SCALE TOPOGRAPHIC MAP, 1989
NOT TO SCALE 15 MILE TERMINUS
LEGEND
±
FISHERY
WETLAND
F======j SURFACE WATER
FLOW DIRECTION
PROBABLE POINT OF ENTRY
SURFACE WATER PATHWAY COVITCH PROPERTY
FORMER ATF DAVIDSON CO. MAIN STREET
NORTHBRIDGE, MASSACHUSETTS
MANAGERS DESIGNERS/CONSULTANTS
REGION I SUPERFUND TECHNICAL ASSESSMENT AND RESPONSE TEAM
TDD #
95-07-0065 DRAWN BY:
T. CAMPBELL FILE NAME:
S:\95070065\FIG3.DWG
DATE
" 6 / 1 9 / 9 6
FIGURE 5
Covitch Property / Former ATF Davidson Co. CERCLIS No. MAD046128559
37 6 March 1997

SI TABLE 7: SURFACE WATER OBSERVED RELEASE SUBSTANCES List all substances that meet the criteria for an observed release to surface water; however do not eliminate a substance from this table if it has a BCF of less than 500.
Sample ID Hazardous Substance Substance
Concentration Bckgrd.
ID. Bckgrd. Cone.
BCF HRS Table
4-15 Toxicity X Persistence
Toxicity x Persis. x Bioaccum
Ecotoxicity X Persis. x
Ecobioaccum References
Highest Values
Notes: There are no known Surface Water Observed Release Substances associated with the property.
SI TABLE 8: SURFACE WATER DRINKING WATER ACTUAL CONTAMINATION TARGETS Notes: Convert all results and SCDM values to ppb or ug/L.
If sum of percents calculated for I or J index is _> 100 percent, consider the intake a Level I target; if sum of I or J index is < 100 percent consider the intake a Level II target.
Intake ID: Sample Type: Level I : Level II Population Served: References:
Sample ID Hazardous Substance
Cone. 0*g/L)
Benchmark Cone.
(MCL or MCLG)
% of Benchmark
RfD (J Index) % of RfD
Cancer Risk Cone.
(I index) % of Cancer Risk Cone.
Highest Percent Sum of Percents
Sum of Percents
SCDM Version: JUN96 Notes: There are no known Surface Water Drinking Water Actual Contamination Target samples associated with the property.
Covitch Property / Former ATF Davidson Co. CERCLIS No. MAD046128559
38 6 March 1997

SURFACE WATER PATHWAY L I K E L I H O O D O F R E L E A S E AND DRINKING W A T E R T H R E A T W O R K S H E E T
LIKELIHOOD OF RELEASE -OVERLAND/FLOOD MIGRATION
Data Score Type Refs
OBSERVED RELEASE: If sampling data or direct observation support a release to surface water in the watershed, assign a score of 550. Record observed release substances on SI Table 7.
500
POTENTIAL TO RELEASE: Distance to surface water: . < 50 (feet) If sampling data do not support a release to surface water in the watershed, use the table below to assign a score from the table below based on distance to surface water and flood frequency.
Distance to surface water <2500 feet
Distance to surface water >2500 feet, and:
Site in annual or 10-yr floodplain
Site in 100-yr floodplain
Site in 500-yr floodplain
Site outside 500-yr floodplain
500
500
400
300
100
Optionally, evaluate surface water potential to release according to HRS Section 4.1.2.1.2
LR = 500
LIKELIHOOD OF RELEASE -GROUNDWATER TO SURFACE WATER MIGRATION Score
Data Type Refs
NOTE:
1)
2)
3)
OBSERVED RELEASE: If sampling data or direct observation support a release to surface water in the watershed, assign a score of 550. Record observed release substances on SI Table 7.
Evaluate groundwater to surface water migration only for a surface water body that meets all of the following conditions:
A portion of the surface water is within 1 mile of site sources having a containment factor greater than 0. No aquifer discontinuity is established between the source and the above portion of the surface water body. The top of the uppermost aquifer is at or above the bottom of the surface water. Elevation of top of uppermost aquifer: Elevation of bottom of surface water body:
500
POTENTIAL TO RELEASE: Depth to aquifer: feet. If sampling data do not support a release to the aquifer, and the site is in karst terrain or the depth to aquifer is 70 feet or less assign a score of 500: otherwise assign a score of 340. Optionally, evaluate potential to release according to HRS Section 3.1.2.
LR = 500
Notes: Both the Overland/Flood Migration and the Groundwater to Surface Water Migration Pathways yield a likelihood of release score of 500. The Overland/Flood will be used as this is the more likely pathway due to the close proximity of the Mumford River.
Covitch Property / Former ATF Davidson Co. CERCLIS No. MAD046128559
39 6 March 1997

SURFACE WATER PATHWAY LIKELIHOOD OF RELEASE AND DRINKING WATER THREAT WORKSHEET
(Continued)
Data DRINKING WATER THREAT TARGETS Score Type Refs
Record the water body type, flow, and number of people served by each drinking water intake within the distance limit in the watershed. If there is no drinking water intake within the target distance limit, assign 0 to factors 3, 4, and 5.
Intake Name Water Body
Type Flow People Served
N/A
Are any intakes part of a blended system? Yes No If yes, attach a page to show appointment calculations.
3. ACTUAL CONTAMINATION TARGETS: If analytical evidence indicates a drinking water intake has been exposed to a hazardous substance from the site, list the intake name and evaluate the factor score for the drinking water population (SI Table 8).
Level I : Level I I :
0 0
people x people x
0 10 = _ 1 = 0 Total =
4. POTENTIAL CONTAMINATION TARGETS: Determine the number of people served by drinking water intakes for the watershed that have not been exposed to a hazardous substance from the site. Assign the population values from SI Table 9. Sum the values and multiply by 0.1.
5. NEAREST INTAKE: Assign a score of 50 for any Level I Actual Contamination Drinking Water Targets for the watershed. Assign a score of 45 if there are Level I I targets for the watershed, but no Level I targets. If no Actual Contamination Drinking Water Targets exist, assign a score for the intake nearest the PPE from SI Table 9. If no drinking water intakes exist, assign 0.
6. RESOURCES: Assign a score of 5 if one or more surface water resource applies; assign 0 if none applies. • Irrigation (5 acre minimum) of commercial food crops or
commercial forage crops • Watering of commercial livestock • Ingredient in commercial food preparation • Major or designated water recreation area, excluding
drinking water use.
Sum of Targets T =
Notes: The Sherman-Baker Farm located in North Uxbridge, Massachusetts utilizes water drawn from the Mumford River to irrigate food crops.
Covitch Property / Former ATF Davidson Co. CERCLIS No. MAD046128559
40 6 March 1997
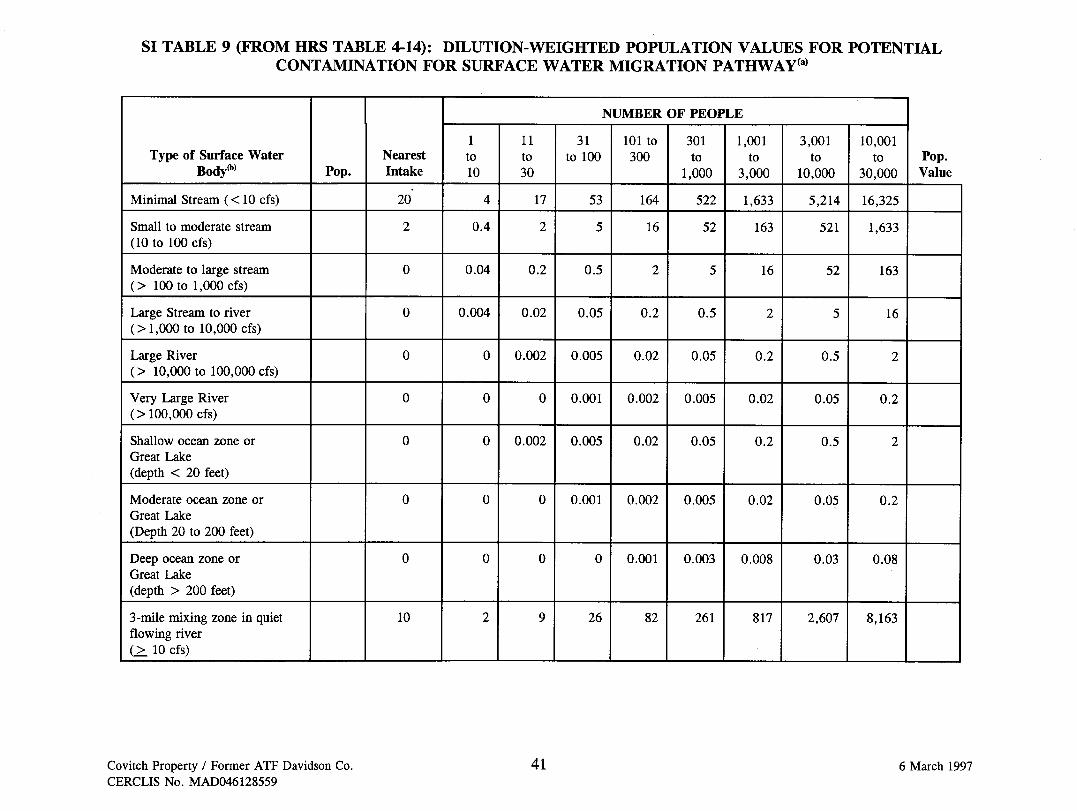
SI TABLE 9 (FROM HRS TABLE 4-14): DILUTION-WEIGHTED POPULATION VALUES FOR POTENTIAL CONTAMINATION FOR SURFACE WATER MIGRATION PATHWAY(a)
Type of Surface Water Body™ Pop.
Nearest Intake
NUMBER OF PEOPLE
1 to 10
11 to 30
31 to 100
101 to 300
301 to
1,000
1,001 to
3,000
3,001 to
10,000
10,001 to
30,000
Minimal Stream ( < 10 cfs) 20 17 53 164 522 1,633 5,214 16,325
Small to moderate stream (10 to 100 cfs)
0.4 16 52 163 521 1,633
Moderate to large stream ( > 100 to 1,000 cfs)
0.04 0.2 0.5 16 52 163
Large Stream to river ( > 1,000 to 10,000 cfs)
0.004 0.02 0.05 0.2 0.5 16
Large River ( > 10,000 to 100,000 cfs)
0.002 0.005 0.02 0.05 0.2 0.5
Very Large River ( > 100,000 cfs)
0.001 0.002 0.005 0.02 0.05 0.2
Shallow ocean zone or Great Lake (depth < 20 feet)
0.002 0.005 0.02 0.05 0.2 0.5
Moderate ocean zone or Great Lake (Depth 20 to 200 feet)
0.001 0.002 0.005 0.02 0.05 0.2
Deep ocean zone or Great Lake (depth > 200 feet)
0.001 0.003 0.008 0.03 0.08
3-mile mixing zone in quiet flowing river C> 10 cfs)
10 26 82 261 817 2,607 8,163
Covitch Property / Former ATF Davidson Co. CERCLIS No. MAD046128559
41 6 March 1997
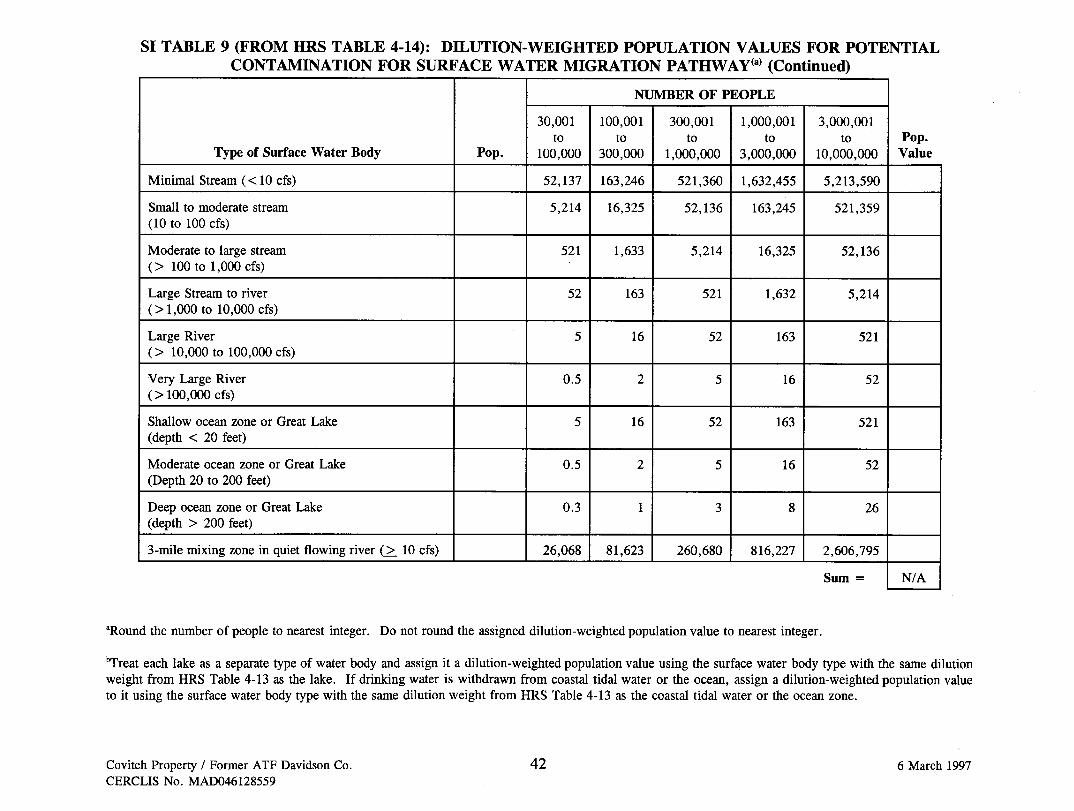
SI TABLE 9 (FROM HRS TABLE 4-14): DILUTION-WEIGHTED POPULATION VALUES FOR POTENTIAL CONTAMINATION FOR SURFACE WATER MIGRATION PATHWAY(a) (Continued)
Type of Surface Water Body Pop.
NUMBER OF PEOPLE
30,001 to
100,000
100,001 to
300,000
300,001 to
1,000,000
1,000,001 to
3,000,000
3,000,001 to
10,000,000 Pop.
Value
Minimal Stream ( < 10 cfs) 52,137 163,246 521,360 1,632,455 5,213,590
Small to moderate stream (10 to 100 cfs)
5,214 16,325 52,136 163,245 521,359
Moderate to large stream ( > 100 to 1,000 cfs)
521 1,633 5,214 16,325 52,136
Large Stream to river ( > 1,000 to 10,000 cfs)
52 163 521 1,632 5,214
Large River ( > 10,000 to 100,000 cfs)
16 52 163 521
Very Large River ( > 100,000 cfs)
0.5 16 52
Shallow ocean zone or Great Lake (depth < 20 feet)
16 52 163 521
Moderate ocean zone or Great Lake (Depth 20 to 200 feet)
0.5 16 52
Deep ocean zone or Great Lake (depth > 200 feet)
0.3 26
3-mile mixing zone in quiet flowing river (>_ 10 cfs) 26,068 81,623 260,680 816,227 2,606,795
Sum = N/A
"Round the number of people to nearest integer. Do not round the assigned dilution-weighted population value to nearest integer.
bTreat each lake as a separate type of water body and assign it a dilution-weighted population value using the surface water body type with the same dilution weight from HRS Table 4-13 as the lake. If drinking water is withdrawn from coastal tidal water or the ocean, assign a dilution-weighted population value to it using the surface water body type with the same dilution weight from HRS Table 4-13 as the coastal tidal water or the ocean zone.
Covitch Property / Former ATF Davidson Co. CERCLIS No. MAD046128559
42 6 March 1997

SI TABLE 10: HUMAN FOOD CHAIN ACTUAL CONTAMINATION TARGETS FOR WATERSHED Notes: Convert all results and SCDM values to jtxg/kg or ppb.
If sum of percents calculated for I or J index is _> 100%, consider the fishery a Level I target; if sum of I or J index is < 100 percent consider the fishery a Level II target. List only those substances that meet the observed release criteria in a fishery within the target distance limit and have a BCF of _> 500; BCF values are found on SI Table 7.
Fishery ID: Sample Type: Level I : Level II: References:
Sample ID Hazardous Substance Cone. (Mg/kg)
Benchmark Cone. (FDAAL)
% of Benchmark
RfD (J index) % of RfD
Cancer Risk Cone.
(I index)
of Cancer Risk Cone.
Highest Percent
Notes: There are no known Human Food Chain Actual Contamination Target samples for the property.
Sum of Percents
Sum of Percents
SI TABLE 11: SENSITIVE ENVIRONMENT ACTUAL CONTAMINATION TARGETS FOR WATERSHED Notes: Convert all results and SCDM values to ug/L or ppb.
If the highest % of benchmark calculated is _> 100%, consider the sensitive env. a Level I target; if the highest % of benchmark calculated is < 100% consider the sensitive env. a Level II target.
Environment ID: Sample Type: Level I : Level II: Environment Value:
Sample ID Hazardous Substance Cone. 0*g/L)
Benchmark Cone. (AWQC or AALAC)
% of Benchmark References
Highest Percent SCDM Version: JUN96 Notes: There are no known Sensitive Environment Actual Contamination Target samples associated with the property.
Covitch Property / Former ATF Davidson Co. CERCLIS No. MAD046128559
43 6 March 1997

SURFACE WATER PATHWAY (Continued) HUMAN FOOD CHAIN THREAT WORKSHEET
HUMAN FOOD CHAIN THREAT TARGETS Score Data Type Refs
Record the water body type and flow for each fishery within the target distance limit. If there is no fishery within the target distance limit, assign a score of 0 at the bottom of this page.
Fishery Name: Mumford River Water Body: Small to moderate stream Flow: 45 cfs Species: Unknown Production: Unknown lbs/yr Species: Production: lbs/yr
Fishery Name: Blackstone Riv. Water Body: Moderate to large stream Flow: 433 cfs Species: Unknown Production: Unknown lbs/yr Species: Production: lbs/yr
FOOD CHAIN INDrVTDUAL (Select highest value)
7. ACTUAL CONTAMINATION FISHERIES:
Assign 50 points for a Level I fishery only if tissue samples document an observed release of a substance with a BCF J> 500 to a fishery within the target distance limit (SI Table 10). List substance(s): .
Assign 45 points for a Level I I fishery if surface water/sediment samples document an observed release of a substance with a BCF _> 500 to a fishery within the target distance limit (SI Table 10). List substance(s): .
8. POTENTIAL CONTAMINATION FISHERIES:
Assign 20 points for a potential fishery if there is an observed release of a substance with a BCF _> 500 (SI Table 7) to a watershed containing fisheries within the target distance limit, but no Level I or Level I I fisheries are scored because there is no fishery documented between the PPE and the most downstream observed release sample point.
If there is no observed release of a substance with a BCF _> 500 to a watershed, assign a value for potential contamination fisheries from the table below using the lowest flow of all fisheries within the target distance limit.
Lowest Flow
< 10 cfs
10 to 100 cfs
> 100 cfs, coastal tidal waters, oceans, or Great Lakes
3-mile mixing zone in quiet flowing river
FCI Value
20
10
FCI Value =
Notes: Targets T =
Covitch Property / Former ATF Davidson Co. CERCLIS No. MAD046128559
44 6 March 1997

SURFACE WATER PATHWAY (Continued) ENVIRONMENTAL T H R E A T W O R K S H E E T
When measuring length of wetlands that are located on both sides of a surface water body, sum both frontage lengths. For a sensitive environment that is more than one type, assign a value for each type.
ENVIRONMENTAL THREAT TARGETS Score Data Type Refs
Record the water body and flow for each surface water sensitive environment within the target distance limit (see SI Table 12). If there is no sensitive environment within the target distance limit, assign a score of 0 at the bottom of the page.
Environment Type (SI Table 13) Water Body Name Flow
Wetlands (2.86 miles) CWA Waterbody State Cone. Species Wetlands (5.44 miles) State Cone. Species State Threat/Endg. Species
Mumford River Mumford River Mumford River Blackstone River Blackstone River Blackstone River
45 cfs 45 cfs 45 cfs
100-1,000 cfs 100-1,000 cfs 100-1,000 cfs
9. ACTUAL CONTAMINATION SENSITIVE ENVIRONMENTS: If sampling data or direct observation indicate any sensitive environment has been exposed to a hazardous substance from the site, record this information on SI Table 11, and assign a factor value for the environment (SI Tables 13 and 14).
Substance(s):
From Table:
Environment Type
(SI Table 13) Environment Value (SI
Tables 13 & 14) Multiplier (10 for Level
I , 1 for Level II) Product
Sum =
10. POTENTIAL CONTAMINATION SENSITIVE ENVIRONMENTS:
Flow
45 cfs
45 cfs
45 cfs
100-1,000 cfs
100-1,000 cfs
100-1,000 cfs
Dilution weight (SI Table 12)
0.1 X
0.1 x
0.1 x
0.01 x
0.01 x
0.01 X
Environment Type and Value (SI Tables 13 &
14)
2.86 mi. of wetlands: 75 X
2 occurrences of (A) 2(25) x
CWA (5) X
5.44 mi. of wetlands: 150 x
6 occurrences of (A): 6(25) x
2 occurrences of (B): 2(50) x
Pot. Cont.
0.1 =
0.1 =
0.1 =
0.1 =
0.1 =
0.1 =
Product
0.75
0.50
0.05
0.15
0.15
0.10
Sum = 1.7
1.7 Sum of Targets T = Notes: (A): Particular areas, small in size, important to the maintenance of unique biotic communities (State concerned species); Value= 25/ occurrence.
(B): State-listed Endangered Species; Value= 50/occurrence. CWA = Clean Water Act.
Covitch Property / Former ATF Davidson Co. CERCLIS No. MAD046128559
45 6 March 1997
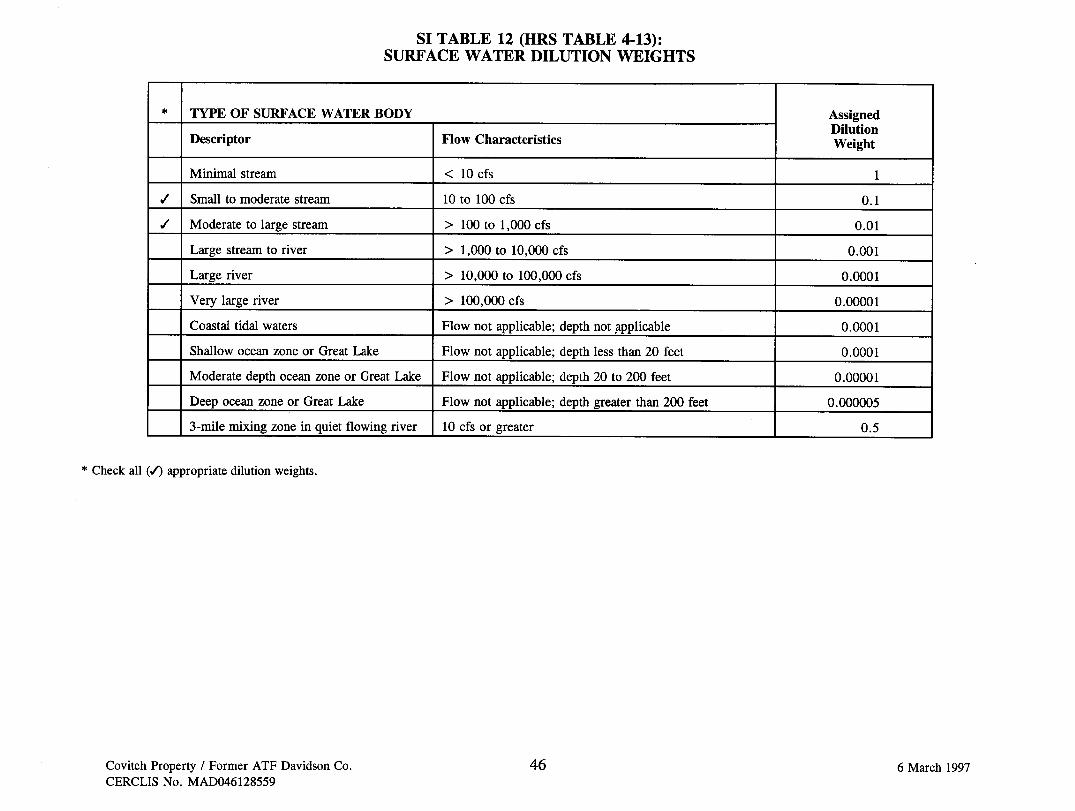
SI TABLE 12 (HRS TABLE 4-13): SURFACE WATER DILUTION WEIGHTS
TYPE OF SURFACE WATER BODY
Descriptor Flow Characteristics
Assigned Dilution Weight
Minimal stream < 10 cfs 1
Small to moderate stream 10 to 100 cfs 0.1
Moderate to large stream > 100 to 1,000 cfs 0.01
Large stream to river > 1,000 to 10,000 cfs 0.001
Large river > 10,000 to 100,000 cfs 0.0001
Very large river > 100,000 cfs 0.00001
Coastal tidal waters Flow not applicable; depth not applicable 0.0001
Shallow ocean zone or Great Lake Flow not applicable; depth less than 20 feet 0.0001
Moderate depth ocean zone or Great Lake Flow not applicable; depth 20 to 200 feet 0.00001
Deep ocean zone or Great Lake Flow not applicable; depth greater than 200 feet 0.000005
3-mile mixing zone in quiet flowing river 10 cfs or greater 0.5
* Check all (/) appropriate dilution weights.
Covitch Property / Former ATF Davidson Co. CERCLIS No. MAD046128559
46 6 March 1997

SI TABLE 13 (HRS TABLE 4-23): SURFACE WATER AND AIR SENSITIVE ENVIRONMENTS VALUES
Sensitive Environment Assigned
Value
Critical habitat for Federal designated endangered or threatened species Marine Sanctuary National Park Designated Federal Wilderness Area Ecologically important areas identified under the Coastal Zone Wilderness Act Sensitive Areas identified under the National Estuary Program or Near Coastal
Water Program of the Clean Water Act Critical Areas identified under the Clean Lakes Program of the Clean Water Act
(subareas in lakes or entire small lakes) National Monument (air pathway only) National Seashore Recreation Area National Lakeshore Recreation Area
100
Habitat known to be used by Federal designated or proposed endangered or threatened species National Preserve National or State Wildlife Refuge Unit of Coastal Barrier Resources System Coastal Barrier (undeveloped) Federal land designated for the protection of natural ecosystems Administratively Proposed Federal Wilderness Area Spawning areas critical for the maintenance of fish/shellfish species
within a river system, bay, or estuary Migratory pathways and feeding areas critical for the maintenance of
anadromous fish species within river reaches or areas in lakes or coastal tidal waters in which the fish spend extended periods of time
Terrestrial areas utilized by large or dense aggregations of vertebrate animals (semi-aquatic foragers) for breeding
National river reach designated as recreational
75
Habitat known to be used by State designated endangered or threatened species Habitat known to be used by a species under review as to its Federal endangered
or threatened status Coastal Barrier (partially developed) Federally designated Scenic or Wild River
50
State land designated for wildlife or game management State designated Scenic or Wild River State designated Natural Area Particular areas, relatively small in size, important to maintenance of unique biotic communities
25
State designated areas for the protection and maintenance of aquatic life under the Clean Water Act
Wetlands See SI Table 14 (Surface Water Pathway) or SI Table 23 (Air Pathway)
*Check (/) all environments impacted or potentially impacted by the site.
SI TABLE 14 (HRS TABLE 4-24): SURFACE WATER WETLANDS FRONTAGE VALUES
TOTAL LENGTH OF WETLANDS ASSIGNED VALUE
Less than 0.1 mile 0.1 to 1 mile Greater than 1 to 2 miles Greater than 2 to 3 miles Greater than 3 to 4 miles Greater than 4 to 8 miles Greater than 8 to 12 miles Greater than 12 to 16 miles Greater than 16 to 20 miles Greater than 20 miles
0 25 50 75 100 150 250 350 450 500
* Check (/) highest value for each applicable flow characteristic.
Notes:
Covitch Property / Former ATF Davidson Co. CERCLIS No. MAD046128559
47 6 March 1997

SURFACE WATER PATHWAY (Concluded) WASTE CHARACTERISTICS, THREAT, AND PATHWAY SCORE SUMMARY
WASTE CHARACTERISTICS Score
11. If an Actual Contamination Target (drinking water, human food chain, or environmental threat) exists for the watershed, assign the calculated hazardous waste quantity score, or a score of 100, whichever is greater. If no Actual Contamination Targets exist, assign the hazardous waste quantity score calculated for sources available to migrate to surface water.
100
12. Assign the highest value from SI Table 3 or SI Table 7 for the hazardous substance waste characterization factors below. Multiply each by the surface water hazardous waste quantity score and determine the waste characteristics score for each threat.
Substance(s):
Value:
From Table:
DWT
Barium
10,000
HFCT
Benzene
2.0E+05
ET
Benzene
20,000
"Footnote all substances which cannot fit on Table.
13. Multiply the toxicity and hazardous waste quantity scores. Assign the waste characteristics score for each threat from the table below.
Product
>0 to <10
> 10 to < 100
WC Score DWT HFCT ET
> 100 to < 1,000
> 1,000 to < 10,000
> 10,000 to < lE+05 10
>lE+05 to < lE+06 18
>1E+O6to < lE+07 32
>1E+O7to <lE+08 56
>lE+08to < lE+09 100
>1E+O9to <1E+10 180
>1E+I0to <1E+11 320
>1E+11 to <1E+12 560
>1E+12 or greater 1000
*check (•) the WC score calculated for each threat
Substance Value HWQ Product WC Score (from Table)
Drinking Water Threat 10,000 x 100 = 1.0E+06 32 (Maximum of 100) Toxicity/Persistence
Food Chain Threat 2.0E+05 x 100 = 2.0E+07 56 (Maximum of 1000) Toxicity/Persistence Bioaccumulation
Environmental Threat 20,000 x 100 = 2.0E+06 32 (Maximum of 1000) Ecotoxicity/Persistence/ Ecobioaccumulation
Covitch Property / Former ATF Davidson Co. CERCLIS No. MAD046128559
48 6 March 1997

SURFACE WATER PATHWAY THREAT SCORES
Threat (T)
Likelihood of Release (LR)
Score Targets (T)
Score
Pathway Waste Characteristics(WC) Score (determined
above)
Threat Score
LR X T X WC 82,500
Drinking Water (DW) 500 32 0.970 (Maximum of 100)
Human Food Chain (HFC)
500 56 0.679 (Maximum of 100)
Environmental (E) 500 1.7 32 0.33 (Maximum of 60)
Multiply LR by T and by WC. Divide the product by 82,500 for each threat (T). Sum the threat scores to obtain the surface water pathway score for each watershed/migration route. Select the highest watershed/migration route score. If the pathway score is greater than 100, assign 100.
SURFACE WATER PATHWAY CALCULATION: (DWT + HFCT + ET) = 1.979
(Maximum of 100)
Notes: Calculations; DWT: [500x5x32]+ 82,500 = 0.970 HFCT: [500x2x56] + 82,500 = 0.679 ET: [500xl.7x32] + 82,500 = 0.33 DWT+HFCT+ET = 0.970+0.679+0.33 = 1.979
Covitch Property / Former ATF Davidson Co. CERCLIS No. MAD046128559
49 6 March 1997

SOIL EXPOSURE PATHWAY
Pathway Description and Scoring Notes: Identify all areas of observed contamination. Indicate whether a resident population is associated with the site and characterize the area surrounding the site. Identify the nearby population and any terrestrial sensitive environments located within the target distance limit.
Briefly discuss any sampling events relative to the Soil Exposure Pathway; provide dates of sampling events and a summary of the analytical results and whether an observed release and/or actual contamination targets were documented.
Indicate any assumptions you have made in scoring the Soil Exposure Pathway for this site, or any key factors which influenced your scoring rationale.
Soil samples were collected from the Covitch property during the hollow-stem auger probe survey conducted by CEH in May 1985. These locations were determined based on their proximity to the Raceway. Three of the locations (AP-101, AP-102, and AP-103) met refusal prior to reaching the desired depths and were abandoned. The other two locations (AP-104 and AP-105) were advanced to the desired depth and numerous soil samples were collected in 2-foot increments from each location between the depths of 8 and 17 feet. These samples were analyzed for barium, oil and grease, total phenols, and priority pollutant metals. Three of the samples, AP-104 (S-4), AP-105 (S-l), and AP-105 (S-3), were also analyzed for VOCs by EPA Method 624. No VOCs were detected in any of the soil samples which received the VOC analysis. The soil samples indicated that there was a layer of oil and grease present on the property, with the highest concentration (12,000 ppm) present in location AP-104, approximately 11 feet below grade. Barium was also detected at elevated concentrations (560 ppm) in location AP-104, approximately 16 feet below grade. None of the soil samples were collected from depths of 24 inches or less.
Alternatives Unlimited Day Habitation Program is a school located in one of the on-site buildings. The school is used to train special need students. The students and faculty of the school are not likely targets for soil exposure due to the fact that activities are limited to within the on-site building and the building is not believed to be located on a source.
The nearest residence is located within the mill complex on the Covitch property. Four people reside in this residence; an employee of WRT, his wife, and their two children. No known soil samples have been collected from the surficial soils of the property. Based on both historical records and past environmental reports these residents do not appear to be living on a source, or within 200 feet of a source.
Both vehicular and pedestrian access to the portion of the property on the north side of the Mumford River (Covitch and Arcade properties) is restricted. Three sides of the property are enclosed by a 6-foot-high chain-link fence. There is also a combination of on-site employees and a 24-hour security service patrolling the property. However, pedestrian access to the property can be gained via the Mumford River. Additionally, there is unrestricted pedestrian and vehicular access to the former coal ash disposal area which is located along Douglas Road south of the Mumford River.
Covitch Property / Former ATF Davidson Co. CERCLIS No. MAD046128559
50 6 March 1997

SOIL EXPOSURE PATHWAY (Continued)
The property is located in a mixed residential, commercial, and industrial section of Northbridge. Approximately 1,200 people work for businesses located on the property. However, the only on-site employees which START personnel will consider targets for soil exposure for this evaluation are the approximately eight people working for WRT on the landscape/grounds maintenance crew.
According to the CENTRACTS report, prepared by Frost Associates, Inc. for the property, there are approximately 5,327 people residing within 1-radial mile of the property. To date, no known soil samples have been collected on residential properties in the vicinity of the subject property. Based on available information and on-site observations, nearby residential properties are not likely targets from the soil exposure pathway.
There are no terrestrial sensitive environments located on the property.
Covitch Property / Former ATF Davidson Co. CERCLIS No. MAD046128559
51 6 March 1997

SI TABLE 15a: SOIL EXPOSURE OBSERVED CONTAMINATION SUBSTANCES Source ID:
Sample ID Hazardous Substance Substance
Concentration Bckgrd. ID. Bckgrd. Cone. Toxicity References
Highest Toxicity
Notes: There are no known Soil Exposure Observed Contamination Substances associated with the property.
SI TABLE 15b: SOIL EXPOSURE RESIDENT POPULATION TARGETS Notes: Convert all results and SCDM values to /ig/kg or ppb. If sum of percent calculated for I or J index is > 100%, consider residents Level I targets; if sum of I or J
index is < 100%, consider the residents Level II targets.
Residence ID: Level I : Level I I : Population:
Sample ID Hazardous Substance Cone,
fag/kg) RfD
(J index) % of RfD
Cancer Risk Cone.
(I index) % of Cancer Risk
Cone. References
Sum of Percents Sum of Percents
Residence ID: Level I : Level I I : Population:
Sample ID Hazardous Substance Cone,
fag/kg) RfD
(Index) % of RfD
Cancer Risk Cone.
(Index) % of Cancer Risk
Cone. References
Sum of Percents SCDM Version: JUN96 Notes: There are no known Soil Exposure Resident Population Target samples associated with the property.
Sum of Percents
Covitch Property / Former ATF Davidson Co. CERCLIS No. MAD046128559
52 6 March 1997

SOIL EXPOSURE PATHWAY WORKSHEET RESIDENT POPULATION THREAT
LIKELIHOOD OF EXPOSURE Score Data Type Refs
OBSERVED CONTAMINATION: If evidence indicates presence of observed contamination (depth of 2 feet or less), assign a score of 550; otherwise, assign a 0. Note that a likelihood of exposure score of 0 results in a soil exposure pathway score of 0.
0 (550)
LE= 0 (550) TARGETS
RESIDENT POPULATION: Determine the number of people occupying residences or attending school or day care on contaminated property and within 200 feet of areas of observed contamination (HRS section 5.1.3).
Level I : Level I I :
people x people x
10 = 1 = Sum=
RESIDENT INDIVIDUAL: Assign a score of 50 if any Level I resident population exists. Assign a score of 45 if there are Level I I targets but no Level I targets. If no resident population exists (i.e., no Level I or Level I I targets), assign 0 (HRS Section 5.1.3).
WORKERS: Assign a score from the table below for the total number of workers at the site and nearby facilities and within areas of observed contamination associated with the site.
Number of Workers
1 to 100
101 to 1,000
> 1,000
Score
10
15
TERRESTRIAL SENSITIVE ENVIRONMENTS: Assign a value for each terrestrial sensitive environment (SI Table 16) in an area of observed contamination.
Terrestrial Sensitive Environment Type Value
Sum =
RESOURCES: Assign a score of 5 if any one or more of the following resources is present on area of observed contamination at the site; assign 0 if none applies. • Commercial agriculture • Commercial silviculture • Commercial livestock production or commercial
livestock grazing
Sum of Targets T =
Notes: (A) (B)
Numbers in parentheses are a hypothetical evaluation to evaluate the effect should the detection of vinyl chloride occur in the surficial soils of the property. Approximately 1,200 people work for businesses located on the property. However, the only on-site employees which START personnel will consider targets for soil exposure for this evaluation are the eight people working for WRT on the landscape/grounds maintenance crew.
Covitch Property / Former ATF Davidson Co. CERCLIS No. MAD046128559
53 6 March 1997

SOIL EXPOSURE PATHWAY WORKSHEET NEARBY POPULATION THREAT
LIKELIHOOD OF EXPOSURE Score Data Type Ref.
Attractiveness/Accessibility (from SI Table 17 or HRS Table 5-6) Value: 25
Area of Contamination (from SI Table 18 or HRS Table 5-7) Value: 100
Likelihood of Exposure (from SI Table 19 or HRS Table 5-8)
LE= 250
TARGETS Score Data Type Ref.
8. Assign a score of 0 if Level I or Level II resident individual has been evaluated or if no individuals live within 1/4 mile travel distance of an area of observed contamination. Assign a score of 1 if nearby population 1 is within 1/4 mile travel distance and no Level I or Level II resident population has been evaluated.
9. Determine the population within 1 mile travel distance that is not exposed to a hazardous substance from the site (i.e., properties that are not determined to be Level I or Level II); record the population for each 7.1 distance category in SI Table 20 (HRS Table 5-10). Sum the population values and multiply by 0.1.
Sum of Targets T= 8.1
Notes:
Covitch Property / Former ATF Davidson Co. CERCLIS No. MAD046128559
54 6 March 1997

SI TABLE 16 (HRS TABLE 5-5): SOIL EXPOSURE PATHWAY TERRESTRIAL SENSITIVE ENVIRONMENT VALUES
TERRESTRIAL SENSITIVE ENVIRONMENT ASSIGNED VALUE
Terrestrial critical habitat for Federal designated endangered or threatened species
National Park Designated Federal Wilderness Area National Monument
100
Terrestrial habitat known to be used by Federal designated or proposed threatened or endangered species
National Preserve (terrestrial) National or State terrestrial Wildlife Refuge Federal land designated for protection of natural ecosystems Administratively proposed Federal Wilderness Area Terrestrial areas utilized by large or dense aggregations of animals
(vertebrate species) for breeding
75
Terrestrial habitat used by State designated endangered or threatened species Terrestrial habitat used by species under review for Federal designated
endangered or threatened status
50
State lands designated for wildlife or game management State designated Natural Areas Particular areas, relatively small in size, important to maintenance of
unique biotic communities
25
Check ( / ) all environments impacted or potentially impacted by the site.
Covitch Property / Former ATF Davidson Co. CERCLIS No. MAD046128559
55 6 March 1997

SI TABLE 17 (HRS TABLE 5-6); ATTRACTIVENESS/ACCESSIBILITY VALUES
AREA OF OBSERVED CONTAMINATION ASSIGNED VALUE
Designated recreational area 100
Regularly used for public recreation (for example, vacant lots in urban area) 75
Accessible and unique recreational area (for example, vacant lots in urban area) 75
Moderately accessible (may have some access improvements-for example, gravel road) with some public recreation use
50
Slightly accessible (for example, extremely rural area with no road improvement) with some public recreation use
25
Accessible with no public recreation use 10
Surrounded by maintained fence or combination of maintained fence and natural barriers
Physically inaccessible to public, with no evidence of public recreation use
* Check (/) highest value.
SI TABLE 18 (HRS TABLE 5-7): AREA OF CONTAMINATION FACTOR VALUES
TOTAL AREA OF THE AREAS OF OBSERVED CONTAMINATION (SQUARE FEET)
ASSIGNED VALUE
j< to 5,000
> 5,000 to 125,000 20
> 125,000 to 250,000 40
> 250,000 to 375,000 60
> 375,000 to 500,000 80
> 500;000 100
* Check (/) highest value.
Notes:
Covitch Property / Former ATF Davidson Co. CERCLIS No. MAD046128559
56 6 March 1997

SI TABLE 19 (HRS TABLE 5-8): NEARBY POPULATION LIKELIHOOD OF EXPOSURE FACTOR VALUES
Area of Contamination Factor Value
100
80
60
40
20
Attractiveness/Accessibility Factor Value
100
500
500
375
250
125
50
75
500
375
250
125
50
25
50
375
250
125
50
25
25
250
125
50
25
10
125
50
25
50
25
SI TABLE 20 (HRS TABLE 5-10): DISTANCE-WEIGHTED POPULATION VALUES FOR NEARBY POPULATION THREAT
Travel Distance Category
(miles) Pop.
NUMBER OF PEOPLE WITHIN THE TRAVEL DISTANCE CATEGORY
1 to 10
11 to 30
31 to 100
101 to
300
301 to
1,000
1,001 to
3,000
3,001 to
10,001
10,001 to
30,000
30,001 to
100,000
100,001 to
300,000
300,001 to
1,000,000
Greater than 0 to 1/4
1,328 0.1 0.4 1.0 13 41 130 408 1,303 4,081 13,034
Greater than 1/4 to 1/2
1,350 0.05 0.2 0.7 20 65 204 652 2,041 6,517
Greater than 1/2 to 1
2,649 0.02 0.1 0.3 10 33 102 326 1,020 3,258
Sum =
References: Notes: Including the 1,200 people that work for businesses on the property in the Greater than 0 to 0.25 mile Travel Distance Catagory does not change the Population Value.
Covitch Property / Former ATF Davidson Co. CERCLIS No. MAD046128559
57 6 March 1997
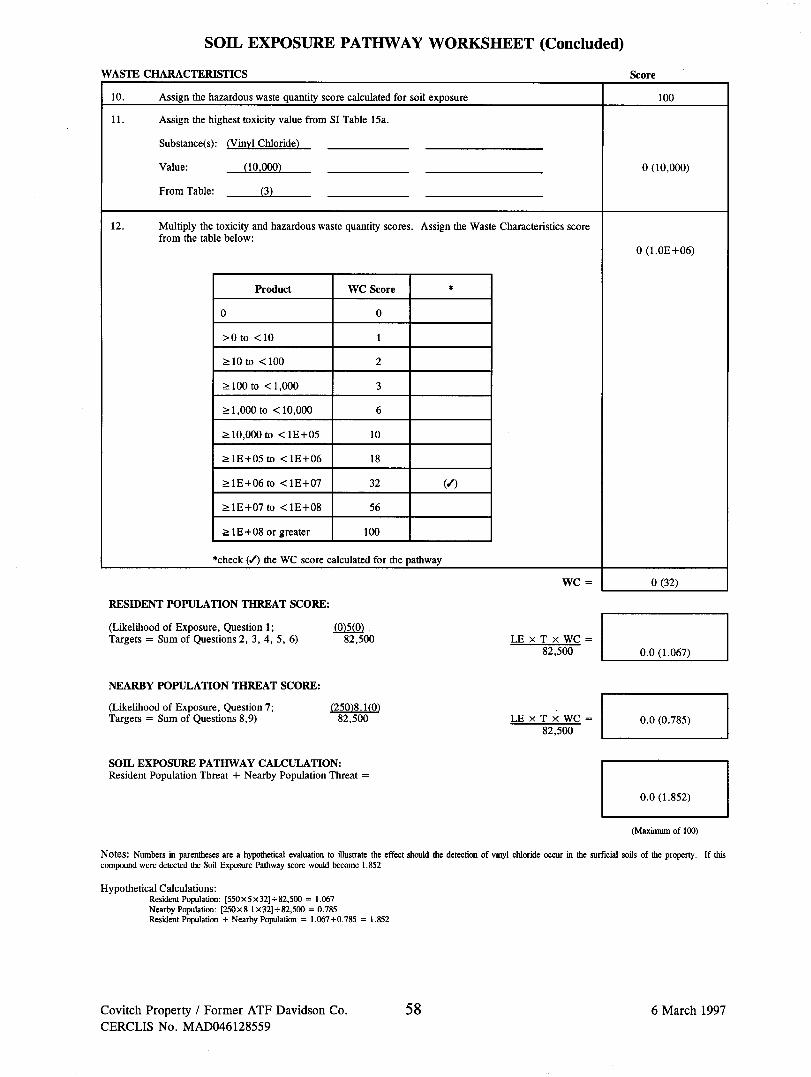
SOIL EXPOSURE PATHWAY WORKSHEET (Concluded)
WASTE CHARACTERISTICS Score
10. Assign the hazardous waste quantity score calculated for soil exposure 100
11. Assign the highest toxicity value from SI Table 15a.
Substance(s): (Vinyl Chloride)
Value: (10.000)
From Table: (3)
0 (10,000)
12. Multiply the toxicity and hazardous waste quantity scores. Assign the Waste Characteristics score from the table below:
Product
>0 to <10
>10to <100
> 100 to < 1,000
> 1,000 to < 10,000
> 10,000 to < lE+05
>lE+05 to < lE+06
>1E+O6to < lE+07
>1E+O7to <lE+08
>lE+08 or greater
WC Score
10
18
32
56
100
*check ( / ) the WC score calculated for the pathway
0 (1.0E+06)
RESIDENT POPULATION THREAT SCORE:
(Likelihood of Exposure, Question 1; (0)5(0) Targets = Sum of Questions 2, 3, 4, 5, 6) 82,500
WC =
LE x T x WC = 82,500
0 (32)
0.0(1.067)
NEARBY POPULATION THREAT SCORE:
(Likelihood of Exposure, Question 7; (250)8.1(0) Targets = Sum of Questions 8,9) 82,500 LE X T X WC =
82,500 0.0 (0.785)
SOn. EXPOSURE PATHWAY CALCULATION: Resident Population Threat + Nearby Population Threat =
0.0(1.852)
(Maximum of 100)
Notes: Numbers in parentheses are a hypothetical evaluation to illustrate the effect should the detection of vinyl chloride occur in the surficial soils of the property. If this compound were detected the Soil Exposure Pathway score would become 1.852
Hypothetical Calculations: Resident Population: [550x5x32] + 82,500 = 1.067 Nearby Population: [250 x 8.1 x 32]+82,500 = 0.785 Resident Population + Nearby Population = 1.067 +0.785 = 1.852
Covitch Property / Former ATF Davidson Co. CERCLIS No. MAD046128559
58 6 March 1997

AIR MIGRATION PATHWAY
Pathway Description and Scoring Notes: Describe the Air Migration Pathway. Identify the nearest potential receptors of airborne contaminants and the population residing within four miles of the site. Identify any sensitive environments located within the target distance limit.
Briefly discuss any sampling events relative to the Air Pathway; provide dates of sampling events and a summary of the analytical results and whether an observed release and/or actual contamination targets were documented.
Indicate any assumptions you have made in scoring the Air Pathway for this site, or any key factors which influenced your scoring rationale.
To date no known air samples have been collected on the property. Four people reside on the subject property; an employee of WRT, his wife, and their two children. There are approximately 1,200 people employed with and working for the businesses located on the property. Based on both historical records and past environmental reports these residents and employees do not appear to be living/working on a source or within 200 feet of a source, with the possible exception being the eight employees of WRT working on the landscape/grounds maintenance crew. According to the CENTRACTS report prepared by Frost Associates, Inc. for the property, an estimated 27,419 people live within 4-radial miles of the property. The estimated population distribution is summarized below.
Estimated Population Within 4-Radial Miles of the Covitch Property/Former ATF Davidson Co. Property
Radial Distance From Covitch Property/Former ATF Davidson Co. (miles)
0.00 < 0.25
0.25 < 0.50
0.50 < 1.00
1.00 < 2.00
2.00 < 3.00
3.00 < 4.00
TOTAL
Estimated Population
1,328
1,350
2,649
5,320
8,140
8,632
27,419
There are no Federal-Proposed, -Threatened, or -Endangered Species within a 4-radial miles of the property. However, there is one occurrence of State-Threatened/Endangered Species and seven occurrences of State-listed Species of Concern.
There are approximately 1,448 acres of wetlands within 4-radial miles of the property.
Covitch Property / Former ATF Davidson Co. CERCLIS No. MAD046128559
59 6 March 1997
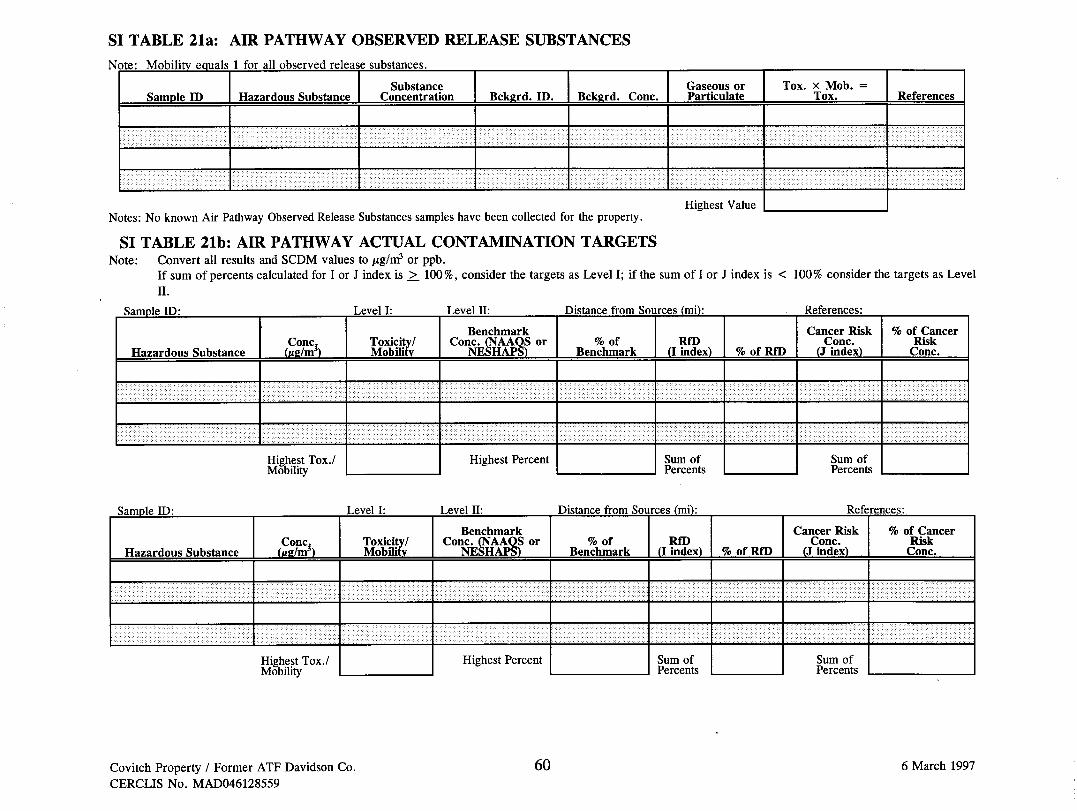
SI TABLE 21a: AIR PATHWAY OBSERVED RELEASE SUBSTANCES Note: Mobility equals 1 for all observed release substances.
Sample ID Hazardous Substance Substance
Concentration Bckgrd. ID. Bckgrd. Cone. Gaseous or Particulate
Tox. x Mob. Tox. References
Highest Value Notes: No known Air Pathway Observed Release Substances samples have been collected for the property.
SI TABLE 21b: AIR PATHWAY ACTUAL CONTAMINATION TARGETS Note: Convert all results and SCDM values to /ig/m3 or ppb.
I f sum of percents calculated for I or J index is _> 100%, consider the targets as Level I ; i f the sum of I or J index is < 100% consider the targets as Level I I .
Sample ID: Level I : Level I I : Distance from Sources (mi): References:
Hazardous Substance Cone,
iHg/mi Toxicity/ Mobility
Benchmark Cone. (NAAQS or
NESHAPS) % of
Benchmark RfD
(I index) % of RfD
Cancer Risk Cone.
(J index)
% of Cancer Risk
Cone.
Highest Tox./ Mobility
Highest Percent Sum of Percents
Sum of Percents
Sample ID: Level I : Level H: Distance from Sources (mi): References:
Hazardous Substance Cone,
Jfig/mi Toxicity/ Mobility
Benchmark Cone. (NAAQS or
NESHAPS) % of
Benchmark RfD
(I index) % of RfD
Cancer Risk Cone.
(J index)
% of Cancer Risk
Cone.
Highest Tox./ Mobility
Highest Percent Sum of Percents
Sum of Percents
Covitch Property / Former ATF Davidson Co. CERCLIS No. MAD046128559
60 6 March 1997
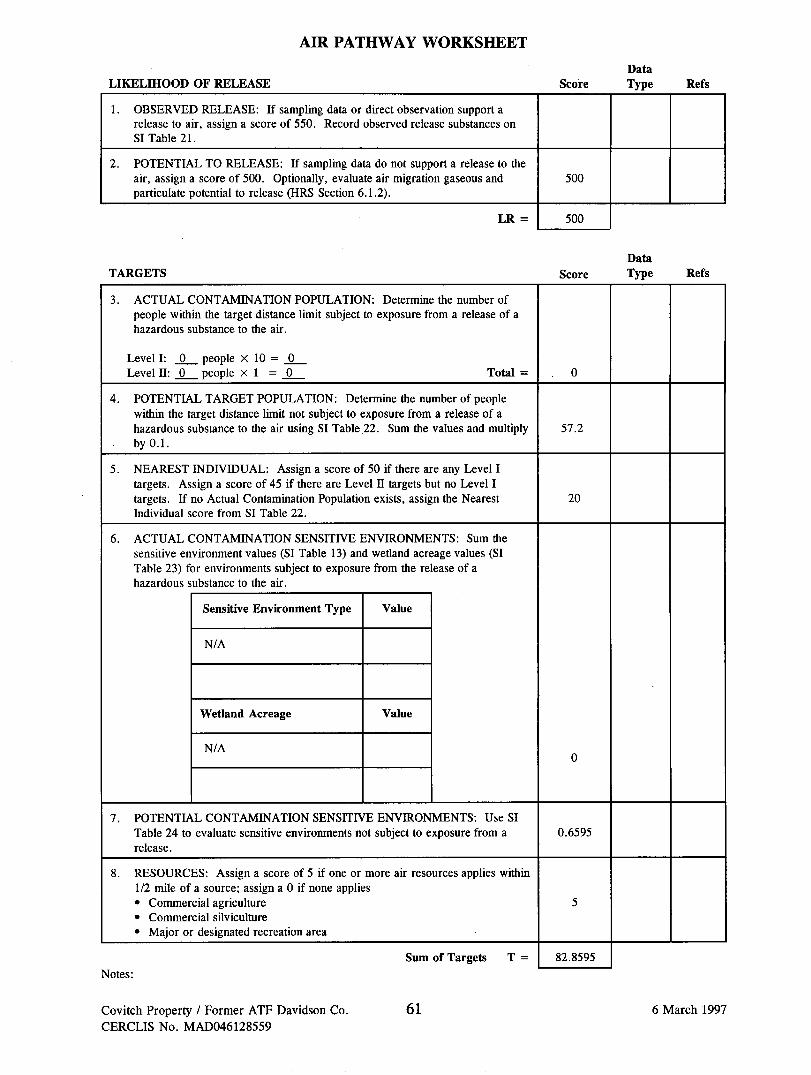
AIR PATHWAY WORKSHEET
LIKELIHOOD OF RELEASE Score Data Type Refs
1. OBSERVED RELEASE: If sampling data or direct observation support a release to air, assign a score of 550. Record observed release substances on SI Table 21.
2. POTENTIAL TO RELEASE: If sampling data do not support a release to the air, assign a score of 500. Optionally, evaluate air migration gaseous and 500 particulate potential to release (HRS Section 6.1.2).
LR = 500
TARGETS Score Data Type Refs
ACTUAL CONTAMINATION POPULATION: Determine the number of people within the target distance limit subject to exposure from a release of a hazardous substance to the air.
Level I : 0 people x 10 = _0_ Level I I : _0 people x 1 = 0 Total =
POTENTIAL TARGET POPULATION: Determine the number of people within the target distance limit not subject to exposure from a release of a hazardous substance to the air using SI Table 22. Sum the values and multiply by 0.1.
57.2
5. NEAREST INDIVIDUAL: Assign a score of 50 if there are any Level I targets. Assign a score of 45 if there are Level I I targets but no Level I targets. If no Actual Contamination Population exists, assign the Nearest Individual score from SI Table 22.
20
ACTUAL CONTAMINATION SENSITIVE ENVIRONMENTS: Sum the sensitive environment values (SI Table 13) and wetland acreage values (SI Table 23) for environments subject to exposure from the release of a hazardous substance to the air.
Sensitive Environment Type Value
N/A
Wetland Acreage
N/A
Value
7. POTENTIAL CONTAMINATION SENSITIVE ENVIRONMENTS: Use SI Table 24 to evaluate sensitive environments not subject to exposure from a release.
0.6595
RESOURCES: Assign a score of 5 if one or more air resources applies within 1/2 mile of a source; assign a 0 if none applies • Commercial agriculture • Commercial silviculture • Major or designated recreation area
Sum of Targets T = 82.8595
Notes:
Covitch Property / Former ATF Davidson Co. CERCLIS No. MAD046128559
61 6 March 1997

AIR PATHWAY WORKSHEET (Concluded)
WASTE CHARACTERISTICS Score
9. If any Actual Contamination Targets exist for the air pathway, assign the calculated hazardous waste quantity score or a score of 100, whichever is greater; if there are no Actual Contamination Targets for the air pathway, assign the calculated HWQ score for sources available for air migration.
100
10. Assign the highest air toxicity/mobility value from SI Table 21a or SI Table 3.
Substance(s):
Value:
From Table:
Vinyl Chloride 10,000
10,000
11. Multiply the toxicity and hazardous waste quantity scores. Assign the Waste Characteristics score from the table below:
Product
>0 to <10
> 10 to < 100
WC Score
> 100 to < 1,000
> 1,000 to < 10,000
> 10,000 to < lE+05 10
>lE+05 to < lE+06 18
>1E+O6to < lE+07 32
>1E+O7to < lE+08 56
>1E+O8or greater 100
*check ( / ) the WC score calculated for the pathway
WC = 32
Multiply LR by T and by WC. Divide the product by 82,500 to obtain the air migration pathway score. If the pathway score is greater than 100, assign 100.
AIR MIGRATION PATHWAY CALCULATION: LE X T X WC = 82,500
16.07
(Maximum of 100)
Notes:
Calculations: (500x82.8595 X 32)82,500 = 16.07
Covitch Property / Former ATF Davidson Co. CERCLIS No. MAD046128559
62 6 March 1997

SI TABLE 22 (FROM HRS TABLE 6-17): VALUES FOR POTENTIAL CONTAMINATION AIR TARGET POPULATIONS
Distance From Site Pop.
Nearest Individual
(choose highest)
NUMBER OF PEOPLE WITHIN THE DISTANCE CATEGORY
11 to 30
31 to 100
101 to
300
301 to
1000
1001 to
3000
3001 to
10,000
10,001 to
30,000
30,001 to
100,000
100,001 to
300,000
300,001 to
1,000,000
1,000,000 to
3,000,000 Pop. Value
On a source 20 17 53 164 522 1,633 5,214 16,325 52,137 163,246 521,360 1,632,455
O to 1/4 mile 1,328 13 41 131 408 1,304 4,081 13,034 40,812 130,340 408,114 408
> 1/4 to 1/2 mile 1,350 0.2 0.9 28 282 882 2,815 8,815 28,153 88,153 88
> 1/2 to 1 mile 2,649 0.06 0.3 0.9 26 83 261 834 2,612 8,342 26,119 26
> 1 to 2 miles 5,320 0.02 0.09 0.3 0.8 27 83 266 833 2,659 8,326 27
> 2 to 3 miles 8,140 0.009 0.04 0.1 0.4 12 38 120 375 1,199 3,755 12
> 3 to 4 miles 8,632 0.005 0.02 0.07 0.2 0.7 28 73 229 730 2,285
Nearest Individual =
20 Sum = 572
•Score = 20 if the Nearest Individual is within 0.125 miles of a source; score = 7 if the Nearest Individual is between 0.125 and 0.25 miles of a source.
References: Notes: Approximately 1,200 people work for businesses located on the property. However, the only on-site employees which START personnel will consider potential air contamination targets for this evaluation are the eight people working for WRT on the landscape/grounds maintenance crew.
Covitch Property / Former ATF Davidson Co. CERCLIS No. MAD046128559
63 6 March 1997

SI TABLE 23 (HRS TABLE 6-18): Am PATHWAY
VALUES FOR WETLAND AREA
•
WETLAND AREA
< 1 acre
1 to 50 acres
> 50 to 100 acres
> 100 to 150 acres
> 150 to 200 acres
> 200 to 300 acres
> 300 to 400 acres
> 400 to 500 acres
> 500 acres
Check (/) highest value.
ASSIGNED VALUE
25
75
125
175
250
350
450
500
SI TABLE 24: DISTANCE WEIGHTS AND CALCULATIONS FOR AIR PATHWAY POTENTIAL
CONTAMINATION SENSITIVE ENVIRONMENTS
DISTANCE
On a Source
0 to 1/4 mile
1/4 to 1/2 mile
1/2 to 1 mile
1 to 2 miles
2 to 3 miles
3 to 4 miles
> 4 miles
Notes: (A) Particular areas, small in size, important to the maintenance of unique biotic (B) State Endangered Species: Value = 50/occurrence
DISTANCE WEIGHT
0.10
0.025
0.0054
0.0016
0.0005
0.00023
0.00014
0
SENSITIVE ENVIRONMENT TYPE AND VALUE (FROM SI TABLES
13 AND 23)
X Clean Water Act waterbody: 5
X 1 acre of wetlands: 25
X 10 acres of wetlands: 25
X 247 acres of wetlands: 250
X 1 occurrence of (A): 25
x 523 acres of wetlands: 500
x 2 occurrences of (A): 2(25)
X 1 occurrence of (B): 50
X 667 acres of wetlands: 500
X 4 occurrences of (A): 4 (25)
x
Total Environments Score
communities. (State-Concerned Species). Value = 25/occurrence
PRODUCT
0.125
0.135
0.04
0.125
0.0125
0.115
0.0115
0.0115
0.07
0.014
0.6595
Covitch Property / Former ATF Davidson Co. CERCLIS No. MAD046128559
64 6 March 1997

SITE SCORE CALCULATION
GROUNDWATER PATHWAY SCORE (SG W)
SURFACE WATER PATHWAY SCORE (S s w)
SOIL EXPOSURE PATHWAY SCORE(SSE)
AIR PATHWAY SCORE (SA)
SITE SCORE
'GW + ^SW + ^SF +
>SE
71.04 5,046.68
1.979 3.92
0.0 0.0
16.07 258.25
36.43
COMMENTS:
Notes: Numbers in parentheses are a hypothetical evaluation to illustrate the effect should the detection of vinyl chloride occur in the surficial soils of the property. If this compound were detected the Soil Exposure Pathway score would become 1.852 and the Site Score would become 36.44.
WARNING!! EPA has determined that the HRS score of any site that is progressing towards listing on the NPL is confidential. Deliberations regarding scoring or listing issues, the site specific status, and HRS scores cannot be released or discussed with non-Agency persons. For additional guidance see the April 30, 1993 OSWER Directive 9320.1-11.
Covitch Property / Former ATF Davidson Co. CERCLIS No. MAD046128559
65 6 March 1997