A Numerical Study on Combination of Crack Stop Hole and ...
58
1 A Numerical Study on Combination of Crack Stop Hole and Carbon Fiber Reinforced Polymer (CFRP) Laminates as a Repair Technique Jaswanthsai Vutkuru A Thesis Submitted to Indian Institute of Technology Hyderabad In Partial Fulfilment of the Requirements for The Degree of Master of Technology Department of Civil Engineering July, 2014
Transcript of A Numerical Study on Combination of Crack Stop Hole and ...
1
A Numerical Study on Combination of Crack Stop Hole and Carbon
Fiber Reinforced Polymer (CFRP) Laminates as a Repair Technique
Jaswanthsai Vutkuru
A Thesis Submitted to
Indian Institute of Technology Hyderabad
In Partial Fulfilment of the Requirements for
The Degree of Master of Technology
Department of Civil Engineering
July, 2014

2
Declaration
I declare that this written submission represents my ideas in my own words, and where others’
ideas or words have been included, I have adequately cited and adhered to all principles of
academic honesty and integrity and have not misrepresented or fabricated or falsified any
idea/data/fact/source in my submission. I understand that any violation of the above will be a cause
for disciplinary action by the Institute and can also evoke penal action from the sources that have
thus not been properly cited, or from whom proper permission has not been taken when needed.
_________________________
(Signature)
_________________________
(JaswanthsaiVutkuru)
_________________________
(CE12M1017)

3

4
Acknowledgements
I would like to thank the Ministry of Human Resources Development (MHRD), Government of
India for providing financial support during my stay at IIT, Hyderabad. During last one year time, the
guidance and assistance given by my thesis advisor Dr. Mahendrakumar Madhavan is highly
acknowledged. I would like to thank Dr. S.SuriyaPrakash, Dr. RamjiManoharan, and Prof. K.V.L.
Subramaniam for reviewing the progress of my work. I am thankful for computational facilities provided by
the department of civil engineering; IIT Hyderabad. I would like to thank my friends Mr.Vishwanath Sanap
and Mr. Shashidar Reddy for their time and invaluable suggestions. I am thankful to my family, who helped
me to pursue my Masters. I would like to thank Mr. JayaPrakashVemuri and Mr. Teja Dasari for their
support during my stay at IIT Hyderabad.
5
List of Figures
Figure 2-1: S-N curve for polished specimen .............................................................. 15
Figure 2-2: Elastic stress field distribution near the tip mode-I ................................... 16
Figure 2-3: Shape of notch(Creager and Paris approach) ............................................ 18
Figure 2-4: Low cycle fatigue behavior ....................................................................... 18
Figure 2-5: Stress field ahead of blunt notch ............................................................... 19
Figure 2-6: Single edge notch specimen ...................................................................... 20
Figure 2-7: Effect of stress ratio on fatigue crack initiation threshold ........................ 21
Figure 2-8: Specimen geometry (Fisher) ..................................................................... 21
Figure 2-9: Crack intiation threshold results ............................................................... 22
Figure 2-10: Stress distribution for V-notches............................................................... 24
Figure 3-1: Various notch geometries.......................................................................... 28
Figure 3-2: Crack stop hole geometry ......................................................................... 29
Figure 3-3: Solid 186 element ..................................................................................... 30
Figure 3-4: Element size Vs stress ............................................................................... 30
Figure 3-5: Finite element models with different radius ............................................. 31
Figure 3-6: Stress-Strain curve for mild steel .............................................................. 32
Figure 3-7: Fibre orientation Vs stress......................................................................... 33
Figure 3-8: MPC bonded contact ................................................................................. 34
Figure 4-1: Stress distribution ahead of the hole ......................................................... 36
Figure 4-2: Stress variation ahead of the hole ............................................................. 37
Figure 4-3: Stress concentration factor Vs radius ........................................................ 40
Figure 4-4: KI / Vs radius ........................................................................................ 41
Figure 4-5: Stress distribution ahead of crack stop hole .............................................. 42
6
Figure 4-6: Stress distribution ahead of crack stop hole for different radius ............... 43
Figure 4-7: Characteristic lengths(62 Mpa) ................................................................. 44
Figure 4-8: Characteristic lengths(82 Mpa) ................................................................. 44
Figure 4-9: Characteristic lengths(103 Mpa) ............................................................... 45
Figure 4-10: Comparison ofcharacteristic lengths(62 Mpa) .......................................... 46
Figure 4-11: Gradient for different radius(62Mpa) ....................................................... 46
Figure 4-12: Gradient for different radius(82Mpa) ....................................................... 47
Figure 4-13: Gradient for different radius(103Mpa) ..................................................... 47
Figure 4-14: Comparison ofgradient for different radius(103Mpa) ............................... 48
Figure 4-15: ComparisonbetweenKI / and KI / (41.2 Mpa) .................................. 49
Figure 4-16: Longitudinal strain Vs patch length .......................................................... 52
Figure 4-17: Stiffness ratio Vs KI / ........................................................................... 55
Figure 4-18: Combined action of CFRP and crack stop hole ........................................ 56
Figure 4-19: Stiffness ratio Vs reduction factor ............................................................ 57

7
List of Tables
Table3-1: Dimensions of the specimen ....................................................................... 28
Table3-2: Material Propertied Used in this study ........................................................ 31
Table4-1: Calculation of stress intensity factor (SIF) .................................................. 38
Table4-2: Comparison between K f and Kt ................................................................. 38
Table4-3: Calculation of KI / for different radius of the hole ................................. 40
Table4-4: Characteristic length for three loads ............................................................ 44
Table4-5: Calculation of Gradient (α) ......................................................................... 47
Table4-6: Comparison between KI / and KI / ..................................................... 51
Table4-7: Comparison between KI / and KI / (with patch) .................................. 51
Table4-8: Calculation of KI / for different radius with patch ................................. 53
8
Abstract
Drilling a hole ahead of crack tip is one of the most common techniques, to prevent further crack
propagation in structures subjected to fatigue load. Fatigue cracks are typically occur at locations where
drilling a crack stop hole of desired dimensions is not possible due to geometrical constraints. In such cases,
crack may reinitiate from the hole after few loading cycles. Techniques such as Static mechanical cold
working are used to strengthen the undersized crack stop hole mentioned in the literature. In this study,
application of Carbon Fiber Reinforced Polymer (CFRP) patches laminated over cracks is proposed to delay
the crack initiation from under sized crack stop hole.
Although extensive literature exists for crack stop hole and CFRP patches independently to prevent
the crack growth, few literatures are available for combined effect. In the present study combination of
crack stop hole and CFRP overlays as a repair technique is studied. This combination helps to reduce the
stress at edge of the hole, which delays the crack initiation. The combined effect of crack stop hole and
CFRP patches is studied numerically using ANSYS.
Steel plate subjected to tensile loading (mode-I) with initial central crack is considered. Material
behaviour is assumed to be elastic. A hole is modelled ahead of crack tip and CFRP overlays are applied
over it. Holes of various radii are considered to understand the effect of hole radii on stress at the edge of
the hole. The entire setup is modelled in ANSYS. Ratio of stress intensity factor to square root of radius is
KI / considered as a parameter for all cases.By the application of CFRP patches, the KI / is reduced by
70% at a stiffness ratio of 0.16. It is also observed that at a stiffness ratio 0.95, the KI / value at the edge
of the hole is reduced by 90%. A reduction parameter is proposed for KI / as a function of stiffness ratio.
In this study, it is observed that the parameter KI / used for crack initiation, which is based on a
constant stress gradient 0.5.This leads to smaller radius crackstop hole and hence is un- conservative.
Therefore, another parameter called notch stress intensity factor (N-SIF) which takes into account the effect
of stress gradient (α) is considered in determining the appropriate hole radius to halt crack propagation.
This approach conservative compared to KI / approach.

9
Contents
Declaration .......................................................................................................................... 2
Acknowledgements ............................................................................................................. 4
Abstract ............................................................................................................................... 8
1 Introduction .......................................................................................................... 11
1.1 Introduction .......................................................................................................... 11
1.2 Problem statement................................................................................................ 12
1.3 Contents ............................................................................................................... 13
2Background ........................................................................................................... 14
2.1 Introduction .......................................................................................................... 14
2.2 Fatigue crack initiation life for blunt notches ...................................................... 14
2.3 Stress life approach .............................................................................................. 14
2.4 Fracture mechanics approach .............................................................................. 16
2.5 Stress Intensity Factor (SIF) ................................................................................ 16
2.6 Stress field for blunt notches ............................................................................... 17
2.7 Crack initiation life for blunt cracks .................................................................... 18
2.8 Radius of crack stop hole ..................................................................................... 19
2.9 Crack stop hole expressions ................................................................................. 20
2.10 Limitations of crack stop hole ............................................................................. 23
2.11 Notch stress intensity factor (N-SIF) ................................................................... 24
2.12 Application of CFRP patches .............................................................................. 25
2.13 Bond length .......................................................................................................... 26
2.14 Retrofitting the cracks emanating from notches using CFRP patches ................. 26
2.15 Summary .............................................................................................................. 27
10
3Finite element modeling ....................................................................................... 28
3.1 Introduction .......................................................................................................... 28
3.2 Specimen Dimensions .......................................................................................... 28
3.3 Modelling Plate geometry .................................................................................... 29
3.4 Material Model .................................................................................................... 32
3.5 Orientation of fibers ............................................................................................. 33
3.6 Bonded contact .................................................................................................... 34
4Results and Discussions ........................................................................................ 36
4.1 Introduction .......................................................................................................... 36
4.2 Stress Distribution ahead of hole ......................................................................... 36
4.3 Fracture stress concentration factor(Kf) ............................................................... 37
4.4 Calculation of KI / .............................................................................................. 40
4.5 N-SIF calculation ................................................................................................. 41
4.6 Gradient calculation ............................................................................................. 46
4.7 Comparison between KI / Vs KI / .................................................................. 48
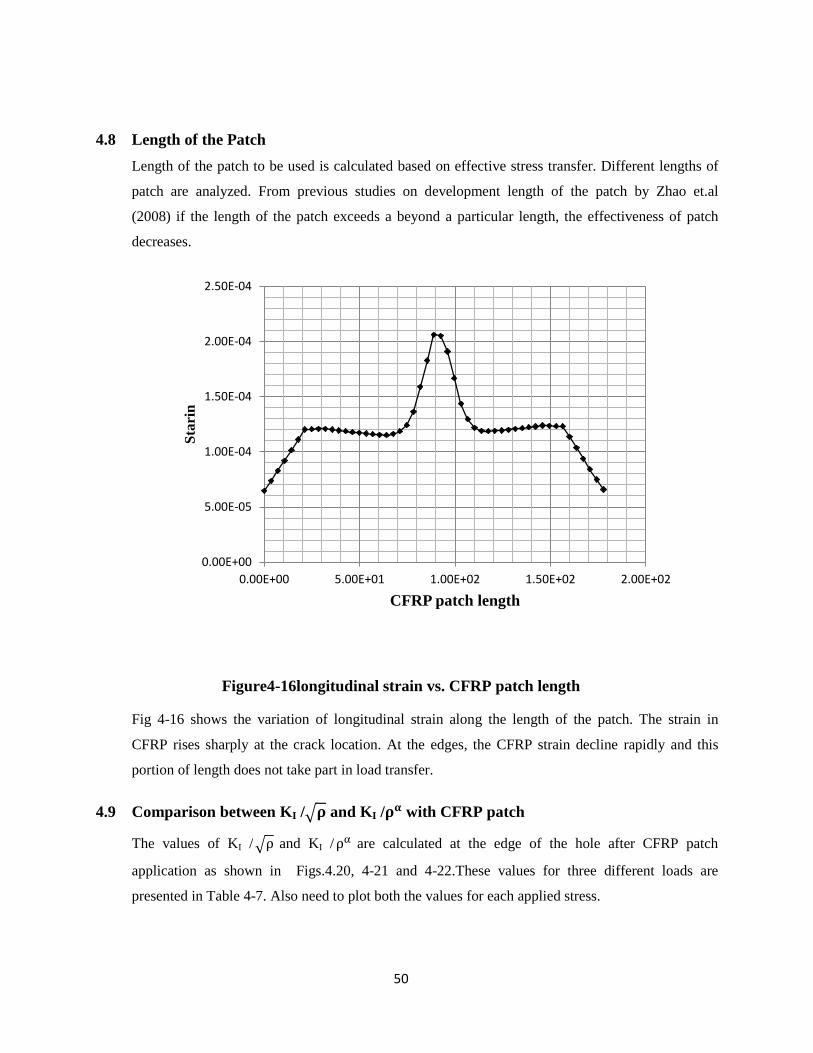
4.8 Length of the Patch .............................................................................................. 50
4.9 Comparison between KI / and KI / with CFRP patch .................................... 50
4.10 Effect of stiffness ratio Stiffness Ratio (SR) ........................................................ 51
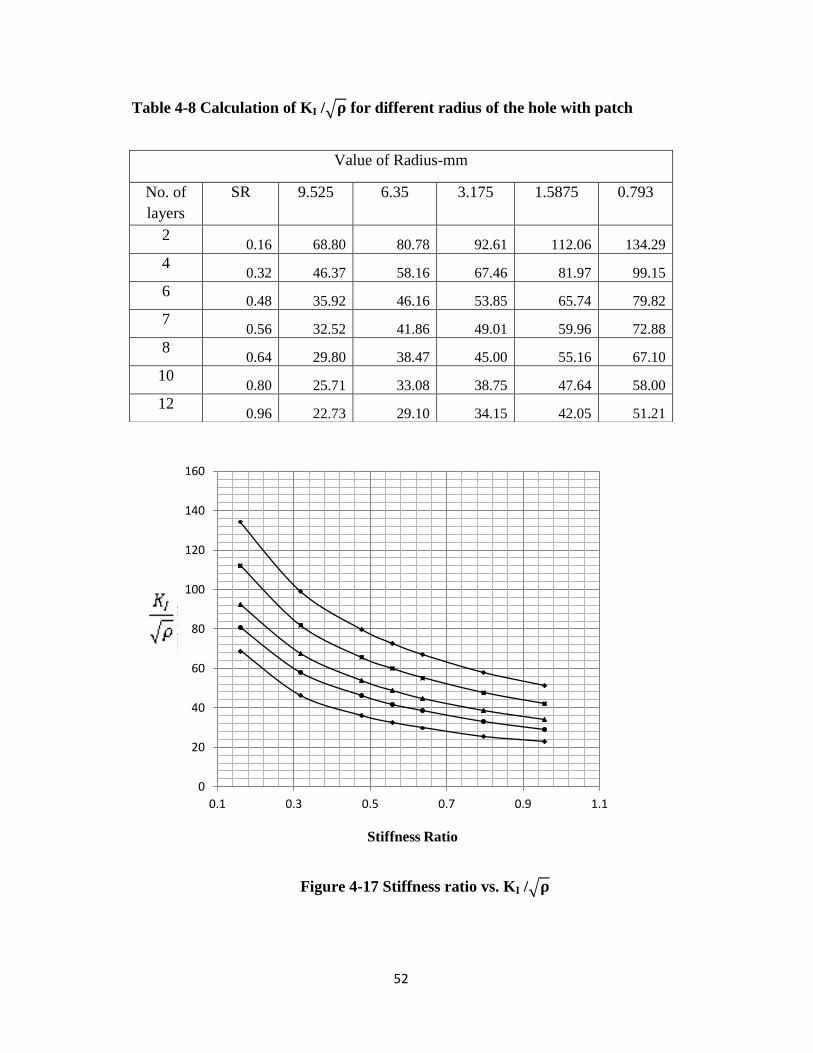
4.11 Combined action of CFRP and Crack stop hole .................................................. 53
4.12 Summary .............................................................................................................. 54
5Further study ......................................................................................................... 56
5.1 Introduction .......................................................................................................... 56
6References .............................................................................................................. 57
11
Chapter 1
Introduction
1.1 Introduction
Steel bridge girders are subjected to fatigue loading due to continuous vehicular traffic.
Girders which are not fabricated as per fatigue detailing may develop cracks due to fatigue
load. In most cases, cracks initiate at potential sites like welds, where there is a material
discontinuity. If the crack continues to grow and is left unrepaired for long time, it may lead to
catastrophic failure, which is undesirable. Therefore cracks need to be arrested by using
appropriate retrofitting techniques. By adopting the appropriate retrofitting techniques, the service
life of the bridge can be increased. The success of any retrofitting technique depends on identifying the
location of the crack and the nature of loading. These retrofitting techniques are classified broadly into
two groups [Carol et.al (2004)] such as local and global retrofitting techniques. While the local
retrofitting techniques modify the local stress state which includes crack stop holes, peening, gas
tungsten arc (GTA) welding, the global retrofitting technique include strengthening with a steel plate
or composite laminate.
Experimental studies by Fisher et.al, 1980 indicate that of the above discussed repair methods,
drilling a crack stop hole ahead of a crack tip are one of the effective methods to arrest the crack
propagation. The basic principle behind the crack stop hole is to convert the sharp crack into a blunt
notch. The expression for the radius of the hole to be drilled is a function of both loading and material
property. The success of this method depends on length of the crack, type of the loading and location
of crack. In some cases, it is not possible to drill a hole with a radius as obtained from analytical
expressions, due to lack of space in a complex structured steel connections. In such situations, a
practicing structural engineer may be required to drill an undersized crack stop hole as a temporary
measure. This approach may lead to re-initiation of crack stop hole after few loading cycles. Crack stop
hole are fully effective only if the radius of the hole satisfy design requirements [Crain, 2010].
Crack stop hole technique is not feasible, if crack propagates to a substantial size. In such cases a
global retrofitting technique such as external strengthening needs to be adopted. The usual practice was
to weld an additional plate on the top of damaged portions. However, it was found that most of the
cases, cracks were emanating from the edges of these attached plate. In addition, these plates were
causing increase in dead load which was undesirable. Recently, Carbon Fiber Reinforced Polymer
12
(CFRP) plates have been used to replace these steel plates for external strengthening owing to its better
properties such as light weight and better fatigue performance [Miller et.al, 2001].These techniques are
more efficient and are applied in strengthening old bridges. In the current study, the combined effect
of both these techniques i.e. drilling holes and application of adhesive patches are studied as repair
techniques. The recent literature indicates a gap in the combined behaviour of crack stop hole and
CFRP as a repair technique for retarding crack growth. From previous research, it was found that a
new technique needs to be developed with the combination of drilling holes [Carol et.al, (2004)]. For
repairing the cracks developed in bridge girders the guidelines given by Indian railways[Manual for
Indian railway bridges (1998)] recommends drilling a 7mm diameter hole ahead of crack tip as a
temporary measure and welding a plate over the crack as permanent solution to retard the crack
growth.
1.2 Problem statement
Crack stop hole technique has limitations in some cases where it is not possible to drill a hole of
calculated radius. It is observed in the literature [Andrea et.al (2001), Carol et.al, (2004)] that cracks
are re initiating from the edges of the holes. The probable reasons for crack initiation at the edge of the
hole are increase in load and mixed mode loading condition. However, there is a need to study crack
reinitiating from the edge of the stop hole in detail. Two major expressions for radius of the crack stop
hole are in literature; Barsomet.al (1971) and Fisher et.al (1980). Both these expressions consider the
maximum stress ahead of the blunt crack tip given by Creagor and Paris (1967). The expression given
by Barsomet.al (1971) is common for different grades of steel. The expression given by Fisher et.al is
only for A36 steel. However, this study considers only two different diameters (1 in. and 0.5 in).If
radius of the crack stop hole is undersized according to above mentioned studies, cracks will reinitiate
after few loading cycles. In such case, to reduce the stress in the damaged component CFRP patches
are applied on the top of damaged panel. The combined action of CFRP patch and crack stop hole is
the main focus of the current study. To demonstrate this combined action a central cracked specimen
geometry which replicates the generally occurred cracks in girders is considered.
Finite element analysis of central crack middle tension specimen with five different crack stop hole
radii is carried out to understand the effect of hole radius. In addition to the crack stop hole a CFRP
patch is applied over the damaged panel. A numerical study will be carried out to obtain the combined
effect of CFRP patches and drilling holes.
13
1.3 Contents
Chapter-1 gives the introduction to the retrofitting techniques, problem statement and
objectives.Chapter-2 explains the background of expressions for crack stop hole and a brief review of
previous experimental studies of CFRP-steel applications. Different approaches for predicting the
fatigue crack initiation life are presented. Among these approaches, Fracture mechanics approach for
fatigue crack initiation is explained in detail. The concept of SIF and notch stress intensity factor (N-
SIF) is introduced.Chapter-4; finite element modelling illustrates the modelling part of this study.
Modelling of different geometriesChapter-5, gives details of results obtained.
14
Chapter 2
Background
2.1 Introduction
Drilling holes ahead of crack tip is one of the oldest techniques to stop crack propagation. This
technique is sensitive to the hole radius. If the hole is small, the crack may reinitiate from the edge of
the hole after a few loading cycles. At the same time, if the hole is bigger it will reduce the stiffness
of the member. Hence it is important to drill the optimum size of the hole. To arrive at the hole
radius, predicting the crack re-initiation from the edge of the hole is important. The existing
expressions [Barsomet.al (1971), Fisher et.al (1980)] predict the hole radius based on a threshold
value of ΔKI/ behind which crack initiation not takes place.
2.2 Fatigue crack initiation life for blunt notches
Fatigue is defined as the process of cumulative damage caused by repeated loading. Fatigue life of
any structural steel component subjected to fluctuating load is divided into two parts: (a) Crack
initiation life (Ni) (b) Crack propagation life (Np) [Barsom and Nicol, 1974]. In order to determine
the total fatigue life of the component these two parts needs to be calculated individually. Total
fatigue life of the component is the sum of crack initiation and propagation life. For sharp cracks, the
initiation life is negligible and the fatigue life of such components is equal to the fatigue crack
propagation life. However, for blunt cracks the fatigue crack initiation life is significant and cannot
be neglected. To predict fatigue life of a component, mainly three different approaches are available.
They are stress life, strain life and fracture mechanics approach.
2.3 Stress life approach
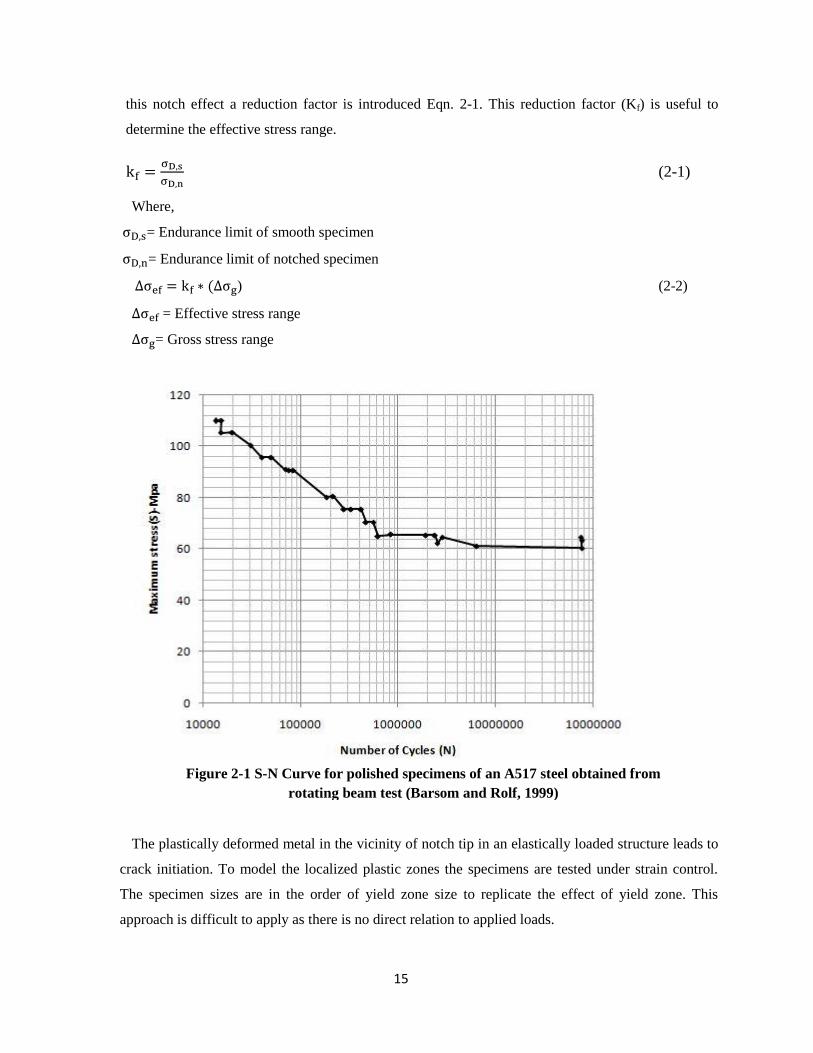
In stress approach the test results presented using S-N curves. In S-N curves, S represents
maximum stress and N represents cycles for failure. This data is obtained by testing polished
specimens at various load magnitudes. The stress corresponding to infinite number of cycles is
defined as fatigue endurance limit. A typical S-N curve for A517 steel is shown in Fig.2-1. If a
component is subjected to a load less than endurance limit, it will have infinite fatigue life. Large
test data on various steels indicate that the fatigue endurance limit is in the range of half the tensile
strength of the component [Barsom and Rolf, 1999]. However, presence of notches or crack like
discontinuities will reduces the endurance limit compared to that of a polished specimen. To account
15
this notch effect a reduction factor is introduced Eqn. 2-1. This reduction factor (Kf) is useful to
determine the effective stress range.
(2-1)
Where,
= Endurance limit of smooth specimen
= Endurance limit of notched specimen
) (2-2)
= Effective stress range
= Gross stress range
The plastically deformed metal in the vicinity of notch tip in an elastically loaded structure leads to
crack initiation. To model the localized plastic zones the specimens are tested under strain control.
The specimen sizes are in the order of yield zone size to replicate the effect of yield zone. This
approach is difficult to apply as there is no direct relation to applied loads.
Figure 2-1 S-N Curve for polished specimens of an A517 steel obtained from
rotating beam test (Barsom and Rolf, 1999)
16
2.4 Fracture mechanics approach
In the stress life approach, it is not possible to predict the crack propagation life. It is also not
possible to delineate the crack initiation and propagation. Fracture mechanics approach overcomes
this difficulty. Using fracture mechanics approach, the crack propagation life can be predicted. In
this study, linear elastic fracture mechanics (LEFM) approach is adopted to explain the crack
initiation from blunt cracks. To study the fatigue crack initiation from blunt notches, experimental
studies were carried out by Barsom and Nicol (1974), Jack and Price (1970). Both studies express
the fatigue crack initiation life (Ni) of the blunt crack, as a function of ratio of stress intensity factor
fluctuation (ΔK) to square root of notch radius ( ).
2.5 Stress Intensity Factor (SIF)
When a structural component with a crack is subjected to tensile loading, the value of stress at the
crack tip is infinite. A parameter is required to describe the stress field near the crack tip. Stress
Intensity Factor (SIF), proposed by Irwin (1958) is the parameter to describe the stress state near the
crack tip. SIF is defined as a function of applied stress (σ) and square root of crack length (a). SIF is
also a function of geometry of structural component, size and shape of the crack. The important
feature of SIF is that, it relates the local stress field to applied far field stress. Typically, structural
components subjected to fatigue loading experience mode-I deformation. Therefore, in present study
mode-I deformation was considered. The well known expression for SIF for mode-I loading is given
in Eqn.2-3. Here
indicates geometric correction factor. The SIF is considered as a driving force
for crack propagation.
(2-3)
Near crack tip stress field equations for central cracked specimens are expressed as a function of SIF
(KI ). The central crack geometry is as shown in Fig.2-2.
17
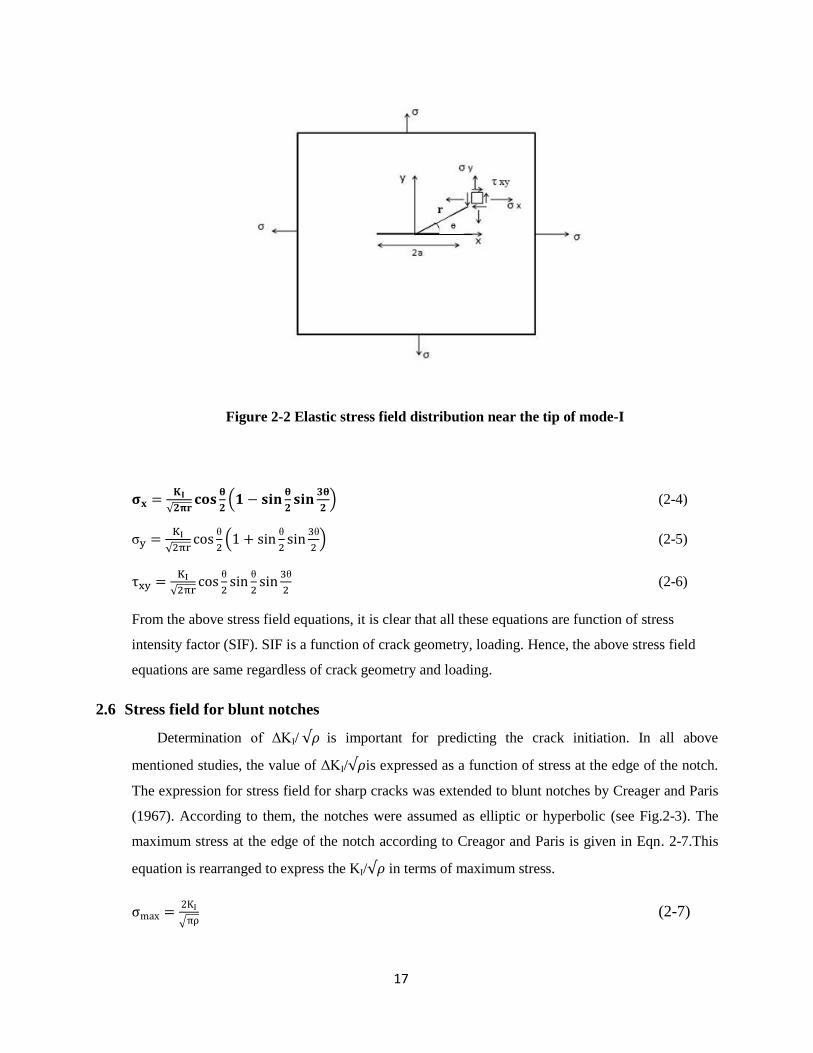
Figure 2-2 Elastic stress field distribution near the tip of mode-I
(2-4)
σ
(2-5)
(2-6)
From the above stress field equations, it is clear that all these equations are function of stress
intensity factor (SIF). SIF is a function of crack geometry, loading. Hence, the above stress field
equations are same regardless of crack geometry and loading.
2.6 Stress field for blunt notches
Determination of ΔKI/ is important for predicting the crack initiation. In all above
mentioned studies, the value of ΔKI/ is expressed as a function of stress at the edge of the notch.
The expression for stress field for sharp cracks was extended to blunt notches by Creager and Paris
(1967). According to them, the notches were assumed as elliptic or hyperbolic (see Fig.2-3). The
maximum stress at the edge of the notch according to Creagor and Paris is given in Eqn. 2-7.This
equation is rearranged to express the KI/ in terms of maximum stress.
(2-7)
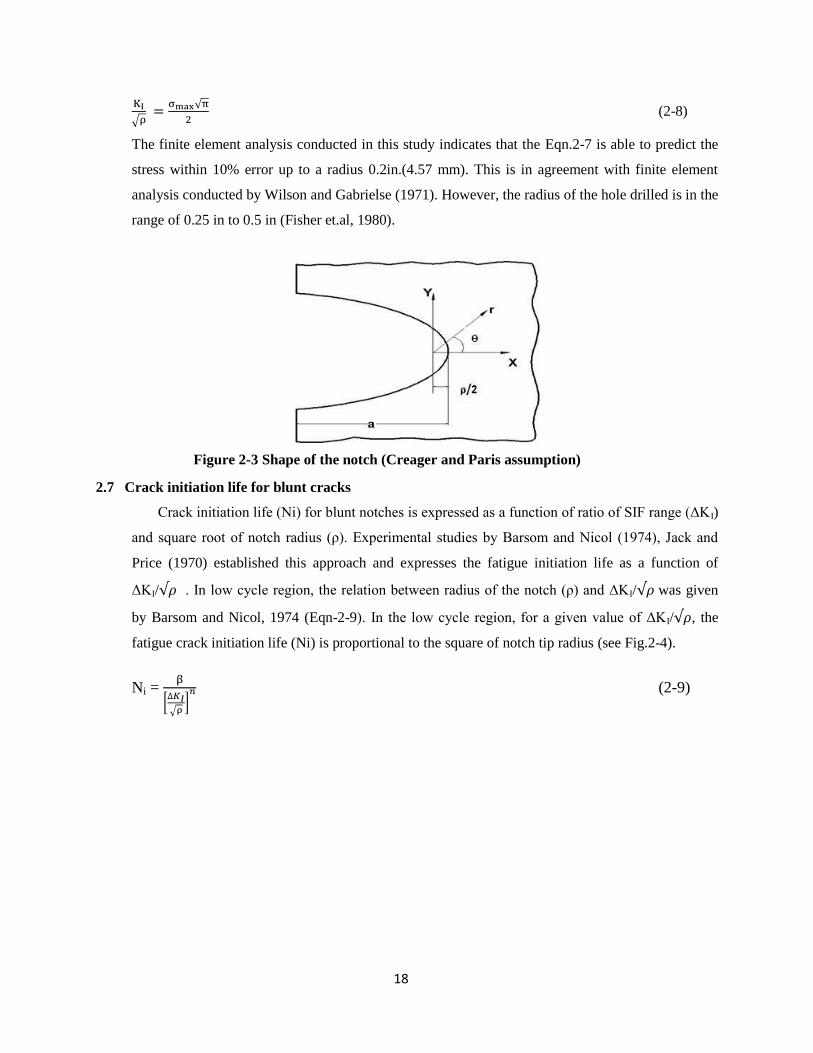
18
(2-8)
The finite element analysis conducted in this study indicates that the Eqn.2-7 is able to predict the
stress within 10% error up to a radius 0.2in.(4.57 mm). This is in agreement with finite element
analysis conducted by Wilson and Gabrielse (1971). However, the radius of the hole drilled is in the
range of 0.25 in to 0.5 in (Fisher et.al, 1980).
2.7 Crack initiation life for blunt cracks
Crack initiation life (Ni) for blunt notches is expressed as a function of ratio of SIF range (ΔKI)
and square root of notch radius ( ). Experimental studies by Barsom and Nicol (1974), Jack and
Price (1970) established this approach and expresses the fatigue initiation life as a function of
ΔKI/ . In low cycle region, the relation between radius of the notch ( ) and ΔKI/ was given
by Barsom and Nicol, 1974 (Eqn-2-9). In the low cycle region, for a given value of ΔKI/ , the
fatigue crack initiation life (Ni) is proportional to the square of notch tip radius (see Fig.2-4).
Ni =
(2-9)
Figure 2-3 Shape of the notch (Creager and Paris assumption)

19
Figure 2-4 Cycle fatigue behaviour (Barsom and Nicol, 1974)
For notches with radius less than 0.01 in (0.254 mm), the crack initiation life (Ni) of the
notch is independent of radius (see Fig.2-4). The same was also observed by Jack and Price
(1971). The variation of crack life with radius can be explained on the basis of plastically
deformed volume. As the radius of notch increases, the volume of plastically deformed material
decreases, this leads in the delay of crack initiation. Foreman, 1972 studied experimentally the
behaviour of crack initiation from flaws. In this study, the ratio of notch radius (r) to yield zone
radius (w) was considered as a parameter to predict the crack initiation from blunt notches.
2.8 Radius of crack stop hole
To arrive at the size of the crack stop hole, fracture mechanics approach was adopted in
previous studies [Barsom (1971), Fisher et.al (1980)].According to fracture mechanics approach,
the crack initiation life (Ni), was expressed as a function of ratio of Stress intensity factor
fluctuation (ΔKI) fluctuation to square root of hole radius as shown in Eqn. 2-13. The
relationship between two terms, ΔKI/ and maximum stress at the edge of the hole (σ max) was
given by Creagor and Paris [Creagor and Paris (1967)] using the concepts of linear elastic
fracture mechanics (LEFM). These expressions were obtained by shifting the origin to a distance
half of the radius ( /2) behind the crack front(see Fig.2-5), and is accurate when radius of the

20
hole is very less compared to the length of the crack ( <<a). The stress at the edge of the hole
from where fatigue crack may reinitiate was obtained by substituting r= /2 and ϴ=0.
Figure 2.5 Stress field ahead of blunt notch
(2-10)
(2-11)
(2-12)
(2-13)
2.9 Crack stop hole expressions
There are two major expressions existing in the literature, given by Barsomet.al (1971) and
Fisher et.al (1980). Both researchers adopted fracture mechanics approach to explain their
experimental studies on notches with different acuities. However, these two studies are different in
terms of scale of testing and grade of steels used.
Barsomet.al (1971):
Notch effects in fatigue crack initiation behaviour of different grade steels From 250 Mpa (36 Ksi)
to 800 Mpa (110 Ksi) were studied at stress ratio 0.1, in three point bending. The specimenwas
single edge notched specimen as shown in Fig 2-6. They had found the fatigue crack initiation
threshold for different types of steel and it increases with the increase in grade
21
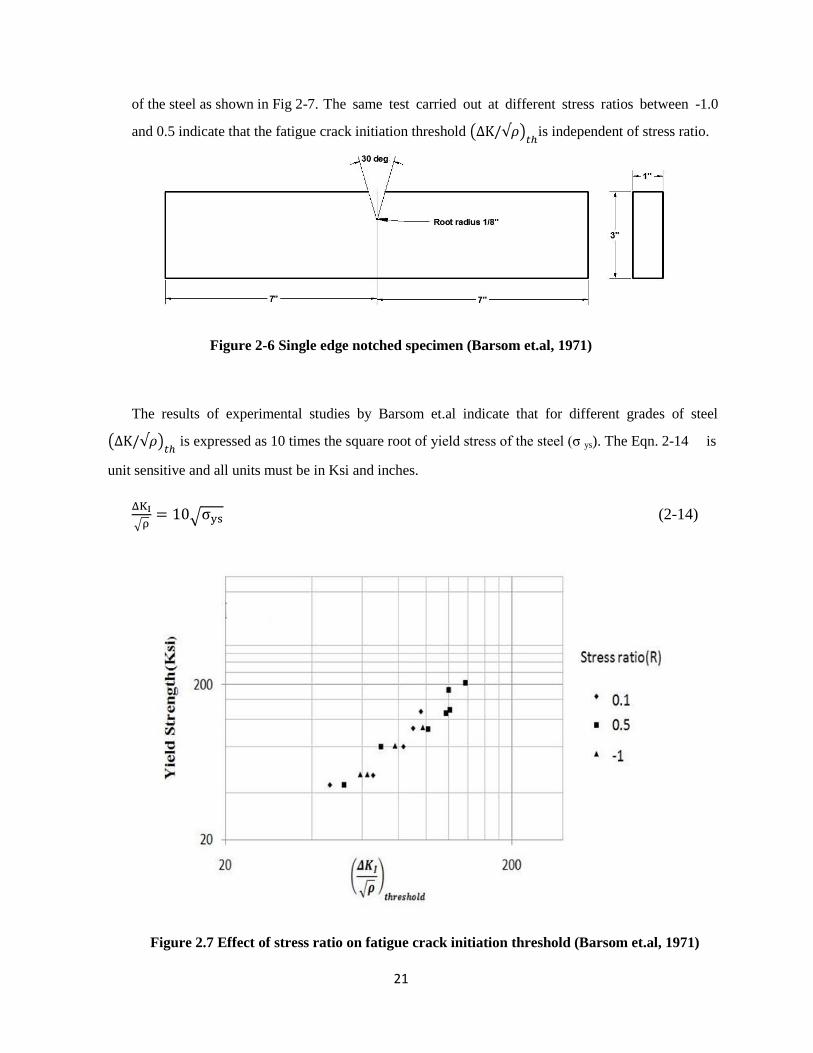
of the steel as shown in Fig 2-7. The same test carried out at different stress ratios between -1.0
and 0.5 indicate that the fatigue crack initiation threshold
is independent of stress ratio.
Figure 2-6 Single edge notched specimen (Barsom et.al, 1971)
The results of experimental studies by Barsom et.al indicate that for different grades of steel
is expressed as 10 times the square root of yield stress of the steel (σ ys). The Eqn. 2-14 is
unit sensitive and all units must be in Ksi and inches.
(2-14)
Figure 2.7 Effect of stress ratio on fatigue crack initiation threshold (Barsom et.al, 1971)
22
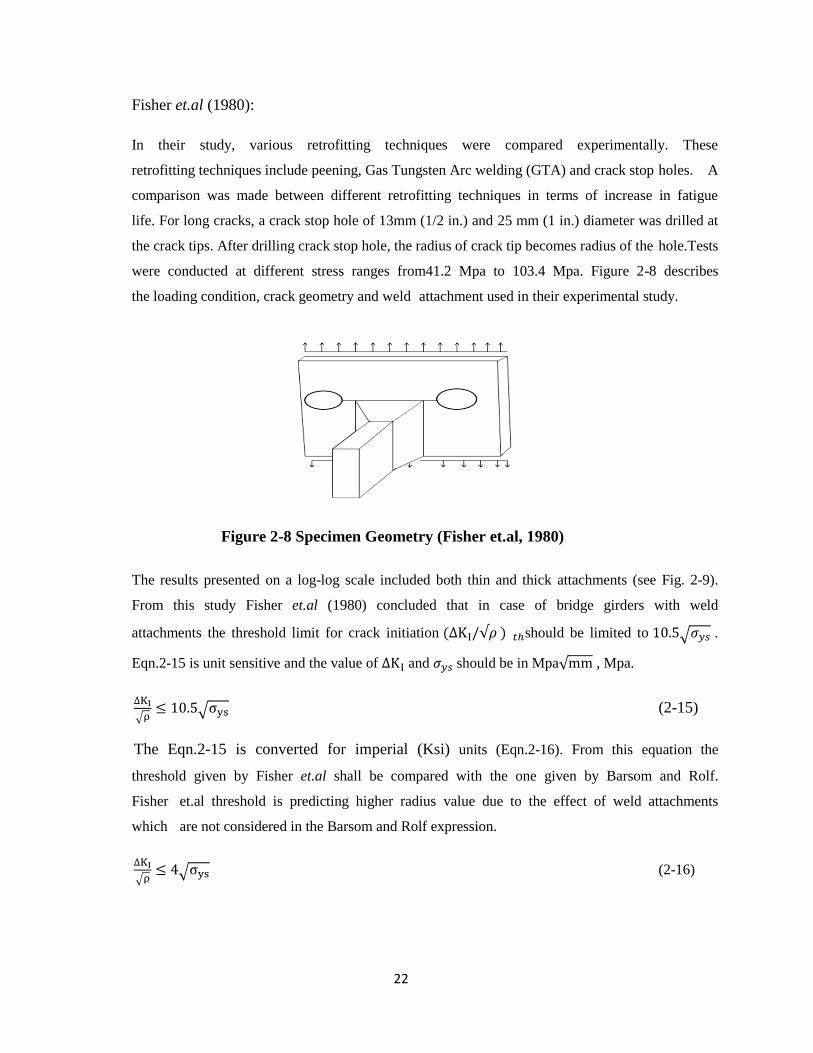
Fisher et.al (1980):
In their study, various retrofitting techniques were compared experimentally. These
retrofitting techniques include peening, Gas Tungsten Arc welding (GTA) and crack stop holes. A
comparison was made between different retrofitting techniques in terms of increase in fatigue
life. For long cracks, a crack stop hole of 13mm (1/2 in.) and 25 mm (1 in.) diameter was drilled at
the crack tips. After drilling crack stop hole, the radius of crack tip becomes radius of the hole.Tests
were conducted at different stress ranges from41.2 Mpa to 103.4 Mpa. Figure 2-8 describes
the loading condition, crack geometry and weld attachment used in their experimental study.
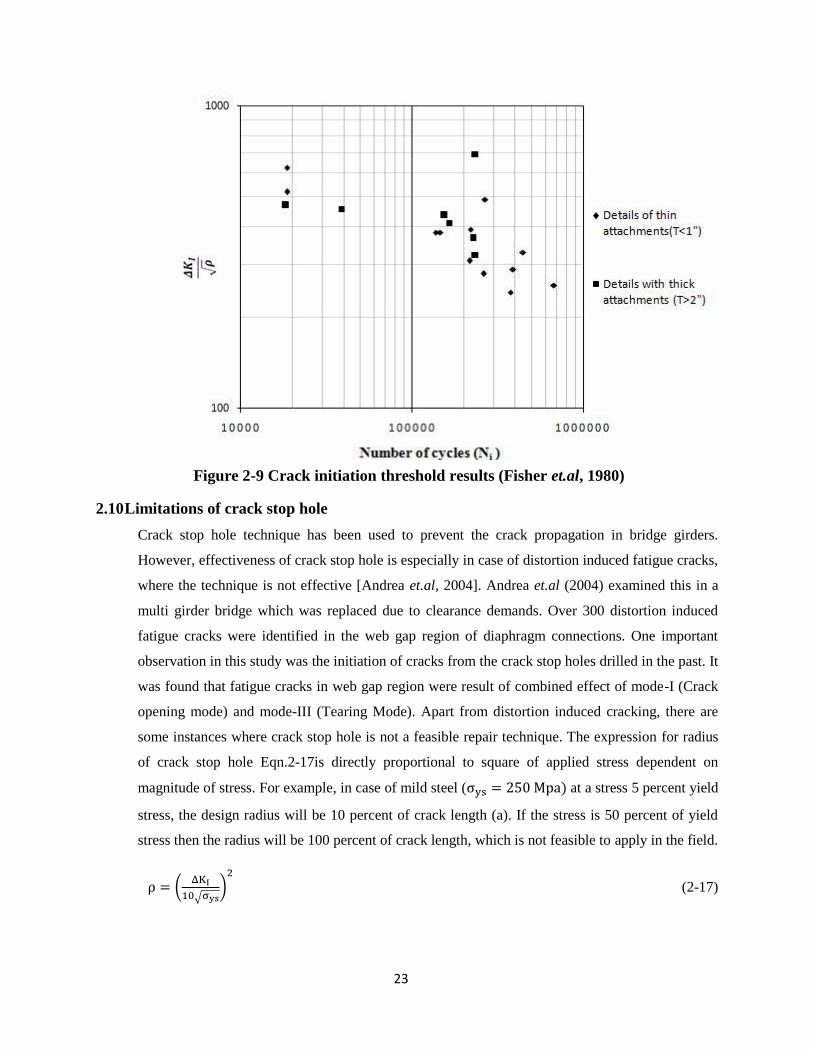
The results presented on a log-log scale included both thin and thick attachments (see Fig. 2-9).
From this study Fisher et.al (1980) concluded that in case of bridge girders with weld
attachments the threshold limit for crack initiation should be limited to .
Eqn.2-15 is unit sensitive and the value of and should be in Mpa , Mpa.
(2-15)
The Eqn.2-15 is converted for imperial (Ksi) units (Eqn.2-16). From this equation the
threshold given by Fisher et.al shall be compared with the one given by Barsom and Rolf.
Fisher et.al threshold is predicting higher radius value due to the effect of weld attachments
which are not considered in the Barsom and Rolf expression.
(2-16)
Figure 2-8 Specimen Geometry (Fisher et.al, 1980)
23
2.10 Limitations of crack stop hole
Crack stop hole technique has been used to prevent the crack propagation in bridge girders.
However, effectiveness of crack stop hole is especially in case of distortion induced fatigue cracks,
where the technique is not effective [Andrea et.al, 2004]. Andrea et.al (2004) examined this in a
multi girder bridge which was replaced due to clearance demands. Over 300 distortion induced
fatigue cracks were identified in the web gap region of diaphragm connections. One important
observation in this study was the initiation of cracks from the crack stop holes drilled in the past. It
was found that fatigue cracks in web gap region were result of combined effect of mode-I (Crack
opening mode) and mode-III (Tearing Mode). Apart from distortion induced cracking, there are
some instances where crack stop hole is not a feasible repair technique. The expression for radius
of crack stop hole Eqn.2-17is directly proportional to square of applied stress dependent on
magnitude of stress. For example, in case of mild steel ( at a stress 5 percent yield
stress, the design radius will be 10 percent of crack length (a). If the stress is 50 percent of yield
stress then the radius will be 100 percent of crack length, which is not feasible to apply in the field.
(2-17)
Figure 2-9 Crack initiation threshold results (Fisher et.al, 1980)
24
2.11 Notch stress intensity factor (N-SIF)
Fatigue crack initiation is a function of stress range, average stress, material, and stress gradient.
The SIF expression for blunt notches given by Creagor and Paris in mode-I Eqn. 2-13, considers the
stress at a characteristic distance Xc ahead of notch tip. This expression Eqn.2-13 is only a function
of notch tip radius. The stress gradient, which also effects the crack initiation, is not considered in
this expression.
(2-18)
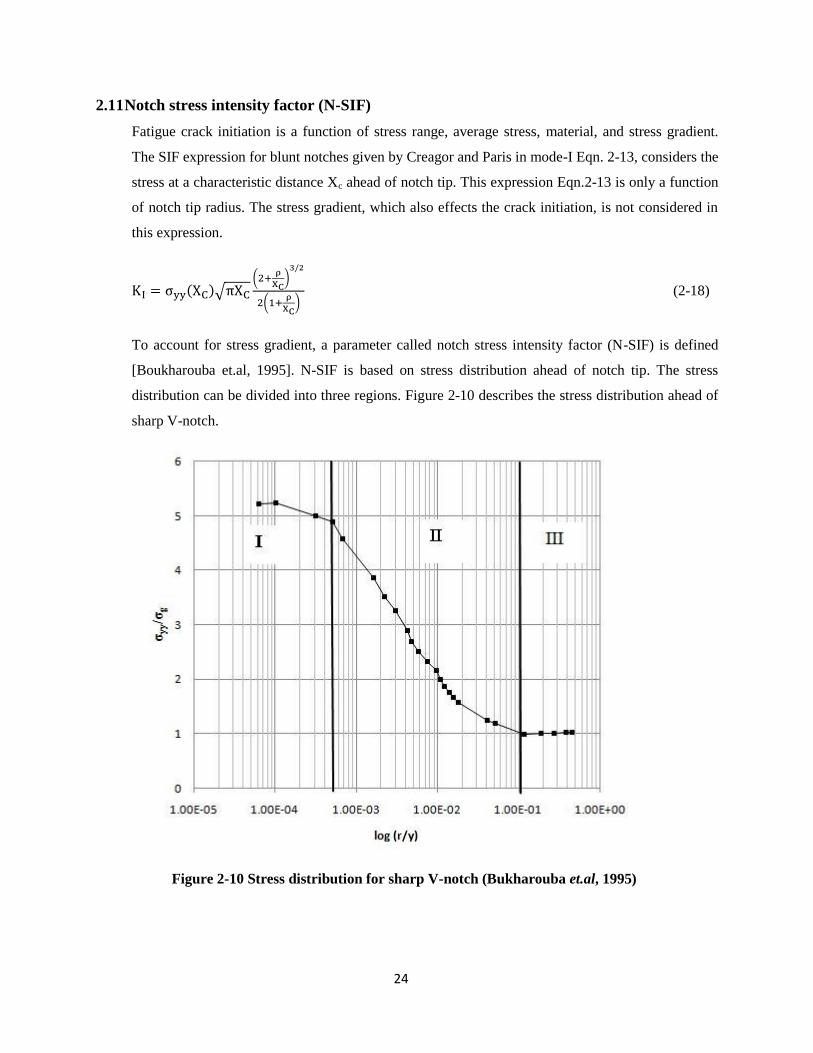
To account for stress gradient, a parameter called notch stress intensity factor (N-SIF) is defined
[Boukharouba et.al, 1995]. N-SIF is based on stress distribution ahead of notch tip. The stress
distribution can be divided into three regions. Figure 2-10 describes the stress distribution ahead of
sharp V-notch.
Figure 2-10 Stress distribution for sharp V-notch (Bukharouba et.al, 1995)
25
Region-I: The maximum stress is constant in this region. This region is defined up to a
characteristic length (XC). Characteristic length is defined as distance up to which stress remains
constant.
Region-II: A Stress distribution is a straight line and slope of this line indicates the stress gradient.
Region-III: The magnitude of the stress is equal to nominal stress applied.
The stress distribution ahead of blunt notch is different from sharp notches up to some distance due
to blunting. The stress at the crack tip will decrease due to blunting. The expression for N-SIF for
blunt notches is given by Boukharoubaet.al, 1995.
(2-19)
In the Eqn. 2-11,
= Stress at characteristic distance
= Radius of the notch
= Stress gradient
2.12 Application of CFRP patches
Application of composite patches over damage panel is one of the crack retardation techniques.
A.A Baker of Royal Australian air force pioneered the technique of using composite patches to
repair the damaged components of aircraft (Baker, 1971). To arrive at the important parameters like
bond behaviour, thickness of the patch Baker carried out a comprehensive study. In most of the
cases Boron epoxy patches were implemented as a repair technique. A number of numerical studies
were carried out in arriving at optimum patch dimensions by various researchers. The possibility of
application of same technique for damaged bridge girders generated lot of research interest.
The application of CFRP to strengthen the damaged bridge girders was studied experimentally
by Miller et.al (2001). To establish this repair technique, the parameters need to be studied are
selection of materials, bond length and durability. Miller et.al (2001) established these
parameters through experimental studies and applied CFRP patches to a damaged bridge girder. In
this study the bridge girder was subjected load test by using a dump truck. The application of
CFRP patches increased the global stiffness and strength of the girder.
26
2.13 Bond length
In CFRP patch repair method, the bond length is an important parameter which affects the
load transfer. To determine the bond length, the axial strain distribution along the CFRP patch
length is considered as a parameter. The expressions for adhesive shear stress (τa), normal
stress in the substrate (σs) and peel stress (σp) for double symmetric adhesive joint were obtained
by using the linear elastic one dimensional solution (Hart-Smith, 1973). This approach was
further extended to tapered joints and reinforcements by Albat and Romilly (1999). Miller
et.al (2001) experimentally studied the bond length between steel plate and CFRP plate. The
strain along CFRP patch length was measured and compared with the theoretical model. It was
observed that 99% of load transfer takes place up to 4in (100 mm) development length. The
bond behaviour and effective bond length studied by Fawziaet.al(2006) indicates the existence of
effective bond length beyond which no significant load transfer takes place.
2.14 Retrofitting the cracks emanating from notches using CFRP patches
The fastener holes, acts as crack initiators in air craft components. To strengthen these holes,
static cold working technique is usually employed. In addition to cold working, CFRP patches
were also used to strengthen these holes. Heller et.al (1989) carried out experimental study to find
out the combined effect of adhesive patches and static cold working. The fastener holes were
strengthened, so that the crack growth from the edges of hole decreases. The testing program
involves two sets of specimens (1) fastener hole with edge notch strengthened using cold working,
(2) fastener hole with both cold working and adhesive patches. From this experimental program
concluded that strengthening with bonded adhesives in addition to bonded sleeve increases fatigue
life by 2 times. Jones.Cet.al (2003) carried out an experimental program to find the effect of
different parameters ranging from surface preparation, development length, and single sided double
sided patch applications on efficiency of patch system. Two types of specimens, central hole and
edge notched were considered. This study, observed that application CFRP overlays are beneficial
both as a preventive and repair technique. The important conclusion from this study is CFRP
patches were effective in arresting the cracks originated from notches.
Tavakkolizadehet.al (2003) conducted experiments on notched steel beams repaired with CFRP
under four point bending load. CFRP patches were applied on tension flanges. He tested a total of
21 specimens of S127*4.5 A36 steel with CFRP patches. The results showed that the CFRP patch
not only tends to extend the fatigue life of the component but also decreases the crack growth. A
review of work done in strengthening of steel structures with composites was presented by Zhao
27
and Zhang (2006). This study indicated that bond behaviour, bond strength and fatigue crack
propagation modelling are important study areas in this repair technique. From these studies the
effectiveness of CFRP in strengthening the damaged steel bridge girders is established. However,
the numerical study required to find out the various parameters of the patch repair system made it
difficult for application. Zhao et.al (2008) came up with an analytical model to predict the fatigue
crack propagation for cracks emanating from CFRP strengthened circular notches.
Achouret.al (2003) performed finite element analysis to understand the effect of composite
patches in retarding the crack from semi circular notches. The stress concentration factor was
decreased by 30% due to patch. The properties of patch system such as patch thickness and
adhesive properties needs to be optimized for the effectiveness of the repair. Alemdaret.al (2012)
conducted a detailed experimental program combined with finite element study to find out
influence of different variables stiffness ratio, Young’s modulus of composite, thickness of
adhesive and no. of layers. It was concluded that stiffness ratio greater than one leads to
diminishing result.
2.15 Summary
From the existing literature it is clear that adhesive patches are one of the most reliable repair
techniques in aerospace engineering. Same technique applied to repair damaged bridge
components. This technique proved to be successful and can be used with conjunction of old
and simple repair technique such as drilling holes. Jones.Cet.al (2003) experimentally demonstrated
the effect of CFRP patches along with circular notch. Their study showed that fatigue life of the
specimen increased by more than 50% when CFRP was applied over cracks emanated from central
hole. Previous experimental studies conducted by various researchers proved that the
combination of hole and composite patch are effective. However, there is a need to study the
combined action of CFRP patch and hole both numerically and experimentally. In current study
fracture mechanics approach is considered to study this combined action.
28
Chapter 3
Finite element modelling
3.1 Introduction
Finite element analysis (FEA) is conducted in this study using ANSYS 12.0 software. For
modelling all components (i.e. steel plate, adhesive, and CFRP plate) Solid 186 element is used.
Solid 186 element has mid side nodes and perform better in stress singularity regions. The bond
between steel substrate and CFRP patches is assumed to be perfect and modelled as bonded contact
by using multi point constraint (MPC) algorithm. Static tensile load is applied for all the analysis.
3.2 Specimen Dimensions
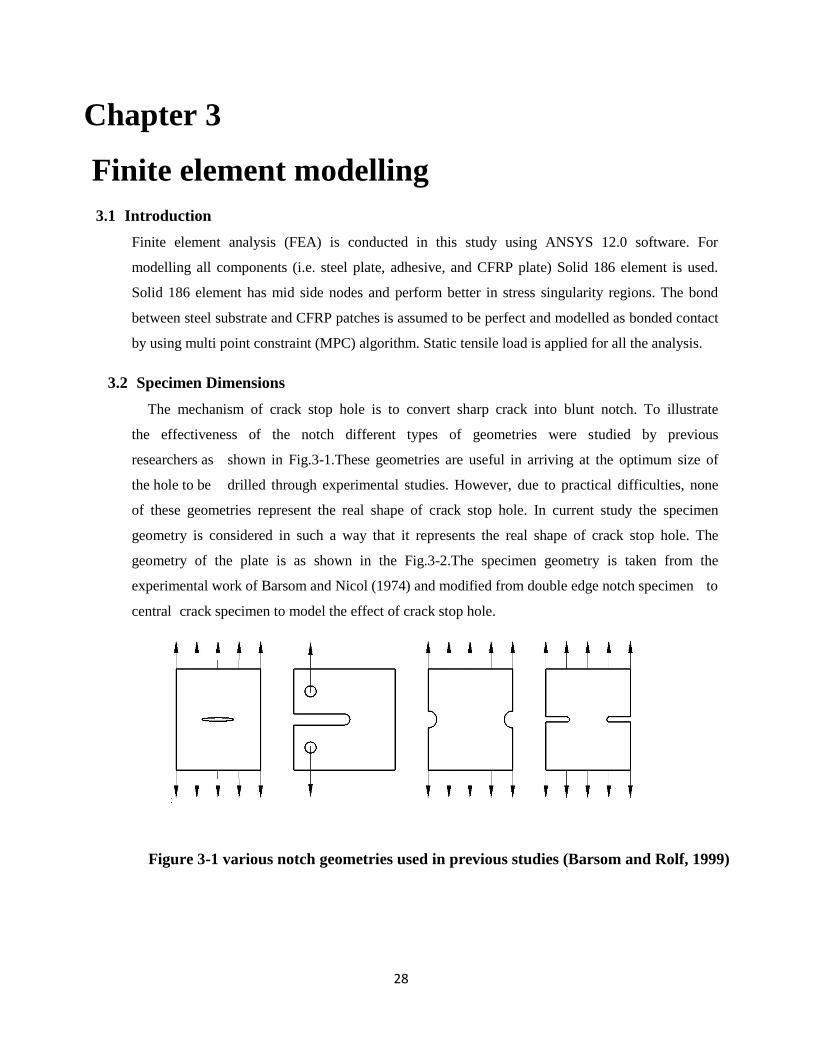
The mechanism of crack stop hole is to convert sharp crack into blunt notch. To illustrate
the effectiveness of the notch different types of geometries were studied by previous
researchers as shown in Fig.3-1.These geometries are useful in arriving at the optimum size of
the hole to be drilled through experimental studies. However, due to practical difficulties, none
of these geometries represent the real shape of crack stop hole. In current study the specimen
geometry is considered in such a way that it represents the real shape of crack stop hole. The
geometry of the plate is as shown in the Fig.3-2.The specimen geometry is taken from the
experimental work of Barsom and Nicol (1974) and modified from double edge notch specimen to
central crack specimen to model the effect of crack stop hole.
Figure 3-1 various notch geometries used in previous studies (Barsom and Rolf, 1999)
29
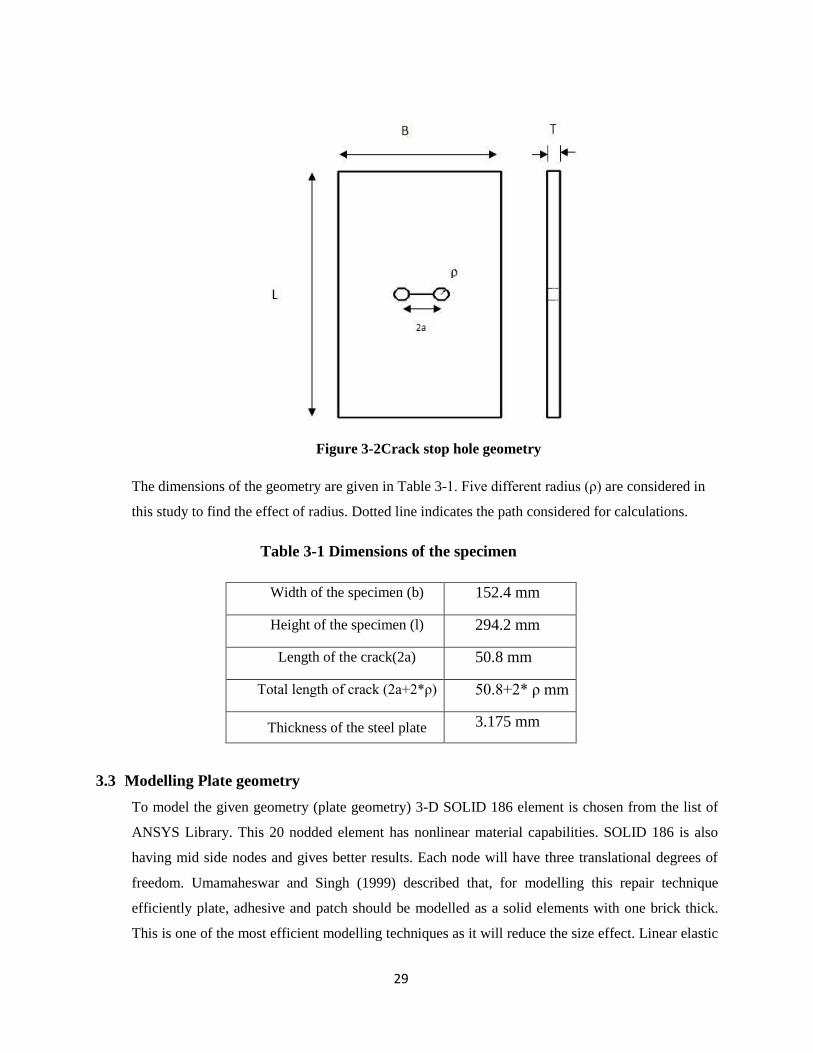
The dimensions of the geometry are given in Table 3-1. Five different radius ( ) are considered in
this study to find the effect of radius. Dotted line indicates the path considered for calculations.
Width of the specimen (b) 152.4 mm
Height of the specimen (l) 294.2 mm
Length of the crack(2a) 50.8 mm
Total length of crack (2a+2* ) 50.8+2* mm
Thickness of the steel plate 3.175 mm
3.3 Modelling Plate geometry
To model the given geometry (plate geometry) 3-D SOLID 186 element is chosen from the list of
ANSYS Library. This 20 nodded element has nonlinear material capabilities. SOLID 186 is also
having mid side nodes and gives better results. Each node will have three translational degrees of
freedom. Umamaheswar and Singh (1999) described that, for modelling this repair technique
efficiently plate, adhesive and patch should be modelled as a solid elements with one brick thick.
This is one of the most efficient modelling techniques as it will reduce the size effect. Linear elastic
Figure 3-2Crack stop hole geometry
Table 3-1 Dimensions of the specimen
30
material behaviour is considered. This assumption is needed as the expression for crack stop hole
existing in the literature in terms of SIF, which is under linear elastic assumption. However, this
assumption is valid in most of the cases due to the fact that most of the bridge girders loaded well
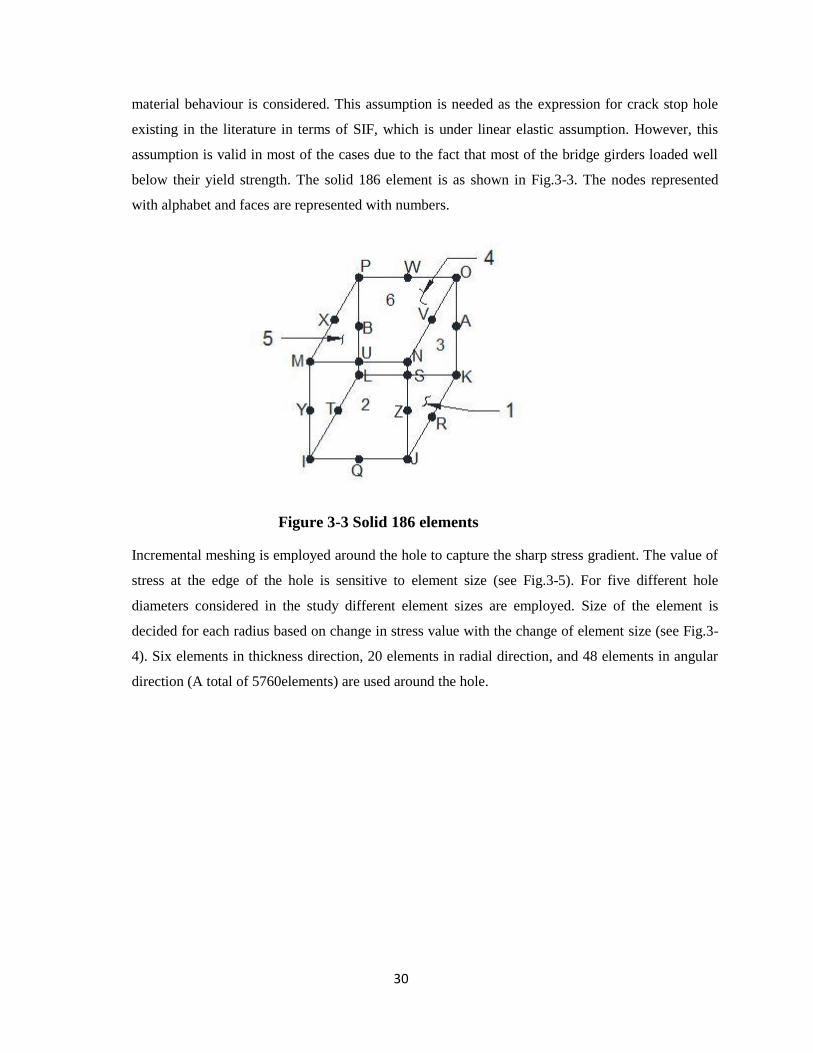
below their yield strength. The solid 186 element is as shown in Fig.3-3. The nodes represented
with alphabet and faces are represented with numbers.
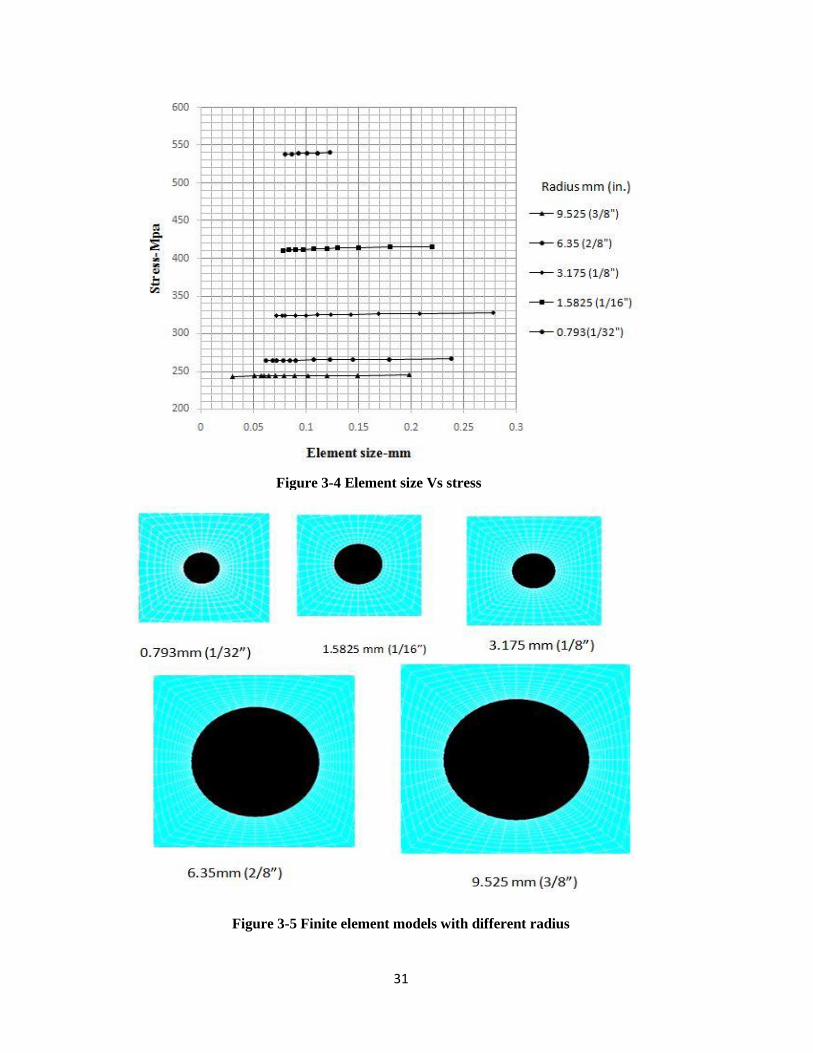
Incremental meshing is employed around the hole to capture the sharp stress gradient. The value of
stress at the edge of the hole is sensitive to element size (see Fig.3-5). For five different hole
diameters considered in the study different element sizes are employed. Size of the element is
decided for each radius based on change in stress value with the change of element size (see Fig.3-
4). Six elements in thickness direction, 20 elements in radial direction, and 48 elements in angular
direction (A total of 5760elements) are used around the hole.
Figure 3-3 Solid 186 elements
31
Figure 3-5 Finite element models with different radius
Figure 3-4 Element size Vs stress
32
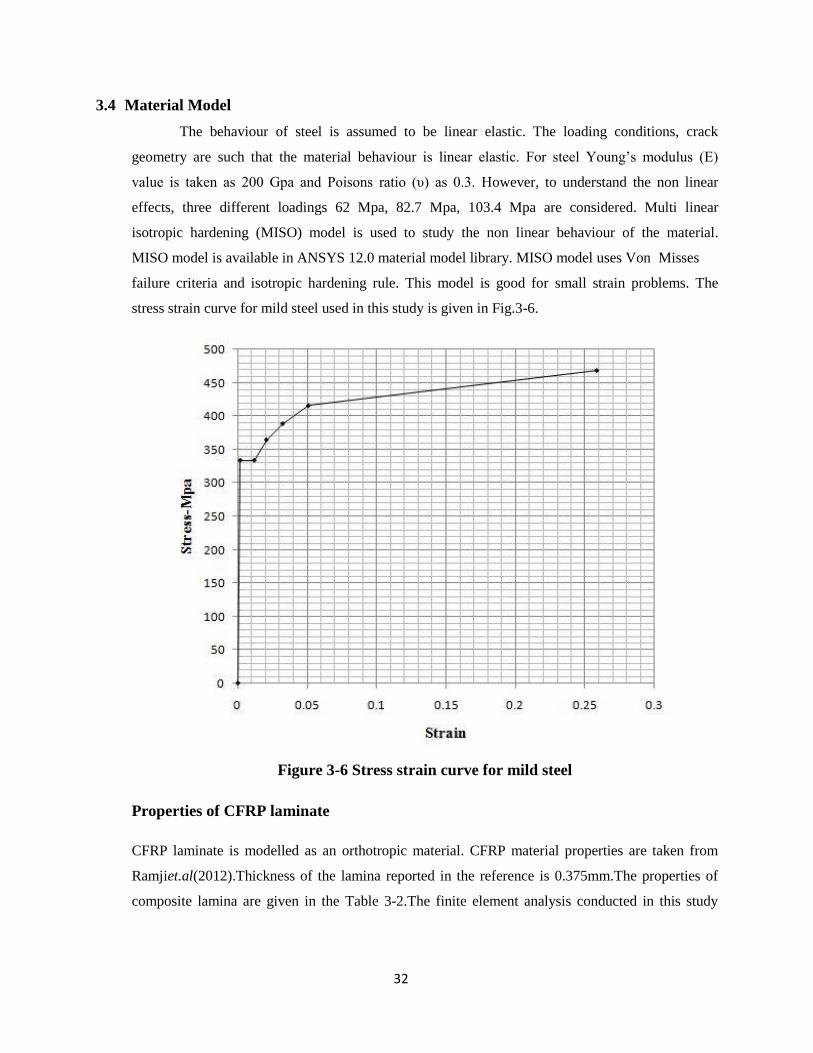
3.4 Material Model
The behaviour of steel is assumed to be linear elastic. The loading conditions, crack
geometry are such that the material behaviour is linear elastic. For steel Young’s modulus (E)
value is taken as 200 Gpa and Poisons ratio (υ) as 0.3. However, to understand the non linear
effects, three different loadings 62 Mpa, 82.7 Mpa, 103.4 Mpa are considered. Multi linear
isotropic hardening (MISO) model is used to study the non linear behaviour of the material.
MISO model is available in ANSYS 12.0 material model library. MISO model uses Von Misses
failure criteria and isotropic hardening rule. This model is good for small strain problems. The
stress strain curve for mild steel used in this study is given in Fig.3-6.
Figure 3-6 Stress strain curve for mild steel
Properties of CFRP laminate
CFRP laminate is modelled as an orthotropic material. CFRP material properties are taken from
Ramjiet.al(2012).Thickness of the lamina reported in the reference is 0.375mm.The properties of
composite lamina are given in the Table 3-2.The finite element analysis conducted in this study
33
indicates that the Eqn.2-8 is able to predict the stress within 10% error up to a radius 0.2in.(4.57
mm). This is in agreement with finite element analysis conducted by Wilson and Gabrielse (1971).
Table 3.2 Material Propertied Used in this study Ramjiet.al(2012)
E: Young’s modulus; G: shear modulus; υ: Poisson’s ratio
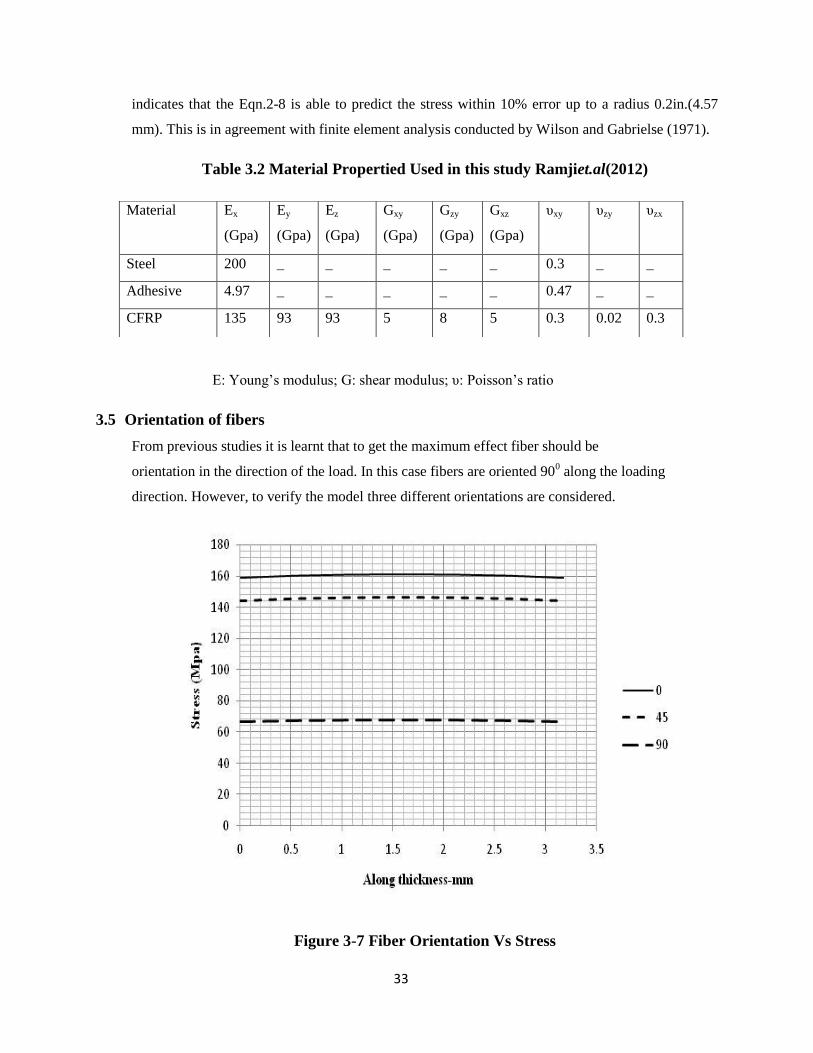
3.5 Orientation of fibers
From previous studies it is learnt that to get the maximum effect fiber should be
orientation in the direction of the load. In this case fibers are oriented 900 along the loading
direction. However, to verify the model three different orientations are considered.
Figure 3-7 Fiber Orientation Vs Stress
Material Ex
(Gpa)
Ey
(Gpa)
Ez
(Gpa)
Gxy
(Gpa)
Gzy
(Gpa)
Gxz
(Gpa)
υxy υzy υzx
Steel 200 _ _ _ _ _ 0.3 _ _
Adhesive 4.97 _ _ _ _ _ 0.47 _ _
CFRP 135 93 93 5 8 5 0.3 0.02 0.3
34
To utilize the fiber strength effectively, fibers need to align in the direction of applied load.
However, different fiber orientations are considered and analyzed. Among these three Orientations
patch layup gives more stress reduction. From Fig. 3-7 the through thickness stress reduction is
more for patch layup.
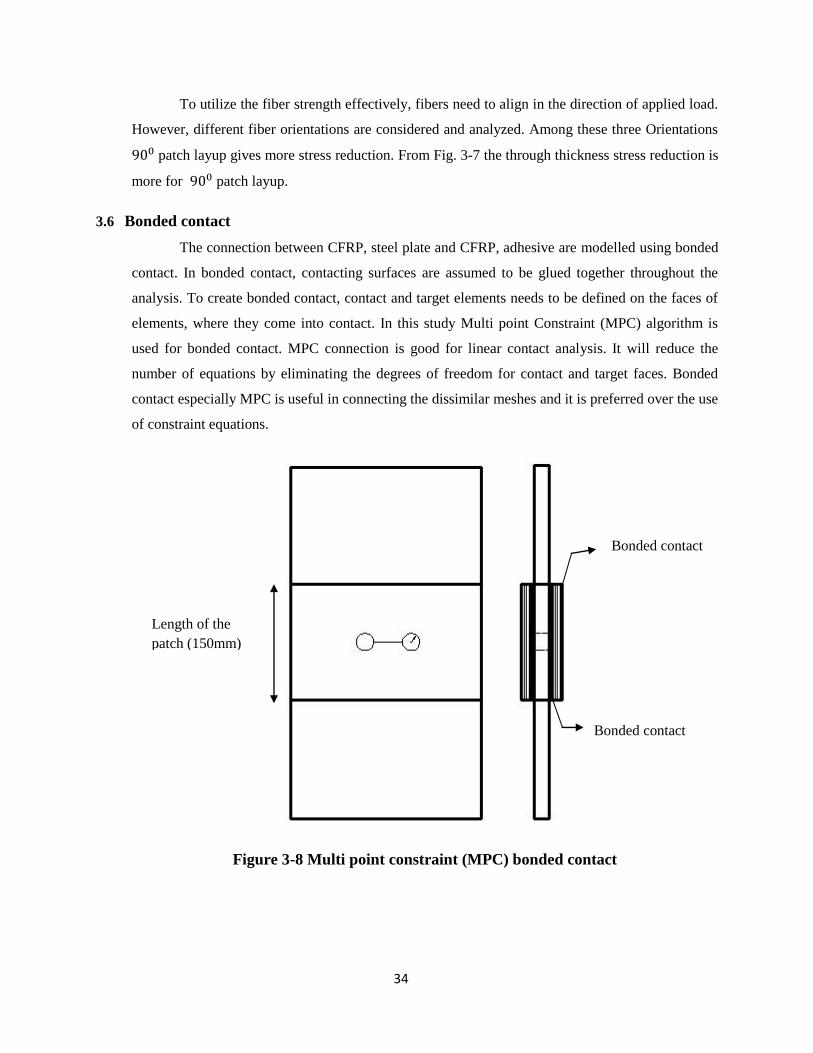
3.6 Bonded contact
The connection between CFRP, steel plate and CFRP, adhesive are modelled using bonded
contact. In bonded contact, contacting surfaces are assumed to be glued together throughout the
analysis. To create bonded contact, contact and target elements needs to be defined on the faces of
elements, where they come into contact. In this study Multi point Constraint (MPC) algorithm is
used for bonded contact. MPC connection is good for linear contact analysis. It will reduce the
number of equations by eliminating the degrees of freedom for contact and target faces. Bonded
contact especially MPC is useful in connecting the dissimilar meshes and it is preferred over the use
of constraint equations.
Figure 3-8 Multi point constraint (MPC) bonded contact
Length of the
patch (150mm)
Bonded contact
Bonded contact

35
The following are the steps followed in the contact analysis:
1. The geometry of crack stop hole specimen and CFRP patches created
2. All geometries are meshed with solid 186 elements (see Fig.3-8)
3. A new contact pair is defined using contact wizard
4. A surface to surface contact is defined
5. Contact and target areas defined
6. A linear contact is used
7. MPC algorithm is selected for bonded contact.
Same steps are followed for all four contact pairs generated.
36
Chapter 4
Results and Discussions
4.1 Introduction
This numerical study is aimed at studying the combined action of crack stop hole and CFRP
patch in arriving at appropriate crack stop hole radius when subjected to static tensile load.
Prior to the combined effect, the effect of bare steel specimen was studied to understand the
effect of hole radius in crack retardation. It was observed that the existing equations for
crack stop hole was unconservative due to the fact that a constant stress gradient (α =0.5)
was used irrespective of the hole radius. To study the combined action of CFRP patch and
hole radius, various stiffness ratios were considered. In addition, non-linear analyses were
also carried out to calculate the notch stress intensity factor (N-SIF).
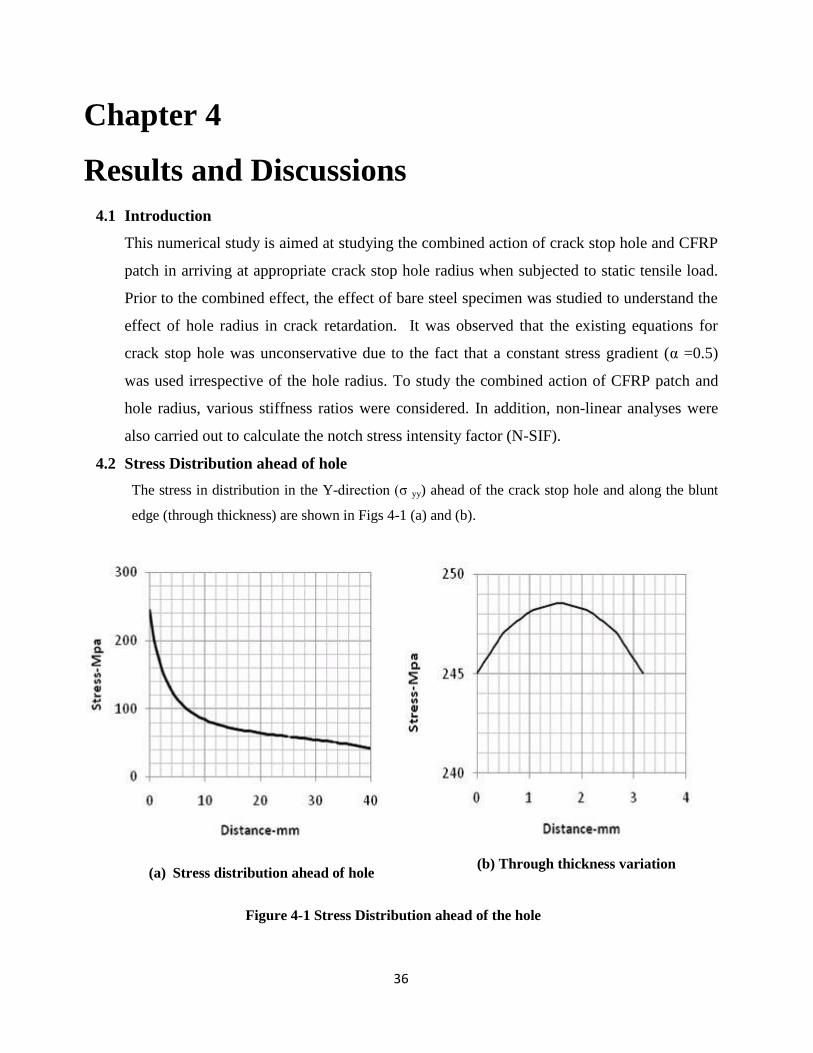
4.2 Stress Distribution ahead of hole
The stress in distribution in the Y-direction (σ yy) ahead of the crack stop hole and along the blunt
edge (through thickness) are shown in Figs 4-1 (a) and (b).
(a) Stress distribution ahead of hole (b) Through thickness variation
Figure 4-1 Stress Distribution ahead of the hole
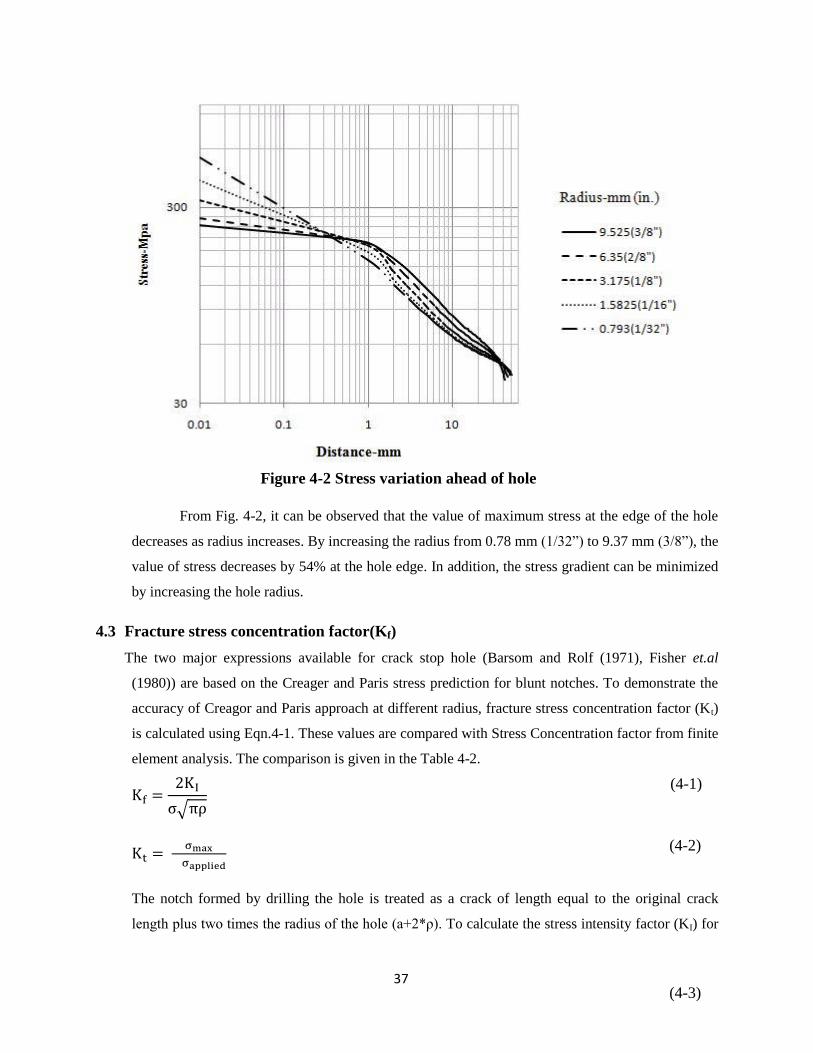
37
From Fig. 4-2, it can be observed that the value of maximum stress at the edge of the hole
decreases as radius increases. By increasing the radius from 0.78 mm (1/32”) to 9.37 mm (3/8”), the
value of stress decreases by 54% at the hole edge. In addition, the stress gradient can be minimized
by increasing the hole radius.
4.3 Fracture stress concentration factor(Kf)
The two major expressions available for crack stop hole (Barsom and Rolf (1971), Fisher et.al
(1980)) are based on the Creager and Paris stress prediction for blunt notches. To demonstrate the
accuracy of Creagor and Paris approach at different radius, fracture stress concentration factor (Kt)
is calculated using Eqn.4-1. These values are compared with Stress Concentration factor from finite
element analysis. The comparison is given in the Table 4-2.
The notch formed by drilling the hole is treated as a crack of length equal to the original crack
length plus two times the radius of the hole (a+2* ). To calculate the stress intensity factor (KI) for
(4-2)
(4-1)
(4-3)
Figure 4-2 Stress variation ahead of hole
38
central crack, the Eqn. 4-3 given by Paris and Sih (1965) is used. In Eqn.4-3, the dimensions of the
crack stop hole geometry (see Fig.
In the above expression,
Length of the crack (2a) = (50+2* ) mm
Width of the plate (2b) =152.4 mm
Applied stress (σ) = 41.2 Mpa
Table 4.1 Calculation of Stress intensity Factor (SIF)
Radius of the hole mm
(inch)
Length of crack (a+2* ) (mm)
(Mpa
9.56 (3/8”) 69.8 630.80
6.35 (1/4”) 63.5 551.93
3.17 (1/8”) 57.15 480.61
1.58 (1/16”) 53.97 447.28
0.79 (1/32”) 52.38 431.11
The value of SIF (KI) from Table 4.1 is substituted in Eqn. 4-1 to obtain the fracture stress
concentration factor. The stress concentration factor (Kt) for different radii is presented in Table4-
2. It can be observed from Table 4.2 that the regular stress concentration factor shows conservative
results compared to fracture stress concentration factor.
Table 4.2 Comparison between K f and Kt
Radius of the hole
(mm)
Maximum Stress
(Mpa)
K f Kt
9.56 (3/8”) 245 5.15 5.94 13.35
6.35 (1/4”) 266 5.85 6.40 8.55
3.17 (1/8”) 327 7.25 7.83 7.40
1.58 (1/16”) 412 9.57 10.0 4.27
0.79 (1/32”) 534 13.07 13.10 0.22
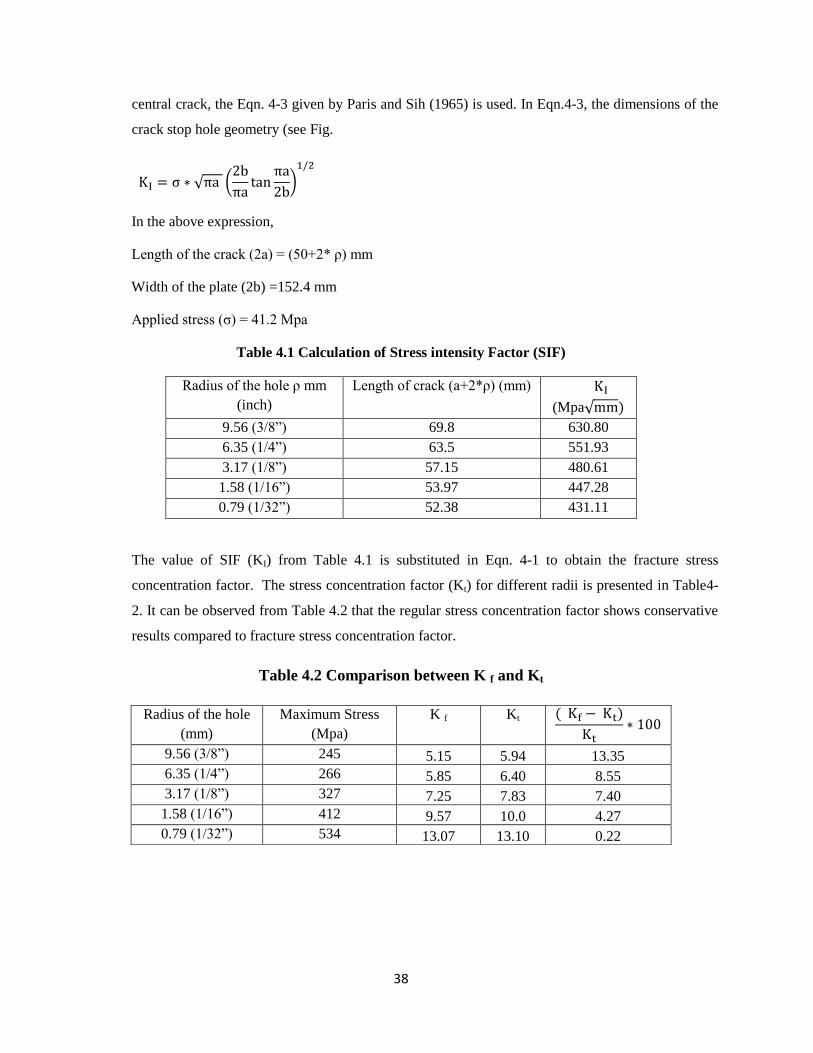
39
A graphical comparison of the two stress concentration factors listed in Table 4.2 is shown in Fig.
4.3. The figure indicates that the values of fracture stress concentration factor (Kf) is approaching
to stress concentration factor (Kt) as radius of the hole decreases. The Kt value is more compared
to Kfas the radius of the hole increases. This means, fracture mechanics approach underestimates
the stress values at higher values of radius. This may be due to the stress gradient effect. LEFM
approach adopts a constant stress gradient 0.5 for all radii, which is not true. From finite element
studies it is observed that the stress gradient reduces from 0.439 to 0.09 as the radius increases
from 0.783 mm to 9.525 mm. (Fig.4-14). This may be the reason for lesser stress prediction in
fracture mechanics method. However, up to 0.25 in radius (6.35 mm) the error is less than 10%.
The FE study conducted in this research work is in agreement with finite element analysis
conducted by Wilson and Gabrielse (1971).
Figure 4.3 SCF vs. Radius
40
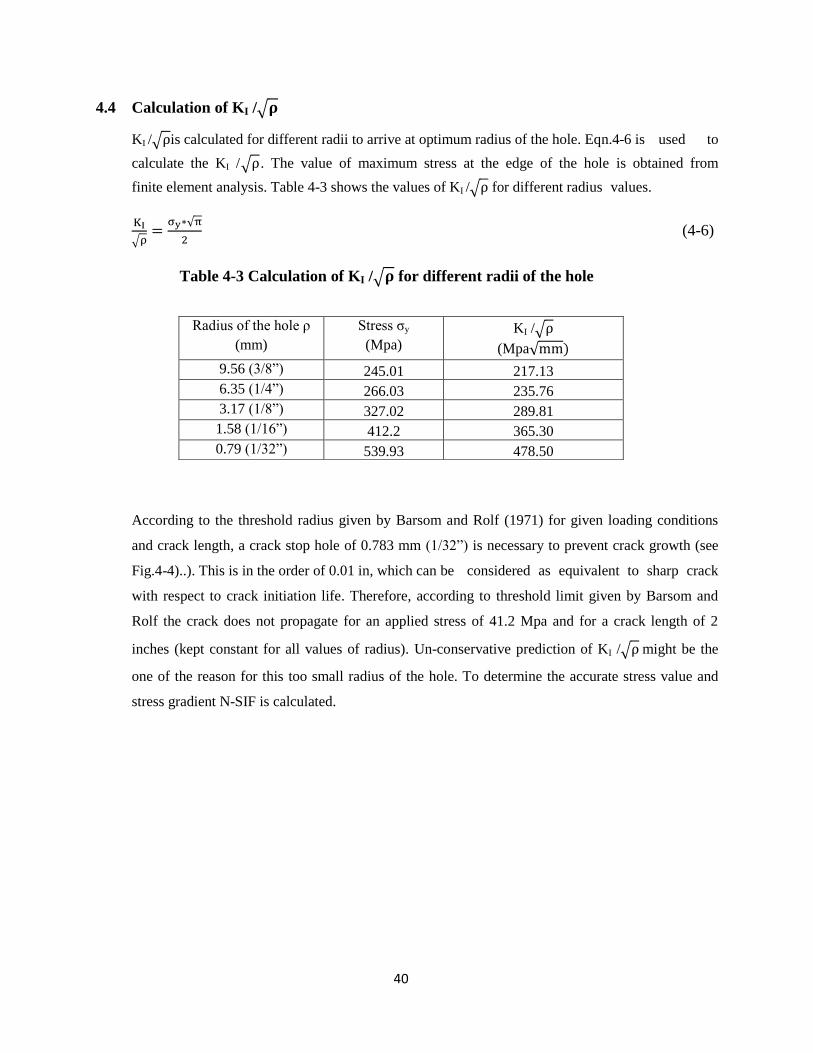
4.4 Calculation of KI /
KI / is calculated for different radii to arrive at optimum radius of the hole. Eqn.4-6 is used to
calculate the KI / . The value of maximum stress at the edge of the hole is obtained from
finite element analysis. Table 4-3 shows the values of KI / for different radius values.
Table 4-3 Calculation of KI / for different radii of the hole
According to the threshold radius given by Barsom and Rolf (1971) for given loading conditions
and crack length, a crack stop hole of 0.783 mm (1/32”) is necessary to prevent crack growth (see
Fig.4-4)..). This is in the order of 0.01 in, which can be considered as equivalent to sharp crack
with respect to crack initiation life. Therefore, according to threshold limit given by Barsom and
Rolf the crack does not propagate for an applied stress of 41.2 Mpa and for a crack length of 2
inches (kept constant for all values of radius). Un-conservative prediction of KI / might be the
one of the reason for this too small radius of the hole. To determine the accurate stress value and
stress gradient N-SIF is calculated.
Radius of the hole
(mm)
Stress σy
(Mpa) KI /
(Mpa
9.56 (3/8”) 245.01 217.13
6.35 (1/4”) 266.03 235.76
3.17 (1/8”) 327.02 289.81
1.58 (1/16”) 412.2 365.30
0.79 (1/32”) 539.93 478.50
(4-6)
41
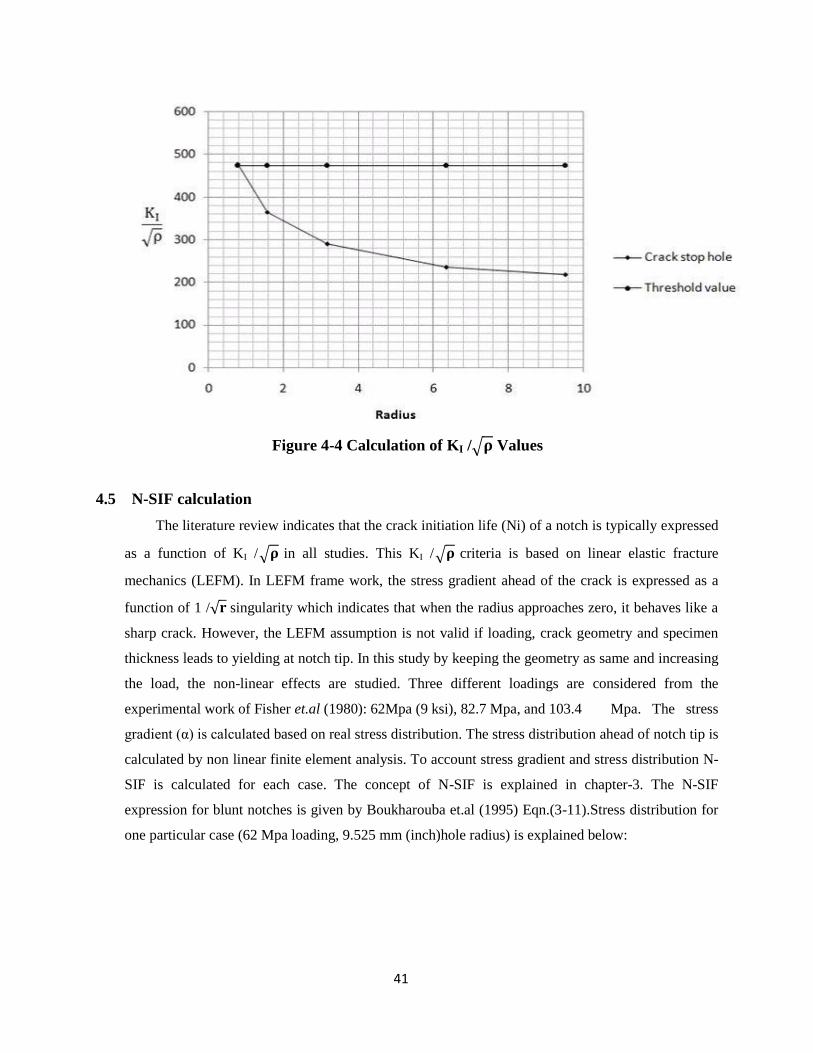
4.5 N-SIF calculation
The literature review indicates that the crack initiation life (Ni) of a notch is typically expressed
as a function of KI / in all studies. This KI / criteria is based on linear elastic fracture
mechanics (LEFM). In LEFM frame work, the stress gradient ahead of the crack is expressed as a
function of 1 / singularity which indicates that when the radius approaches zero, it behaves like a
sharp crack. However, the LEFM assumption is not valid if loading, crack geometry and specimen
thickness leads to yielding at notch tip. In this study by keeping the geometry as same and increasing
the load, the non-linear effects are studied. Three different loadings are considered from the
experimental work of Fisher et.al (1980): 62Mpa (9 ksi), 82.7 Mpa, and 103.4 Mpa. The stress
gradient (α) is calculated based on real stress distribution. The stress distribution ahead of notch tip is
calculated by non linear finite element analysis. To account stress gradient and stress distribution N-
SIF is calculated for each case. The concept of N-SIF is explained in chapter-3. The N-SIF
expression for blunt notches is given by Boukharouba et.al (1995) Eqn.(3-11).Stress distribution for
one particular case (62 Mpa loading, 9.525 mm (inch)hole radius) is explained below:
Figure 4-4 Calculation of KI / Values
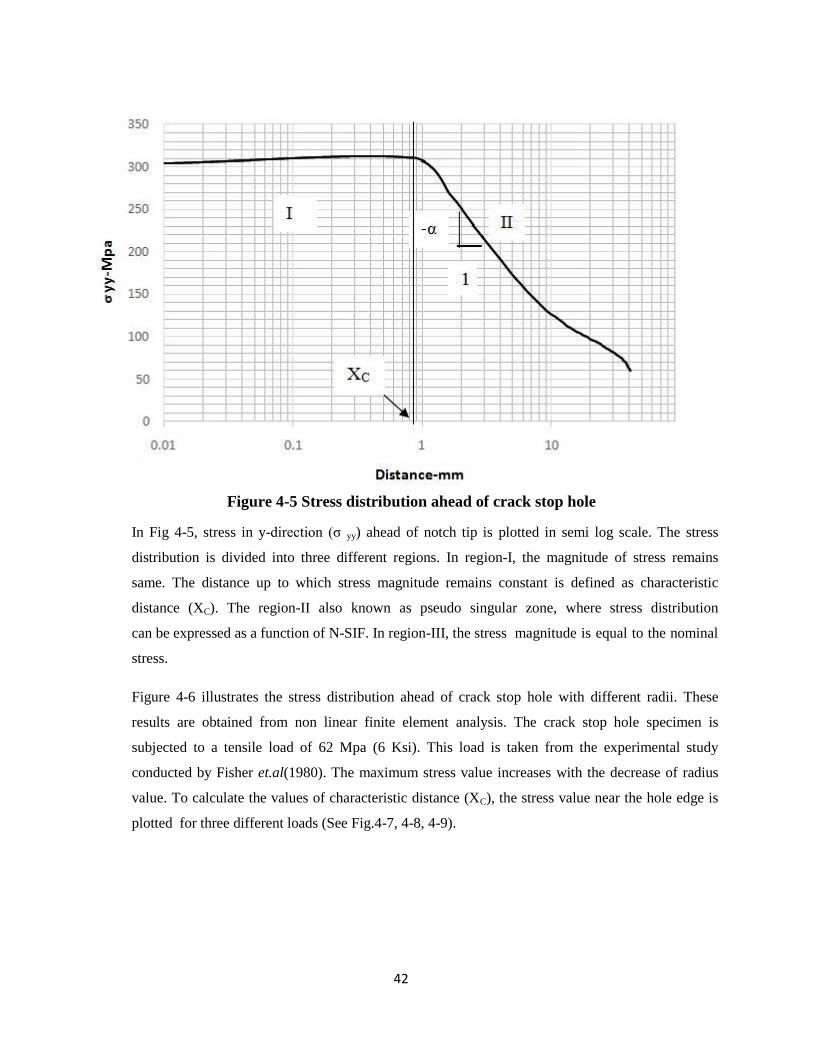
42
In Fig 4-5, stress in y-direction (σ yy) ahead of notch tip is plotted in semi log scale. The stress
distribution is divided into three different regions. In region-I, the magnitude of stress remains
same. The distance up to which stress magnitude remains constant is defined as characteristic
distance (XC). The region-II also known as pseudo singular zone, where stress distribution
can be expressed as a function of N-SIF. In region-III, the stress magnitude is equal to the nominal
stress.
Figure 4-6 illustrates the stress distribution ahead of crack stop hole with different radii. These
results are obtained from non linear finite element analysis. The crack stop hole specimen is
subjected to a tensile load of 62 Mpa (6 Ksi). This load is taken from the experimental study
conducted by Fisher et.al(1980). The maximum stress value increases with the decrease of radius
value. To calculate the values of characteristic distance (XC), the stress value near the hole edge is
plotted for three different loads (See Fig.4-7, 4-8, 4-9).
Figure 4-5 Stress distribution ahead of crack stop hole
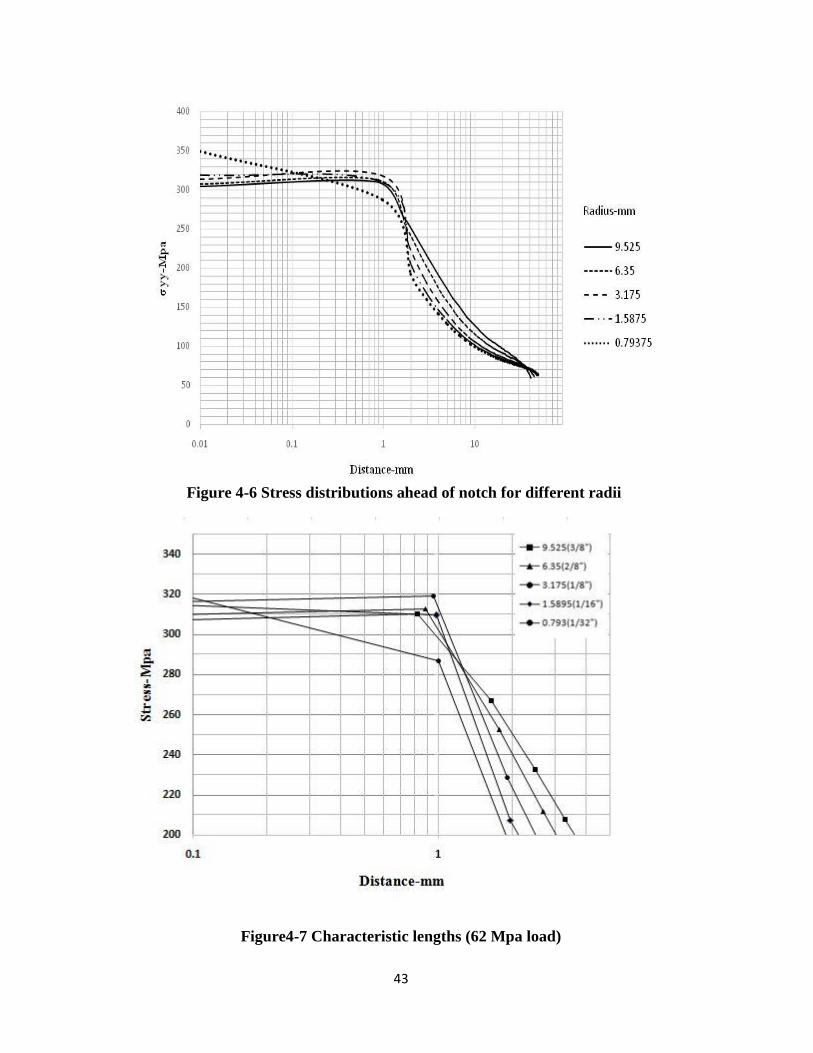
43
Figure4-7 Characteristic lengths (62 Mpa load)
Figure 4-6 Stress distributions ahead of notch for different radii

44
Figure 4-8 Characteristic lengths (82 Mpa load)
Figure 4-9 Characteristic lengths (103.4 Mpa load)
45
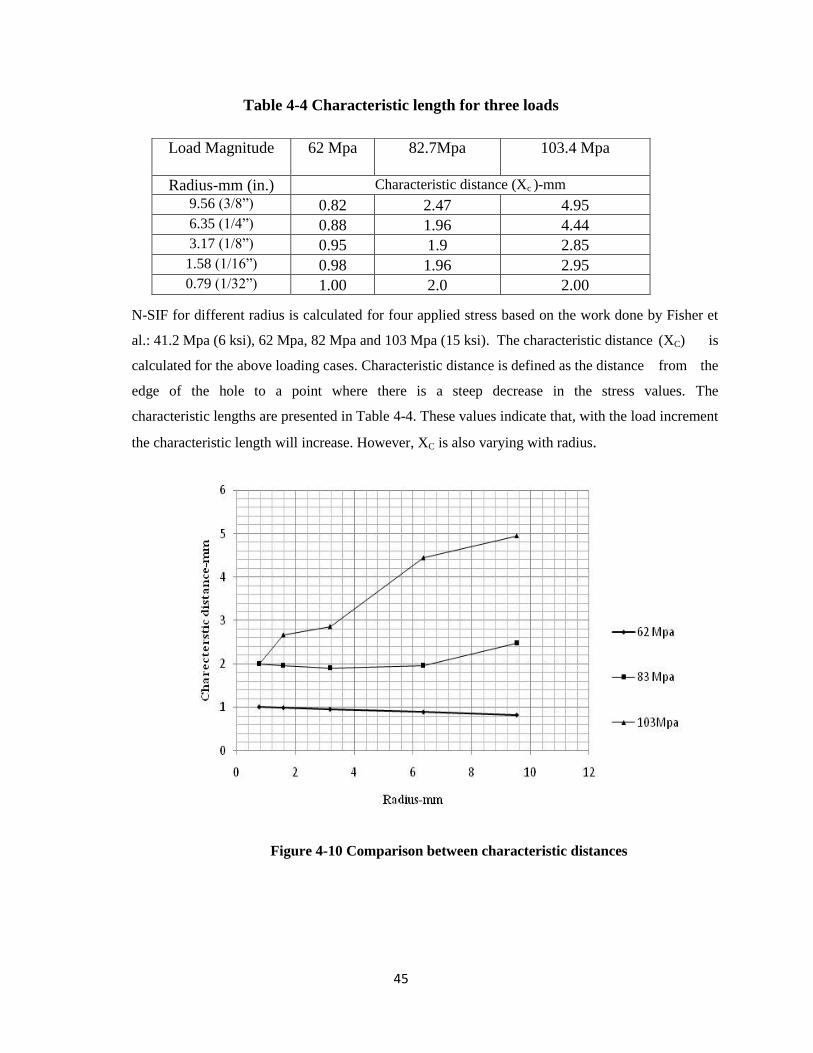
Table 4-4 Characteristic length for three loads
N-SIF for different radius is calculated for four applied stress based on the work done by Fisher et
al.: 41.2 Mpa (6 ksi), 62 Mpa, 82 Mpa and 103 Mpa (15 ksi). The characteristic distance (XC) is
calculated for the above loading cases. Characteristic distance is defined as the distance from the
edge of the hole to a point where there is a steep decrease in the stress values. The
characteristic lengths are presented in Table 4-4. These values indicate that, with the load increment
the characteristic length will increase. However, XC is also varying with radius.
Figure 4-10 Comparison between characteristic distances
Load Magnitude 62 Mpa 82.7Mpa 103.4 Mpa
Radius-mm (in.) Characteristic distance (Xc )-mm
9.56 (3/8”) 0.82 2.47 4.95 6.35 (1/4”) 0.88 1.96 4.44 3.17 (1/8”) 0.95 1.9 2.85 1.58 (1/16”) 0.98 1.96 2.95 0.79 (1/32”) 1.00 2.0 2.00

46
4.6 Gradient calculation(α)
The stress gradient is calculated by plotting the stress distribution ahead of the hole on a
log-log scale. In the calculation of KI / this decrease in gradient is not considered and is
assumed a constant stress gradient of 0.5 is considered for all radii.
Figure 4-11Gradient for different radii (62 Mpa)
Figure 4-12Gradient for different radii (82 Mpa)
47
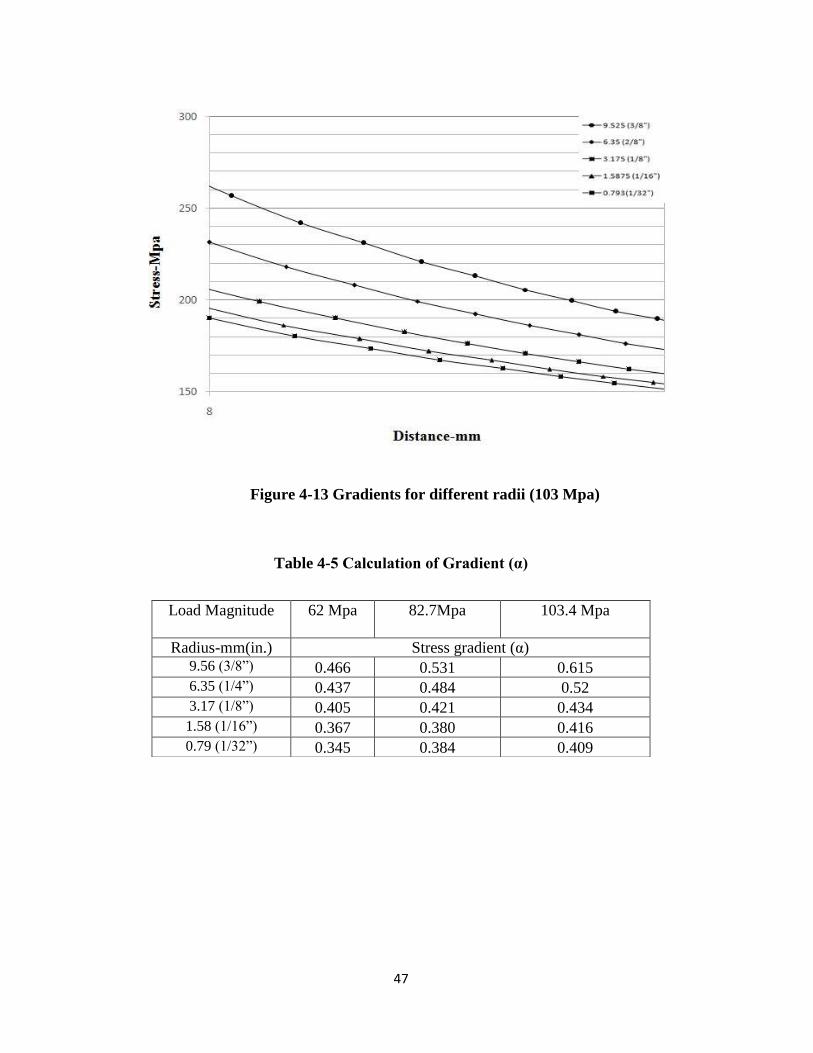
Figure 4-13 Gradients for different radii (103 Mpa)
Table 4-5 Calculation of Gradient (α)
Load Magnitude 62 Mpa 82.7Mpa 103.4 Mpa
Radius-mm(in.) Stress gradient (α) 9.56 (3/8”) 0.466 0.531 0.615 6.35 (1/4”) 0.437 0.484 0.52 3.17 (1/8”) 0.405 0.421 0.434 1.58 (1/16”) 0.367 0.380 0.416 0.79 (1/32”) 0.345 0.384 0.409
48
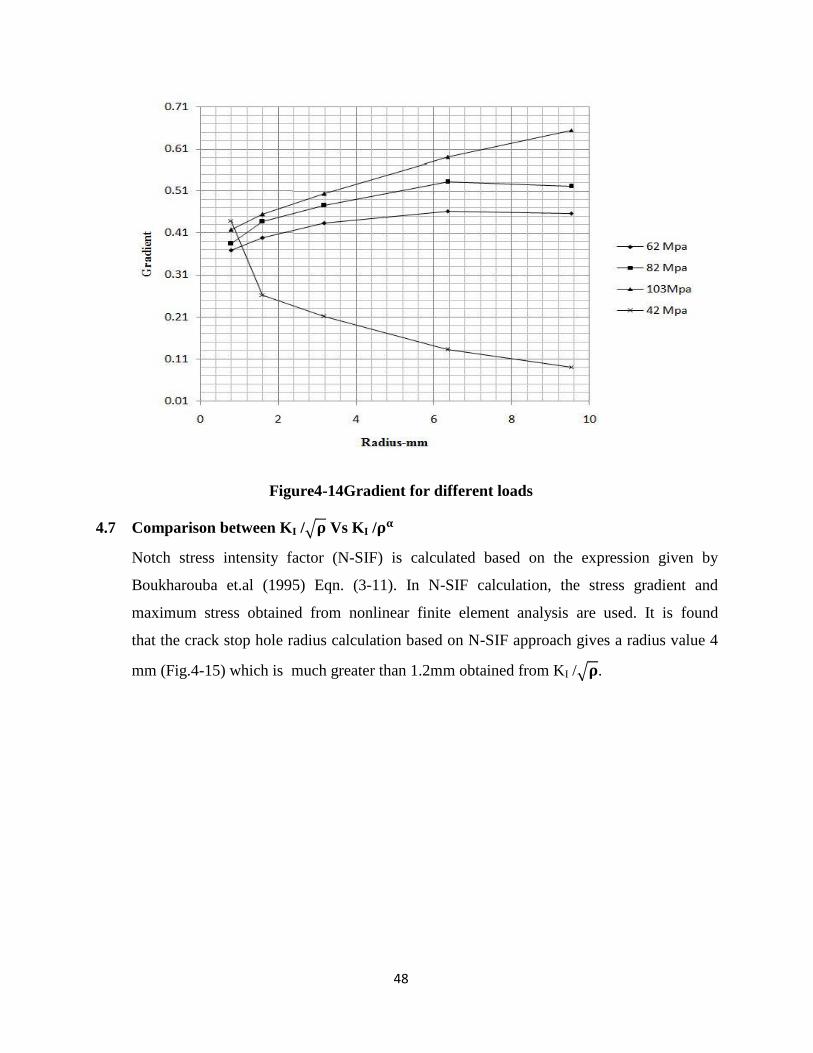
Figure4-14Gradient for different loads
4.7 Comparison between KI / Vs KI /
Notch stress intensity factor (N-SIF) is calculated based on the expression given by
Boukharouba et.al (1995) Eqn. (3-11). In N-SIF calculation, the stress gradient and
maximum stress obtained from nonlinear finite element analysis are used. It is found
that the crack stop hole radius calculation based on N-SIF approach gives a radius value 4
mm (Fig.4-15) which is much greater than 1.2mm obtained from KI / .
49
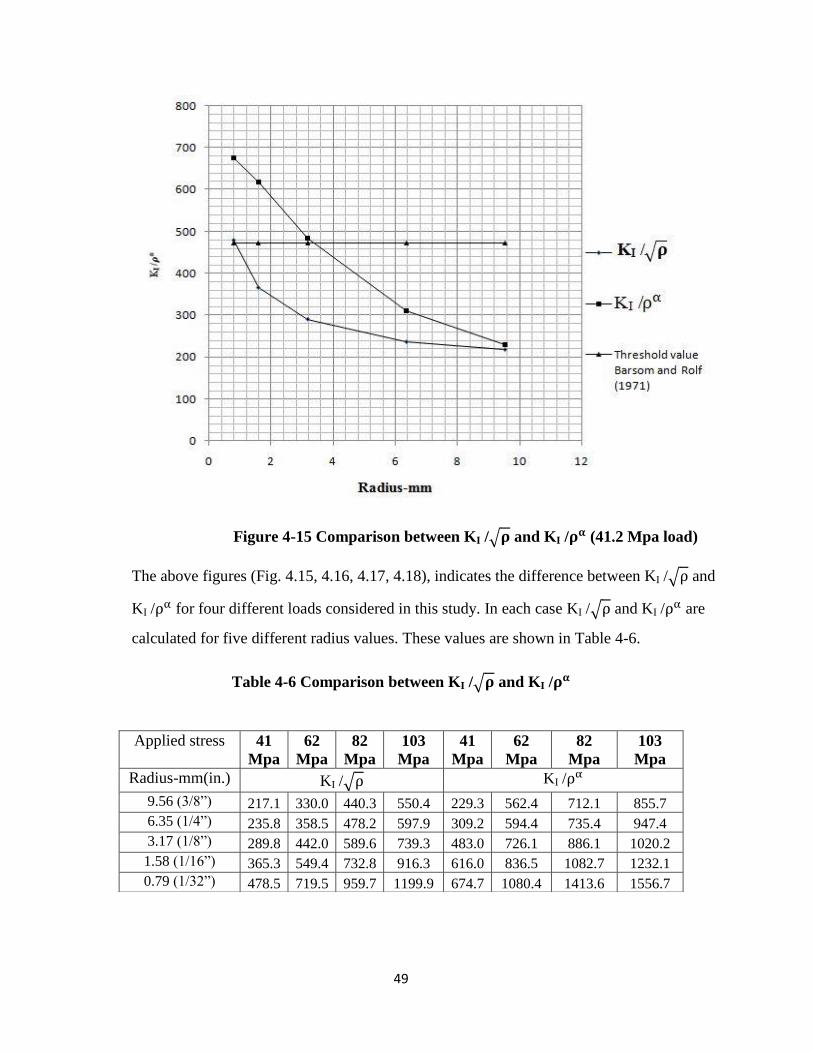
Figure 4-15 Comparison between KI / and KI / (41.2 Mpa load)
The above figures (Fig. 4.15, 4.16, 4.17, 4.18), indicates the difference between KI / and
KI / for four different loads considered in this study. In each case KI / and KI / are
calculated for five different radius values. These values are shown in Table 4-6.
Table 4-6 Comparison between KI / and KI /
Applied stress 41
Mpa
62
Mpa
82
Mpa
103
Mpa
41
Mpa
62
Mpa
82
Mpa
103
Mpa
Radius-mm(in.) KI / KI /
9.56 (3/8”) 217.1 330.0 440.3 550.4 229.3 562.4 712.1 855.7 6.35 (1/4”) 235.8 358.5 478.2 597.9 309.2 594.4 735.4 947.4 3.17 (1/8”) 289.8 442.0 589.6 739.3 483.0 726.1 886.1 1020.2
1.58 (1/16”) 365.3 549.4 732.8 916.3 616.0 836.5 1082.7 1232.1 0.79 (1/32”) 478.5 719.5 959.7 1199.9 674.7 1080.4 1413.6 1556.7
50
4.8 Length of the Patch
Length of the patch to be used is calculated based on effective stress transfer. Different lengths of
patch are analyzed. From previous studies on development length of the patch by Zhao et.al
(2008) if the length of the patch exceeds a beyond a particular length, the effectiveness of patch
decreases.
Figure4-16longitudinal strain vs. CFRP patch length
Fig 4-16 shows the variation of longitudinal strain along the length of the patch. The strain in
CFRP rises sharply at the crack location. At the edges, the CFRP strain decline rapidly and this
portion of length does not take part in load transfer.
4.9 Comparison between KI / and KI / with CFRP patch
The values of KI / and KI / are calculated at the edge of the hole after CFRP patch
application as shown in Figs.4.20, 4-21 and 4-22.These values for three different loads are
presented in Table 4-7. Also need to plot both the values for each applied stress.
0.00E+00
5.00E-05
1.00E-04
1.50E-04
2.00E-04
2.50E-04
0.00E+00 5.00E+01 1.00E+02 1.50E+02 2.00E+02
Sta
rin
CFRP patch length
51
Table 4-7 Comparison between KI / and KI /
A comparison between KI / and KI / α is carried out for three different loads (62 Mpa, 82 Mpa,
103.4 Mpa) corresponding to five radii. At 62 Mpa load, for all radii, the value of KI / α is found to
be more than KI / . In addition, it can be observed that the KI / α are at least 50% more than KI
/ value for all radii. Same trend is observed with other two loads (82 Mpa, 103.4 Mpa).
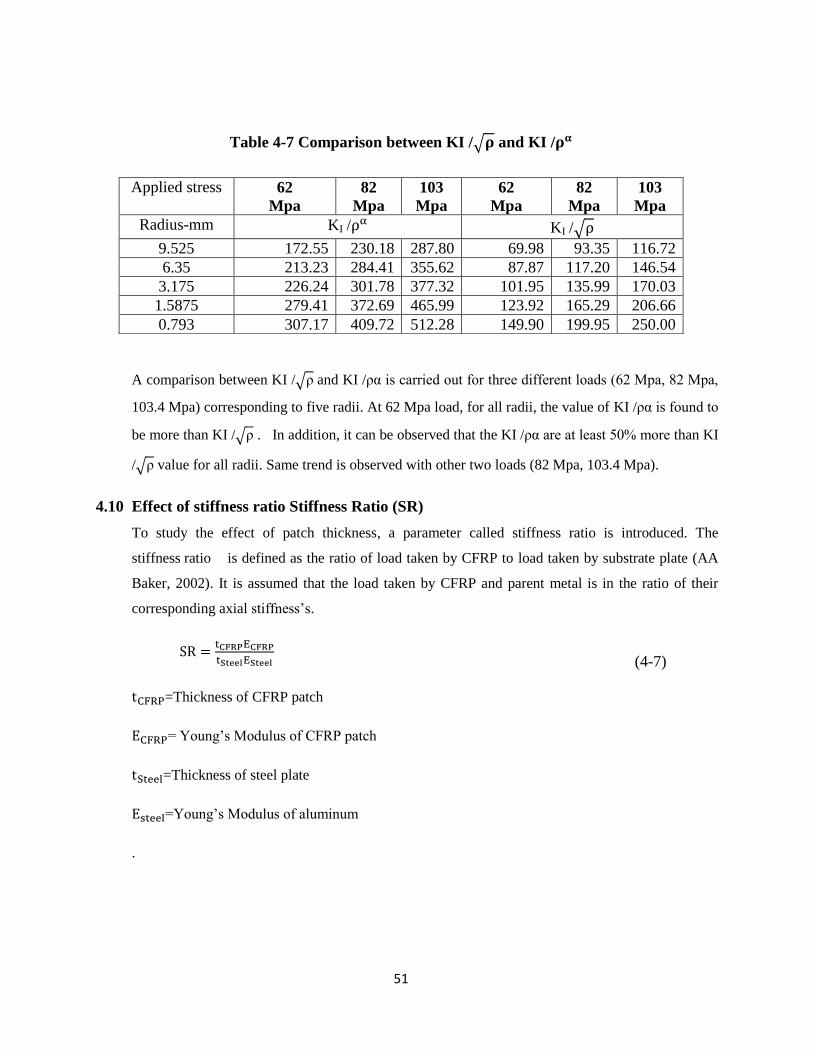
4.10 Effect of stiffness ratio Stiffness Ratio (SR)
To study the effect of patch thickness, a parameter called stiffness ratio is introduced. The
stiffness ratio is defined as the ratio of load taken by CFRP to load taken by substrate plate (AA
Baker, 2002). It is assumed that the load taken by CFRP and parent metal is in the ratio of their
corresponding axial stiffness’s.
=Thickness of CFRP patch
= Young’s Modulus of CFRP patch
=Thickness of steel plate
=Young’s Modulus of aluminum
.
Applied stress 62
Mpa
82
Mpa
103
Mpa
62
Mpa
82
Mpa
103
Mpa
Radius-mm KI / KI /
9.525 172.55 230.18 287.80 69.98 93.35 116.72
6.35 213.23 284.41 355.62 87.87 117.20 146.54
3.175 226.24 301.78 377.32 101.95 135.99 170.03
1.5875 279.41 372.69 465.99 123.92 165.29 206.66
0.793 307.17 409.72 512.28 149.90 199.95 250.00
(4-7)
52
Table 4-8 Calculation of KI / for different radius of the hole with patch
Figure 4-17 Stiffness ratio vs. KI /
0
20
40
60
80
100
120
140
160
0.1 0.3 0.5 0.7 0.9 1.1
Axi
s Ti
tle
Stiffness Ratio
Value of Radius-mm
No. of
layers
SR 9.525 6.35 3.175 1.5875 0.793
2 0.16 68.80 80.78 92.61 112.06 134.29
4 0.32 46.37 58.16 67.46 81.97 99.15
6 0.48 35.92 46.16 53.85 65.74 79.82
7 0.56 32.52 41.86 49.01 59.96 72.88
8 0.64 29.80 38.47 45.00 55.16 67.10
10 0.80 25.71 33.08 38.75 47.64 58.00
12 0.96 22.73 29.10 34.15 42.05 51.21
53
4.11 Combined action of CFRP and Crack stop hole
The combined action of CFRP patch and crack stop hole is determined by the amount of
stress reduction at the edge of the hole.
Figure 4-18 combined action of CFRP and crack stop hole
The combined action of CFRP patch and crack stop hole is studied numerically. The parameter
used for comparison is KI / . Prior studies on CFRP –steel application indicates that CFRP
patches are effective in arresting the cracks initiating from notches. In the present study crack stop
hole serves as a notch and it is assumed that the crack originates from the edge of the hole.
The application of CFRP will retard the crack re initiation by reducing the stress value.
CFRP patch length is taken as 150 mm. It is based on the numerical study by Zhao (2006). The
effect patch thickness on reduction is calculated in terms of stiffness ratio. At a stiffness
ratio 0.16, the stress value is reduced by 60%. The stress reduction becomes 90% at a stiffness
ratio 0.95. Based on this study a reduction factor is introduced to the value of KI which is a
function of stiffness ratio.
0
0.1
0.2
0.3
0.4
0 2 4 6 8 10
Red
uct
ion
Fca
tor
Radius-mm
0.16
0.31
0.47
0.55
0.79
0.95
0.63
54
Figure4-19Stiffness ratio vs. Reduction factor
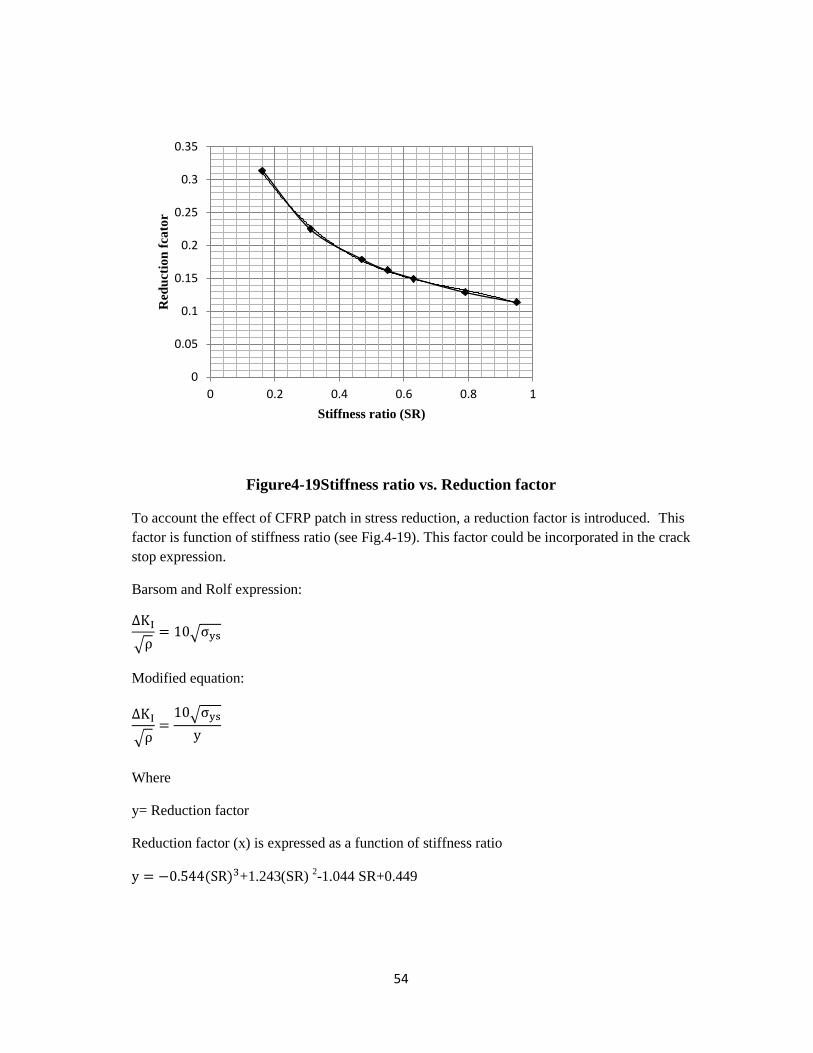
To account the effect of CFRP patch in stress reduction, a reduction factor is introduced. This
factor is function of stiffness ratio (see Fig.4-19). This factor could be incorporated in the crack
stop expression.
Barsom and Rolf expression:
Modified equation:
Where
y= Reduction factor
Reduction factor (x) is expressed as a function of stiffness ratio
+1.243(SR) 2-1.044 SR+0.449
0
0.05
0.1
0.15
0.2
0.25
0.3
0.35
0 0.2 0.4 0.6 0.8 1
Red
uct
ion
fca
tor
Stiffness ratio (SR)

55
4.12 Conclusions
The following conclusions are made from the above discussion
1. LEFM approach underestimates the stress value for larger radius value. This is due to the
assumption sharp stress gradient for all radius values.
2. The crack initiation parameter (KI / ) is unconservative in predicting the crack stop hole
radius compared to KI / α.
3. Combined action of CFRP patch and crack stop hole will significantly reduce the stress at
the edge of the hole there by increasing the fatigue crack initiation life
56
Chapter 5
Further study
5.1 Introduction
In this study plate with crack stop hole under tensile loading condition is considered. The
type of crack studied is mode-I. This study can be further extended for other mixed loading
conditions such as tensile plus torsion loading (mode I and mode III). The effect of crack stop
hole and CFRP patch combination can be studied as repair technique for this combined loading
case. The geometry of the crack considered in this study is central crack. An inclined crack may
be considered for further study. The inclined crack creates a combination of mode-I and mode-II
effect. For this mixed mode condition, the effect of crack stop hole when subjected to tensile
loading can be studied. In this study it is found that power alpha gives more conservative
results than KI / . Therefore, further study is needed to arrive at a KI / threshold value. In
addition, experimental study is needed to validate the results obtained from finite element study.
Moreover in this study, the effect of weld attachments on crack stop hole is not considered. Further
study is needed to find the effect of weld attachments on crack stop hole threshold. Cracks
emanating from notches needs to be studied, especially the effect of crack stops hole and CFRP on
crack propagation life needs to be understand.
This study further extended to study the effect of pre stressed CFRP patches along with crack stop
holes since the existing literature indicates that pre stressed patches are more efficient than
normal CFRP patches.
57
References
1. Shield, C., Hajjar, J., Nozaka, K. (2004). “Repair of Fatigued Steel Bridge Girders with Carbon Fiber
Strips,” Report no-MN/RC–2004-02, Minnesota Department of Transportation.
2. Fisher, J. W., Barthelemy, B. M., Mertz, D. R., and Edinger, J. A. (1980). "Fatigue behaviour of full
scale welded bridge attachments,” NCHR 12-15(3), March 1980 (80-29), Fritz Laboratory Reports.
3. Jack, A.R. and Price, A.T. (1970). “The Initiation of Fatigue Cracks from Notches in Mild Steel
Plates,” International Journal of Fracture Mechanics, 6(4), 401-409.
4. Jones, S. C., and Civjan, S. A. (2003). “Application of Fiber Reinforced Polymer Overlays to Extend
Steel Fatigue Life,” Journal of Composites Construction, 7, 331-338.
5. Creager, M., and Paris, P. C. (1967). “Elastic field equations for blunt cracks with reference to stress
corrosion cracking,” International Journal of Fracture Mechanics, 3(4), 247-252.
6. Crain, J., (2010). “Fatigue enhancement of undersized, drilled crack-stop holes,” Maters thesis,
Kansas state university, <http://hdl.handle.net/1808/6288>.
7. Barsom, J.M., and Rolfe, S.T. (1999). Fracture and Fatigue Control in Structures Application of
Fracture Mechanics, Third Edition. ASTM, West Conshohocken, PA.
8. Miller, C., Chajes. J., Mertz, D. R., and Hastings, J. N. (2001). “Strengthening of a Steel Bridge
Girder Using CFRP Plates,” Journal of Bridge Engineering, 6(6), 514-522
9. Barsom, J. M. and McNicol, R. C. (1974). "Effect of Stress Concentration on Fatigue-Crack Initiation
in HY-130 Steel," Fracture Toughness and Slow-Stable Cracking, ASTM STP 559, 183-204.
10. Andrea, M. D., Grondin, G. Y., and Kulak, G. L. (2001). “Behavior and Rehabilitation of
Distortion-Induced Fatigue Cracks in Bridge Girders,” Structural Engineering Report No.
240, Department of Civil and Environmental Engineering, University of Albert, Edmonton,
Albert, Canada
11. Report of Expert Group for Modernization of Indian Railways, (2012). Government of India
12. Indian railways bridge manual (1998), page 31
13. Forman, R. G. (1972). “Study of fatigue crack initiation from flaws using fracture mechanics theory,”
Engineering fracture mechanics, 4, 333-345.
14. Wilson, W. K., and Gabrielse, S. E. (1971). "Elasticity Analysis of Blunt Notched Compact Tension
Specimens," Research Report 71-1E7-LOWFA-R1, Westinghouse Research Laboratory Pittsburgh.
58
15. Boukharouba, Tamine, T., Niu, L., Chehimi, C., and Pluvinage, G. (1995). “The use of notch
stress intensity factor as a fatigue crack initiation parameter,” Engineering Fracture Mechanics,
52(3), 503-512.
16. Baker, A.A., Rose, L.R.F., Jones, R. (2002). Advances in the bonded composite repair of metallic
aircraft structure, Elsevier Publications, Killington.
17. Albat, A. M., and Romilly, D. P. (1999). ‘‘A direct linear-elastic analysis of double symmetric
bonded joints and reinforcements,’’ Composite Science and Technology. 59(7), 1127–1137.
18. Heller, M., Hill, T.G., Williams, J.F., and Jones, R. (1989). “Increasing the fatigue life of cracked fastener
holes using bonded repairs,” Theoretical and applied Fracture Mechanics, 11.
19. Fawzia, S., Al-Mahaidi, R., Zhao, X. L. (2006). “Experimental and finite element analysis of a double
strap joint between steel plates and normal modulus CFRP,” Composite Structures, 75, 156–162.
20. Achour, A.T., Bachir, Serier (2003). “Numerical analysis of the performances of the bonded
composite patch for reducing stress concentration and repairing cracks at notch,” Computational
Materials Science, 28, 41–48
21. Liu, H., Xiao, Z., Zhao, X. L., Al-Mahaidi, R. (2009),” Prediction of fatigue life for CFRP-
strengthened steel plates”,Thin-Walled StructuresVolume 47, Issue 10, 2009,pp 1069–1077
22. Zhao, X. L. and Zhang, L. (2007). “State-of-the-art review on FRP strengthened steel structures,”
Engineering Structures, 29, 1808–1823.
23. Tavakkolizadeh, M. and Saadatmanesh, H. (2003). “Fatigue Strength of Steel Girders Strengthened
with Carbon Fiber Reinforced Polymer Patch,” Journal of Structural Engineering, 129, 186-196.
24. Umamaheswar, T. V. R. S. and Singh, R. (1999). “Modelling of a patch repair to a thin cracked
sheet,” Engineering Fracture Mechanics, 62, 267–289
25. Ramji, M., Srilakshmi, R., Bhanu Prakash, M. (2012). “Towards optimization of patch shape on the
performance of bonded composite repair using FEM” Composites: Part B, 45, 710–720
26. Alemdar, F., Gangel, R., Matamoros, A., Bennett, C., Barrett-Gonzalez, R., Rolfe, St., and Liu, H.
(2013). “Use of CFRP overlays to repair fatigue damage in steel plates under tension loading,”
Journal of Composite Construction.


![c 2018 [Please consult the author] Notice Changes ... · the crack stop hole is the re-distribution of the stresses which re-duces stress concentrations at the crack tip. Result is](https://static.fdocuments.us/doc/165x107/5e55e702fdf15f280a23a2c9/c-2018-please-consult-the-author-notice-changes-the-crack-stop-hole-is-the.jpg)