A Novel Folic Acid-Conjugated TiO -SiO Photosensitizer for ...
31
1 A Novel Folic Acid-Conjugated TiO 2 -SiO 2 Photosensitizer for Cancer Targeting in Photodynamic Therapy Xiaohui Feng 1‡ , Shaokun Zhang 2‡ , Hong Wu 2 , Xia Lou 1* 1. Department of Chemical Engineering, Curtin University, Kent Street, Bentley, WA 6102, Australia 2. Department of Orthopedics, The First Hospital of Jilin University, China ____________________________________ * Corresponding author. Department of Chemical Engineering, Curtin University, Kent Street, Bentley, WA 6102, Australia. Tel.: +61 9266 1682; Fax: +61 9266 2681; Email address: [email protected] (X. Lou). ‡ Equally contributing first authors.
Transcript of A Novel Folic Acid-Conjugated TiO -SiO Photosensitizer for ...

1
A Novel Folic Acid-Conjugated TiO2-SiO2 Photosensitizer for
Cancer Targeting in Photodynamic Therapy
Xiaohui Feng1‡, Shaokun Zhang2‡, Hong Wu2, Xia Lou1*
1. Department of Chemical Engineering, Curtin University, Kent Street, Bentley, WA 6102, Australia
2. Department of Orthopedics, The First Hospital of Jilin University, China
____________________________________
* Corresponding author. Department of Chemical Engineering, Curtin University, Kent Street, Bentley, WA 6102, Australia. Tel.: +61 9266 1682; Fax: +61 9266 2681; Email address: [email protected] (X. Lou).
‡ Equally contributing first authors.

2
Highlights
A novel folic acid-conjugated TiO2-SiO2 nano-photosensitizer was synthesized for targeted photo-killing of cancer cells
High photodynamic reactivity, improved cell internalization and cellular and blood compatibility were well demonstrated
A strong photo-killing effect on the human nasopharyngeal epidermoid cancer (KB) cells was achieved
3
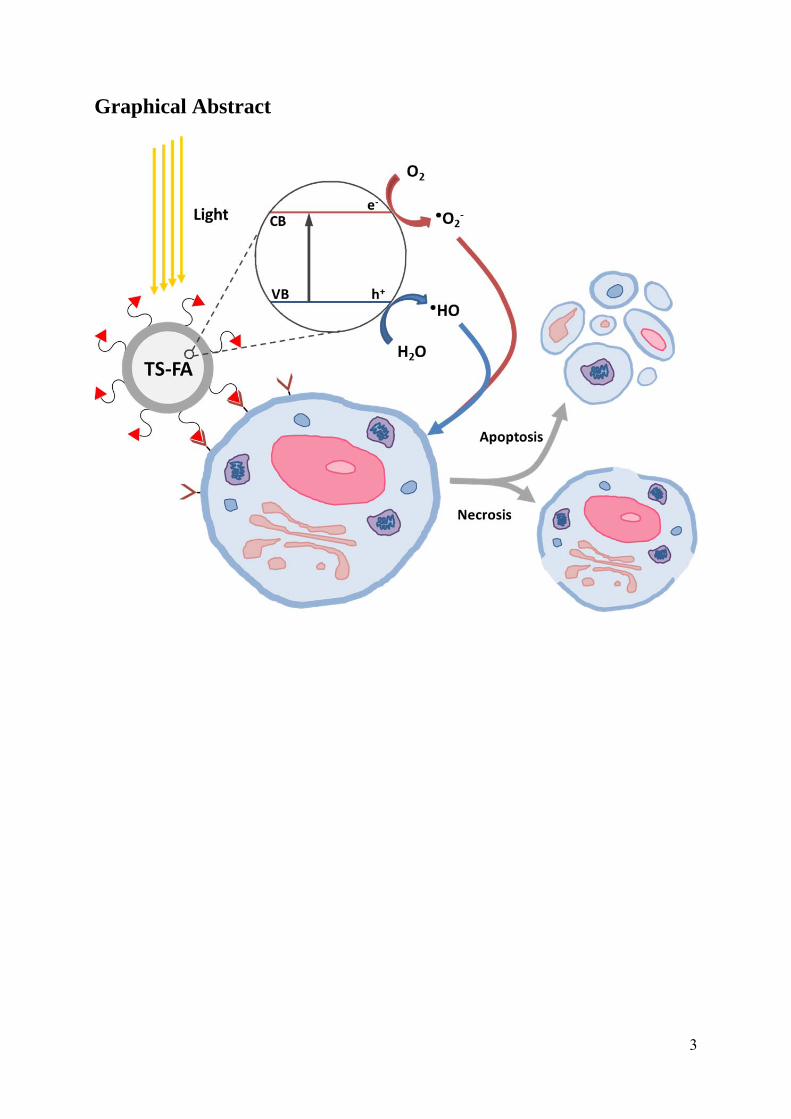
Graphical Abstract
4
Abstract
In this paper, a novel folic acid-conjugated silica-coated titanium dioxide (TiO2-SiO2)
photosensitizer was synthesized and characterized using various analytical instruments. The
photosensitizer was further assessed in regards to its photoreactivity, cellular and
hemocompatibility, cell internalization, and phototoxicity. Conjugating folic acid with
TiO2-SiO2 has shown a significantly improved compatibility of the nanoparticles with the
mouse fibroblast cells (L929) at 24 h. An improved compatibility with the human
nasopharyngeal epidermoid cancer (KB) cells was also demonstrated, but to a slightly reduced
degree. Enhanced cell internalization was well demonstrated in the TiO2-SiO2 folate
nanoparticles. Upon exposure to UV light, TiO2-SiO2 folate nanoparticles maintained a high
level photodynamic reactivity and yielded a 38-43% photo-killing of KB cells. The
photo-killing effect increased with increasing dosage in the investigated concentration range
of 50-100 µg ml-1.
Key Words: titanium dioxide nanoparticles; targeting; folic acid; photosensitizer,
photo-killing; photodynamic therapy.

5
1. Introduction
Photodynamic therapy (PDT) has been used for the treatment of various cancers and other
diseases [1]. It involves the administration of a photosensitizer (PS), either by systemic or
topical application, and subsequent initiation of its exposure to light to produce reactive
oxygen species (ROS) that kill the cancer cells via the mechanism of apoptosis or necrosis [2].
In addition to directly killing tumor cells, ROS also could damage the blood vessels that
supply the oxygen and nutrients to the tumor, leading to tumor shrinkage [3]. Compared to
conventional cancer therapy, the major advantages of PDT are that the PS is of low toxicity to
normal tissue or cells in the dark, and activation by light alone permits minimal damage to
these cells [4]. The combined effect of light and PS makes PDT a selective therapy to use
against cancerous or diseased tissue. PDT becomes dual-selective when the accumulation of
PS is only on cancer cells, which can be achieved through cell-specific targeting [5].
The commonly used PS drugs are classified as porphyrin-based and nonporphyrin-based.
These PSs often contain large π-conjugation domains and are hydrophobic. Their hydrophobic
nature causes aggregation of these relatively large molecules under aqueous physiological
conditions, resulting in severely reduced ROS formation that is essential for the PDT effect [6,
7]. The poor selectivity to the targeted tissue due to limited accumulation by classic PS drugs
also prevents their clinic applications. Skin hyperphotosensitivity and associated pain are
ongoing problems for patients after treatment, due to the limited tumor selectivity and slow
body clearance of the currently approved PSs [8, 9]. Despite a large number of studies
undertaken over the last decades, the limited selectivity and efficacy are still widely accepted
problems for PSs associated with PDT treatments. An ideal PS should have the combined
properties of high ROS yield and a great degree of selectivity towards the cancerous cells
when used in therapeutic concentration, without damaging the healthy tissue.
Titanium dioxide (TiO2) is a semiconductor-based material, known for its high
photosensitivity. It presents a band-gap energy of 3.0 eV. Upon the absorption of a photon
with energy that is equal to or higher than this value, TiO2 can be excited to produce negative
electrons in the conduction band, leaving positive holes in the valence band. These charge
carriers react with surrounding water or oxygen to yield cytotoxic ROS such as hydroxyl
(•OH), hydrogen peroxide (H2O2), and superoxide (•O2-). Both the generated holes and ROS
are strong oxidizers that can attack cell membranes and other cellular components, leading to
apoptosis of cancer cells [10]. TiO2 nanoparticles also have been proven to be effective in
6
preventing drug efflux caused by multi-drug resistance (MDR), leading to selective
accumulation of TiO2 at the tumor site [11, 12]. They have shown good cytocompatibility in
the dark, both in vitro and in vivo [13]. Clinical application of TiO2 is limited, mostly due to
the aggregation of the nanoparticles that leads to a decrease in photocatalytic reactivity [14],
and the lack of specificity to target the cancerous cells. We have demonstrated that
encapsulating TiO2 within a silica shell can improve both the dispersion and cell compatibility
of the nanoparticles, whilst maintaining high photodynamic reactivity [10]. The aim of this
study is to synthesize folic acid-conjugated (FA-conjugated) TiO2, via the functionalized
silica shell, and to investigate the cell internalization and cytotoxicity of these nanoparticles,
both in the dark and under irradiation, so as to develop a high performance and targeted
photosensitizer for cancer treatments that utilize PDT.
FA-conjugated silica-coated TiO2 (TS-FA) nanoparticles were prepared according to the
reaction scheme illustrated in Fig. 1. First, silica-coated TiO2 (TS) was synthesized according
to our previous work, which was further aminated using (3-aminopropyl)triethoxysilane
(APTES) to produce amine-terminated silica-coated TiO2 (TS-NH2) nanoparticles.
N-Hydroxysuccinimide-ester of folic acid (NHS-FA) then was prepared using the N,
N’-Dicyclohexylcarbodiimide (DCC)-based coupling reaction, and further reacted with
TS-NH2 to produce FA-conjugated TiO2 (TS-FA) nanoparticles. The chemical and surface
properties of the produced compounds were characterized using Fourier transform infrared
(FTIR) spectroscopy and thermogravimetric/differential thermal analysis (TG/DTA). The size
and morphology of the obtained nanoparticles were examined using a field emission scanning
electron microscope (FESEM) and a high-resolution transmission electron microscope
(HRTEM). The photocatalytic properties of TS, TS-NH2 and TS-FA nanoparticles were
examined on the basis of photodecomposition of phenol, an organic pollutant that has been
used as a model chemical to evaluate photocatalytic activity of various photocatalysts. The
cytotoxicity, hemocompatibility, and phototoxicity of selected nanoparticles were assessed
using both the primary adherent mouse fibroblast connective tissue cells (L929), and human
nasopharyngeal epidermoid cancer (KB) cells. The cell internalization of TS-FA nanoparticles
was evaluated using KB cells as the positive folate receptor cells. Findings show that the
TS-FA nanoparticles can be used as an effective photosensitizing agent for active targeting of
cancer cells.

7
2. Materials and methods
2.1 Materials
Degussa P25 was purchased from Degussa. Tetraethyl orthosilicate (TEOS, 99.999%),
(3-aminopropyl)triethoxysilane (APTES, ≥99%), absolute ethanol (≥99.5%),
N-Hydroxysuccinimide (NHS, 98%), N, N’-Dicyclohexylcarbodiimide (DCC, 99%),
triethylamine (≥99%), folic acid (FA, ≥97%), sodium carbonate (NaCO3, ≥99.5%), and
sodium bicarbonate (NaHCO3, 99%) were purchased from Sigma-Aldrich. Diethyl ether
anhydrous (≥99.0%) and dimethyl sulfoxide (DMSO, 99.9%) were purchased from Alfa
Aesar. Milli-Q water was used in all experiments.
2.2 Chemical synthesis
TS-NH2 nanoparticles were first prepared using the sol-gel method (Fig. 1). In brief,
TiO2 nanoparticles (0.1 g, 1.3 mmol) were suspended in a solution containing 20 ml of
ethanol, 60 ml of Milli-Q water and 1 ml of ammonia solution, using ultrasonic vibration for
approximately 30 min. Then, 20 ml of ethanol containing TEOS (40 l, 0.18 mmol) was
added, dropwise, to the mixture under magnetic stirring. The reaction was maintained at room
temperature for 2 h. TS-NH2 nanoparticles were subsequently obtained by the addition of 20
ml ethanol solution containing APTES (81 l, 0.36 mmol), resulting in the molar ratio of
APTES to TEOS being 2:1. The reaction mixture was then heated up to 90 oC and kept at this
temperature for a further 2 h. Following this, the reaction mixture was allowed to cool down
to room temperature and centrifuged at 7500 rpm for 10 min. The liquid was discarded and
the TS-NH2 nanoparticles were washed three times with 15 ml of ethanol (3×15 ml), followed
by three times with 15 ml of Milli-Q water (3×15 ml) and dried overnight at room
temperature under vacuum.
NHS Folate (NHS-FA) was obtained through the DCC coupling reaction (Fig. 1). In brief,
folic acid (5.0 g, 11.3 mmol) and triethylamine (1.8 g, 17.9 mmol) were added to 100 ml of
freshly distilled dimethyl sulfoxide (DMSO) at room temperature under constant stirring.
After stirring for 2 h, NHS (2.6 g, 22.6 mmol) and DCC (4.7 g, 22.8 mmol) were added to the
mixture. The obtained reaction mixture had a molar ratio of 1.0 folic acid: 1.6 triethylamine:
2.0 NHS: 2.0 DCC. The reaction was allowed to proceed overnight in the dark. Then, the
dicyclohexylurea by-product was removed by filtration and the liquid was concentrated in the

8
presence of reduced pressure and heating. The concentrated liquid (1.5 ml) was dispersed in
THF (15 ml) with constant shaking to remove the excess amount of DMSO. Then, anhydrous
diethyl ether (5 ml) was added into the mixture and the characteristic yellow powder was
formed, followed by collection via centrifugation at 7500 rpm for 10 min. The liquid was
discarded. After that, the solid was dispersed into 15 ml of a mixture of THF/anhydrous
diethyl ether (3:1), and the whole procedure was repeated five times. The resultant NHS-FA
was dried under vacuum, overnight, to remove any residual ether and THF, and then stored at
4 oC in the dark.
TS-FA nanoparticles were finally produced through a reaction of the NHS groups of the
above obtained NHS-FA with the primary amine presented on the surface of TS-NH2 (Fig. 1).
TS-NH2 nanoparticles (100 mg) were suspended in 10 ml of sodium carbonate/bicarbonate
buffer solution (0.01 M, pH=9.0) using ultrasonic vibration at room temperature. Then,
NHS-FA (289 mg) was dissolved into dry DMSO (10 ml) under magnetic stirring. The
solution of NHS-FA in DMSO was added, dropwise, to the obtained nanoparticle suspension
and the reaction was maintained at room temperature with constant stirring. After stirring in
the dark for 2 h, the derived TS-FA nanoparticles were collected using a centrifuge at 7500
rpm for 15 min. The product was washed with DMSO (3×15 ml), followed by ethanol (1×15
ml), and dried overnight under vacuum.
2.3 Characterization of TS-NH2, NHS-FA, and TS-FA
Scanning electron micrographs of all nanoparticles produced were obtained using a
FESEM (Zeiss Neon 40EsB FIB-SEM). Prior to FESEM examination, the sample suspension
in Milli-Q water (20 g ml-1) was mounted on an aluminum stub. The aluminum stub was
allowed to air-dry at ambient temperature overnight and then coated with platinum (2 nm)
which was used as a conducting surface material. Operation of the microscope was carried out
at an accelerating voltage of 5 kV. The mean diameter of the particles was analyzed using the
SmartSEM software that was related to the scale bar for the recorded FESEM images. Sixty
particles were randomly selected for size measurements.
The detailed morphology of the produced nanoparticles also were visualized using
HRTEM (JEOL 3000F). The sample preparation for HRTEM examination was performed by
placing one drop of the sample dispersion in ethanol solution (10 g ml-1) on a copper grid
with a substrate of carbon film and air-dried at room temperature overnight. HRTEM images
9
of the nanoparticles were recorded at an accelerating voltage of 200 kV. The sizes of the
nanoparticles were measured using the in-built JEOL operational software, DigitalMicrograph,
which also was linked to the magnification scale bar of the obtained TEM images.
The surface chemistry of the produced TS, TS-NH2 and TS-FA nanoparticles were
characterized using a Thermo Scientific Nicolet iS50 FTIR spectrometer fitted with a
diamond ATR sampling accessory. An FTIR spectrum of each sample was recorded between
200 and 4000 cm-1.
The relative amounts of the organic compounds presented on the surface of the samples
were determined through burning the elements of carbon, nitrogen and hydrogen in air with a
flow rate of 0.1 L min-1, and then calculated using the data obtained from TGA-DSC
(Mettler-Toledo Starᶱ). The obtained nanoparticles (10-15 mg) were heated from 35 oC to
900 oC in air with a heating rate of 10 oC min-1.
Nuclear magnetic resonance (NMR) spectroscopy was conducted on a Bruker Advance III
NMR spectrometer (400 MHz), using dimethyl sulfoxide (DMSO)-d6 as the solvent. To
prepare the sample for 1H NMR examination, NHS-FA (10 mg) was dissolved in DMSO-d6
(1 ml) and the mixture was added into the dry NMR tube.
The amine groups on the surface of TS-NH2 particles were quantified using a back
titration method [15]. In brief, TS-NH2 nanoparticles (10 mg) and HCl aqueous solution
(40 ml, 1.0 mM) were mixed with constant stirring for 2 h. Then, the mixture was separated
using a centrifuge and the solid was discarded. The liquid was collected and titrated using an
aqueous solution of NaOH (1.0 mM). Two drops of phenolphthalein in ethanol solution were
added as a pH indicator.
2.4 Photoreactivity study
The photoreactivity of TS-NH2 and TS-FA nanoparticles was determined based on phenol
degradation efficiency. Pure TiO2 (P25) and the silica-coated TiO2 (TS) containing no folic
acid also were assessed for comparison purposes. In brief, a preferred amount of catalyst was
mixed with phenol solution (200 ml, 20 g ml-1) with constant stirring. The reaction was
performed in a 1 L double-jacketed reactor that was connected to a water bath through a pump
to maintain the reaction temperature at 251 oC. The light source was provided by an MSR
575/2 metal halide lamp (575 W, Philips) with a wavelength between 315 and 1050 nm. For
10
the first 30 min, the reaction mixture was stirred in the dark to reach the adsorption-desorption
equilibrium. After this, the reaction was carried out under light. At the prescribed time
intervals, 5 ml of the catalyst suspension in phenol solution was withdrawn and the solid in
the suspension was filtered using a 0.45 m Millipore filter. The liquid was reserved and sent
for analysis using an HPLC (Varian) in which the UV detector was adjusted to 270 nm. The
concentration of TiO2 for phenol degradation was kept at 0.25 g L-1 for all nanoparticles.
2.5 Cell culture and nanoparticle preparation
Human nasopharyngeal epidermoid cancer (KB) cells (ATCC, USA) were grown in
RPMI-1640 folic acid-deficient medium supplemented with 10% fetal bovine serum and
1% L-glutamate (Gibco® by life Technologies™). Primary adherent mouse fibroblast
connective tissue cells (L929), also from ATCC, were maintained in Dulbecco’s modified
Eagle’s medium (DMEM) with 10% FBS. The cells were grown into 96-well plates at a
density of 1×10⁴ cells per well at 37 oC and under 5% CO2. P25, TS, and TS-FA nanoparticles
of varying concentrations were dispersed into the growth medium for different assessments.
2.6 MTS assay
The MTS assay measured the absorbance of the formazan product which is formed by the
reduction of [3-(4, 5-dimethylthiazol-2-yl)-5-(3-cayboxymethoxyphenyl)-2-(4-sulfophenyl)
-2H-tetrazolium] (MTS) using dehydrogenase enzymes in living cells. The formed formazan
product, recorded at 490 nm, is proportional to the number of living cells in the growth
medium. A detailed description of the cytotoxicity assessment can be found in our previous
paper [10]. For this work, the particle concentrations involved in MTS analysis were 12.5, 25,
50, 100, and 200 g ml-1, respectively. A control experiment was performed using the cells
treated with complete medium involving no particles, under identical conditions. Cells were
incubated with the nanoparticles for 6 h and 24 h, respectively, prior to the MTS assessment.
The relative cell viability was estimated by Atest/Acontrol, where Atest and Acontrol are the
absorbance of the produced formazan by samples and controls, respectively. It should be
noted that all the experiments were repeated three times in the dark. The live/dead cells were
recorded by an Olympus BX61 microscope.
11
2.7 Hemolysis assay
Rabbit red blood cells (RBCs) were used for hemolysis studies of the samples using our
reported procedure [10]. The sample concentrations were 12.5, 25, 50, 100, and 200 g ml-1,
respectively. For control purposes, the mixture of the RBC suspension (100 l) and PBS
buffer (100 l) was applied as a negative control, while that of the RBC suspension (100 l)
and 0.5% Triton X-100 (100 l) was used as a positive control. The percentage hemolysis was
estimated using the equation below:
100%ΧAA
AA(%) Hemolysis
controlnegative576,controlpositive576,
controlnegative576,sample576,
(1)
Where A576, sample, A576, negative control, and A576, positive control represent the absorbance of
hemoglobin released from particle-treated RBCs, PBS buffer treated RBCs, and medium
involving 0.5% Triton X-100 treated RBCs, respectively.
2.8 Photo-killing effect
To investigate the photo-killing effect of the derived nanoparticles under light, the
cultured KB cells were trypsinized and suspended into culture medium at a concentration of
5.0×10⁴ cells/ml. Then, each well in a 96-well plate was injected with 200 l of the seeding
cells. The plate was put into an incubator at 37 oC under 5% CO2. After being incubated
overnight, the cell medium was replaced with the medium consisting of P25, TS or TS-FA
nanoparticles, each at the concentrations of 12.5 and 50 g ml-1. The cells were incubated for
24 h in the dark and then were illuminated with UV light (365 nm, 50 W). After 10 min
illumination, the cells were removed from UV radiation and incubated overnight at 37 oC
under 5% CO2. A control experiment was carried out using the cells treated with complete
cell medium under the same experimental conditions. The cell viability also was evaluated
using an MTS assay. The surviving fraction of KB cells is expressed as the ratio of the
absorbance level of cells exposed to UV light to that of cells in the dark. All the experiments
were performed in triplet.
2.9 Cell internalization
Prior to the cell internalization experiment, P25, TS, and TS-FA particles (20 mg each)
were separately suspended in a 0.5 ml acetone solution of fluorescein isothiocyanate (FITC)

12
(1.0 mg ml-1). The suspensions were shaken overnight. Then, the particles were collected,
using a centrifuge at 7500 rpm, and washed multiple times with Milli-Q water until the
supernatant was clear. The resultant FTIC-labeled nanoparticles were then re-suspended into
culture medium for further investigation.
To determine the intracellular uptake of the derived particles, KB cells, at a density of
1105 cells per well, were plated in a 12-well polystyrene dish and incubated at 37 oC and
under 5% CO2. After incubation overnight, the culture medium was substituted with fresh
medium containing the labeled nanoparticles, each at the concentration of 100 g ml-1. Then
cells were returned to the incubator under 5% CO2. After 6 h of incubation, the medium was
removed from each sample and the cells were washed in triplet with PBS (pH 7.4) to clear the
unattached particles away. Then the cells were fixed with 4% formaldehyde in PBS for
15 min and, subsequently, the fixed cells were visualized using a confocal laser scanning
microscope with an FITC filter.
2.10 Statistical analysis
The results were expressed as meanstandard error. All the data were statically analyzed
using Student’s T-test. Statistical significances were considered at p<0.05.
3. Results and Discussion
3.1 Characterization of NHS-FA
FTIR was used to characterize NHS-FA in comparison with pure FA, as displayed in
Fig. 2a. For FA, the peaks in the 2900-3600 cm-1 region are assigned to the -OH stretching
vibrations of L-glutamic acid moiety and the –NH…H stretching vibrations of the pterin ring
[16]. The peak at 1694 cm-1 belongs to the C=O stretching vibration of the –COOH group
while the peak at 1640 cm-1 relates to the C=O stretching vibration of the –CO-NH- (amide
band II) group from the L-glutamic acid moiety [17]. Also, the –NH stretching vibration of
the –CO-NH (amide band II) group appears at 1570 cm-1 [18]. The absorption peaks at 1485
and 1414 cm-1 are attributed to the phenyl ring and the –OH deformation band of the phenyl
skeleton, respectively. After NHS was used to activate FA, the successful formation of
NHS-FA was confirmed via two notable absorption peaks at 1201 and 1068 cm-1,
corresponding to the C-O and N-O stretching vibrations, respectively, of the newly formed
succinimidyl ester group [19]. Additionally, there is a strong peak at 1729 cm-1 that is due to

13
b)
splitting of the band associated with the C=O stretching vibration of the newly formed
succinimidyl ester group. The absorption peaks at 1814 and 1782 cm-1 are related to the C=O
stretching vibration of the succinimidyl carbonyl groups [20]. Other absorption peaks below
1400 cm-1 correspond to various vibration modes related to the ring structure of the pterin
moiety [17].
1H NMR was used to further confirm the successful synthesis of NHS-FA. In the 1H NMR
spectrum of NHS-FA (Fig. 2b), the signals at 2.50 and 3.30 ppm belong to the DMSO-d6 and
water, respectively. The signal at 11.35 ppm is attributed to the –OH proton in the carboxylic
group of FA, while the signals at 8.65, 7.64, and 6.65 ppm are due to the aromatic protons of
FA [21]. The signals presenting at 7.00 and 8.13 ppm belong to the –NH- protons in the
p-amino benzoic acid moiety and the –CO-NH- in the glutamate moiety of FA, respectively
[22]. The methylene protons in the pterin moiety and the glutamate moiety of FA appear at
4.48, 2.31, and 1.99-2.10 ppm, while the methylene protons of NHS can be observed at
2.8 ppm, indicating that FA has been successfully converted to NHS-ester of folic acid via
DCC as a coupling agent [23]. The integration at 2.8 ppm revealed a higher than
stoichiometric value (5.19 against 4), which is probably due to the presence of unreacted
NHS.
3.2 Characterization of TS-NH2 and TS-FA nanoparticles
FESEM images, presented in Fig. 3a, indicate that the morphology of the P25, TS,
TS-NH2, and TS-FA were generally the same. The sizes of TS, TS-NH2, and TS-FA were
352 nm, 395 nm, and 433 nm, respectively, indicating a gradual increase of particle size
in comparison with P25 (241 nm). The TEM images in Fig. 3b reveal a clear core-shell
structure of TS, TS-NH2, and TS-FA nanoparticles. The size increases of these particles also
are evident in comparison with the non-coated TiO2. For TS-NH2, the core nanoparticles with
well-defined crystal facets were evident via the obvious lattice fringes, which, at 0.35 nm,
correspond to the d-spacing for (101) lattice planes of anatase TiO2 nanoparticles. The coated
silica layer is amorphous and the relative thickness is approximately 3 nm. After further
conjugation with FA, the outer layer of TS-FA nanoparticles increased up to approximately 5
nm. The lattice fringes of the core nanoparticles are at 0.32 nm and 0.35 nm, which agrees
well with d-spacings of the (110) plane in rutile TiO2 nanoparticles and the (101) plane in
anatase TiO2 nanoparticles, respectively.
14
The FTIR spectra of all samples in the region of 100-4000 cm-1 are shown in Fig. 4a. The
FTIR peaks located at 630 and 388 cm-1 are attributed to the stretching vibration of Ti-O
groups, confirming the presence of TiO2 in all samples. After a silica layer was applied to the
TiO2 nanoparticles, the successful formation of the silica network was proven via the
characteristic absorption peaks at 1065 cm-1 and 1156 cm-1, representing the bending and
stretching vibrations of the Si-O-Si groups. Additionally, a weak peak at 950 cm-1 is
attributable to the formation of Ti-O-Si linkage between TiO2 core nanoparticles and the silica
layer, via condensation. The broad peak at 3350 cm-1, presented in all samples’ spectra, is
assigned to the stretching vibration of O-H groups from the adsorbed water [10], and the
absorption peak at around 2150 cm-1 is from CO2 in air.
The expanded spectra of TS-NH2 and TS-FA in the region 1300-1700 cm-1 are shown in
Fig. 4b. The two characteristic peaks of TS-NH2, at 1560 and 1491 cm-1, correspond to the
bending vibration of –NH2 [24]. The weak absorption peaks located at 1413, 1444, and
1472 cm-1 are attributed to the bending vibration of –CH2 groups in the n-propyl chain from
APTES moieties [25]. After binding FA with the primary amine groups, the characteristic
peak at 1560 cm-1 disappeared and a new absorption peak at 1606 cm-1, corresponding to the –
NH stretching vibration from the –CO-NH- (Amide II) groups, was observed [26]. Meanwhile,
the characteristic peak at 1628 cm-1 is associated with the C=O stretching vibration of the –
CO-NH- (Amide I) groups. Those observations indicated that FA was covalently linked to the
surface of TS-NH2 through the amide bond. The peaks at 1400 cm-1, 1450 cm-1, and 1512
cm-1 further demonstrated the presence of–COO and C=C groups in TS-FA.
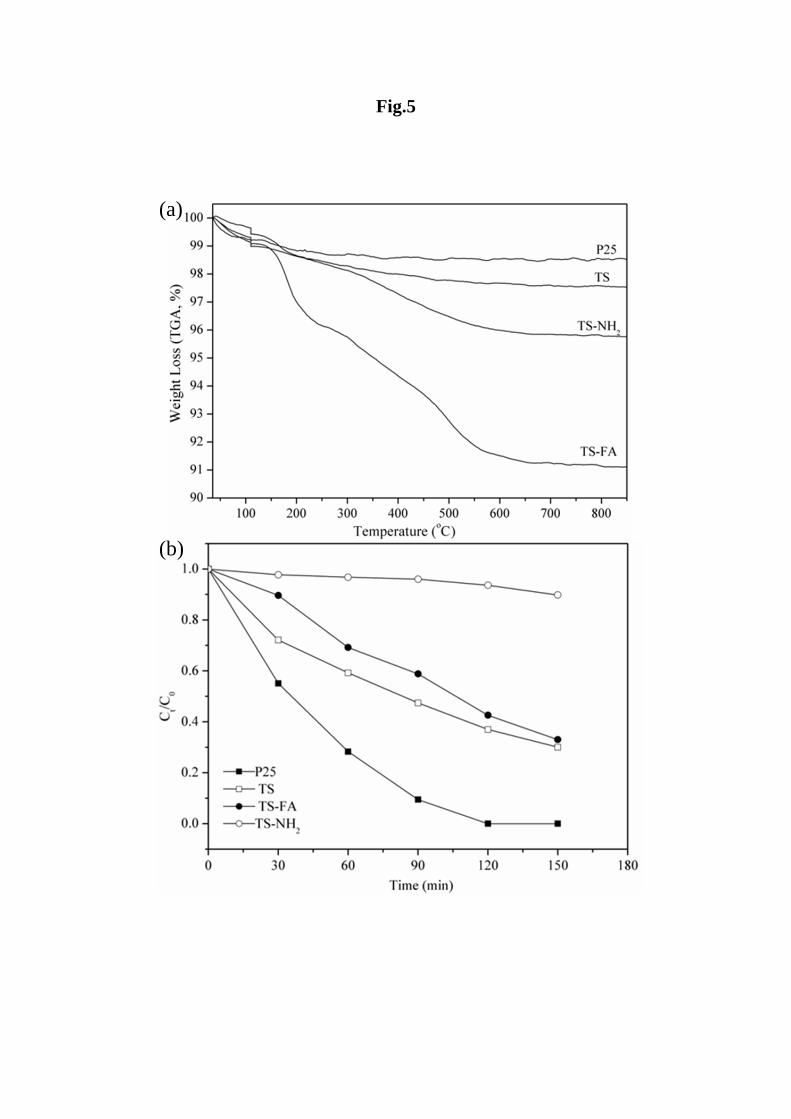
To verify the content of the –NH2 groups and FA groups in TS-NH2 and TS-FA
nanoparticles, the TGA analysis was carried out in the presence of air. As shown in Fig. 5a, a
two-stage mass loss was observed in both compounds. When the temperature was in the
region of 35-110 oC, a slight mass loss was observed due to the release of absorbed water
molecules. There was a significant decrease in mass when the temperature was between 110
and 850 oC. This can be assigned to the release of CO2, CO, NO2, or H2O owing to the
decomposition of organic groups grafted onto the surfaces of the particles [27, 28]. The
weight losses for P25, TS, TS-NH2, and TS-FA nanoparticles in the region of 110-850 oC
were 0.7, 1.8, 3.2, and 8.0 wt%, respectively. Assuming that all the ethoxy groups were
removed after the condensation of TEOS, then the mass loss of TS-NH2 must have been from
the CH2CH2CH2NH2 of APTES. Hence, the surface density of –NH2 was calculated to be
15
0.23 mmol g-1. The back titration method yielded an average surface density of amine groups
of 0.20 mmol g-1, which is comparable to the data obtained from TGA.
3.3 Photocatalytic reactivity
The photoreactivity of the obtained nanoparticles was evaluated on the basis of phenol
degradation in the presence of UV light. Fig. 5b shows the percentage degradation of phenol
using P25, TS, TS-NH2, and TS-FA at the given time intervals. Upon exposure to UV light
for 150 min, complete removal of phenol with an initial concentration of 20 g ml-1 was
obtained. In the presence of TS, TS-NH2, and TS-FA, the values of percentage degradation of
phenol were 70%, 10%, and 67%, respectively. The apparent rate constants of these
nanoparticles were valued using the Langmuir-Hinshelwood equation, where k represents the
apparent reaction rate constant in the unit of min-1, and C0 and C are the phenol concentrations
at t=0 and t=t, respectively:
κtC
Cln
0
(2)
The computed k values for P25, TS, TS-NH2, and TS-FA were 0.0242, 0.0084, 0.0005, and
0.0066 min-1, respectively. The irradiation time used was 120 min. The corresponding least
squared R values for each sample were 0.973, 0.989, 0.957, and 0.969, respectively.
The reduction of photodegradation rate after the encapsulation of TiO2 in silica shell is
consistent with our previous observation, which is mostly due to the shielding effect of the
silica matrix and the increase in nanoparticle sizes [10]. Folation of the TS nanoparticles has
resulted in a slight reduction of the degradation rate constant from the 0.0084 min-1 of TS to
0.0066 min-1 of TS-FA, which is probably due to the increased size of TS-FA. A very low
value of rate constant was shown by the intermediate TS-NH2 nanoparticles, which is
probably due to the competing photo-oxidation of primary amine groups on the surface of the
TS-NH2. A study has shown that, under UV illumination, the ROS generated from
photoexcited TiO2 nanoparticles can oxidize primary amine groups to yield NO3- ions, and the
cleavage rate of the C-N bond from primary amine is faster than that of the C-C bond in the
hydrocarbon molecules [29].

16
3.4 Cytotoxicity and hemocompatibility study
3.4.1 Toxicity of P25, TS, and TS-FA to L929 and KB cells
Fig. 6a displays the relative viability of L929 cells after 6 h and 24 h incubation with P25,
TS, and TS-FA of various concentrations (0, 12.5, 25, 50, 100, and 200 g ml-1). The culture
was performed in the dark. When the incubation time was 6 h, there were no significant
differences between the untreated cells and cells treated with P25, TS, TS-NH2, and TS-FA
nanoparticles. The viability of L929 cells, in relation to the control, was well above 90% for
all. Upon prolonged incubation time to 24 h, a dramatic increase in cell viability was observed
in the presence of TS-FA over the investigated concentration range. A decrease of cell
viability to 82% was observed when P25 (200 g ml-1) was added to the cells. No significant
change was observed in the viability of the cells treated with TS nanoparticles. It is known
that the silica coating reduces the cytotoxicity of core nanoparticles [10]. For TS-FA-treated
cells, the viability was about two-fold greater than that of both untreated cells and cells treated
with other nanoparticles. The enhanced cell proliferation may be because folic acid, an
essential vitamin B element for cell proliferation, promoted the cell growth.
A toxicity study of P25, TS, and TS-FA nanoparticles on KB cells also was conducted.
The study was carried out by exposing the cells to the nanoparticles at the prescribed
concentrations, shown in Fig. 6b. Similar to the results for the L929 cells, after 6 h incubation,
no apparent differences in cell viability (*p>0.05) were observed between control cells and
cells treated with P25, TS, and TS-FA over the investigated concentrations. When the
incubation time was increased to 24 h, the viability of TS-treated cells was decreased to 73.3%
and 79.7%, respectively, in the presence of 100 and 200 g ml-1 of nanoparticles. The toxic
effect of TS nanoparticles on KB cells in the dark is possibly due to the higher toxicity of
silica towards cancerous cells [30]. This is indeed true when comparing the KB cell viability
with the L929 cell viability after the cells were treated with TS nanoparticles. In the presence
of 100 and 200 g ml-1 of TS nanoparticles, the cell viability was 98.5% and 96.5%
respectively for L929, and 73.3% and 79.7% for KB cells (Fig. 6). We speculate that the
viability of TS-treated cells vary from one cell line to another. Similar results have been
reported by other researchers [31].
For TS-FA-treated KB cells, a concentration-dependent increase in viability was observed,
which further demonstrates the nutritional effect of the folate component in the nanoparticles.

17
It is interesting to note that TS-FA also displayed a degree of toxicity towards the cancerous
KB cells. This is particularly obvious at the lower concentration range. For instance, when the
concentration of TS-FA was 12.5, 25, and 50 µg ml-1, the cell viability for L929 was 200%,
196%, and 196%, respectively, whilst that for KB cells was 173%, 182%, and 194%. The
overall enhancement in cell proliferation by TS-FA nanoparticles was demonstrated for both
L929 and KB cells. Repeated experiments show similar effect. This could be a result of high
FA-composition in the TS-FA nanoparticles. As we know that folic acid is often used in the
growth medium to promote cell growth. In a standard growth medium, the concentration of
folic acid is approximately 1.01 g ml-1 [32]. In this study, the produced TS-FA contained 4.8%
of FA, according to the TGA analysis. This would lead to a FA concentration of 0.6, 1.2, 2.4,
4.8, and 9.6 g ml-1, respectively, when 12.5, 25, 50, 100, and 200 g ml-1 TS-FA was added
to the culture medium. Most of these concentrations are higher than that of folic acid in the
standard growth medium. The promotion of KB-cell growth by folate conjugated quantum
dots was also reported by other researchers [33]. They found that after 24 h of incubation, the
viability of KB cells that have been treated with FA-conjugated QD nanoparticles was 1.2
times greater than that of untreated cells at the particle concentration of 200 nmol L-1. The
impact of FA-component on the cell viability at an earlier time, i.e., 6 h, was not as significant
as that at 24 h. This could be due to the limited interaction time between cells and the
nanoparticles.
3.4.2 Hemocompatibility study
Fig. 7a shows the in vitro hemolysis results of P25, TS, and TS-FA at a similar particle
concentration range. The detected hemoglobin release is well below 5% over the investigated
concentration range, indicating a good compatibility of these nanoparticles with the blood
cells. A relatively high hemolysis activity was seen when the RBC was treated with the
nanoparticles at a particle concentration of 50 g ml-1. The activity was reduced at both a
higher and a lower concentration. We speculate that, although increased amounts of
nanoparticles lead to more active hemolysis, it also increases the opportunity for the
nanoparticles to aggregate, thereby decreasing the surface area that can interact with the
RBCs.

18
3.5 Photo-killing effect
Based on the above observations, the photo-killing experiments were carried out on KB cells
in the presence of P25, TS, and TS-FA nanoparticles after the cells had been incubated with
the nanoparticles for 24 h. The influence of UV irradiation alone on KB cells was first
assessed. The observed relative surviving fractions of the KB cells were 100%, 96%, 99%,
and 90% at 10 min, 20 min, 45 min, and 60 min, respectively. The exposure time of 10 min
was chosen for the photo-killing investigations of the selected nanoparticles and the results
are shown in Fig. 7b. The surviving fraction of cells was reduced from 100% for the control
to 93%, 78%, and 82% in the presence of 12.5 g ml-1 of P25, TS, and TS-FA, respectively.
The reductions for both TS and TS-FA were both similar and significant in comparison with
the control cells (*p<0.05). As the concentration of the nanoparticles was increased to
50 g ml-1, the surviving fractions became 80%, 73%, and 62% for KB cells treated by P25,
TS, and TS-FA, respectively. At this concentration, the killing effect was apparent for all
nanoparticles investigated. In comparison with P25-treated cells, a statistically significant
(**p<0.05) photo-killing effect of TS-FA on KB cells was evident. The viability of KB cells
was further reduced to 57% when the TS-FA concentration was increased to 100 g ml-1. Cell
internalization of TS-FA was well demonstrated in the fluorescence confocal micrographs
(Fig. 8a). In comparison with TS-FA, the fluorescence in P25 treated cells is relatively weak.
There is no fluorescence seen in both the control cells and the TS-treated cells. The phase
contrast images (Fig.8b) further demonstrated that the dosage of P25 internalized by KB cells
is generally lower than that of TS-FA. This is most likely due to the presence of the folate
component on the surface of TS-FA nanoparticles, which are able to be specifically bound
with the folate receptors on the folate-receptor positive KB cells. It is apparent that the higher
photo-killing effect of the TS-FA nanoparticles also is associated with the stronger cell
internalization. It should be noted that 194% of viable KB cells were observed when they
were treated with the same amounts of TS-FA in the dark for 24 h. The detected photo-killing
effect of TS-FA in the previous section could have been reduced by such enhanced growth. A
higher photo-killing power can be achieved by fine tuning the nanoparticles by controlling the
FA density on the surface of the nanoparticles. To the best of our knowledge, this is the first
study on folic acid-conjugated titanium dioxide-silica (TS-FA) nano-photosensitizer for
effective PDT. Early studies on pure TiO2 nanoparticles by Cai et al. have shown a complete
photo-killing of HeLa cells after 10 min exposure to a Hg-lamp (500 W) [13]. There was no
indication of the effect to the cells by the high power radiation alone. Antibody has been used

19
for cell specific targeting using TiO2 nanoparticles for effective PDT. One study [34] has
shown that, with 30 min irradiation of a UV-light at 365 nm, the surviving fraction of LoVo
cells was reduced from 84% to 67% due to the presence of 3.12 µg/ml antibody-modified
TiO2 nanoparticles. No data was reported about the effect of higher concentration
nanoparticles. A similar study was reported by a different group, in which 80% cell death (by
cell counting) was induced by the polyacrylic acid-coated TiO2 that is modified with
anti-epidermal growth factor receptor antibody [35]. No control data was provided in this
study. Nitrogen-doped TiO2 nanoparticles was also investigated for visible light irradiation
induced PDT, however no targeting ligand was considered [36].
4. Conclusions
In summary, a novel folic acid-conjugated titanium dioxide-silica core-shell
nanoparticulate system, TS-FA, was fabricated using the commercially available
semiconductor photocatalyst, P25, and confirmed by various chemical and physical
characterization methods. Investigations on the cytotoxicity and hemocompatibility showed
that the produced TS-FA nanoparticles are nontoxic to both L929 and KB cells in the dark,
and are well tolerated by human red blood cells. A strong increase in viability of both L929
and KB cells was demonstrated after cells were incubated with TS-FA in the range between
12.5 and 200 µg ml-1, showing that the presence of the folate element acts as a nutrient for the
cells. Upon exposure to UV light for 10 min, both P25 and TS-FA were toxic to KB cells due
to their high photocatalytic activities. The cell internalization experiments proved that folic
acid-conjugated nanoparticles were bound to the folate receptor-positive KB cells, indicating
a high ability to target cancerous cells. The dual targeting capabilities, through both the folic
acid conjugation and high photoexcitation efficiency of the TS-FA system, promises great
potential in the treatment of cancer, and possibly other diseases. It is worth noting the strong
concentration dependence of the photo-killing effects that was observed in the cells exposed
to TS-FA, and the improved compatibility of TS-FA with both L929 and KB cells due to the
‘nutritional effect’ of the folate components in the nanoparticles. Although a high
photo-killing effect of 38-43% on the KB cells has been achieved in this study, the
nanoparticulate system can be further tuned to maximize its photo-killing power. A systematic
study is under way to optimize the folate content in the nanoparticles so as to achieve an
optimal photo-killing ability to a greater variety of cancerous cells. The development and

20
application of high performance nano-photosensitizers for the use in PDT is a topic of
on-going study [5, 10, 37].
21
References
[1] B.C. Bae and K. Na, Biomaterials 31 (2010) 6325.
[2] D.E.J.G.J. Dolmans, D. Fukumura and R.K. Jain, Nat. Rev. Cancer 3 (2003) 380.
[3] B.W. Henderson and T.J. Dougherty, Photochem. Photobiol. 55 (1992) 145.
[4] L.M. Davids and B. Kleemann, Cancer Treatment Rev. 37 (2011) 465.
[5] A. Master, M. Livingston and A.S. Gupta, J. Controlled Release 168 (2013) 88.
[6] R.W. Boyle and D. Dophin, Photochem. Photobiol. 64 (2008) 469.
[7] F. Ricchelli, J. Photochem. Photobiol. B 29 (1995) 109.
[8] E. Paszko, C. Ehrhardt, M.O. Senge, D.P. Kelleher and J.V. Reynolds, Photodiagnosis
Photodyn Ther 8 (2011) 14.
[9] I.J. Macdonald and T.J. Dougherty, J. Porphyrins Phthalocyanines 5 (2001) 105.
[10] X. Feng, S. Zhang and X. Lou, Colloid Surface B 107 (2013) 220.
[11] M. Song, R. Zhang, Y. Sai, F. Gao, H. Chi, L. Gang, B. Chen and X. Wang, Biomaterials
27 (2006) 4230.
[12] Q. Li, X. Wang, X. Lu, H. Tian, H. Jiang, G. Lv, D. Guo, C. Wu and B. Chen,
Biomaterials 30 (2009) 4708.
[13] R. Cai, Y. Kubota, T. Shuin, H. Sakai, K. Hashimoto and A. Fujishima, Cancer Res. 52
(1992) 2346.
[14] R. Zanella, S. Giorgio, C.R. Henry and C. Louis, J. Phys. Chem. B 106 (2002) 7034.
[15] H. Jung, D. Moon and J. Lee, J. Nano. Mater. 2012 (2012) 1.
[16] Y. He, X.C. Wang, P.K. Jin, B. Zhao and X. Fan, Spectrachim. Acta, Part A 72 (2009)
876.
[17] J. Zhang, S. Rana, R.S. Srivastava and R.D.K. Misra, Acta Biomater. 4 (2008) 40.
[18] F. Muhammad, M. Guo, Y. Guo, W. Qi, F. Qu, F. Sun, H. Zhao and G. Zhu, J. Mater.
Chem. 21 (2011) 13406.
[19] P. Wagner, M. Hegner, P. Kernen, F. Zaugg and G. Semenza, Biophys. J. 70 (1996)
2052.
[20] B. Dordi, H. Schonherr and G.J. Vancso, Langmuir 19 (2003) 5780.
[21] L. Sanchez-del-Campo, M.F. Montenegro, J. Cabezas-Herrera and J.N. Rodriguez-Lopez,
Pigm. Cell Melanoma R. 22 (2009) 588.
[22] C. Bonechis, A. Donati, R. Lampariello, S. Martini, M.P. Picchi, M. Ricci and C. Rossi,
Spectrochim. Acta, Part A 60 (2004) 1411.
22
[23] C.M. Alexander, K.L. Hamner, M.M. Maye and J.C. Dabrowiak, Bioconjugate Chem. 25
(2014) 1261.
[24] H. Okabayashi, I. Shimizu, E. Nishio and C.J. O'Connor, Colloid Polym. Sci. 275 (1997)
744.
[25] J.B. Rosenholm, P. Stenius and I. Danielsson, J. Colloid Interface Sci. 57 (1976) 551.
[26] C. Sun, R. Sze and M. Zhang, J. Biomed. Mater. Res. 78A (2006) 550.
[27] A. Vora, A. Rega, D. Dollimore and K.S. Alexander, Thermochim. Acta 392 (2002) 209.
[28] M.G.A. El-Wahed, M.S. Refat and S.M. El-Megharbel, Spectrochim. Acta, Part A 70
(2008) 916.
[29] K. Nohara, H. Hidaka, E. Pelizzetti and N. Serpone, J. Photochem. photobiol., A 102
(1997) 265.
[30] Z. Chu, Y. Huang, L. Li, Q. Tao and Q. Li, Biomaterials 33 (2012) 7540.
[31] J.-S. Chang, K.L.B. Chang, D.-F. Hwang and Z.-L. Kong, Environ. Sci. Technol. 41
(2007) 2064.
[32] S. Miotti, P. Facheris, A. Tomassetti, F. Bottero, C. Bottini, F. Ottone, M.I. Colnaghi,
M.A. Bunni, D.G. Priest and S. Canevari, Int. J. Cancer 63 (1995) 395.
[33] E. Song, Z. Zhang, Q. Luo, W. Lu, Y. Shi and D. Pang, Clin. Chem. 55 (2009) 955.
[34] J. Xu, Y. Sun, J. Huang, C. Chen, G. Liu, Y. Jiang, Y. Zhao and Z. Jiang,
Bioelectrochemistry 71 (2007) 217.
[35] K. Matsui, M. Karasaki, M. Segawa, S.Y. Hwang, T. Tanaka, C. Ogino and A. Kondo,
Med. Chem. Commun. 1 (2010) 209.
[36] Z. Li, L. Mi, P.-N. Wang and J.-Y. Chen, Nanoscale Res. Lett. 6 (2011) 356.
[37] X. Feng, H. Guo, K. Patel, H. Zhou and X. Lou, Chem. Eng. J. 244 (2014) 327.

Figure Captions
Fig. 1. A schematic illustration of the synthesis of the FA-conjugated TiO2-SiO2 core-shell structure.
Fig. 2. (a) FTIR spectra of FA and NHS-FA; (b) 1H NMR spectra of NHS-FA.
Fig. 3. (a) FESEM and (b) TEM images of P25, TS, TS-NH2, and TS-FA.
Fig. 4. FTIR spectra in the range of (a) 100-4000 cm-1 and (b) 1300-1700 cm-1.
Fig. 5. (a) TGA curves of P25, TS, TS-NH2, and TS-FA nanoparticles and (b) Phenol concentration changes with time.
Fig. 6. Cell viability after being treated with P25, TS, and TS-FA for 6 h and 24 h respectively: (a) L929 and (b) KB cells. *p<0.05 as compared with control. All data are expressed as meanSD and n=3. The error bar is based on the standard deviation.
Fig. 7. (a) Hemolysis activity and (b) Photo-killing of KB cells by P25 ( ), TS ( ), and TS-FA ( ). *p<0.05 as compared with the results obtained at 12.5 g ml-1. †p<0.05 as compared with control. ††p<0.05 as compared with P25-treated cells at the same concentration. All data are expressed as meanSD and n=3. The error bar is based on the standard deviation.
Fig.8. Laser confocal micrographs of KB cells. All images were recorded after 6 h of incubation with 100 g ml-1 nanoparticles at 37 oC. Upper panel (a): fluorescence images; Lower panel (b): the corresponding differential interference contrast micrographs.
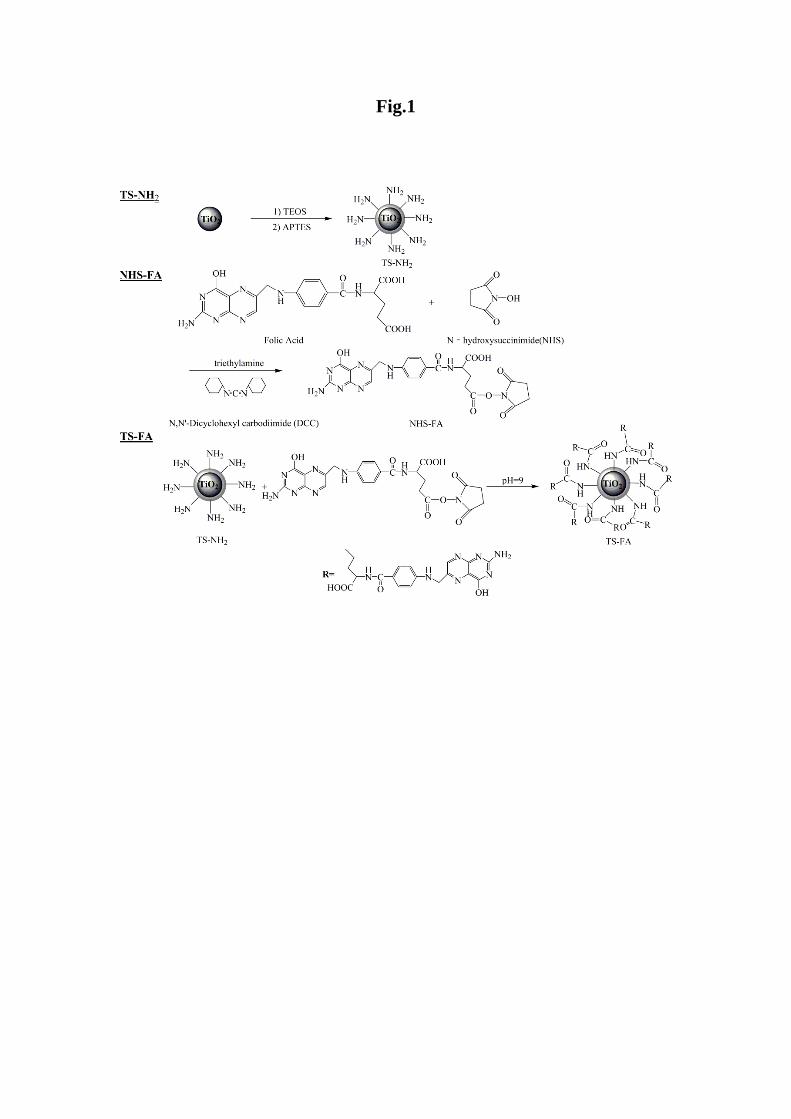
Fig.1

Fig. 2
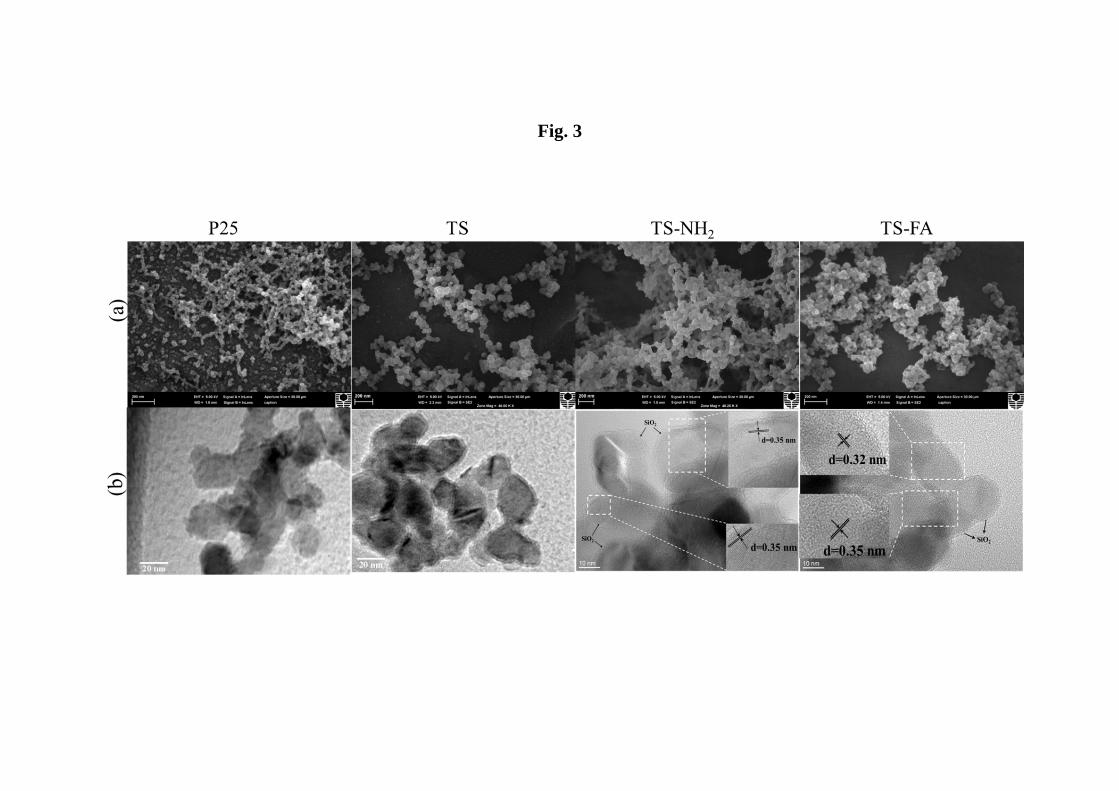
Fig. 3
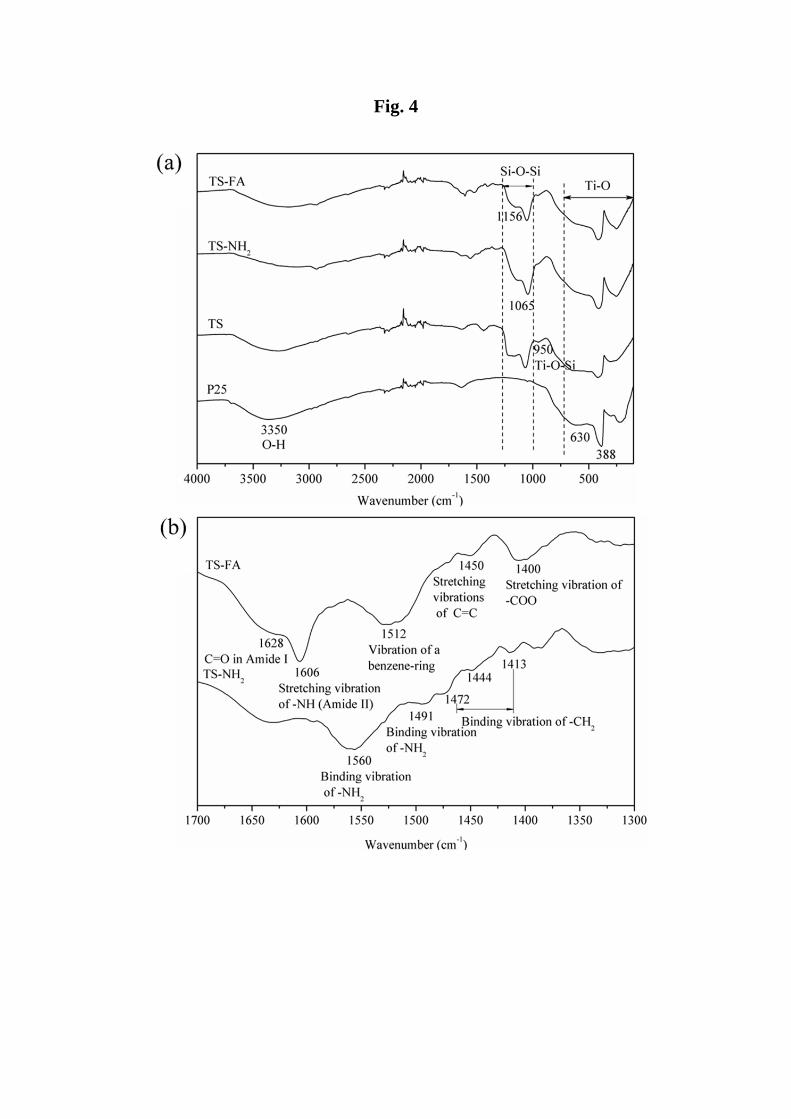
Fig. 4
(b)
(a)
Fig.5

Fig. 6

Fig. 7
0
1
2
3
4
5
12.5 25.0 50.0 100.0 200.0
Hem
olys
is (
%)
Concentration (g ml-1)
*
*
*
0
20
40
60
80
100
120
0 (control) 12.5 50
Sur
vivi
ng F
ract
ion
(%)
Concentration (g ml-1`)
††
† †††
†
(a)
(b)
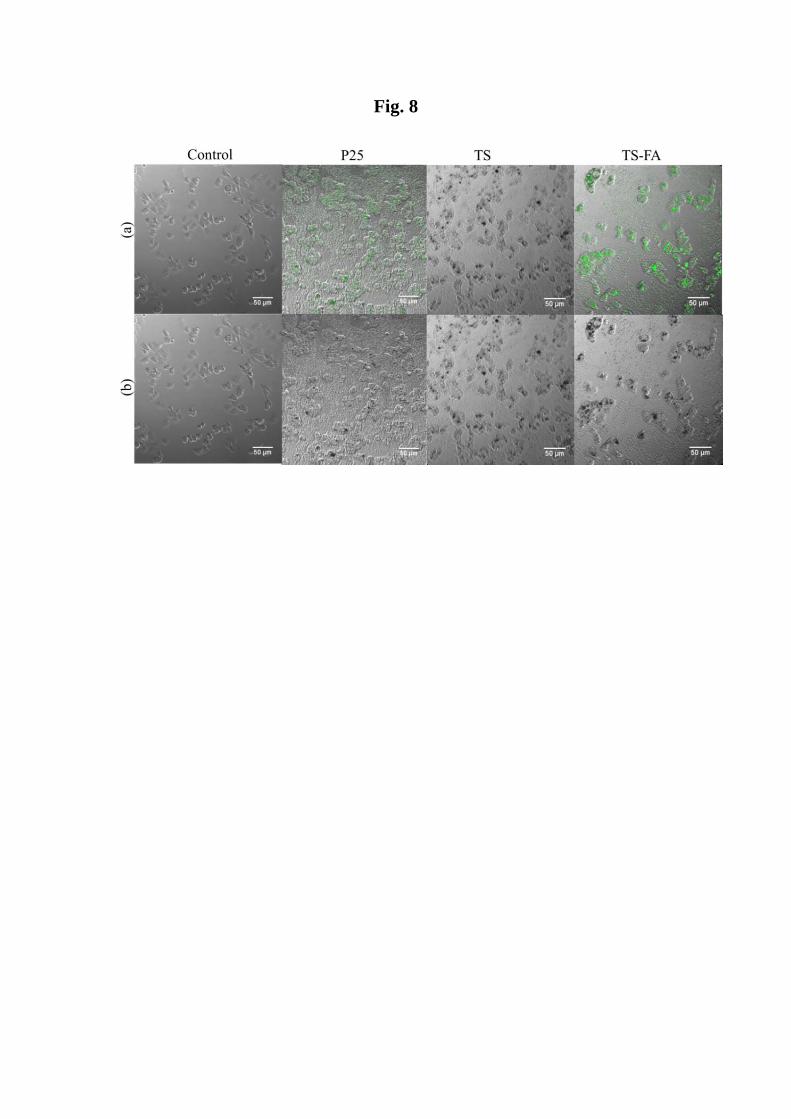
Fig. 8