A NOTE ON THE MARKET POTENTIAL OF LOW …€¦ · BITUMINOUS COAL, WILLOW CREEK PROPERTY,...
12
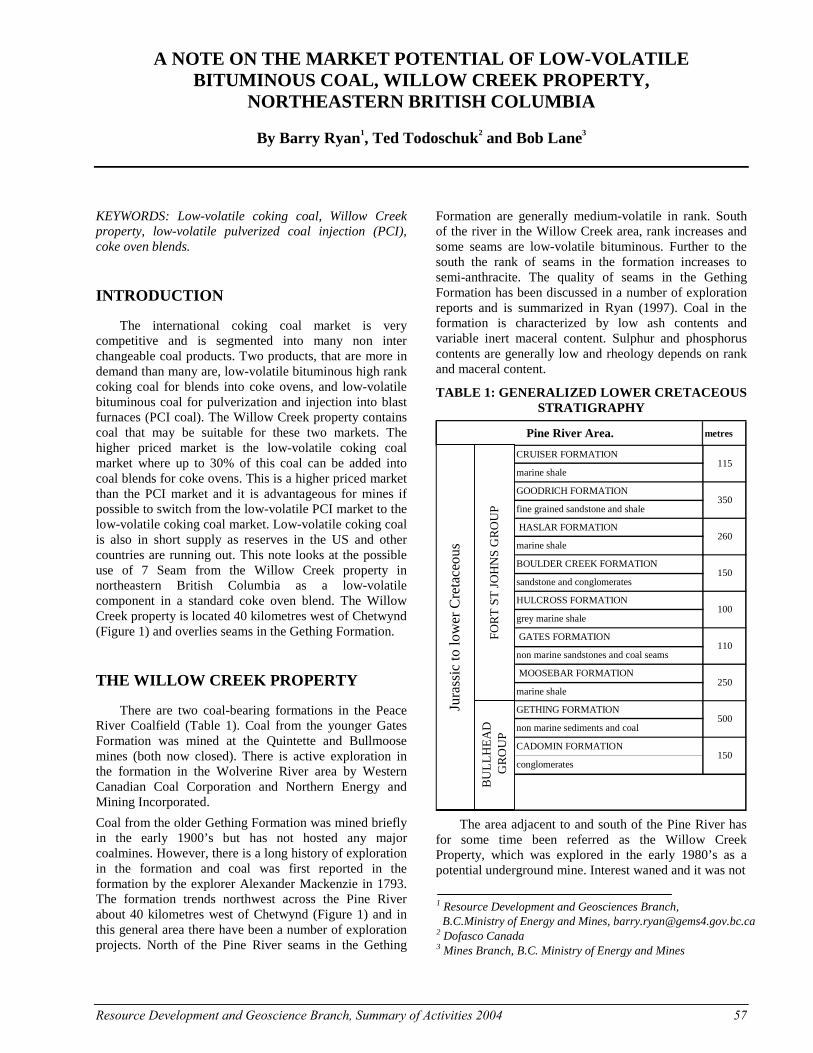
A NOTE ON THE MARKET POTENTIAL OF LOW-VOLATILE BITUMINOUS COAL, WILLOW CREEK PROPERTY, NORTHEASTERN BRITISH COLUMBIA By Barry Ryan 1 , Ted Todoschuk 2 and Bob Lane 3 KEYWORDS: Low-volatile coking coal, Willow Creek property, low-volatile pulverized coal injection (PCI), coke oven blends. INTRODUCTION The international coking coal market is very competitive and is segmented into many non inter changeable coal products. Two products, that are more in demand than many are, low-volatile bituminous high rank coking coal for blends into coke ovens, and low-volatile bituminous coal for pulverization and injection into blast furnaces (PCI coal). The Willow Creek property contains coal that may be suitable for these two markets. The higher priced market is the low-volatile coking coal market where up to 30% of this coal can be added into coal blends for coke ovens. This is a higher priced market than the PCI market and it is advantageous for mines if possible to switch from the low-volatile PCI market to the low-volatile coking coal market. Low-volatile coking coal is also in short supply as reserves in the US and other countries are running out. This note looks at the possible use of 7 Seam from the Willow Creek property in northeastern British Columbia as a low-volatile component in a standard coke oven blend. The Willow Creek property is located 40 kilometres west of Chetwynd (Figure 1) and overlies seams in the Gething Formation. THE WILLOW CREEK PROPERTY There are two coal-bearing formations in the Peace River Coalfield (Table 1). Coal from the younger Gates Formation was mined at the Quintette and Bullmoose mines (both now closed). There is active exploration in the formation in the Wolverine River area by Western Canadian Coal Corporation and Northern Energy and Mining Incorporated. Coal from the older Gething Formation was mined briefly in the early 1900’s but has not hosted any major coalmines. However, there is a long history of exploration in the formation and coal was first reported in the formation by the explorer Alexander Mackenzie in 1793. The formation trends northwest across the Pine River about 40 kilometres west of Chetwynd (Figure 1) and in this general area there have been a number of exploration projects. North of the Pine River seams in the Gething Formation are generally medium-volatile in rank. South of the river in the Willow Creek area, rank increases and some seams are low-volatile bituminous. Further to the south the rank of seams in the formation increases to semi-anthracite. The quality of seams in the Gething Formation has been discussed in a number of exploration reports and is summarized in Ryan (1997). Coal in the formation is characterized by low ash contents and variable inert maceral content. Sulphur and phosphorus contents are generally low and rheology depends on rank and maceral content. TABLE 1: GENERALIZED LOWER CRETACEOUS STRATIGRAPHY metres 250 500 150 CRUISER FORMATION 115 260 150 100 110 non marine sediments and coal CADOMIN FORMATION conglomerates non marine sandstones and coal seams MOOSEBAR FORMATION marine shale GETHING FORMATION sandstone and conglomerates HULCROSS FORMATION grey marine shale GATES FORMATION fine grained sandstone and shale HASLAR FORMATION marine shale BOULDER CREEK FORMATION Pine River Area. marine shale GOODRICH FORMATION 350 BULLHEAD GROUP FORT ST JOHNS GROUP Jurassic to lower Cretaceous The area adjacent to and south of the Pine River has for some time been referred as the Willow Creek Property, which was explored in the early 1980’s as a potential underground mine. Interest waned and it was not 1 Resource Development and Geosciences Branch, B.C.Ministry of Energy and Mines, [email protected] 2 Dofasco Canada 3 Mines Branch, B.C. Ministry of Energy and Mines Resource Development and Geoscience Branch, Summary of Activities 2004 57
Transcript of A NOTE ON THE MARKET POTENTIAL OF LOW …€¦ · BITUMINOUS COAL, WILLOW CREEK PROPERTY,...
A NOTE ON THE MARKET POTENTIAL OF LOW-VOLATILE BITUMINOUS COAL, WILLOW CREEK PROPERTY,
NORTHEASTERN BRITISH COLUMBIA
By Barry Ryan1, Ted Todoschuk2 and Bob Lane3
KEYWORDS: Low-volatile coking coal, Willow Creek property, low-volatile pulverized coal injection (PCI), coke oven blends.
INTRODUCTION
The international coking coal market is very competitive and is segmented into many non inter changeable coal products. Two products, that are more in demand than many are, low-volatile bituminous high rank coking coal for blends into coke ovens, and low-volatile bituminous coal for pulverization and injection into blast furnaces (PCI coal). The Willow Creek property contains coal that may be suitable for these two markets. The higher priced market is the low-volatile coking coal market where up to 30% of this coal can be added into coal blends for coke ovens. This is a higher priced market than the PCI market and it is advantageous for mines if possible to switch from the low-volatile PCI market to the low-volatile coking coal market. Low-volatile coking coal is also in short supply as reserves in the US and other countries are running out. This note looks at the possible use of 7 Seam from the Willow Creek property in northeastern British Columbia as a low-volatile component in a standard coke oven blend. The Willow Creek property is located 40 kilometres west of Chetwynd (Figure 1) and overlies seams in the Gething Formation.
THE WILLOW CREEK PROPERTY
There are two coal-bearing formations in the Peace River Coalfield (Table 1). Coal from the younger Gates Formation was mined at the Quintette and Bullmoose mines (both now closed). There is active exploration in the formation in the Wolverine River area by Western Canadian Coal Corporation and Northern Energy and Mining Incorporated.
Coal from the older Gething Formation was mined briefly in the early 1900’s but has not hosted any major coalmines. However, there is a long history of exploration in the formation and coal was first reported in the formation by the explorer Alexander Mackenzie in 1793. The formation trends northwest across the Pine River about 40 kilometres west of Chetwynd (Figure 1) and in this general area there have been a number of exploration projects. North of the Pine River seams in the Gething
Formation are generally medium-volatile in rank. South of the river in the Willow Creek area, rank increases and some seams are low-volatile bituminous. Further to the south the rank of seams in the formation increases to semi-anthracite. The quality of seams in the Gething Formation has been discussed in a number of exploration reports and is summarized in Ryan (1997). Coal in the formation is characterized by low ash contents and variable inert maceral content. Sulphur and phosphorus contents are generally low and rheology depends on rank and maceral content.
TABLE 1: GENERALIZED LOWER CRETACEOUS STRATIGRAPHY
metres
250
500
150
CRUISER FORMATION115
260
150
100
110
non marine sediments and coal
CADOMIN FORMATION
conglomerates
non marine sandstones and coal seams
MOOSEBAR FORMATION
marine shale
GETHING FORMATION
sandstone and conglomerates
HULCROSS FORMATION
grey marine shale
GATES FORMATION
fine grained sandstone and shale
HASLAR FORMATION
marine shale
BOULDER CREEK FORMATION
Pine River Area.
marine shale
GOODRICH FORMATION350
BU
LL
HE
AD
GR
OU
PFO
RT
ST
JO
HN
S G
RO
UP
Jura
ssic
to lo
wer
Cre
tace
ous
The area adjacent to and south of the Pine River has
for some time been referred as the Willow Creek Property, which was explored in the early 1980’s as a potential underground mine. Interest waned and it was not
1 Resource Development and Geosciences Branch, B.C.Ministry of Energy and Mines, [email protected] 2 Dofasco Canada 3 Mines Branch, B.C. Ministry of Energy and Mines
Resource Development and Geoscience Branch, Summary of Activities 2004 57
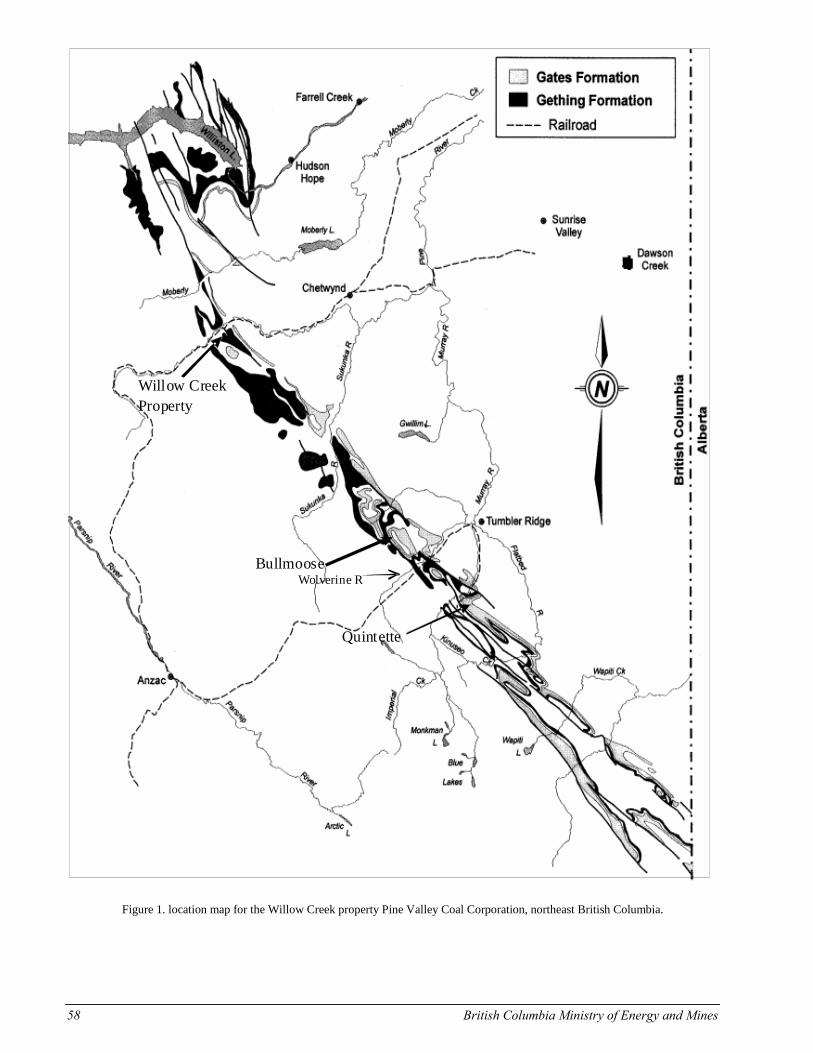
Figure 1. location map for the Willow Creek property Pine Valley Coal Corporation, northeast British Columbia.
Willow Creek Property
Bullmoose
Quintette
Wolverine R
58 British Columbia Ministry of Energy and Mines
till the mid 1990s that exploration was renewed with the intent of developing a small low strip-ratio open pit mine. In 1993 Gobaltex acquired control of the property and now has in place a British Columbia “Project Approval Certificate” and “Mine Permit”. The company has continued development work in conjunction with a number of partners.
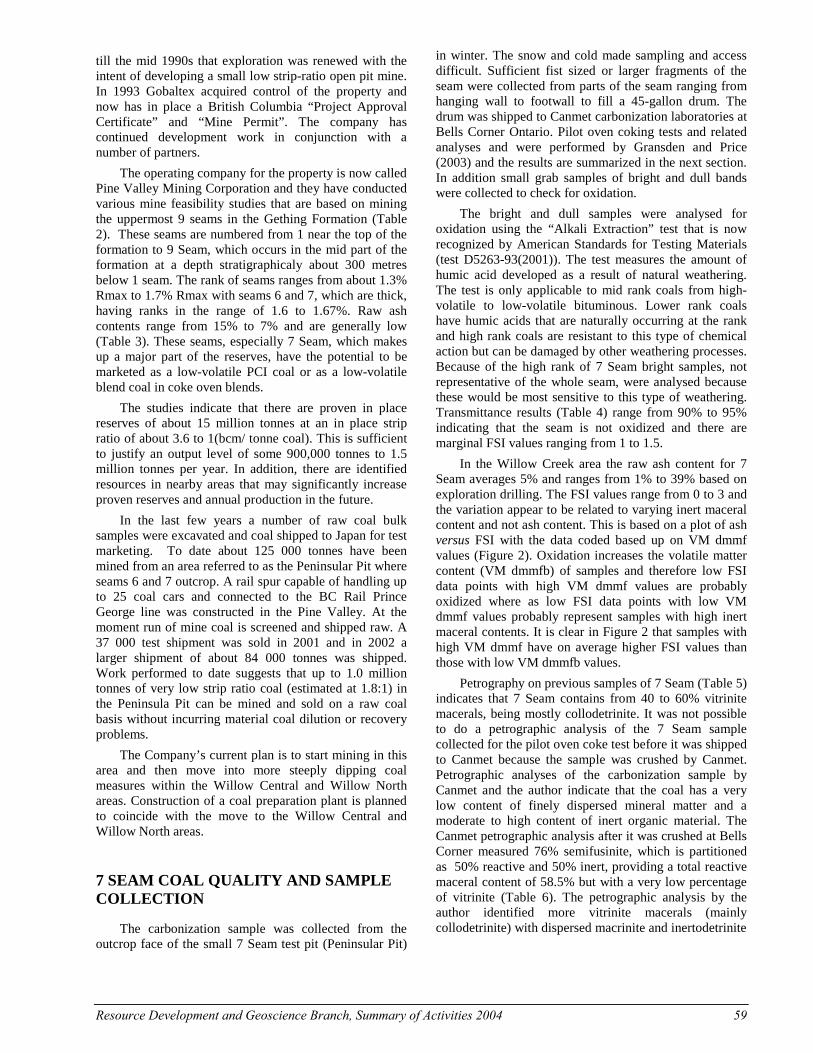
The operating company for the property is now called Pine Valley Mining Corporation and they have conducted various mine feasibility studies that are based on mining the uppermost 9 seams in the Gething Formation (Table 2). These seams are numbered from 1 near the top of the formation to 9 Seam, which occurs in the mid part of the formation at a depth stratigraphicaly about 300 metres below 1 seam. The rank of seams ranges from about 1.3% Rmax to 1.7% Rmax with seams 6 and 7, which are thick, having ranks in the range of 1.6 to 1.67%. Raw ash contents range from 15% to 7% and are generally low (Table 3). These seams, especially 7 Seam, which makes up a major part of the reserves, have the potential to be marketed as a low-volatile PCI coal or as a low-volatile blend coal in coke oven blends.
The studies indicate that there are proven in place reserves of about 15 million tonnes at an in place strip ratio of about 3.6 to 1(bcm/ tonne coal). This is sufficient to justify an output level of some 900,000 tonnes to 1.5 million tonnes per year. In addition, there are identified resources in nearby areas that may significantly increase proven reserves and annual production in the future.
In the last few years a number of raw coal bulk samples were excavated and coal shipped to Japan for test marketing. To date about 125 000 tonnes have been mined from an area referred to as the Peninsular Pit where seams 6 and 7 outcrop. A rail spur capable of handling up to 25 coal cars and connected to the BC Rail Prince George line was constructed in the Pine Valley. At the moment run of mine coal is screened and shipped raw. A 37 000 test shipment was sold in 2001 and in 2002 a larger shipment of about 84 000 tonnes was shipped. Work performed to date suggests that up to 1.0 million tonnes of very low strip ratio coal (estimated at 1.8:1) in the Peninsula Pit can be mined and sold on a raw coal basis without incurring material coal dilution or recovery problems.
The Company’s current plan is to start mining in this area and then move into more steeply dipping coal measures within the Willow Central and Willow North areas. Construction of a coal preparation plant is planned to coincide with the move to the Willow Central and Willow North areas.
7 SEAM COAL QUALITY AND SAMPLE COLLECTION
The carbonization sample was collected from the outcrop face of the small 7 Seam test pit (Peninsular Pit)
in winter. The snow and cold made sampling and access difficult. Sufficient fist sized or larger fragments of the seam were collected from parts of the seam ranging from hanging wall to footwall to fill a 45-gallon drum. The drum was shipped to Canmet carbonization laboratories at Bells Corner Ontario. Pilot oven coking tests and related analyses and were performed by Gransden and Price (2003) and the results are summarized in the next section. In addition small grab samples of bright and dull bands were collected to check for oxidation.
The bright and dull samples were analysed for oxidation using the “Alkali Extraction” test that is now recognized by American Standards for Testing Materials (test D5263-93(2001)). The test measures the amount of humic acid developed as a result of natural weathering. The test is only applicable to mid rank coals from high-volatile to low-volatile bituminous. Lower rank coals have humic acids that are naturally occurring at the rank and high rank coals are resistant to this type of chemical action but can be damaged by other weathering processes. Because of the high rank of 7 Seam bright samples, not representative of the whole seam, were analysed because these would be most sensitive to this type of weathering. Transmittance results (Table 4) range from 90% to 95% indicating that the seam is not oxidized and there are marginal FSI values ranging from 1 to 1.5.
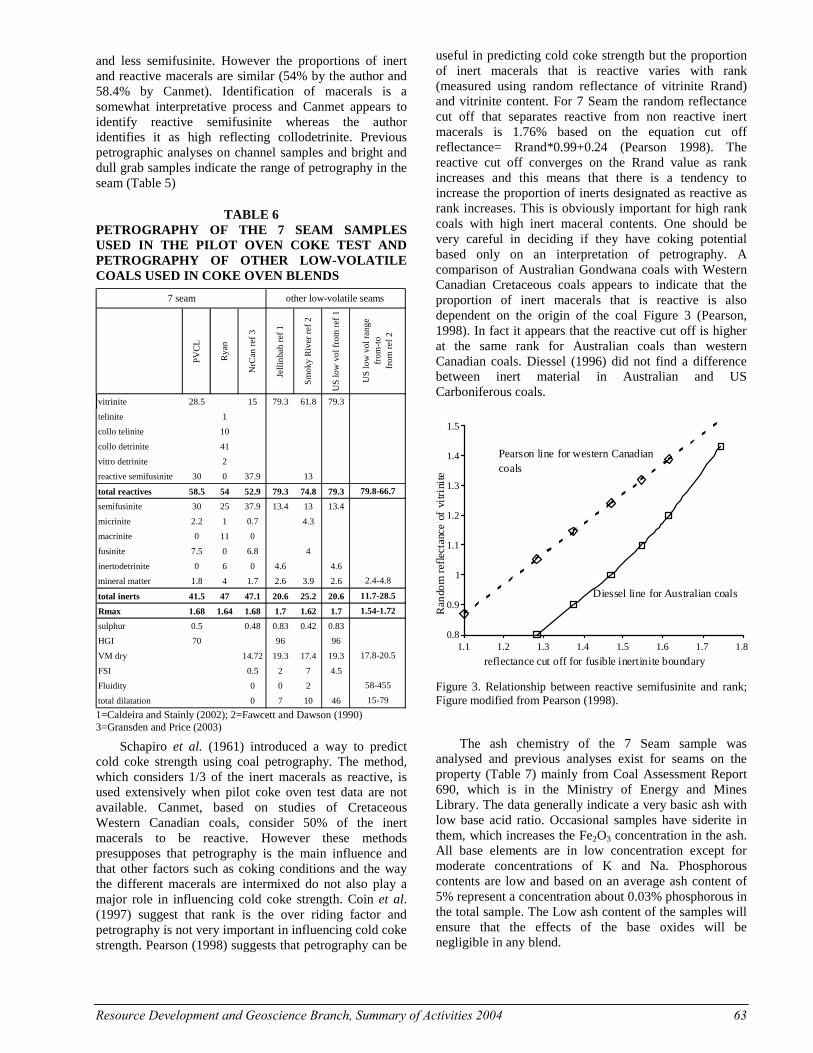
In the Willow Creek area the raw ash content for 7 Seam averages 5% and ranges from 1% to 39% based on exploration drilling. The FSI values range from 0 to 3 and the variation appear to be related to varying inert maceral content and not ash content. This is based on a plot of ash versus FSI with the data coded based up on VM dmmf values (Figure 2). Oxidation increases the volatile matter content (VM dmmfb) of samples and therefore low FSI data points with high VM dmmf values are probably oxidized where as low FSI data points with low VM dmmf values probably represent samples with high inert maceral contents. It is clear in Figure 2 that samples with high VM dmmf have on average higher FSI values than those with low VM dmmfb values.
Petrography on previous samples of 7 Seam (Table 5) indicates that 7 Seam contains from 40 to 60% vitrinite macerals, being mostly collodetrinite. It was not possible to do a petrographic analysis of the 7 Seam sample collected for the pilot oven coke test before it was shipped to Canmet because the sample was crushed by Canmet. Petrographic analyses of the carbonization sample by Canmet and the author indicate that the coal has a very low content of finely dispersed mineral matter and a moderate to high content of inert organic material. The Canmet petrographic analysis after it was crushed at Bells Corner measured 76% semifusinite, which is partitioned as 50% reactive and 50% inert, providing a total reactive maceral content of 58.5% but with a very low percentage of vitrinite (Table 6). The petrographic analysis by the author identified more vitrinite macerals (mainly collodetrinite) with dispersed macrinite and inertodetrinite
Resource Development and Geoscience Branch, Summary of Activities 2004 59
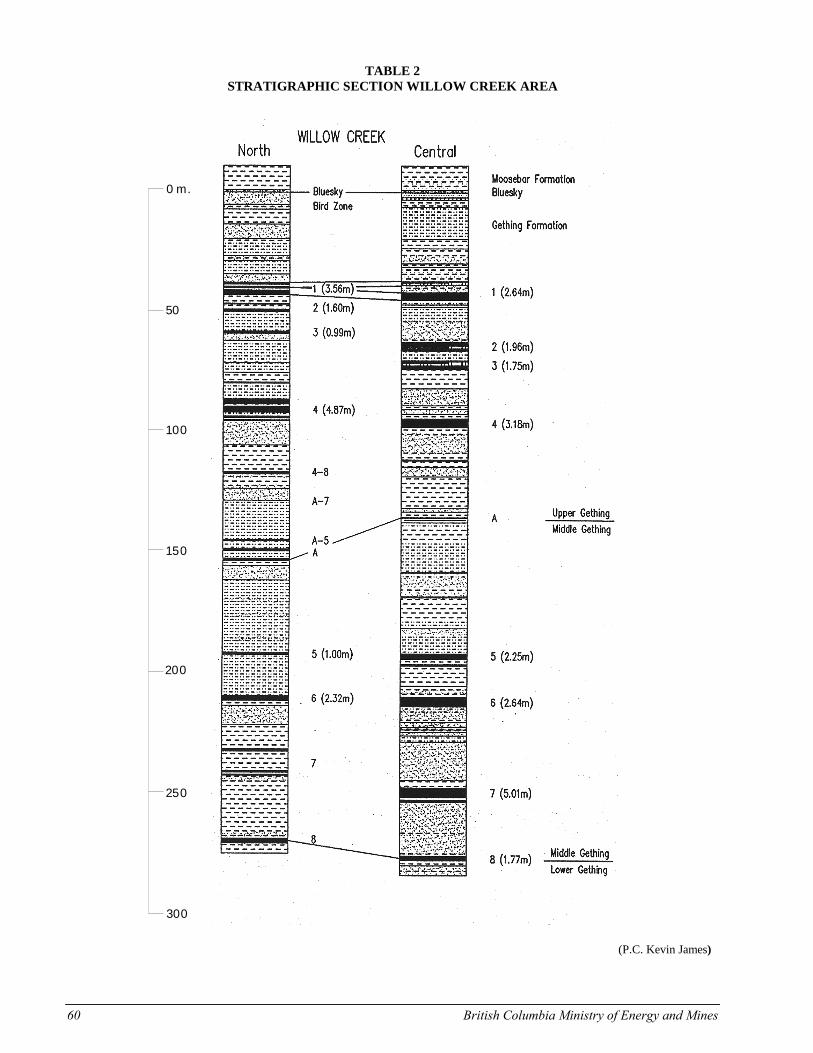
TABLE 2
STRATIGRAPHIC SECTION WILLOW CREEK AREA
0 m.
50
100
150
200
250
300
(P.C. Kevin James)
60 British Columbia Ministry of Energy and Mines

TABLE 3
AVERAGE QUALITY AND THICKNESS FOR SEAMS AT WILLOW CREEK
Seam
met
res
from
M
oosb
ar
thic
knes
s no
rth
met
res
thic
knes
s ce
ntra
l m
etre
s
raw
ash
% D
B
VM
% D
B
CV
cal
s/g
Meg
ajou
les/
kg
Sulp
hur%
FSI
raw
dat
a
Rm
ax%
1 40 3.56 2.64 7.9 23.5 7870 32.95 0.5 4.5 1.28
2 55 1.6 1.96 14.5 23 7734 32.38 0.59 6 1.33
3 70 1 1.75 8.7 21.1 7729 32.36 0.43 2 1.34
4 100 4.87 3.18 10.1 20 7688 32.19 0.48 3 1.4
A 140 ? ? ? ? ? ? ? ? 1.49
5 190 1 2.25 8.3 16.9 7898 33.07 0.7 1 ?
6 210 2.32 2.64 7.3 16.3 7957 33.31 0.62 1 ?
7 250 ? 5.01 8 16.1 7897 33.06 0.65 1.5 1.67
8 280 ? 1.77 ? ? ? ? ? ? ?
9 ? ? ? ? ? ? ? ? ? ?
TABLE 4
PROXIMATE ANALYSES FOR 7 SEAM AND “ALKALI EXTRACTION” TEST FOR SAMPLE OXIDATION
H2O
% A
R
VM
% D
B
Ash
% D
B
FC%
DB
FSI
Sulp
hur%
HG
I
Alk
ali
exct
ract
ion
WC 2002
8 bright
0.74 17.23 3.4 79.38 1.5 93.3
WC 2002
9 bright
0.7 17.14 3.48 79.38 1.5 91.7
WC 2002
10 bright
0.65 16.58 11.13 72.29 1.5 95
WC 2002
1 dull 0.56 14.47 3.09 82.44 1 90
bulk 1 15.31 4.73 79.96 0.53 70
bulk 2 15.65 4.23 76.72 0.53
product quality 16.4 4 79.6 1 0.55 70
Canmet 7 seam 14.7 2.93 82.4 0.5 0.48 95.5
Resource Development and Geoscience Branch, Summary of Activities 2004 61

Figure 2. Ash versus FSI data for 7 Seam from coal assessment report 690 British Columbia Ministry of Energy and Mines, Library.
TABLE 5
PETROGRAPHY OF 7 SEAM SAMPLES COLLECTED IN 2001
VOLUME PERCENTS Petrography for samples 300 point count.
Des
crip
tion
leng
th c
m
H2O
% A
R
VM
% D
B
Ash
% D
B
FC
% D
B
teli
nite
coll
otel
init
e
coll
odet
rini
te
vitr
odet
rini
te
pseu
dovi
trin
ite
tota
l rea
ctiv
es
sem
ifus
inite
fusi
nite
iner
tode
trin
ite
mac
rini
te
mic
rini
te
tota
l ine
rts
min
eral
mat
ter
wei
ght a
sh%
C 163 4.3 12.7 1.8 85.5 2 6 37 0 2 48 33 1 1 7 6 48 3 5.1
C 111 3.1 12.4 12.7 74.9 0 19 39 2 1 61 10 2 2 9 6 29 10 16.3
C 70 5.1 12.5 2.4 85.1 8 3 32 1 3 47 23 2 0 19 6 50 2 4.0
bright 2.7 14.9 1.7 83.4 2 12 50 1 15 80 8 0 2 6 1 17 1 2.3
dull 3.6 13.1 1.4 85.4 4 13 36 0 4 58 23 2 2 9 4 40 2 4.0
bright 6.7 14.8 13.2 72.1 24 21 34 1 0 81 1 1 2 1 0 5 13 20.5
dull 2.9 12.7 3.8 83.5 2 7 44 0 0 53 14 0 2 20 9 45 3 4.5
C=channel sample bright and dull are grab samples of lithotypes .
0
0.5
1
1.5
2
2.5
3
3.5
0 5 10 15 20 25Ash %
Fre
e sw
ellin
g in
dex
solid square low VM dmmfbopen square high VM dmmfb
FSI versus ash trend higher
FSI versus ash trend lower
62 British Columbia Ministry of Energy and Mines
and less semifusinite. However the proportions of inert and reactive macerals are similar (54% by the author and 58.4% by Canmet). Identification of macerals is a somewhat interpretative process and Canmet appears to identify reactive semifusinite whereas the author identifies it as high reflecting collodetrinite. Previous petrographic analyses on channel samples and bright and dull grab samples indicate the range of petrography in the seam (Table 5)
TABLE 6 PETROGRAPHY OF THE 7 SEAM SAMPLES USED IN THE PILOT OVEN COKE TEST AND PETROGRAPHY OF OTHER LOW-VOLATILE COALS USED IN COKE OVEN BLENDS
PVC
L
Rya
n
NrC
an r
ef 3
Jell
inba
h re
f 1
Sm
oky
Riv
er r
ef 2
US
low
vol
fro
m r
ef 1
vitrinite 28.5 15 79.3 61.8 79.3
telinite 1
collo telinite 10
collo detrinite 41
vitro detrinite 2
reactive semifusinite 30 0 37.9 13
total reactives 58.5 54 52.9 79.3 74.8 79.3
semifusinite 30 25 37.9 13.4 13 13.4
micrinite 2.2 1 0.7 4.3
macrinite 0 11 0
fusinite 7.5 0 6.8 4
inertodetrinite 0 6 0 4.6 4.6
mineral matter 1.8 4 1.7 2.6 3.9 2.6
total inerts 41.5 47 47.1 20.6 25.2 20.6
Rmax 1.68 1.64 1.68 1.7 1.62 1.7
sulphur 0.5 0.48 0.83 0.42 0.83
HGI 70 96 96
VM dry 14.72 19.3 17.4 19.3
FSI 0.5 2 7 4.5
Fluidity 0 0 2
total dilatation 0 7 10 46
58-455
15-79
11.7-28.5
2.4-4.8
1.54-1.72
17.8-20.5
7 seam other low-volatile seams
US
low
vol
ran
ge
from
-to
from
ref
2
79.8-66.7
1=Caldeira and Stainly (2002); 2=Fawcett and Dawson (1990) 3=Gransden and Price (2003)
Schapiro et al. (1961) introduced a way to predict cold coke strength using coal petrography. The method, which considers 1/3 of the inert macerals as reactive, is used extensively when pilot coke oven test data are not available. Canmet, based on studies of Cretaceous Western Canadian coals, consider 50% of the inert macerals to be reactive. However these methods presupposes that petrography is the main influence and that other factors such as coking conditions and the way the different macerals are intermixed do not also play a major role in influencing cold coke strength. Coin et al. (1997) suggest that rank is the over riding factor and petrography is not very important in influencing cold coke strength. Pearson (1998) suggests that petrography can be
useful in predicting cold coke strength but the proportion of inert macerals that is reactive varies with rank (measured using random reflectance of vitrinite Rrand) and vitrinite content. For 7 Seam the random reflectance cut off that separates reactive from non reactive inert macerals is 1.76% based on the equation cut off reflectance= Rrand*0.99+0.24 (Pearson 1998). The reactive cut off converges on the Rrand value as rank increases and this means that there is a tendency to increase the proportion of inerts designated as reactive as rank increases. This is obviously important for high rank coals with high inert maceral contents. One should be very careful in deciding if they have coking potential based only on an interpretation of petrography. A comparison of Australian Gondwana coals with Western Canadian Cretaceous coals appears to indicate that the proportion of inert macerals that is reactive is also dependent on the origin of the coal Figure 3 (Pearson, 1998). In fact it appears that the reactive cut off is higher at the same rank for Australian coals than western Canadian coals. Diessel (1996) did not find a difference between inert material in Australian and US Carboniferous coals.
Figure 3. Relationship between reactive semifusinite and rank; Figure modified from Pearson (1998).
The ash chemistry of the 7 Seam sample was analysed and previous analyses exist for seams on the property (Table 7) mainly from Coal Assessment Report 690, which is in the Ministry of Energy and Mines Library. The data generally indicate a very basic ash with low base acid ratio. Occasional samples have siderite in them, which increases the Fe2O3 concentration in the ash. All base elements are in low concentration except for moderate concentrations of K and Na. Phosphorous contents are low and based on an average ash content of 5% represent a concentration about 0.03% phosphorous in the total sample. The Low ash content of the samples will ensure that the effects of the base oxides will be negligible in any blend.
0.8
0.9
1
1.1
1.2
1.3
1.4
1.5
1.1 1.2 1.3 1.4 1.5 1.6 1.7 1.8
Ran
dom
ref
lect
ance
of
vitri
nite
Pearson line for western Canadian coals
Diessel line for Australian coals
reflectance cut off for fusible inertinite boundary
Resource Development and Geoscience Branch, Summary of Activities 2004 63

TABLE 7 ASH OXIDE ANALYSES FOR 7 SEAM AND OTHER SEAMS ON THE PROPERTY
Sample Ash SiO2 TiO2 Al2O3 Fe2O3 MgO CaO Na2O K2O P205 Ba(4) B/A
% % % % % % % % % % % ratio
7 sm Pilot oven sample 2.4 63.00 0.95 23.29 2.48 0.33 1.10 1.97 1.12 1.70 0.65 0.08
7sm central P1 4.5 69.94 0.82 21.22 1.8 0.9 1.04 1 2.35 0.8 0.08
5.48 24.65 13.99 0.71 35.68 2.97 7.07 2.1 0.48 2.13 1.23
6.48 67.7 18.27 0.75 3.5 1.1 2.07 1.54 2.53 0.27 0.12
6.31 69 20.85 1.41 0.79 0.35 0.95 1.16 1.81 1.57 0.06
Seam1 3.26 54.92 24.17 2.68 1.67 0.78 3.98 2.31 0.37 4.73 0.11
Seam 1 8.52 62.91 8.13 0.32 13.12 1.09 5.18 1.41 0.24 0.49 0.29
Seam 2 3.59 59.62 25.52 1.88 2.43 0.7 3.11 2.91 1.57 1.09 0.12
Seam 4 2.59 23.05 16.65 0.71 9.27 2.75 21.08 2.56 0.49 2.45 0.89
Seam 4 5.21 56.86 26.79 1.06 1.88 0.92 2.69 1.58 0.73 4.07 0.09
Seam 5 4.77 66.84 19.85 0.49 2.15 0.62 1.06 1.37 2.29 0.48 0.09
Seam 6 4.33 64.14 23.68 1.08 1.17 0.54 1.4 1.48 1.45 1.81 0.07
Seam 6 5.95 61.52 23.69 0.99 2.75 1 1.68 1.83 2.41 1.4 0.11
7 Seam data from Coal assessment report 690
PILOT OVEN COKE TEST RESULTS
The 45-gallon drum of 7 Seam sample was crushed at Bells Corner to 80% less than 3 mm. A split of the sample was returned to the author for petrographic and ash oxide analysis. A second split was analysed for proximate and ultimate analysis and in addition rheology (Table 8 and 9). In order to test the applicability of using 7 Seam as a blend in coke ovens, it was necessary to obtain a suite of coals that make up a normal coke oven blend, to coke the blend and then make up a new blend with 10% of 7 Seam replacing the low-volatile component in the standard blend and do an second coke test.
Dofasco provided three coals and these coals were mixed in the proportions 28% low-volatile (Rmax 1.7%), 35% high-volatile (Rmax 1%) and 37% medium-volatile (Rmax 1.08%) in preparation for a pilot oven coke test on a standard coke oven blend. A second blend was prepared in which the Dofacso coals contributed 18% low-volatile, 37% high-volatile and 35% medium-volatile with the balance being made up with 10% 7 Seam. Component seam proportions, proximate and ultimate analyses of the 2 blends are in Table 8. The addition of 10% 7 Seam decreased the ash and volatile content of the blend. The rheology data for the 2 blends (Table 9) indicate that the addition of 7 Seam has had no measurable effect on Gieseler plasticity but has had a detrimental affect on dilatation, which has decreased from 112% to 69%.
The pilot oven coke tests and related analyses were performed by Gransden and Price (2003). The two blends were coked in the Canmet 18 inch oven, which takes a sample load of 350 kg of blended coal. The coal was charged at 3% moisture and 80% less than 3 mm. The coking conditions were those used for other pilot coke oven tests and are contained in Table 10.
TABLE 8 BLEND PROPORTIONS, PROXIMATE AND ULTIMATE ANALYSES OF THE TWO BLENDS AND 7 SEAM THAT WERE COKED IN THE PILOT OVEN BY CANMET
Bas
e B
lend
7Sea
m
blen
d
7 S
eam
Low-volatile Rmax 1.7% 28 18
medium-volatile Rmax 1.08% 35 35
high-volatile Rmax 0.99% 37 37
7 Seam 0 10 100
Coal proximate analysis
ash% db 6.43 6 2.93
Volatile matter db% 29.85 28.22 14.72
fixed carbon db% 63.72 65.78 82.35
Sulphur db% 0.89 0.83 0.48
Ultimate analysis
Carbon 81.95 82.92 88.28
hydrogen 4.84 4.84 3.84
nitrogen 1.55 1.52 1.22
ash% db 6.43 6 2.93
Oxygen by dif 4.34 3.89 3.25
Coke proximate analysis
ash% db 8.46 7.84
Volatile matter db% 0.46 0.5
fixed carbon db% 91.08 91.66
Sulphur db% 0.71 0.65
64 British Columbia Ministry of Energy and Mines

TABLE 9 RHEOLOGY OF THE TWO BLENDS AND OF 7 SM
Bas
e B
lend
7Sea
m b
lend
7 Se
am
Low-volatile Rmax 1.7% 28 18
medium-volatile Rmax 1.08% 35 35
high-volatile Rmax 0.99% 37 37
7 Seam 0 10 100
FSI 7.5 7 0.5
Gieseler Plasticity
Initial softening temp °C 42 403
Fusuion temp °C 415 416
Max fluid temp °C 445 443 493
Final fluid temp °C 485 486
Solidification temp °C 491 492
melting range temp °C 83 83
Max fluiditiy ddpm 2422 2547 0.1
Dilitation
Softening temp °C 376 374
Max contration temp °C 417 419
Max dilatation temp °C 470 468
Contraction 24 28
Dilation 106 63
The quality of the coke produced by the blend with 10% of 7 Seam was the same or not as good as the standard blend on a number of counts. Coke strength after reaction and coke reactivity index were un changed within the limits of the measurements (Table 9). However cold coke strength decreased markedly. On the plus side, maximum wall pressure and maximum gas pressure both decreased. The ash and sulphur contents of the coke decreased.
The poor performance of 7 Seam in the blend is probably the result of a combination of the low percent of active reactives and the high rank. Coke textures (Table 11) confirm a noticeable decrease in the reactive components of the 7 Seam blend as coke inerts increase by about 6%. It was unfortunate that the petrographic composition could not be checked prior to coking. There is a distinct possibility that in other areas the seam will have higher reactives content or lower rank. It is also possible that either the upper or lower part of the seam has a higher reactive content and could be mined separately for a coke oven blend market. Six Seam, which is about 30 metres above 7 Seam, may provide a better candidate for blending.
TABLE 10 CARBONIZATION CONDITIONS AND
RESULTS FOR THE TWO COKE TESTS
Bas
e B
lend
7Sea
m b
lend
Low-volatile Rmax 1.7% 28 18
medium-volatile Rmax 1.08% 35 35
high-volatile Rmax 0.99% 37 37
7 Seam 0 10
moisture % 2.6 2.4
Minus 3.35 mm % 81.2 81
ASTM bulk density Kg/m3 778 782
Oven bulk density Kg/m3 824 823
Coking time h:min 18:30 18:05
Final centre temp °C 1068 1064
Time to 900 °C 14:55 14:30
Time to 950 °C 15:30 15:05
Time to 1000 °C 16:05 15:50
Max wall pressure Kpa 7.7 5.0
Max gas pressure Kpa 14.8 3.4
Coke yield % 75.7 76.5
100 mm sieve % 0.0 0.8
75 mm sieve % 5.7 8.2
50 mm sieve % 43.6 42.2
37.5 mm sieve % 79.5 77.1
25 mm sieve % 92.7 91.9
19 mm sieve % 94.7 94.5
12.5 mm sieve % 95.7 95.8
Passsing 12.5 mm sieve % 4.3 4.2
Mean coke size 50.2 50.3
ASG 0.954 0.987
Stability 61.0 57.3
Hardness 67.0 65.2
I 10 19.3 20.7
I 20 78.5 77.0
I 40 49.4 42.6
CSR % 55.0 56.6
CRI % 30.7 28.8
Resource Development and Geoscience Branch, Summary of Activities 2004 65

TABLE 11 COKE TEXTURES FOR THE TWO BLENDS
Bas
e B
lend
7Sea
m b
lend
Low-volatile Rmax 1.7% 28 18
medium-volatile Rmax 1.08% 35 35
high-volatile Rmax 0.99% 37 37
7 Seam 0 10
isotropic 0.00 0.94
incipient 1.85 2.62
circular fine 41.08 37.83
circular medium 1.18 1.50
circular coarse 0.00 0.00
total circular 44.11 41.95
lenticular fine 20.54 18.35
lenticular medium 2.86 3.00
lenticular coarse 0.51 0.75
total lenticular 23.91 22.10
ribbon coarse 3.03 4.12
ribbon medium 3.70 2.62
ribbon fine 11.62 8.80
total ribbon 18.35 15.54
fusinite 0.17 0.37
semi-fusinite 3.37 10.67
unidentified inerts 10.10 7.68
altered vitrinite 0.00 0.00
green coke 0.00 0.00
depositional carbon 0.00 0.75
petroleum coke 0.00 0.00
breeze 0.00 0.00
total inerts 13.64 19.48
blend Rmax% 1.16 1.14
low vol 21.54 19.77
medium vol 27.39 26.98
high vol 51.07 53.26
MARKET OPPORTUNITIES FOR PCI AND LOW VOLATILE PCI
A large percent of the reserves in the Willow Creek area are derived from seams 6 and 7. The rank of these seams is low-volatile bituminous and they have moderate and variable inert maceral content. On average they do not exhibit good coking characteristics and consequently
coal on the property is considered suitable for thermal or pulverized coal injection (PCI) purposes. There are two important ratios to consider when discussing PCI. First is the amount of PCI coal used for each tonne of hot metal produced (kg/thm i.e. the PCI ratio) and the second is the replacement ratio of weight of PCI coal for weight of coke (coke replacement ratio). The second is the reduction in coke requirement divided by the amount of PCI coal used.
The coke replacement ratio varies with the rank of coal used and ranges from about 0.6 for high-volatile low rank coals to nearly 1 for low-volatile high rank coals. The rate is in part related to the hydrogen content of the fuel. Hydrogen is an effective reductant but has a cooling effect in the raceway at the base of the blast furnace where it is injected. This limits the amount of hydrogen rich fuels (natural gas) that can be injected. Higher coke replacement ratios are achieved with coal rather than oil, rather than gas. The hydrogen content of coal decreases as rank increases so the coke replacement ratio increases as rank increases (Figure 4). This has been pointed out by a number of authors (Hutny et al., 1991), and more recently by Stainlay (2003). There is therefore an expanding market for PCI coal and especially high rank low-volatile bituminous coal.
Figure 4. Coke replacement ratio versus coal rank.
It requires 1.2 to 1.5 tonnes of coal to make a tonne of coke so if the coke replacement ratio is 0.75 the coal replacement ratio is at least 0.75 x 1.2 i.e. 1.0 or more. However PCI coal sells for much less than coking coals. Prices vary but are often only 70% the price of premium coking coal. Obviously there is the potential for considerable savings for the blast furnace operator. Based on the price variation it is to the advantage of the operator to use low-volatile coals for PCI to save even more money.
The burning characteristics of high rank low-volatile PCI coal in the blast furnace are different from low rank high volatile coals, but once the blast furnace is adapted there can be a considerable saving in requirement for
0.6
0.7
0.8
0.9
1
72 76 80 84 88 92
Carbon% daf basis
Cok
e re
plac
emen
t rat
ioSub bituminous High-volatile Medium-volatile Low-volatile
66 British Columbia Ministry of Energy and Mines

higher priced coking coal. At the moment the majority of blast furnaces have converted to PCI and the global average injection rate is 96 kg/tonne hot metal. The present demand is about 31 million tonnes and this is expected to grow to 42 million tonnes by 2010 (Stainlay, 2003). The increase in consumption will be caused by more conversions and an increase in the PCI rate from about 100 to maybe as high as 200 kg/thm. This increase in PCI rate will in part be achieved by switching from high to low-volatile PCI coals. The maximum PCI rate reported is from China where a rate of about 280 kg/thm was achieved using anthracite.
Traditionally the main component of coking coal blends for coke ovens has been medium-volatile bituminous coals with good rheology and ash chemistry. As science and international coal trade developed, it was found that a mixture of coals would result in an optimum blend whose composition plotted in the optimum blend field of various diagrams (for example the MOF diagram). As few single coals plotted in the field, most steel mills moved to at least a ternary blend of low, medium and high volatile coals. High volatile coals add fluidity to the blend and low volatile coals improve coke yield at the expense of increasing coke oven pressure. Low-volatile coals represent a balancing act between increasing rank and preservation of rheology, which is destroyed as rank increases. The three-component blend of coals for coke ovens has become the norm in recent years, however reserves of low-volatile coal are becoming depleted especially in the US (Kolijn and Khan, 2003). Steel mills looking to maintain a low-volatile component in their coke oven blends will have limited opportunities in the future.
In Australia the Jellinbah mine mines a low-volatile seam (Table 6), which is being marketed as a PCI product and as a possible blend component in coke ovens (Calderia and Stanlay, 2003). The coal is higher rank than 7 Seam but also has a much higher reactives content.
Low-volatile coals can be replaced in the coal blend with medium-volatile coals especially if the amount of high-volatile coal is also reduced (Kolijn and Khan, 2003). This can maintain coke quality and coke yield because of the reduction in amounts of both low and high-volatile coal and has the added advantage of reducing oven pressure.
REGIONAL AVAILABILITY OF LOW-VOLATILE COALS IN BRITISH COLUMBIA
The rank of coals in the Gething Formation was studied by a number of authors (Marchioni and Kalkreuth, 1992), Karst and White (1979). The rank of the formation decreases to the northeast into the Western Canadian sedimentary basin and is generally medium-volatile bituminous along the trend of the Rocky Mountain
Foothills. Within this trend there are three areas where the rank is low-volatile bituminous (Marchioni and Kalkreuth, 1992)(Figure 5). The northernmost underlies the sub crop area of the Willow Creek, Lossan and Burnt River properties (Figure 5). To the south along the trend of the foothills another area is east of the town of Tumbler Ridge and at depth within the Gething Formation. The third area is to the southeast in Alberta. The best opportunity for low-volatile mineable coal resources is in the area around Willow Creek and to the south east.
Figure 5. Reflectance isograds for the top of the Gething Formation adapted from Machioni and Kalkreuth, (1992)
The Mist Mountain coal section in Morrissey ridge area in the southwest part of the Crowsnest Coalfield (southeast British Columbia) contains low-volatile coal (Pearson and Grieve, 1985). Coal in the area was mined in the period 1902-1906 in the Carbonado Mine. The coal was used as single component in beehive ovens but it did not make good coke and this was in part the reason for the failure of the mine.
Outside British Columbia in Alberta the Smoky River mine now closed exported a low-volatile coking coal (Table 6). The coal has a similar rank to 7 Seam but a higher reactive maceral content and much better FSI. The mine is expected to re open as the Grande Cache mine in the near future.
CONCLUSIONS
The internationally traded coal market will remain very competitive in the long term, especially when China re-enters the coking coal an coke export markets in a big way. However, there are two brands of coking coal that are presently in demand and will probably remain in an
Resource Development and Geoscience Branch, Summary of Activities 2004 67

under supply situation. These are low-volatile coal for PCI and low-volatile coal for coke oven blends. The latter commands a higher price. British Columbia has limited potential to take advantage of these markets. The best opportunities are at Willow Creek and possibly in other parts of the Gething Formation. There are also possibilities in the southeast corner of the Crowsnest Coalfield in southeastern British Columbia.
This limited test did not indicate that 7 Seam from the Willow Creek property could be used in a coke oven blend however it appears that the sample may not have been representative. When the mine is in production sampling will be easier and channel samples may indicate better potential for samples to use in additional coke oven tests.
ACKNOWLEDGEMENTS
Age and the expanding breadth of coal science including coalbed methane insures that the senior author can not pretend to be more than a generalist in his field and this short report has benefited considerably from conversations with John Gransden.
REFERENCES
Caldeira, J.G. and Stainly R.S. (2002): The challenge to use extremely low-volatile Australian weak coking coals in the production of good quality cokes; 2002 Iron making Conference Proceedings, pages 405-415.
Coin C.D.A., and Broome, A.J. (1997): Coke Quality Prediction from Pilot Scale Ovens and Plant Data, International Coal Conference, Calgary, September 1997, pages 325-333.
Diessel C.E.K. (1996): Inertinite; ACARP Report, Australian Coal Research Limited, Issue No2, July 1996.
Fawcett, D.A., and Dawson, R.F. (1990): Unique blending properties of Smoky River coal; American Institute of Mining Engineering, Iron Making Conference Detroit, March 1990, pages 110-108.
Gransden, J. and Price, J.T. (2003): Carbonization Project Report 7 Seam coal in a coke makers blend; Canmet Energy technology Centre, Job No. 3586R
Hutny, W.P., Lee, G.K. and Price, J.T. (1991): Fundamentals of coal combustion during injection into a blast furnace; Prog. Energy Combustion Sciences, Volume 17, pages 373-395.
Karst, R. and White, G.V. (1979): Coal Rank Distribution within the Bluesky-Gething Stratigraphic Horizon of Northeast B.C.; in Geological Fieldwork 1979, B.C. Ministry of Energy, Mines and Petroleum Resources, Paper 80-1, pages 103-107.
Kolijn, C. J. and Khan, M.A. (2003) Medium-volatile coal-The solution for coke oven blends with reduced low-volatile coal content; ACE Steel technology, July 2003, pages 42-49.
Marchioni, D. and Kalkreuth, W. (1992): Vitrinite reflectance and thermal maturity in Cretaceous strata of the Peace
River Arch region west central Alberta and adjacent British Columbia; Geological Survey of Canada, Open file 2576.
Pearson, D. and Grieve, D.A. (1985): Rank variation, coalification pattern and coal quality in the Crowsnest Coalfield, British Columbia; Canadian Institute of Mining and Metallurgy, Bulletin, Volume 78, pages 39-46.
Pearson, D. (1998): Fusible inertinites in Coking Coals; 1998 (Toronto) ICSTI/ Iron making Conference Proceedings, pages 753-755.
Pine Valley Mining Corporation (2001): Willow Creek Project raw coal production study; Amendment to Permit C-153. British Columbia Ministry of Energy and Mines.
Ryan, B.D. (1997): Coal quality variations in the Gething Formation northeast British Columbia; British Columbia Ministry of Energy and Mines Geological Fieldwork 1996:1 pages 373-397.
Schapiro, N., Gray R.J., and Eusner, G.R. (1961): The use of coal petrography in coke making, J.Inst. Fuel. Volume. 37, 1961, pages 234-242.
Stainlay, R. (2003): PCI- current status and prospects for growth; Asia Steel International Conference, Jamshedpur, India - April 2003.
68 British Columbia Ministry of Energy and Mines