A Non Proportional Sharing Power Flow Tracing Based on Bus...
8
© 2011 Roozbeh Morsali, Abdolreza Sheikholeslami.This is a research/review paper, distributed under the terms of the Creative Commons Attribution-Noncommercial 3.0 Unported License http://creativecommons.org/licenses/by-nc/3.0/), permitting all non- commercial use, distribution, and reproduction inany medium, provided the original work is properly cited. Global Journal of Researches in Engireering Volume 11 Issue 2 Version 1.0 February 2011 Type: Double Blind Peer Reviewed International Research Journal Publisher: Global Journals Inc. (USA) A Non Proportional Sharing Power Flow Tracing Based on Bus Power Balance Equations By Roozbeh Morsali, Abdolreza Sheikholeslami University of Mazandaran Abstract- Using proportional sharing assumption in power flow tracing has always been a controversial issue because there is no proof to accept or deny such an assumption. In this paper, we propose tow new method one based on proportional sharing and the other based on bus power equations and network's impedance matrix to solve power flow tracing problems. And we use these solutions to find generation units and consumer loads shares in transmitting power of each line of the network. Both methods are able to handle loop flow and can be applied for both active and reactive power flow tracing. The case study on IEEE 24 bus reliability test system (RTS) shows that the proposed tracing methods are effective and accurate in transmission cost allocation and other tracing problems. Also a comparison between these methods has been made to illustrate the efficiency of proportional sharing assumption. Keywords: power flow tracing, transmission cost allocation, proportional sharing assumption, bus power equations. Classification: GJRE-F FOR Classification: 090699 ANonProportionalSharingPowerFlowTracingBasedonBusPowerBalanceEquations Strictly as per the compliance and regulations of: ISSN: 0975-5861
Transcript of A Non Proportional Sharing Power Flow Tracing Based on Bus...

© 2011 Roozbeh Morsali, Abdolreza Sheikholeslami.This is a research/review paper, distributed under the terms of the Creative Commons Attribution-Noncommercial 3.0 Unported License http://creativecommons.org/licenses/by-nc/3.0/), permitting all non-commercial use, distribution, and reproduction inany medium, provided the original work is properly cited.
Global Journal of Researches in Engireering Volume 11 Issue 2 Version 1.0 February 2011 Type: Double Blind Peer Reviewed International Research Journal Publisher: Global Journals Inc. (USA)
A Non Proportional Sharing Power Flow Tracing Based on Bus Power Balance Equations
By Roozbeh Morsali, Abdolreza Sheikholeslami University of Mazandaran
Abstract- Using proportional sharing assumption in power flow tracing has always been a controversial issue because there is no proof to accept or deny such an assumption. In this paper, we propose tow new method one based on proportional sharing and the other based on bus power equations and network's impedance matrix to solve power flow tracing problems. And we use these solutions to find generation units and consumer loads shares in transmitting power of each line of the network. Both methods are able to handle loop flow and can be applied for both active and reactive power flow tracing. The case study on IEEE 24 bus reliability test system (RTS) shows that the proposed tracing methods are effective and accurate in transmission cost allocation and other tracing problems. Also a comparison between these methods has been made to illustrate the efficiency of proportional sharing assumption.
Keywords: power flow tracing, transmission cost allocation, proportional sharing assumption, bus power equations.
Classification: GJRE-F FOR Classification: 090699
A Non Proportional Sharing Power Flow Tracing Based on Bus Power Balance Equations
Strictly as per the compliance and regulations of:
ISSN: 0975-5861

A Non Proportional Sharing Power Flow Tracing Based on Bus Power Balance Equations
Roozbeh Morsali1, Abdolreza Sheikholeslami2
Abstract-- Using proportional sharing assumption in power flow tracing has always been a controversial issue because there is no proof to accept or deny such an assumption. In this paper, we propose tow new method one based on proportional sharing and the other based on bus power equations and network's impedance matrix to solve power flow tracing problems. And we use these solutions to find generation units and consumer loads shares in transmitting power of each line of the network. Both methods are able to handle loop flow and can be applied for both active and reactive power flow tracing. The case study on IEEE 24 bus reliability test system (RTS) shows that the proposed tracing methods are effective and accurate in transmission cost allocation and other tracing problems. Also a comparison between these methods has been made to illustrate the efficiency of proportional sharing assumption. Keywords- power flow tracing, transmission cost allocation, proportional sharing assumption, bus power equations.
I. NOMENCLATURE Sgi Set of generation units connected to bus i. Sl ini Set of lines which inject power to bus i. Sdi Set of loads consuming power at bus i. Sl out
i Set of lines carrying out power from bus i. PGg Active power generated by generator g. PLl Active power flow of line l. PDd Active power consumed by load d. Nl Number of lines. Ng Number of generation units. Nb Number of network buses. GSD Generation Share in Demands. About1- MSc in electric engineering in university of Mazandaran and has a high interest in power system deregulation and electricity power market. Telephone+989111536914 E-Mail: [email protected] About2- Associate Professor of Faculty of Electrical Engineering, Noushirvani Institute of Technology, University of Mazandaran and his Reasearch Interests are power sysem, Power quality and Power systems. Telephone: +98-111-3239214 E-Mail: [email protected]
II. INTRODUCTION arious changes in the socio-economic structure of power systems lead to the drastic changes in the technical aspects of power system control and
management, after the era of restructuring. Nowadays, power systems are totally market driven in most of countries all around the world. In a vertically integrated system the answer of this question: “what is the share of a certain unit in the power flow of a particular line or in the demand power of a particular load” is of a little importance. This always referred as power flow tracing (PFT) problem, which is one of the challenging issues in restructured power systems and has been received a great attention during these years.
In order to find a practicable method to allocate the cost of transmission between different market participants, different methods have been applied, each with particular criteria or assumptions. Reviewing the literatures, one can deduce that these methods can be classified into two major categories. The methods of the first category do not really follow the power flow from generating units into the loads. Following a market clearing process, these methods always find the share of different participants in cost of a certain transmission line using sensitivity factors. These methods always solve the problem very fast without engaging in time and memory consuming processes like matrix inversion, so they are suitable for bulky power systems. The methods which use different form of generation shift factors (GSF) belong to this category. [1] use GSFs to solve the tracing problem. The main question about the effectiveness of such methods is: “which one is more interesting to us when we are about to solve the tracing problem? The "impact of change in generation of a unit on the flow of a certain line or its share?" Answering this question logically, some new approaches were proposed in literatures [1]-[5] based on GSFs. Another defectiveness of such methods is due to their dependence on slack bus.
The methods of the second category use different tricks and some times, simplifying assumptions to trace the real share of different participants in power flow of different lines. This category contains the topological [6], [7] and the up-stream and down-stream looking algorithms, which all
V
Globa
l Jo
urna
l of R
esea
rche
s in E
nginee
ring
Volum
e XI Issu
e I Version
I
49
Febr
uary
2011
FFF
©2011 Global Journals Inc. (US)

assume proportional contribution factors. The method of up-/down-stream tracing for example was used in [1], [8]. A topological-based method was presented in [9], which uses extended incidence matrix (EIM). Though the authors pointed out that the method does not assume proportional sharing, the method does not consider any difference between different sources of power injection to a bus, when analyzing their shares in bus outflows. This is the main assumption in proportional sharing methods instead of considering physical relations between different in-/outflows.
In [10], the authors used network Zbus and applied the circuit laws to draw a relation between the flow of a line and the injected current from different network buses. Though the method is categorized in first category, application of the circuit law instead of proportional sharing assumption is a very interesting aspect of this work.
In this paper two different methods of power flow tracing are proposed and compared. The first method uses the proportional sharing assumption to draw the relations between power in- and out-flows of network buses from power balance equation of the network buses. The second method uses the idea of power balance equation of the first method, but uses the circuit laws to draw the mentioned relations. Both methods can trace the active and reactive power flows from generating units to loads, even in the case of networks with loop flows. The main advantage of proposed methods is the fact that they both trace the actual share of different participants in power flow of network lines rather than their impact on these flows. Another virtue of the presented methods is the way they handle the loss issues in tracing process. The problem appears since the power which is extracted in receiving end of a line is not the same as injected one due to line losses. [9] For example, added the half value of active and reactive losses of each line to the load value of two end of the line. This is a good approximation, but it slightly changes the results of tracing algorithm.
The rest of the paper is organized as follows. Section III gives an overview of proposed methods as well as the problem formulation for both methods. IEEE reliability test system (RTS) is presented as an illustrative example in section IV and the results of proposed methods are compared and in detail discussed. Conclusions are drawn in section V.
III. PROPOSED NETHODS In this section both methods are explained and
their formulations are presented. In both methods we assume that the generation of different units and the load values are given.
Considering generating units, lines and transformers which are connected to bus i,
one can write a simple equation for active power balance at this bus (1).
Based on the proportional sharing assumption, there is no difference between different terms in left hand of equation (1). This equation combined with proportional sharing assumption leads to (2) for each line:
Where ul, g
is share of unit g in power flow of line l,
When this unit is connected to the sending bus of line l.
Where wl, l’
is the share of line l’
in power flow of line l.
There is out
Nlouti equations of form of (2) for bus i,
so we have Nl
equations each for a certain line of the network. (3)
and (4) are written based on proportional sharing assumption and determine the share of bus i
in
flows in power flow of the lines which transmit active power from this bus to others.
We now can express
the power flow of each line in two different ways. Let us show them in two tables. Table I
shows the share of each unit in power flow of each line (the variables we are about to find in tracing problem). Table II contains the shares which are mentioned earlier in (3) and (4).
Table I Share of Each Unit in Power Flow of Line L
in outi ii i
g l d lg Sg d Sdl Sl l Sl
PG PL PD PL∈ ∈∈ ∈
+ = +∑ ∑ ∑ ∑ (1)
, ,1 1
1Ng Nl
l g l lg l
u w ′′= =
+ =∑ ∑ (2)
,
,
0 other wise
ini i
g outi i
g lil g g Sg li Sl
PGg Sg l Sl
PG PLu∈ ∈
∈ ∈
+=
∑ ∑ (3)
',
,
0 otherwise
ini i
in outli i i
g lil l g Sg li Sl
PLl Sl l Sl
PG PLw
′
∈ ∈
′∈ ∈ +=
∑ ∑ (4)
Gen. 1 Gen. 2 … Gen. Ng
Line 1 x1,1 x1,2 … x1,Ng
Line 2 x2,1 x2,2 … x2,Ng
… … … … …Line Nl xNl,1 xNl,2 … xNl,Ng
A Non Proportional Sharing Power Flow Tracing Based on Bus Power Balance EQ uationsGloba
l Jo
urna
l of R
esea
rche
s in E
nginee
ring
Volum
e XI Issu
e I Version
I
50
Febr
uary
2011
FFF
©2011 Global Journals Inc. (US)
1) Proposed proportional sharing method

Table II Share of Each Unit and Line, Which is Directly Connected to Sending end of Line L in Power Flow of
Line L
Comparing these two tables, an equation can be written for the share of each generating unit in power flow of each line (5) (Ng X Nl equations). In order to understand (5), one can separate two terms of the right hand of this equation. Ul, g is the direct share of unit g in power flow of line l, when they both connected to a same bus. The second term (summation) is the indirect share (of other units), carrying by the other lines to line l.
The main advantage of (5) is that it can handle loop flows in the network.
For a certain unit there are Nl equations in form of (5), while this unit has Nl different shares in the flow of different lines. Let us write these equations for unit g:
(6) is a set of Nl equations with Nl unknown variables. These equations can be solved easily using (7). In this equation Xg
is a Nl X1
vector and gth
column of the matrix X
(Nl
X
Ng).
It should be noticed that only one matrix inversion is necessary, since this matrix does not change for different units. One can also solve (6) with a faster method, since matrix Z is a very sparse matrix. This leads to a lower solution time for a bulky power system. To allocate the share of each load in power flow of each line we can begin from (1) as starting point. Then we should rewrite (2), (3) and (4) in order to calculate share of bus utflows (consisting of loads and lines with outgoing power flow)
in power flow of lines, which inject power into bus i . Let us show these shares in matrix Y
(Nl XNd)
.
Reactive power tracing formulation in this method is exact the same as active power case, so this part of formulation is excluded, but the results of reactive power tracing are also shown in section IV.
2)
Method of non proportional sharing
The only change in this sub-section with respect to the previous one is replacing the proportional sharing assumption with Kirchhoff’s circuit laws. As a result, (3) and (4) are not valid anymore. To calculate the share of inflows of bus i in power flow of the lines which transmit active power from this bus to the others, one can replace all the lines which carry power to this bus, with generating units (pseudo units) of
the same value of active and reactive generation as the regarding lines active and reactive power inflows. Reminding network has a new Zbus (Fig. 1). Let us call it Z
new
bus. It is not necessary to recalculate all the elements of this matrix. There is a simple modification method presented in power system analysis text books, like [11], that can be used to modify Zbus. Besides, all the matrix entries are not necessary in the formulation. Considering all of the units and loads as current sources, voltage of different network buses is given as (8).
Fig1. (a) A Base power system, (b) Equivalent system
The current trough line ij in Fig. 1 can be found using (9).
Gen.1
Gen. 2
Gen. Ng
L.1
L.2
L.Nl
Line 1
u1,1
u1,2
u1,
Ng
w1,1
w1,2
w1,N
g
Line 2
u2,1
u2,2
u2,
Ng
w2,1
w2,2
w2,N
g
… … … … … … …L.
Nl u
Nl,1
uNl,2
uNl,
Ng
wNl,1
wNl,2
wNl,
Ng
, , , ,1
.Nl
l g l g l k k gk
x u w x=
= +∑ (5)
1,
2,
,
1, 1,1,1 1,2 1,
2, 2,2,1 2,2 2,
,1 ,2 ,, ,
1 0 0 0
0 1 0 0
0 0 0 1
g
g
Nl g
g gNl
g gNl
Nl Nl Nl NlNl g Nl g
x
x
x
u xw w w
u xw w w
w w wu x
= +
⋮ ⋮ ⋱ ⋮ ⋮
…
…
⋮ ⋮ ⋱ ⋮⋮ ⋮
…
(6)
1( ) .g Nl Nl gX eye W U−×= − (7)
,1
.
newNb
news s k k
k
V Z I=
= ∑ (8)
Substituting (8) in (9)
( ) / . / 2ij i j ij i ijI V V z V y= − + (9)
, , ,
1
.[ ].
2
new new new newNbi k j k i k ij
ij kijk
Z Z Z yI I
z=
−= +∑ (10)
A Non Proportional Sharing Power Flow Tracing Based on Bus Power Balance EQ uations
Globa
l Jo
urna
l of R
esea
rche
s in E
nginee
ring
Volum
e XI Issu
e I Version
I
51
Febr
uary
2011
FFF
©2011 Global Journals Inc. (US)

In (10) the term which is written between brackets depends
on network parameters and is therefore a constant value
(aij),
so
Let us separate positive and negative effects of loads and
generations on power flow of line ij.
Fig. 1 (b) shows that only units (and pseudo units) which
are connected to bus i (in new network) have a positive
effect on flow of line ij.
In (14) Si+ is total apparent power injected to bus i
by the units which have positive effect on the flow of line ij.
Let us separate the share of each unit (or pseudo unit) and each line in this flow
Now the share of all units and lines which inject power
into bus i in each outflow of this bus, are determined, and
the share of other units which are not connected to this bus
should be found. This problem is solved earlier in subsection
III. A.
Again, the share of each load in power flow of each line
should be calculated too. To do this, one can consider the
network with all the lines which carry power from this bus
to the others, replaced with loads (pseudo loads) of the same
value of active and reactive consumption as the regarding
lines active and reactive power outflows. A new Zbus
should be defined and this time the share of load and
outflows in inflows of bus i can be found. Reactive power
can be traced using this method either. It is sufficient to
replace  operator with Im and rewrite the equations.
As can be seen in this method and method which
discussed earlier in sub-section III.A, two different
equations are written for each line. One of them, which is
used to find the units’ shares in flow of each line, is written
considering the line flow at sending end of the line, while
the other one which is useful to find the loads’ shares,
considers flow of the receiving end of the line. It helps us
divide the cost of line losses equally between units and loads
without any simplifying assumption (like the method which
was used in [18] to model line losses with two load at two
end of the line) while solves the tracing problem precisely
(see section II).
3)
Cost allocation among participants
The power which transfers through a line comes from
different units and finally feeds different loads, so it is
sensible to divide the transmission cost of this line into two equal shares between these units and these loads. The share of unit g and load d in transmission cost of line l can be found using (18) and (19) respectively.
4)
Share of each unit in consumption of each load
Considering the share of each unit in flow of each line
(X),
one can find the share of each generating unit in
consumption of each load (21).
IV.
CASE
STUDY
The case studies are tested on the IEEE Reliability Test System (RTS1) which consists of 24 buses, 26 generators, and 17 loads (Fig. 2). System information has been extracted from [12]-[14]. The load profile corresponds to 6 PM of a Monday of a winter
* * *
1
. . .newNb
ij i k i ij kk
S V I V a I=
= = ∑ (11)
* *
1
( . . )newNb
ij i ij kk
P V a I=
= ℜ∑ (12)
g d g dij ij ij ij ijP P P P P+ + − −= + + + (13)
* * *( . . ) ( . )gij ij i i ij iP a V I a S+ + += ℜ = ℜ (14)
* *( . ) ( . )in
i i
gij ij g ij l
g Sg l Sl
P a S a S+′
∈ ′∈
= ℜ + ℜ∑ ∑ (15)
*
,
( . ),
0 other wise
ij g outi ig
l g ij
a Sg Sg l Sl
u P +
ℜ ∈ ∈=
(16)
'
*
,
( . ),
0 other wise
ij l in outi i ig
l l ij
a Sl Sl l Sl
w P
′+
ℜ′ ∈ ∈=
(17)
,,
*,
2l g l
g l
X CostCost g Sg l Sl= ∀ ∈ ∈ (18)
,,
*,
2l d l
d l
X CostCost d Sd l Sl= ∀ ∈ ∈ (19)
, ,
,
* *in outi i
i
l g l l g ll Sl l Sl
d g id
d Sd
X PL X PL
d SdPD
σ′ ′
′∈ ∈
′∈
−
= ∀ ∈∑ ∑
∑ (20)
, ,,
0
0 otherwise
i g i gi gGSL
σ σ ≥=
(21)
weekday. The capacities of lines 11–13 and 15–24 have been reduced from 500 MVA in [12] to 175 MVA. A one-hour time horizon is considered. The results of unit
A Non Proportional Sharing Power Flow Tracing Based on Bus Power Balance EQ uationsGloba
l Jo
urna
l of R
esea
rche
s in E
nginee
ring
Volum
e XI Issu
e I Version
I
52
Febr
uary
2011
FFF
©2011 Global Journals Inc. (US)

commitment algorithm considering DC and AC load flows are shown in Table III. Proposing a good method for transmission pricing is beyond the scope of this paper. Besides all the results cannot be included here, so for sake of comparison, a fixed cost of 10 $ is considered for each MW flow of each line in each hour and the results of transmission cost allocation are presented in different examples. Reactive power flow tracing results are excluded due to simplicity in concluding from results.
Fig. 2.IEEE Reliability Test System (RTS)
Table III Results of AC and DC
Unit Commitment
1) Peak load, first method The method presented in sub-section III.A is
used here to find the share of all of the units and loads in active power flow of each line. Table IV Share of Each Unit in Total Transmission Cost
and Transmission Prices for Each Unit, First Method
Table V share of each load in total transmission cost and transmission prices for each load, first method
BusNo
Unit type
Statepg (MW)
DCPg (MW)
ACQg (MW)
AC
1 U20 On 0.00 0.00 0.00 1 U20 On 19.38 16.97 4.10 1 U76 On 76.00 76.00 -3.14 1 U76 On 76.00 76.00 -3.14 2 U20 Off 18.93 16.78 10.00 2 U20 Off 0.00 0.00 0.00 2 U76 On 76.00 76.00 30.00 2 U76 On 76.00 76.00 30.00 7 U100 On 100.00 99.08 18.68 7 U100 On 100.00 99.08 18.68 7 U100 On 100.00 99.07 18.68 13 U197 On 127.52 139.75 0.00 13 U197 On 127.52 139.75 0.00 13 U197 On 127.52 139.75 0.00 15 U12 On 11.03 12.00 1.11 15 U12 On 11.03 12.00 1.11 15 U12 On 11.03 12.00 1.11 15 U12 On 11.03 12.00 1.11 15 U12 On 11.03 12.00 1.11 15 U155 On 155.00 155.00 -30.00
16 U155 On 155.00 155.00 80.00 18 U400 On 400.00 400.00 178.98 21 U400 On 400.00 400.00 -17.26 23 U155 On 155.00 155.00 63.88 23 U155 On 155.00 155.00 63.88 23 U350 On 350.00 350.00 87.92
,
BusNo Unit type
US ($)DC
US ($)AC
UTP($/MW-h) DC
UTP ($/MW-h)
AC
1 U20 0.00 0.00 - - 1 U20 37.33 30.74 1.92 1.81 1 U76 146.34 137.64 1.93 1.81 1 U76 146.34 137.64 1.93 1.81 2 U20 42.70 35.84 2.25 2.14 2 U20 0.00 0.00 - - 2 U76 171.41 162.32 2.26 2.14 2 U76 171.41 162.32 2.26 2.14 7 U100 314.87 302.69 3.15 3.06 7 U100 314.87 302.69 3.15 3.06 7 U100 314.87 302.68 3.15 3.06 13 U197 749.77 848.68 5.88 6.07 13 U197 749.77 848.69 5.88 6.07 13 U197 749.77 848.68 5.88 6.07 15 U12 41.47 45.24 3.76 3.77 15 U12 41.47 45.24 3.76 3.77 15 U12 41.47 45.24 3.76 3.77 15 U12 41.47 45.24 3.76 3.77 15 U12 41.47 45.24 3.76 3.77 15 U155 582.89 584.34 3.76 3.77 16 U155 763.37 897.15 4.92 5.79 18 U400 1857.6 1976.37 4.64 4.94 21 U400 3783.8 3825.80 9.46 9.56 23 U155 1500.3 1541.02 9.68 9.94 23 U155 150.33 1541.02 9.68 9.94 23 U350 3387.8 3479.72 9.68 9.94
Total - 18192 18192 - -
,
BusNo
Bus demand
LS ($)DC
LS ($)AC
LTP($/MW-h)
DC
LTP ($/MW-h)
AC
1 108.00 0.00 0.00 - - 2 97.01 15.86 1.69 0.16 0.02 3 180.01 2312.8 2277.7 12.85 12.65 4 74.01 835.56 925.99 11.29 12.51 5 71.01 544.79 634.81 7.67 8.94 6 136.01 1746.4 1870.3 12.84 13.75 7 125.01 0.00 0.00 - - 8 171.01 928.15 1007.8 5.43 5.89 9 175.01 2038.4 2139.3 11.65 12.22 10 195.01 2274.2 2391.5 11.66 12.26 13 265.01 391.88 336.03 1.48 1.27 14 194.01 2133.3 2271.4 11.00 11.71 15 317.02 929.74 921.73 2.93 2.91 16 100.01 599.67 655.05 6.00 6.55 18 333.01 287.32 293.87 0.86 0.88 19 181.01 1814.8 1822.1 10.03 10.07 20 128.01 640.00 642.61 5.00 5.02
Total 2850 18192 18192 - -
A Non Proportional Sharing Power Flow Tracing Based on Bus Power Balance EQ uations
Globa
l Jo
urna
l of R
esea
rche
s in E
nginee
ring
Volum
e XI Issu
e I Version
I
53
Febr
uary
2011
FFF
©2011 Global Journals Inc. (US)
The results of active power transmission cost allocation
are presented in Tables IV and V for generating units and
loads respectively.
As can be seen in Table III, the results of
DC and AC optimal power flow sub-routines differ in many
respects, so to make the comparison easier, a transmission
price is defined, for each unit/load as the ratio of its share in
$ to its generation/consumption in MW-h. In order to
validate the results, the problem is solved using method of
[9] for this case (but the results are not included here) and
the results were completely same for DC load flow. In the
case of using AC load flow, there are some little differences
in the results due to different ways of dealing with the loss
issue.
There are some interesting points in the results of these
two tables. Transmission cost is split into two same shares
between units and loads. The share of load at bus 1 is zero
even though the consumption is not zero, because there is no
line connected to this bus which delivers active power.
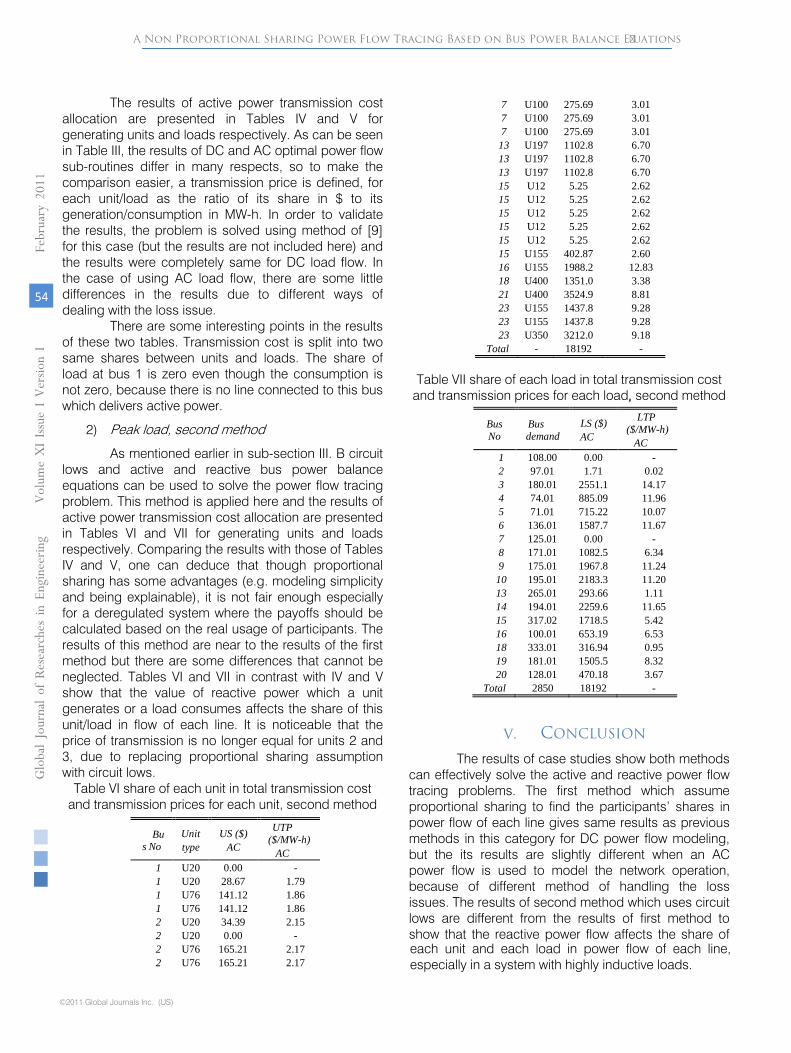
2)
Peak load, second method
As mentioned earlier in sub-section III. B circuit lows and active and reactive bus power balance equations can be used to solve the power flow tracing problem. This method is applied here and the results of active power transmission cost allocation are presented in Tables VI and VII for
generating units and loads respectively. Comparing the results with those of Tables IV and V, one can deduce that though proportional sharing has some advantages (e.g. modeling simplicity and being explainable), it is not fair enough especially for a deregulated system where the payoffs should be calculated based on the real usage of participants. The results of this method are near to the results of the first method but there are some differences that cannot be neglected. Tables VI and VII in contrast with IV and V show that the value of reactive power which a unit generates or a
load consumes affects the share of this
unit/load in flow of each line. It is noticeable that the price of transmission is no longer equal for units 2 and 3, due to replacing proportional sharing assumption with circuit lows.
Table VI share of each unit in total transmission cost and transmission prices for each unit, second method
Table VII share of each load in total transmission cost and transmission prices for each load, second method
V.
CONCLUSION
The results of case studies show both methods can effectively solve the active and reactive power flow tracing problems. The first method which assume proportional sharing to find the participants’ shares in power flow of each line gives same results as previous methods in this category for DC power flow modeling, but the its results are slightly different when an AC power flow is used to model the network operation, because of different method of handling the loss issues. The results of second method which uses circuit lows are different from the results of first method to show that the reactive power flow affects the share of
BusNo
Unit type
US ($)AC
UTP ($/MW-h)
AC1 U20 0.00 - 1 U20 28.67 1.79 1 U76 141.12 1.86 1 U76 141.12 1.86 2 U20 34.39 2.15 2 U20 0.00 - 2 U76 165.21 2.17 2 U76 165.21 2.17
7 U100 275.69 3.01 7 U100 275.69 3.01 7 U100 275.69 3.01 13 U197 1102.8 6.70 13 U197 1102.8 6.70 13 U197 1102.8 6.70 15 U12 5.25 2.62 15 U12 5.25 2.62 15 U12 5.25 2.62 15 U12 5.25 2.62 15 U12 5.25 2.62 15 U155 402.87 2.60 16 U155 1988.2 12.83 18 U400 1351.0 3.38 21 U400 3524.9 8.81 23 U155 1437.8 9.28 23 U155 1437.8 9.28 23 U350 3212.0 9.18
Total - 18192 -
,
BusNo
Bus demand
LS ($)AC
LTP ($/MW-h)
AC1 108.00 0.00 - 2 97.01 1.71 0.02 3 180.01 2551.1 14.17 4 74.01 885.09 11.96 5 71.01 715.22 10.07 6 136.01 1587.7 11.67 7 125.01 0.00 - 8 171.01 1082.5 6.34 9 175.01 1967.8 11.24 10 195.01 2183.3 11.20 13 265.01 293.66 1.11 14 194.01 2259.6 11.65 15 317.02 1718.5 5.42 16 100.01 653.19 6.53 18 333.01 316.94 0.95 19 181.01 1505.5 8.32 20 128.01 470.18 3.67
Total 2850 18192 -
each unit and each load in power flow of each line, especially in a system with highly inductive loads.
A Non Proportional Sharing Power Flow Tracing Based on Bus Power Balance EQ uationsGloba
l Jo
urna
l of R
esea
rche
s in E
nginee
ring
Volum
e XI Issu
e I Version
I
54
Febr
uary
2011
FFF
©2011 Global Journals Inc. (US)

References Références Referencias
1.
J. Bialek, Topological generation and load distribution factors for supplement charge allocation in transmission open access, IEEE Trans. on Power System, vol. 12, no. 3, Aug. 1997.
2.
G. Strbac, D. Kirschen, and S. Ahmed, Allocating transmission system usage on the basis of traceable contribution of generators and loads to flows, IEEE Trans. on Power Systems, vol. 13, no. 2, May 1998.
3.
D. Kirschen, R. Allen, and G. Strbac, Contributions individual generators to loads and flows, IEEE Trans. Power Syst., vol. 12, no. 1, Feb. 1997, pp. 52–60.
4.
Gener. Transm, Di.rtrib, Tracing the flow of electricity, IEE Proceedings on Generation, Transmission and Distribution, vol. 143, no. 4, July 1996.
5.
D. Kirschen, R. Allan, and G. Strbac, Contributions of individual generators to loads and flows, IEEE Trans. on Power Systems, vol. 12, no. 1, Feb. 1997.
6.
J. Bialek, Allocation of transmission supplementary charge to real and reactive loads, IEEE Trans. on Power System, vol. 13, no. 3, Aug. 1998.
7.
G. Strbac, D. Kirschen, and S. Ahmed, Allocating transmission system usage on the basis of traceable contributions of generators and loads to flows, IEEE Trans. Power Syst., vol. 13, no. 2, May 1998, pp. 527–534.
8.
J. Bialek, Identification of source-sink connections in transmission networks, in Proc. IEE 4th Conf. Power System Control Management, London, U.K., Apr. 16–18, 1996, pp. 200–204.
9.
K. Xie, J. Zhou,W. Li, Analytical model and algorithm for tracing active power flow based on extended incidence matrix, Electric Power Systems Research 79 (2009) pp. 399–405.
10.
J. Conejo, J. Contreras, D. A. Lima, and A. Padilha-Feltrin, Zbus Transmission network cost allocation, IEEE Transaction on Power System, vol. 22, no. 1, Feb. 2007, pp. 342-349.
11.
Emadi, M. Ehsani, J. M. Miller, Vehicular Electric Power
Systems (Marcel Dekker, Inc., 2004).
12.
Reliability Test System Task Force, The IEEE reliability test system 1996, IEEE Trans. Power Syst., vol. 14, no. 3, Aug. 1999, pp. 1010–
1020.
13.
IEEE Committee Report, IEEE Reliability Test System, IEEE Transactions on Power
Apparatus and Systems, vol. PAS-98, no. 6, Nov/Dec 1979, pp. 2047-2054.
14. J.Wang, N. Encinas Redondo, and F. D. Galiana, Demand-side reserve offers in joint energy/reserve electricity markets, IEEE Trans. Power Syst., vol. 18, no. 4, Nov. 2003, pp. 1300–1306.
A Non Proportional Sharing Power Flow Tracing Based on Bus Power Balance EQ uations
Globa
l Jo
urna
l of R
esea
rche
s in E
nginee
ring
Volum
e XI Issu
e I Version
I
55
Febr
uary
2011
FFF
©2011 Global Journals Inc. (US)


![Untitled-2 [globaljournals.org] · Title: Untitled-2 Author: Manoj Created Date: 3/22/2017 6:11:45 PM](https://static.fdocuments.us/doc/165x107/5ecf473ff15f187cb06138a2/untitled-2-title-untitled-2-author-manoj-created-date-3222017-61145-pm.jpg)


![Untitled-2 [globaljournals.org] · Title: Untitled-2 Author: Manoj Created Date: 3/22/2017 6:21:56 PM](https://static.fdocuments.us/doc/165x107/5aecdd3b7f8b9a90318ed6ab/untitled-2-untitled-2-author-manoj-created-date-3222017-62156-pm.jpg)