
A NON-INVASIVE METHODOLOGY FOR MODAL … A NON-INVASIVE METHODOLOGY FOR MODAL CHARAC-TERISATION OF...
8
1 A NON-INVASIVE METHODOLOGY FOR MODAL CHARAC- TERISATION OF AN AIRCRAFT CABIN USING HIGH SPEED 3D DIGITAL IMAGE CORRELATION Ángel Molina-Viedma, Elías López-Alba, Luis Felipe-Sesé and Francisco Díaz Universidad de Jaén, Departamento de Ingeniería Mecánica y Minera, Campus Las Lagunillas, Jaén, Spain email: [email protected] Javier Rodríguez-Ahlquist and Manuel Iglesias-Vallejo Airbus Defence and Space, Paseo John Lennon s/n, Getafe (Madrid), Spain Different noise sources in real aircraft structures, such as those related to powerplant and aerody- namic turbulence, can be detrimental for the comfort and the occupational performance of crew- members and passengers. A characterisation of relevant cabin structural resonances can be of relevant interest for adequate cabin noise control. Traditional measurement techniques employed in the aircraft industry for structural dynamic characterization, relying on accelerometers, can be invasive and the test preparation is often time consuming. In this paper, a novel methodology for experimental modal characterisation of an aircraft cabin is presented. Measurements on critical parts of a full scale cabin demonstrator were conducted using High Speed 3D Digital Image Cor- relation (HS 3D-DIC) when the structure was excited using an electrodynamic shaker. 3D-DIC provides full-field displacements measurements during dynamic events using two synchronized high speed cameras. The measurements are contactless, thus ensuring that the structural response is unperturbed by instrumentation mass. Spectral analysis of measured displacement time signals made possible to identify natural frequencies and full-field Operational Deflection Shapes (ODS). In this way, the proposed full-field methodology allowed characterizing relevant dynamic re- sponse patterns of different parts of the structure, complementing the capabilities provided by accelerometers. Keywords: aircraft cabin, Operational Deflection Shapes, natural frequencies, full-field analy- sis, DIC 1. Introduction Along last decades, many efforts have been made in the aerospace industry to control and reduce the noise level inside aircraft structures. This involves design tasks in active control and vibration absorbers [1], [2], and also in the prediction by means of numerical models [3]. Experimental testing allows feedback to improve design and numerical models. One of the most interesting tests is exper- imental modal analysis for identification of modal parameters [4]. This type of characterisation is commonly carried out using accelerometers. However, error is present in the measurement as a con- sequence of their invasive nature. Furthermore, a compromise is always to be made between the time and cost required for instrumentation and the resulting spatial resolution. New methodologies in experimental modal analysis have been recently developed employing 3D Digital Image Correlation and High Speed cameras (HS 3D-DIC). DIC is a non-invasive full-field optical technique for displacement and strain measurement [5]. With High Speed cameras, HS 3D- DIC has been studied for Operational Deflection Shapes (ODSs) in fixed sine tests [6], [7]. Recent research developed modal identification based on Transfer Functions using HS 3D-DIC [8].
Transcript of A NON-INVASIVE METHODOLOGY FOR MODAL … A NON-INVASIVE METHODOLOGY FOR MODAL CHARAC-TERISATION OF...
1
A NON-INVASIVE METHODOLOGY FOR MODAL CHARAC-TERISATION OF AN AIRCRAFT CABIN USING HIGH SPEED 3D DIGITAL IMAGE CORRELATION
Ángel Molina-Viedma, Elías López-Alba, Luis Felipe-Sesé and Francisco Díaz
Universidad de Jaén, Departamento de Ingeniería Mecánica y Minera, Campus Las Lagunillas, Jaén, Spain
email: [email protected]
Javier Rodríguez-Ahlquist and Manuel Iglesias-Vallejo
Airbus Defence and Space, Paseo John Lennon s/n, Getafe (Madrid), Spain
Different noise sources in real aircraft structures, such as those related to powerplant and aerody-
namic turbulence, can be detrimental for the comfort and the occupational performance of crew-
members and passengers. A characterisation of relevant cabin structural resonances can be of
relevant interest for adequate cabin noise control. Traditional measurement techniques employed
in the aircraft industry for structural dynamic characterization, relying on accelerometers, can be
invasive and the test preparation is often time consuming. In this paper, a novel methodology for
experimental modal characterisation of an aircraft cabin is presented. Measurements on critical
parts of a full scale cabin demonstrator were conducted using High Speed 3D Digital Image Cor-
relation (HS 3D-DIC) when the structure was excited using an electrodynamic shaker. 3D-DIC
provides full-field displacements measurements during dynamic events using two synchronized
high speed cameras. The measurements are contactless, thus ensuring that the structural response
is unperturbed by instrumentation mass. Spectral analysis of measured displacement time signals
made possible to identify natural frequencies and full-field Operational Deflection Shapes (ODS).
In this way, the proposed full-field methodology allowed characterizing relevant dynamic re-
sponse patterns of different parts of the structure, complementing the capabilities provided by
accelerometers.
Keywords: aircraft cabin, Operational Deflection Shapes, natural frequencies, full-field analy-
sis, DIC
1. Introduction
Along last decades, many efforts have been made in the aerospace industry to control and reduce
the noise level inside aircraft structures. This involves design tasks in active control and vibration
absorbers [1], [2], and also in the prediction by means of numerical models [3]. Experimental testing
allows feedback to improve design and numerical models. One of the most interesting tests is exper-
imental modal analysis for identification of modal parameters [4]. This type of characterisation is
commonly carried out using accelerometers. However, error is present in the measurement as a con-
sequence of their invasive nature. Furthermore, a compromise is always to be made between the time
and cost required for instrumentation and the resulting spatial resolution.
New methodologies in experimental modal analysis have been recently developed employing 3D
Digital Image Correlation and High Speed cameras (HS 3D-DIC). DIC is a non-invasive full-field
optical technique for displacement and strain measurement [5]. With High Speed cameras, HS 3D-
DIC has been studied for Operational Deflection Shapes (ODSs) in fixed sine tests [6], [7]. Recent
research developed modal identification based on Transfer Functions using HS 3D-DIC [8].
ICSV24, London, 23-27 July 2017
2 ICSV24, London, 23-27 July 2017
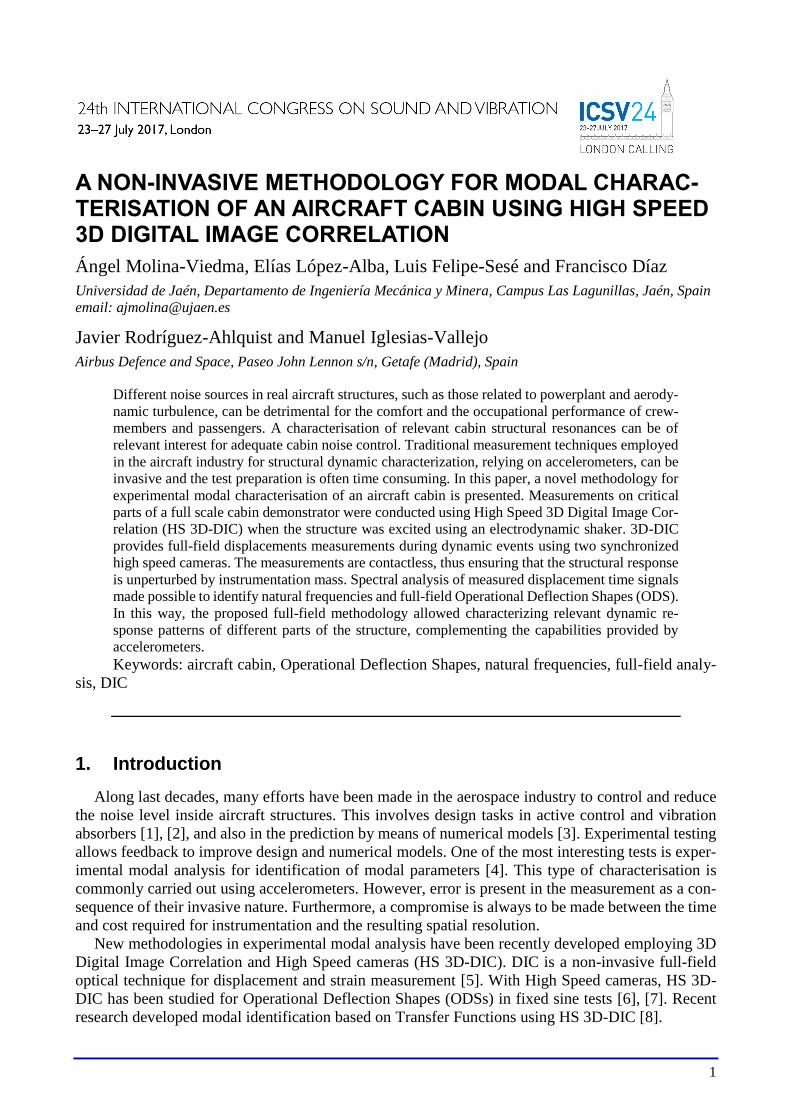
Thus, hereafter is proposed a new methodology using HS 3D-DIC for aircraft cabin modal param-
eter identification. This technology was used for dynamic characterization of a front fuselage full
scale demonstrator (Figure 1) developed by Airbus Defence and Space in the frame of the Clean Sky
/ Green Regional Aircraft Program, with partial funding by the European Union. Particular focus was
put on the passenger window area, as it is considered relevant in the transmission of noise to the
cabin. Impact hammer tests were initially performed for natural frequency identification using accel-
erometers. According to these natural frequencies, fixed-sine tests were employed for full-field ODSs
determination using HS 3D-DIC. Random excitation was also employed to obtain the transfer func-
tion between the excitation and the window response in a full-field approach. From transfer functions,
natural frequencies and full-field ODSs were identified. Finally, a comparison between all the meas-
ured results was performed. All tests were performed on-site in the facilities of Airbus Defence and
Spain in Getafe (Spain).
Figure 1: Clean Sky / Green Regional Aircraft MT2 cockpit demonstrator and test rig developed by Airbus
Defence and Space.
2. Digital Image Correlation
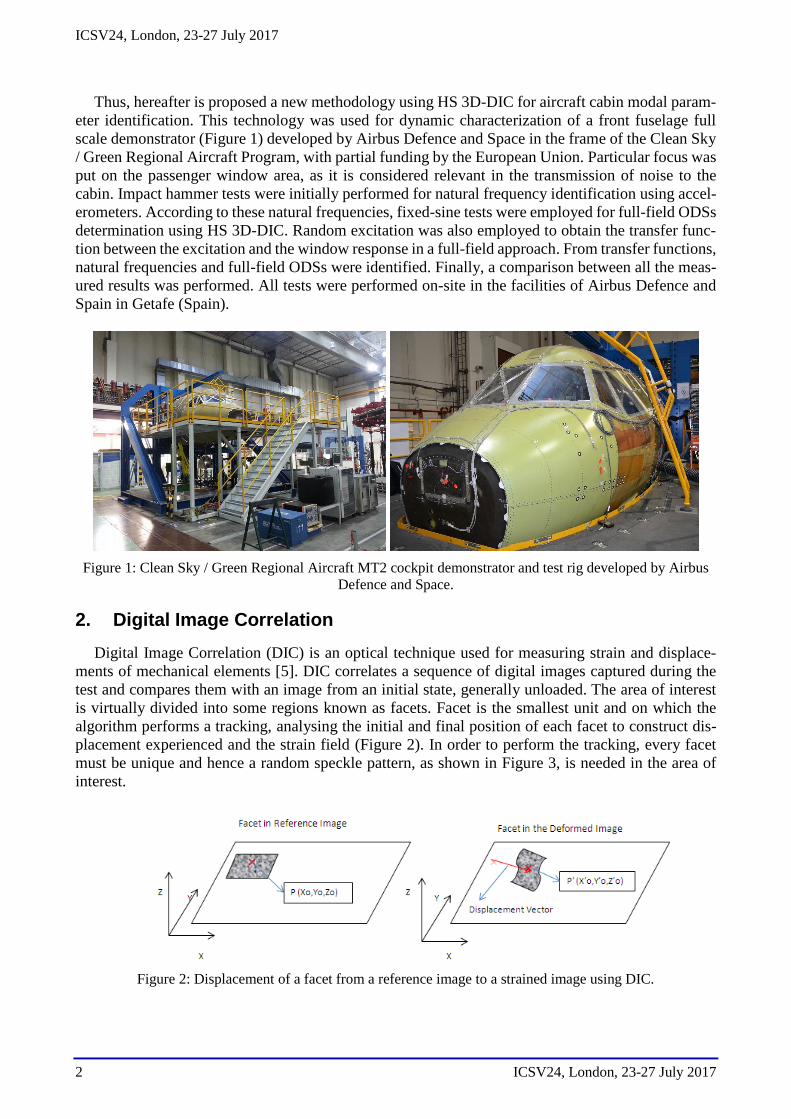
Digital Image Correlation (DIC) is an optical technique used for measuring strain and displace-
ments of mechanical elements [5]. DIC correlates a sequence of digital images captured during the
test and compares them with an image from an initial state, generally unloaded. The area of interest
is virtually divided into some regions known as facets. Facet is the smallest unit and on which the
algorithm performs a tracking, analysing the initial and final position of each facet to construct dis-
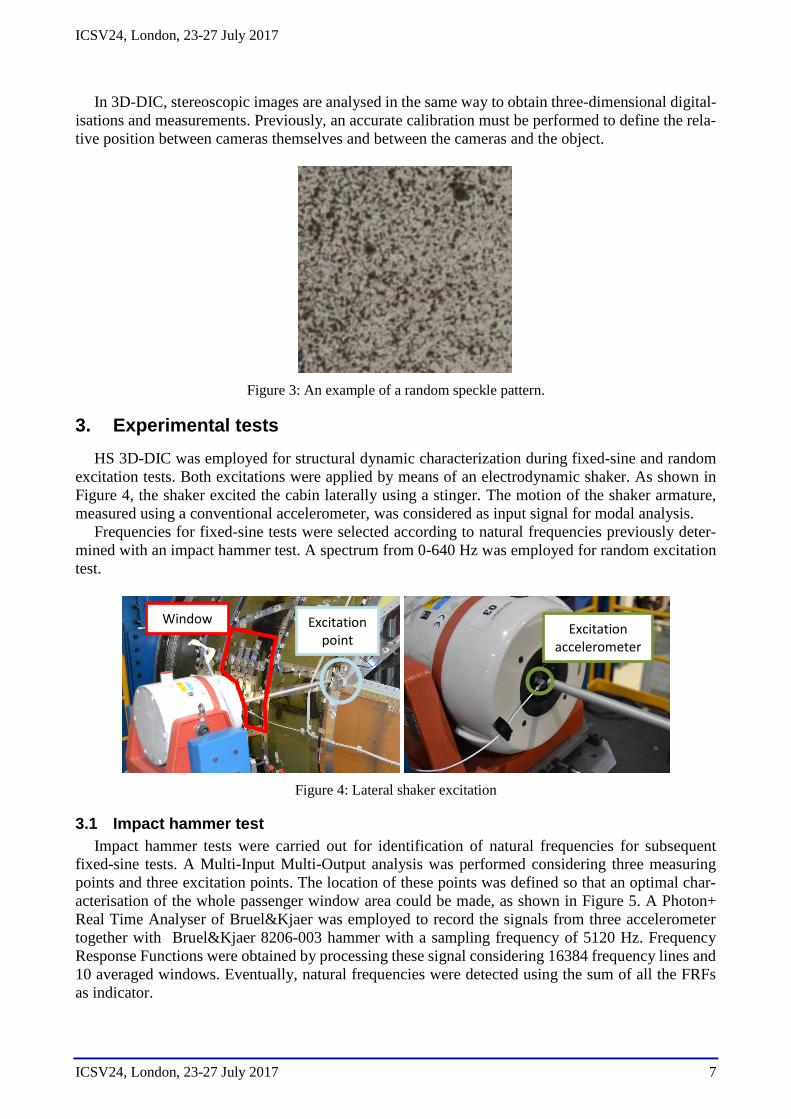
placement experienced and the strain field (Figure 2). In order to perform the tracking, every facet
must be unique and hence a random speckle pattern, as shown in Figure 3, is needed in the area of
interest.
Figure 2: Displacement of a facet from a reference image to a strained image using DIC.
ICSV24, London, 23-27 July 2017
ICSV24, London, 23-27 July 2017 7
In 3D-DIC, stereoscopic images are analysed in the same way to obtain three-dimensional digital-
isations and measurements. Previously, an accurate calibration must be performed to define the rela-
tive position between cameras themselves and between the cameras and the object.
Figure 3: An example of a random speckle pattern.
3. Experimental tests
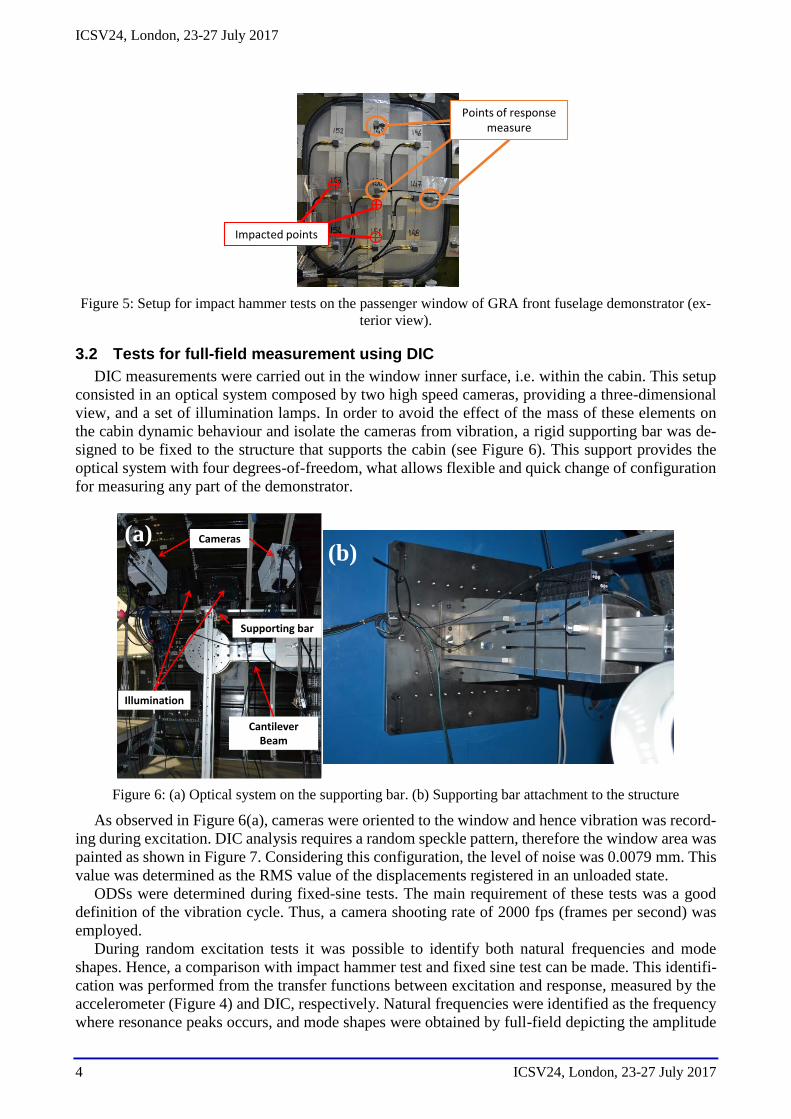
HS 3D-DIC was employed for structural dynamic characterization during fixed-sine and random
excitation tests. Both excitations were applied by means of an electrodynamic shaker. As shown in
Figure 4, the shaker excited the cabin laterally using a stinger. The motion of the shaker armature,
measured using a conventional accelerometer, was considered as input signal for modal analysis.
Frequencies for fixed-sine tests were selected according to natural frequencies previously deter-
mined with an impact hammer test. A spectrum from 0-640 Hz was employed for random excitation
test.
Figure 4: Lateral shaker excitation
3.1 Impact hammer test
Impact hammer tests were carried out for identification of natural frequencies for subsequent
fixed-sine tests. A Multi-Input Multi-Output analysis was performed considering three measuring
points and three excitation points. The location of these points was defined so that an optimal char-
acterisation of the whole passenger window area could be made, as shown in Figure 5. A Photon+
Real Time Analyser of Bruel&Kjaer was employed to record the signals from three accelerometer
together with Bruel&Kjaer 8206-003 hammer with a sampling frequency of 5120 Hz. Frequency
Response Functions were obtained by processing these signal considering 16384 frequency lines and
10 averaged windows. Eventually, natural frequencies were detected using the sum of all the FRFs
as indicator.
Excitation point
Window Excitation
accelerometer
ICSV24, London, 23-27 July 2017
4 ICSV24, London, 23-27 July 2017
Figure 5: Setup for impact hammer tests on the passenger window of GRA front fuselage demonstrator (ex-
terior view).
3.2 Tests for full-field measurement using DIC
DIC measurements were carried out in the window inner surface, i.e. within the cabin. This setup
consisted in an optical system composed by two high speed cameras, providing a three-dimensional
view, and a set of illumination lamps. In order to avoid the effect of the mass of these elements on
the cabin dynamic behaviour and isolate the cameras from vibration, a rigid supporting bar was de-
signed to be fixed to the structure that supports the cabin (see Figure 6). This support provides the
optical system with four degrees-of-freedom, what allows flexible and quick change of configuration
for measuring any part of the demonstrator.
Figure 6: (a) Optical system on the supporting bar. (b) Supporting bar attachment to the structure
As observed in Figure 6(a), cameras were oriented to the window and hence vibration was record-
ing during excitation. DIC analysis requires a random speckle pattern, therefore the window area was
painted as shown in Figure 7. Considering this configuration, the level of noise was 0.0079 mm. This
value was determined as the RMS value of the displacements registered in an unloaded state.
ODSs were determined during fixed-sine tests. The main requirement of these tests was a good
definition of the vibration cycle. Thus, a camera shooting rate of 2000 fps (frames per second) was
employed.
During random excitation tests it was possible to identify both natural frequencies and mode
shapes. Hence, a comparison with impact hammer test and fixed sine test can be made. This identifi-
cation was performed from the transfer functions between excitation and response, measured by the
accelerometer (Figure 4) and DIC, respectively. Natural frequencies were identified as the frequency
where resonance peaks occurs, and mode shapes were obtained by full-field depicting the amplitude
Impacted points
Points of response measure
Cameras
Illumination
Supporting bar
Cantilever Beam
(a) (b)
ICSV24, London, 23-27 July 2017
ICSV24, London, 23-27 July 2017 7
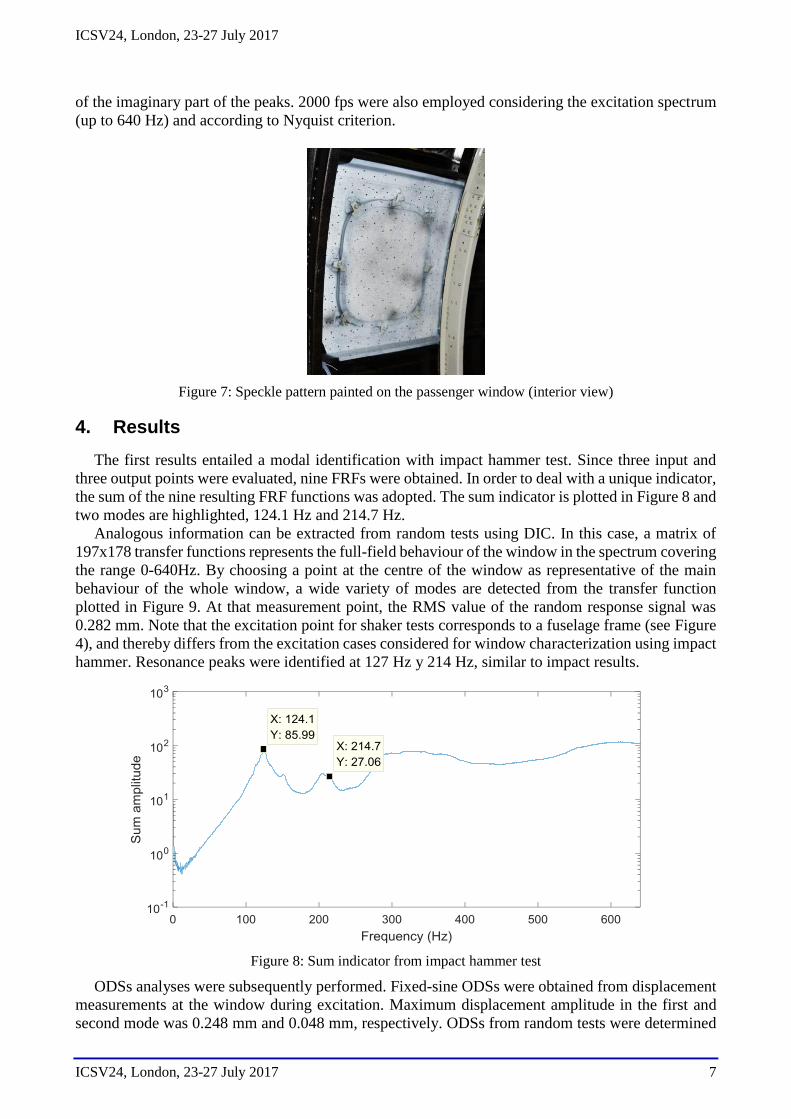
of the imaginary part of the peaks. 2000 fps were also employed considering the excitation spectrum
(up to 640 Hz) and according to Nyquist criterion.
Figure 7: Speckle pattern painted on the passenger window (interior view)
4. Results
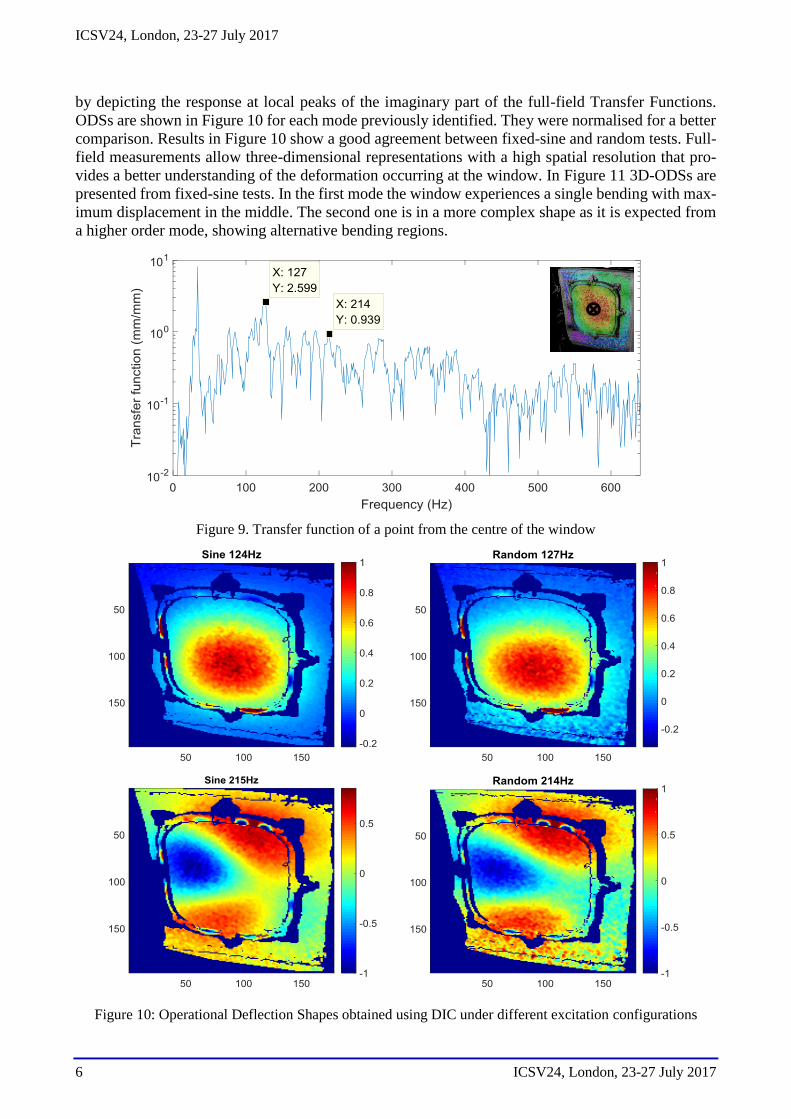
The first results entailed a modal identification with impact hammer test. Since three input and
three output points were evaluated, nine FRFs were obtained. In order to deal with a unique indicator,
the sum of the nine resulting FRF functions was adopted. The sum indicator is plotted in Figure 8 and
two modes are highlighted, 124.1 Hz and 214.7 Hz.
Analogous information can be extracted from random tests using DIC. In this case, a matrix of
197x178 transfer functions represents the full-field behaviour of the window in the spectrum covering
the range 0-640Hz. By choosing a point at the centre of the window as representative of the main
behaviour of the whole window, a wide variety of modes are detected from the transfer function
plotted in Figure 9. At that measurement point, the RMS value of the random response signal was
0.282 mm. Note that the excitation point for shaker tests corresponds to a fuselage frame (see Figure
4), and thereby differs from the excitation cases considered for window characterization using impact
hammer. Resonance peaks were identified at 127 Hz y 214 Hz, similar to impact results.
Figure 8: Sum indicator from impact hammer test
ODSs analyses were subsequently performed. Fixed-sine ODSs were obtained from displacement
measurements at the window during excitation. Maximum displacement amplitude in the first and
second mode was 0.248 mm and 0.048 mm, respectively. ODSs from random tests were determined
ICSV24, London, 23-27 July 2017
6 ICSV24, London, 23-27 July 2017
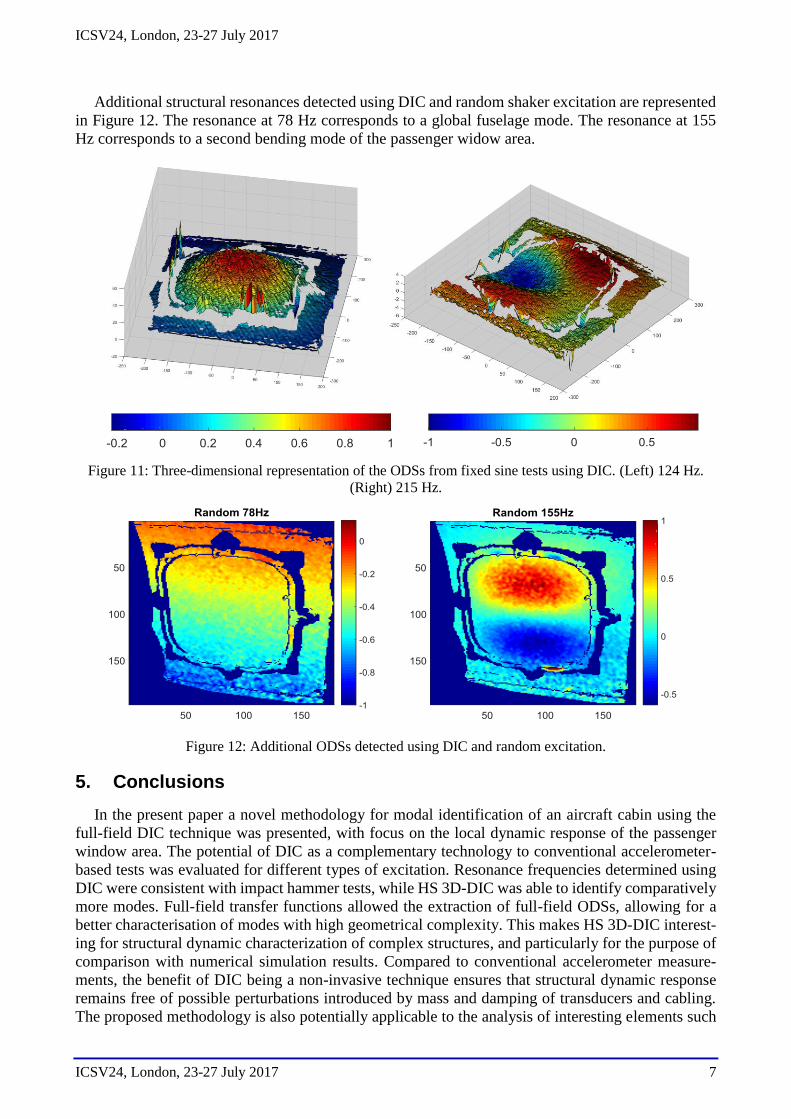
by depicting the response at local peaks of the imaginary part of the full-field Transfer Functions.
ODSs are shown in Figure 10 for each mode previously identified. They were normalised for a better
comparison. Results in Figure 10 show a good agreement between fixed-sine and random tests. Full-
field measurements allow three-dimensional representations with a high spatial resolution that pro-
vides a better understanding of the deformation occurring at the window. In Figure 11 3D-ODSs are
presented from fixed-sine tests. In the first mode the window experiences a single bending with max-
imum displacement in the middle. The second one is in a more complex shape as it is expected from
a higher order mode, showing alternative bending regions.
Figure 9. Transfer function of a point from the centre of the window
Figure 10: Operational Deflection Shapes obtained using DIC under different excitation configurations
ICSV24, London, 23-27 July 2017
ICSV24, London, 23-27 July 2017 7
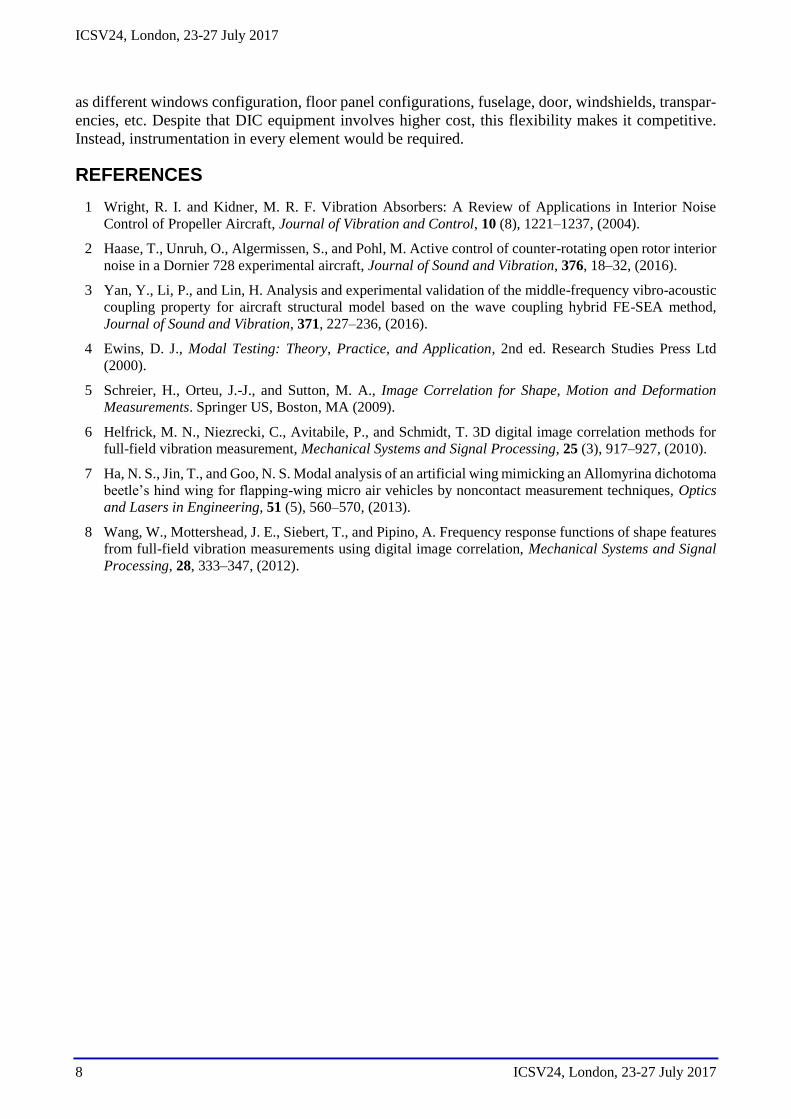
Additional structural resonances detected using DIC and random shaker excitation are represented
in Figure 12. The resonance at 78 Hz corresponds to a global fuselage mode. The resonance at 155
Hz corresponds to a second bending mode of the passenger widow area.
Figure 11: Three-dimensional representation of the ODSs from fixed sine tests using DIC. (Left) 124 Hz.
(Right) 215 Hz.
Figure 12: Additional ODSs detected using DIC and random excitation.
5. Conclusions
In the present paper a novel methodology for modal identification of an aircraft cabin using the
full-field DIC technique was presented, with focus on the local dynamic response of the passenger
window area. The potential of DIC as a complementary technology to conventional accelerometer-
based tests was evaluated for different types of excitation. Resonance frequencies determined using
DIC were consistent with impact hammer tests, while HS 3D-DIC was able to identify comparatively
more modes. Full-field transfer functions allowed the extraction of full-field ODSs, allowing for a
better characterisation of modes with high geometrical complexity. This makes HS 3D-DIC interest-
ing for structural dynamic characterization of complex structures, and particularly for the purpose of
comparison with numerical simulation results. Compared to conventional accelerometer measure-
ments, the benefit of DIC being a non-invasive technique ensures that structural dynamic response
remains free of possible perturbations introduced by mass and damping of transducers and cabling.
The proposed methodology is also potentially applicable to the analysis of interesting elements such
ICSV24, London, 23-27 July 2017
8 ICSV24, London, 23-27 July 2017
as different windows configuration, floor panel configurations, fuselage, door, windshields, transpar-
encies, etc. Despite that DIC equipment involves higher cost, this flexibility makes it competitive.
Instead, instrumentation in every element would be required.
REFERENCES
1 Wright, R. I. and Kidner, M. R. F. Vibration Absorbers: A Review of Applications in Interior Noise
Control of Propeller Aircraft, Journal of Vibration and Control, 10 (8), 1221–1237, (2004).
2 Haase, T., Unruh, O., Algermissen, S., and Pohl, M. Active control of counter-rotating open rotor interior
noise in a Dornier 728 experimental aircraft, Journal of Sound and Vibration, 376, 18–32, (2016).
3 Yan, Y., Li, P., and Lin, H. Analysis and experimental validation of the middle-frequency vibro-acoustic
coupling property for aircraft structural model based on the wave coupling hybrid FE-SEA method,
Journal of Sound and Vibration, 371, 227–236, (2016).
4 Ewins, D. J., Modal Testing: Theory, Practice, and Application, 2nd ed. Research Studies Press Ltd
(2000).
5 Schreier, H., Orteu, J.-J., and Sutton, M. A., Image Correlation for Shape, Motion and Deformation
Measurements. Springer US, Boston, MA (2009).
6 Helfrick, M. N., Niezrecki, C., Avitabile, P., and Schmidt, T. 3D digital image correlation methods for
full-field vibration measurement, Mechanical Systems and Signal Processing, 25 (3), 917–927, (2010).
7 Ha, N. S., Jin, T., and Goo, N. S. Modal analysis of an artificial wing mimicking an Allomyrina dichotoma
beetle’s hind wing for flapping-wing micro air vehicles by noncontact measurement techniques, Optics
and Lasers in Engineering, 51 (5), 560–570, (2013).
8 Wang, W., Mottershead, J. E., Siebert, T., and Pipino, A. Frequency response functions of shape features
from full-field vibration measurements using digital image correlation, Mechanical Systems and Signal
Processing, 28, 333–347, (2012).