A new view of the tree of life - WordPress.com · A new view of the tree of life ... (SSU rRNA)...
6
A new view of the tree of life Laura A. Hug 1† , Brett J. Baker 2 , Karthik Anantharaman 1 , Christopher T. Brown 3 , Alexander J. Probst 1 , Cindy J. Castelle 1 , Cristina N. Butterfield 1 , Alex W. Hernsdorf 3 , Yuki Amano 4 , Kotaro Ise 4 , Yohey Suzuki 5 , Natasha Dudek 6 , David A. Relman 7,8 , Kari M. Finstad 9 , Ronald Amundson 9 , Brian C. Thomas 1 and Jillian F. Banfield 1,9 * The tree of life is one of the most important organizing prin- ciples in biology 1 . Gene surveys suggest the existence of an enormous number of branches 2 , but even an approximation of the full scale of the tree has remained elusive. Recent depic- tions of the tree of life have focused either on the nature of deep evolutionary relationships 3–5 or on the known, well-classi- fied diversity of life with an emphasis on eukaryotes 6 . These approaches overlook the dramatic change in our understanding of life’s diversity resulting from genomic sampling of previously unexamined environments. New methods to generate genome sequences illuminate the identity of organisms and their meta- bolic capacities, placing them in community and ecosystem con- texts 7,8 . Here, we use new genomic data from over 1,000 uncultivated and little known organisms, together with pub- lished sequences, to infer a dramatically expanded version of the tree of life, with Bacteria, Archaea and Eukarya included. The depiction is both a global overview and a snapshot of the diversity within each major lineage. The results reveal the dom- inance of bacterial diversification and underline the importance of organisms lacking isolated representatives, with substantial evolution concentrated in a major radiation of such organisms. This tree highlights major lineages currently underrepresented in biogeochemical models and identifies radiations that are probably important for future evolutionary analyses. Early approaches to describe the tree of life distinguished organisms based on their physical characteristics and metabolic features. Molecular methods dramatically broadened the diversity that could be included in the tree because they circumvented the need for direct observation and experimentation by relying on sequenced genes as markers for lineages. Gene surveys, typically using the small subunit ribosomal RNA (SSU rRNA) gene, provided a remarkable and novel view of the biological world 1,9,10 , but questions about the structure and extent of diversity remain. Organisms from novel lineages have eluded surveys, because many are invisible to these methods due to sequence divergence relative to the primers commonly used for gene amplification 7,11 . Furthermore, unusual sequences, including those with unexpected insertions, may be discarded as artefacts 7 . Whole genome reconstruction was first accomplished in 1995 (ref. 12), with a near-exponential increase in the number of draft genomes reported each subsequent year. There are 30,437 genomes from all three domains of life—Bacteria, Archaea and Eukarya— which are currently available in the Joint Genome Institute’s Integrated Microbial Genomes database (accessed 24 September 2015). Contributing to this expansion in genome numbers are single cell genomics 13 and metagenomics studies. Metagenomics is a shotgun sequencing-based method in which DNA isolated directly from the environment is sequenced, and the reconstructed genome fragments are assigned to draft genomes 14 . New bioinformatics methods yield complete and near-complete genome sequences, without a reliance on cultivation or reference genomes 7,15 . These genome- (rather than gene) based approaches provide information about metabolic poten- tial and a variety of phylogenetically informative sequences that can be used to classify organisms 16 . Here, we have constructed a tree of life by making use of genomes from public databases and 1,011 newly reconstructed genomes that we recovered from a variety of environments (see Methods). To render this tree of life, we aligned and concatenated a set of 16 ribosomal protein sequences from each organism. This approach yields a higher-resolution tree than is obtained from a single gene, such as the widely used 16S rRNA gene 16 . The use of ribosomal pro- teins avoids artefacts that would arise from phylogenies constructed using genes with unrelated functions and subject to different evol- utionary processes. Another important advantage of the chosen ribosomal proteins is that they tend to be syntenic and co-located in a small genomic region in Bacteria and Archaea, reducing binning errors that could substantially perturb the geometry of the tree. Included in this tree is one representative per genus for all genera for which high-quality draft and complete genomes exist (3,083 organisms in total). Despite the methodological challenges, we have included repre- sentatives of all three domains of life. Our primary focus relates to the status of Bacteria and Archaea, as these organisms have been most difficult to profile using macroscopic approaches, and substan- tial progress has been made recently with acquisition of new genome sequences 7,8,13 . The placement of Eukarya relative to Bacteria and Archaea is controversial 1,4,5,17,18 . Eukaryotes are believed to be evol- utionary chimaeras that arose via endosymbiotic fusion, probably involving bacterial and archaeal cells 19 . Here, we do not attempt to confidently resolve the placement of the Eukarya. We position them using sequences of a subset of their nuclear-encoded riboso- mal proteins, an approach that classifies them based on the inheri- tance of their information systems as opposed to lipid or other cellular structures 5 . Figure 1 presents a new view of the tree of life. This is one of a relatively small number of three-domain trees constructed from molecular information so far, and the first comprehensive tree to 1 Department of Earth and Planetary Science, UC Berkeley, Berkeley, California 94720, USA. 2 Department of Marine Science, University of Texas Austin, Port Aransas, Texas 78373, USA. 3 Department of Plant and Microbial Biology, UC Berkeley, Berkeley, California 94720, USA. 4 Sector of Decommissioning and Radioactive Wastes Management, Japan Atomic Energy Agency, Ibaraki 319-1184, Japan. 5 Graduate School of Science, The University of Tokyo, Tokyo 113-8654, Japan. 6 Department of Ecology and Evolutionary Biology, UC Santa Cruz, Santa Cruz, California 95064, USA. 7 Departments of Medicine and of Microbiology and Immunology, Stanford University, Stanford, California 94305, USA. 8 Veterans Affairs Palo Alto Health Care System, Palo Alto, California 94304, USA. 9 Department of Environmental Science, Policy, and Management, UC Berkeley, Berkeley, California 94720, USA. † Present address: Department of Biology, University of Waterloo, Waterloo, Ontario N2L 3G1, Canada. *e-mail: jbanfi[email protected] LETTERS PUBLISHED: 11 APRIL 2016 | ARTICLE NUMBER: 16048 | DOI: 10.1038/NMICROBIOL.2016.48 OPEN NATURE MICROBIOLOGY | VOL 1 | MAY 2016 | www.nature.com/naturemicrobiology 1 © 2016 Macmillan Publishers Limited. All rights reserved
-
Upload
nguyenngoc -
Category
Documents
-
view
217 -
download
0
Transcript of A new view of the tree of life - WordPress.com · A new view of the tree of life ... (SSU rRNA)...

A new view of the tree of lifeLaura A. Hug1†, Brett J. Baker2, Karthik Anantharaman1, Christopher T. Brown3, Alexander J. Probst1,Cindy J. Castelle1, Cristina N. Butterfield1, Alex W. Hernsdorf3, Yuki Amano4, Kotaro Ise4,Yohey Suzuki5, Natasha Dudek6, David A. Relman7,8, Kari M. Finstad9, Ronald Amundson9,Brian C. Thomas1 and Jillian F. Banfield1,9*
The tree of life is one of the most important organizing prin-ciples in biology1. Gene surveys suggest the existence of anenormous number of branches2, but even an approximation ofthe full scale of the tree has remained elusive. Recent depic-tions of the tree of life have focused either on the nature ofdeep evolutionary relationships3–5 or on the known, well-classi-fied diversity of life with an emphasis on eukaryotes6. Theseapproaches overlook the dramatic change in our understandingof life’s diversity resulting from genomic sampling of previouslyunexamined environments. New methods to generate genomesequences illuminate the identity of organisms and their meta-bolic capacities, placing them in community and ecosystem con-texts7,8. Here, we use new genomic data from over 1,000uncultivated and little known organisms, together with pub-lished sequences, to infer a dramatically expanded version ofthe tree of life, with Bacteria, Archaea and Eukarya included.The depiction is both a global overview and a snapshot of thediversity within each major lineage. The results reveal the dom-inance of bacterial diversification and underline the importanceof organisms lacking isolated representatives, with substantialevolution concentrated in a major radiation of such organisms.This tree highlights major lineages currently underrepresentedin biogeochemical models and identifies radiations that areprobably important for future evolutionary analyses.
Early approaches to describe the tree of life distinguished organismsbased on their physical characteristics and metabolic features.Molecular methods dramatically broadened the diversity that couldbe included in the tree because they circumvented the need for directobservation and experimentation by relying on sequenced genes asmarkers for lineages. Gene surveys, typically using the small subunitribosomal RNA (SSU rRNA) gene, provided a remarkable and novelview of the biological world1,9,10, but questions about the structureand extent of diversity remain. Organisms from novel lineages haveeluded surveys, because many are invisible to these methods due tosequence divergence relative to the primers commonly used for geneamplification7,11. Furthermore, unusual sequences, including thosewith unexpected insertions, may be discarded as artefacts7.
Whole genome reconstruction was first accomplished in 1995(ref. 12), with a near-exponential increase in the number of draftgenomes reported each subsequent year. There are 30,437 genomesfrom all three domains of life—Bacteria, Archaea and Eukarya—which are currently available in the Joint Genome Institute’sIntegrated Microbial Genomes database (accessed 24 September 2015).
Contributing to this expansion in genome numbers are single cellgenomics13 and metagenomics studies. Metagenomics is a shotgunsequencing-based method in which DNA isolated directly from theenvironment is sequenced, and the reconstructed genome fragmentsare assigned to draft genomes14. New bioinformatics methods yieldcomplete and near-complete genome sequences, without a relianceon cultivation or reference genomes7,15. These genome- (rather thangene) based approaches provide information about metabolic poten-tial and a variety of phylogenetically informative sequences that canbe used to classify organisms16. Here, we have constructed a treeof life by making use of genomes from public databases and 1,011newly reconstructed genomes that we recovered from a variety ofenvironments (see Methods).
To render this tree of life, we aligned and concatenated a set of 16ribosomal protein sequences from each organism. This approachyields a higher-resolution tree than is obtained from a single gene,such as the widely used 16S rRNA gene16. The use of ribosomal pro-teins avoids artefacts that would arise from phylogenies constructedusing genes with unrelated functions and subject to different evol-utionary processes. Another important advantage of the chosenribosomal proteins is that they tend to be syntenic and co-locatedin a small genomic region in Bacteria and Archaea, reducingbinning errors that could substantially perturb the geometry ofthe tree. Included in this tree is one representative per genus forall genera for which high-quality draft and complete genomesexist (3,083 organisms in total).
Despite the methodological challenges, we have included repre-sentatives of all three domains of life. Our primary focus relates tothe status of Bacteria and Archaea, as these organisms have beenmost difficult to profile using macroscopic approaches, and substan-tial progress has been made recently with acquisition of new genomesequences7,8,13. The placement of Eukarya relative to Bacteria andArchaea is controversial1,4,5,17,18. Eukaryotes are believed to be evol-utionary chimaeras that arose via endosymbiotic fusion, probablyinvolving bacterial and archaeal cells19. Here, we do not attemptto confidently resolve the placement of the Eukarya. We positionthem using sequences of a subset of their nuclear-encoded riboso-mal proteins, an approach that classifies them based on the inheri-tance of their information systems as opposed to lipid or othercellular structures5.
Figure 1 presents a new view of the tree of life. This is one of arelatively small number of three-domain trees constructed frommolecular information so far, and the first comprehensive tree to
1Department of Earth and Planetary Science, UC Berkeley, Berkeley, California 94720, USA. 2Department of Marine Science, University of Texas Austin,Port Aransas, Texas 78373, USA. 3Department of Plant and Microbial Biology, UC Berkeley, Berkeley, California 94720, USA. 4Sector of Decommissioningand Radioactive Wastes Management, Japan Atomic Energy Agency, Ibaraki 319-1184, Japan. 5Graduate School of Science, The University of Tokyo,Tokyo 113-8654, Japan. 6Department of Ecology and Evolutionary Biology, UC Santa Cruz, Santa Cruz, California 95064, USA. 7Departments of Medicineand of Microbiology and Immunology, Stanford University, Stanford, California 94305, USA. 8Veterans Affairs Palo Alto Health Care System, Palo Alto,California 94304, USA. 9Department of Environmental Science, Policy, and Management, UC Berkeley, Berkeley, California 94720, USA. †Present address:Department of Biology, University of Waterloo, Waterloo, Ontario N2L 3G1, Canada. *e-mail: [email protected]
LETTERSPUBLISHED: 11 APRIL 2016 | ARTICLE NUMBER: 16048 | DOI: 10.1038/NMICROBIOL.2016.48
OPEN
NATURE MICROBIOLOGY | VOL 1 | MAY 2016 | www.nature.com/naturemicrobiology 1
© 2016 Macmillan Publishers Limited. All rights reserved
0.4
Candidate Phyla Radiation
Microgenomates
Parcubacteria
Eukaryotes
Archaea
Bacteria
DPANN
Opisthokonta
AmoebozoaChromalveolata
ArchaeplastidaExcavata
RBX1WOR1
Cyanobacteria
Melainabacteria
PVC superphylum
TACK
Major lineage lacking isolated representative: Major lineages with isolated representative: italics
Dojkabacteria WS6
PeregrinibacteriaGracilibacteria BD1-5, GN02
Absconditabacteria SR1
Katanobacteria WWE3
Berkelbacteria
SM2F11
CPR1CPR3
Nomurabacteria KaiserbacteriaAdlerbacteria
Campbellbacteria
Wirthbacteria
Chloroflexi
Armatimonadetes
GiovannonibacteriaWolfebacteria
Jorgensenbacteria
Azambacteria
YanofskybacteriaMoranbacteria
MagasanikbacteriaUhrbacteria
Falkowbacteria
Saccharibacteria
Woesebacteria
AmesbacteriaShapirobacteria
CollierbacteriaPacebacteria
BeckwithbacteriaRoizmanbacteria
GottesmanbacteriaLevybacteria
DaviesbacteriaCurtissbacteria
NanoarchaeotaWoesearchaeota
Pacearchaeota
Nanohaloarchaeota
Micrarchaeota
Altiarchaeales
Aenigmarchaeota
Diapherotrites
Z7ME43
Loki.
Thaumarchaeota
ArchaeoglobiMethanomicrobia
Halobacteria
Thermoplasmata
Methanococci
Spirochaetes
Firmicutes
(Tenericutes)
BacteroidetesChlorobi
Gammaproteobacteria
Alphaproteobacteria
Betaproteobacteria
Actinobacteria
PlanctomycetesChlamydiae,Lentisphaerae,Verrucomicrobia
Omnitrophica
Aminicentantes Rokubacteria
NC10
Elusimicrobia
Poribacteria
Ignavibacteria
Dadabacteria
TM6
Atribacteria
Gemmatimonadetes
CloacimonetesFibrobacteres
Nitrospirae
Latescibacteria
TA06
Caldithrix
Marinimicrobia
WOR-3
Zixibacteria
SynergistetesFusobacteria
AquificaeCalescamantes
Deinococcus-Therm.
CaldisericaDictyoglomi
Deltaprotebacteria(Thermodesulfobacteria)
Epsilonproteobacteria
DeferribacteresChrysiogenetes
Tectomicrobia, ModulibacteriaNitrospinae
Acidobacteria
Zetaproteo.
Thermotogae
Acidithiobacillia
Parvarchaeota
Hydrogenedentes NKB19
Thor.
BRC1
ThermococciMethanobacteria
Hadesarchaea
Methanopyri
Aigarch.
Crenarch.
YNPFFA
Korarch.
Bathyarc.
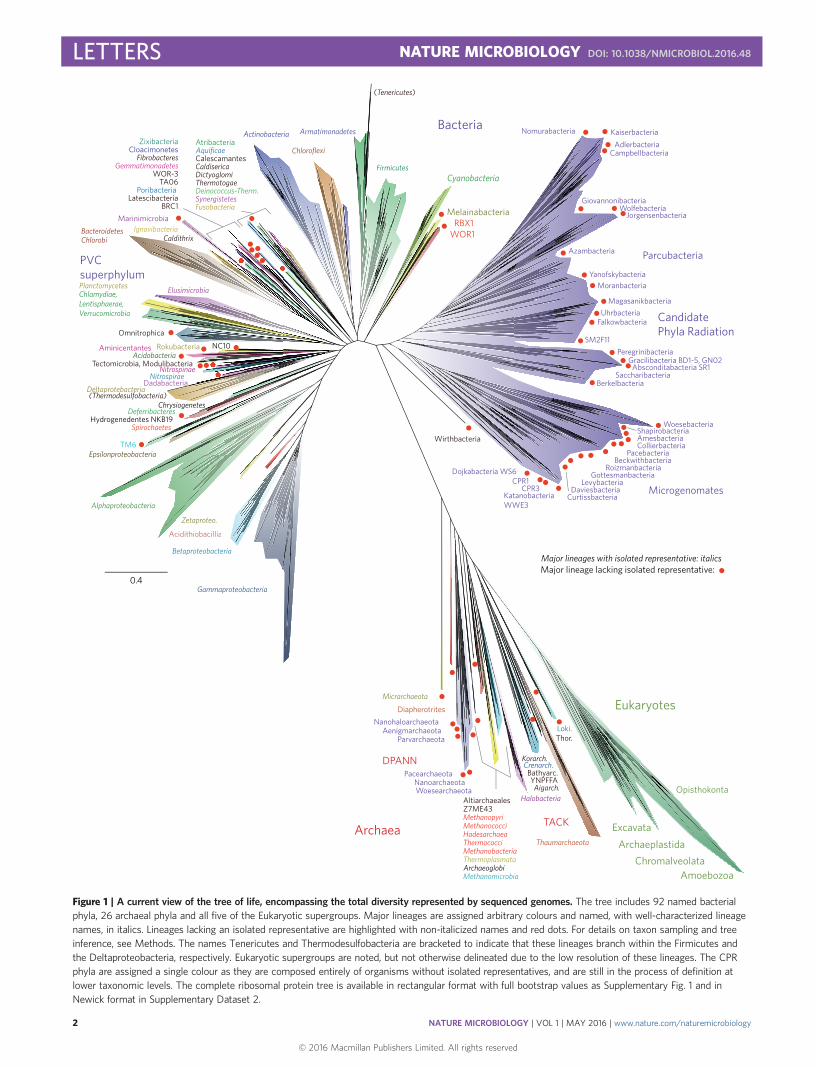
Figure 1 | A current view of the tree of life, encompassing the total diversity represented by sequenced genomes. The tree includes 92 named bacterialphyla, 26 archaeal phyla and all five of the Eukaryotic supergroups. Major lineages are assigned arbitrary colours and named, with well-characterized lineagenames, in italics. Lineages lacking an isolated representative are highlighted with non-italicized names and red dots. For details on taxon sampling and treeinference, see Methods. The names Tenericutes and Thermodesulfobacteria are bracketed to indicate that these lineages branch within the Firmicutes andthe Deltaproteobacteria, respectively. Eukaryotic supergroups are noted, but not otherwise delineated due to the low resolution of these lineages. The CPRphyla are assigned a single colour as they are composed entirely of organisms without isolated representatives, and are still in the process of definition atlower taxonomic levels. The complete ribosomal protein tree is available in rectangular format with full bootstrap values as Supplementary Fig. 1 and inNewick format in Supplementary Dataset 2.
LETTERS NATURE MICROBIOLOGY DOI: 10.1038/NMICROBIOL.2016.48
NATURE MICROBIOLOGY | VOL 1 | MAY 2016 | www.nature.com/naturemicrobiology2
© 2016 Macmillan Publishers Limited. All rights reserved

0.2
Korarchaeota
DiapherotritesNanohaloarchaeota
Unclassified archaea
Pacearchaeota
Woesearchaeota, Nanoarchaeota
Woesearchaeota
AltiarchaealesZ7ME43
Methanopyri, Methanococci, Methanobacteria, Hadesarchaea, ThermococciArchaeoglobi, Methanomicrobia, Halobacteria
Aciduliprofundum, ThermoplasmataUncultured Thermoplasmata
ThermoplasmataOpisthokonta, Excavata, Archaeplastida Chromalveolata, Amoebozoa
CrenarchaeotaCrenarchaeota
Thorarchaeota Lokiarchaeota
YNPFFA
Thaumarchaeota Thaumarchaeota
Cyanobacteria, Melainabacteria
Dojkabacteria WS6 CPR3
Katanobacteria WWE3 Katanobacteria WWE3
Microgenomates RoizmanbacteriaMicrogenomates Roizmanbacteria
Microgenomates Microgenomates Curtissbacteria Microgenomates Daviesbacteria
Microgenomates Levybacteria
Microgenomates Woesebacteria Microgenomates Amesbacteria
Microgenomates Shapirobacteria Microgenomates Beckwithbacteria, Pacebacteria, Collierbacteria
Microgenomates Gottesmanbacteria
KAZAN CPR2, Saccharibacteria TM7
Berkelbacteria
Berkelbacteria
Berkelbacteria Berkelbacteria
CPR Uncultured unclassified bacteria Peregrinibacteria
Peregrinibacteria
Absconditabacteria SR1Gracilibacteria BD1-5 / GNO2
SM2F11Parcubacteria
Parcubacteria Kuenenbacteria, Falkowbacteria, Uhrbacteria, MagasanikbacteriaParcubacteriaParcubacteria
Parcubacteria
ParcubacteriaParcubacteria Azambacteria, Jorgensenbacteria, Wolfebacteria, Giovannonibacteria, Nomurabacteria, Campbellbacteria, Adlerbacteria, KaiserbacteriaParcubacteria
Parcubacteria Moranbacteria
ParcubacteriaParcubacteria Yanofskybacteria
Deinococcus-Thermus Aquificae, Calescamantes EM19
Caldiserica, Dictyoglomi Thermotogae
Omnitrophica Omnitrophica
Spirochaetes Spirochaetes
Hydrogenedentes NKB19 Deltaproteobacteria
Epsilonproteobacteria TM6
Alphaproteobacteria, Zetaproteobacteria, Betaproteobacteria, Gammaproteobacteria Chrysiogenetes, Deferribacteres
Modulibacteria, Tectomicrobia, Nitrospinae, Nitrospirae, Dadabacteria, Thermodesulfobacteria, Deltaprot. NC10, Rokubacteria, Aminicenantes, Acidobacteria
Planctomycetes Chlamydiae
Lentisphaerae Verrucomicrobia
Verrucomicrobia
RBX-1 WOR-1
Firmicutes, Tenericutes, Armatimonadetes, Chloroflexi, Actinobacteria Fusobacteria, Synergistetes
Uncultured bacteria (CP RIF32)
Zixibacteria, Marinimicrobia, Caldithrix, Chlorobi, Ignavibacteria, Bacteroidetes Fibrobacteres
Cloacamonetes
Atribacteria (OP9) BRC1, Poribacteria
Latescibacteria WS3 Gemmatimonadetes, WOR-3, TA06
ElusimicrobiaUncultured bacteria
Uncultured bacteria (CP RIF1)
Aigarchaeota, Cand. Caldiarchaeum subterraneum
Unclassified archaea
Parcubacteria
Candidate Phyla Radiation
Cyanobacteria, Melainabacteria
Deinococcus-Thermus Aquificae, Calescamantes EM19
Caldiserica, Dictyoglomiq ,q ,
ThermotogaeA ifi C
Omnitrophica Omnitrophica
pp
Spirochaetes SpirochaetesS i h t
Hydrogenedentes NKB19 Deltaproteobacteria
H d d t N
Epsilonproteobacteriab
TM6Alphaproteobacteria, Zetaproteobacteria, Betaproteobacteria, Gammaproteobacteria Chrysiogenetes, Deferribacteres
Modulibacteria, Tectomicrobia, Nitrospinae, Nitrospirae, Dadabacteria, Thermodesulfobacteria, Deltaprot. NC10, Rokubacteria, Aminicenantes, Acidobacteria
D f bD f b
, , p ,, , p ,
Planctomycetespp
Chlamydiaey
LentisphaeraeC a yd Ch
Verrucomicrobia Verrucomicrobia
pp
RBX-1 WOR-1
Firmicutes, Tenericutes, Armatimonadetes, Chloroflexi, Actinobacteria Fusobacteria, Synergistetes
Uncultured bacteria (CP RIF32), y g, y g
Zixibacteria, Marinimicrobia, Caldithrix, Chlorobi, Ignavibacteria, Bacteroidetes Fibrobacteres
Cloacamonetes
Atribacteria (OP9) BRC1, Poribacteria
( )
Latescibacteria WS3 Gemmatimonadetes, WOR-3, TA06
b M
ElusimicrobiaUncultured bacteria
Uncultured bacteria (CP RIF1)O h
Dojkabacteria WS6 CPR3
Katanobacteria WWE3 Katanobacteria WWE3
Microgenomates RoizmanbacteriaMicrogenomates Roizmanbacteria
MicrogenomatesMicrogenomates Curtissbacteria
ggMicrogenomates Daviesbacteria
gg
Microgenomates Levybacteria
Microgenomates Woesebacteria Microgenomates AmesbacteriaMi t L b t i
Microgenomates ShapirobacteriaMi t W bMi t
Microgenomates Beckwithbacteria, Pacebacteria, CollierbacteriaMi Sh i b i
Microgenomates Gottesmanbacteriat R i b t i
g yg y
KAZAN CPR2, Saccharibacteria TM7
Berkelbacteria
Berkelbacteria
Berkelbacteria Berkelbacteria
CPR Uncultured unclassified bacteria Peregrinibacteria
Peregrinibacteria
Absconditabacteria SR1Gracilibacteria BD1-5 / GNO2
SM2F11Parcubacteria
Parcubacteria Kuenenbacteria, Falkowbacteria, Uhrbacteria, Magasanikbacteriate a
ParcubacteriaParcubacteria
Parcubacteria
Parcubacteria AbscAbs
Parcubacteria Azambacteria, Jorgensenbacteria, Wolfebacteria, Giovannonibacteria, Nomurabacteria, Campbellbacteria, Adlerbacteria, Kaiserbacteria
ggParcubacteriaParcubacteria Moranbacteria
ParcubacteriaParcubacteria Yanofskybacteria
P b i
Candidate Phyla Radiation
DiapherotritesNanohaloarchaeota
Unclassified archaea
Pacearchaeota
Woesearchaeota, Nanoarchaeota
Woesearchaeota
AltiarchaealesZ7ME43
Methanopyri, Methanococci, Methanobacteria, Hadesarchaea, ThermococciE43
Archaeoglobi, Methanomicrobia, Halobacteria, , ,, , ,
Aciduliprofundum, Thermoplasmatagg
Uncultured Thermoplasmatap ,p ,
Thermoplasmatap
Unclassified archaea
Korarchaeota
,
CrenarchaeotaCrenarchaeota
Thorarchaeota Lokiarchaeota
YNPFFA
Thaumarchaeota Thaumarchaeota
b l b
Aigarchaeota,FFA
Cand. Caldiarchaeum subterraneum
C b t i M l i b t i
Opisthokonta, Excavata, Archaeplastida Chromalveolata, Amoebozoa
Th h,
Th h tEukaryotes
Bacteria
Archaea
Katanobacteria WWE3
Bootstrap ≥ 85% 85% > Bootstrap ≥ 50%
Woesearchaeota, Nanoarchaeota
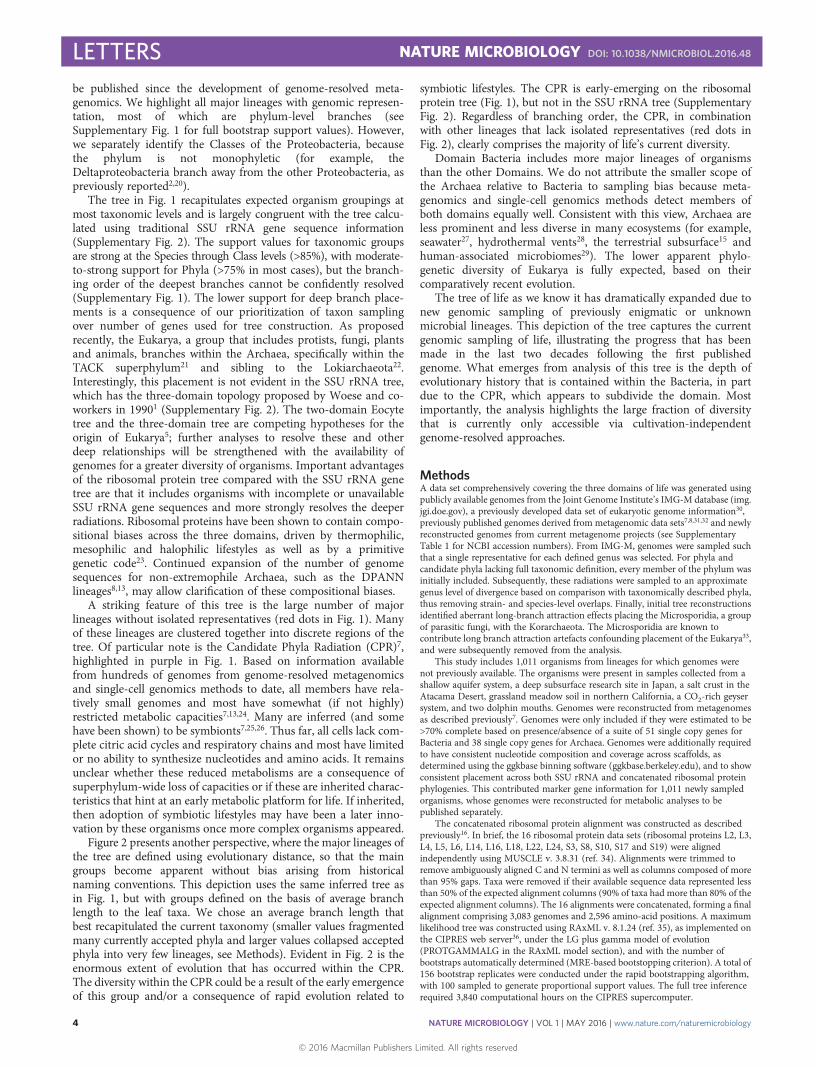
Figure 2 | A reformatted view of the tree in Fig. 1 in which each major lineage represents the same amount of evolutionary distance. The threshold forgroups (coloured wedges) was an average branch length of <0.65 substitutions per site. Notably, some well-accepted phyla become single groups andothers are split into multiple distinct groups. We undertook this analysis to provide perspective on the structure of the tree, and do not propose the resultinggroups to have special taxonomic status. The massive scale of diversity in the CPR and the large fraction of major lineages that lack isolated representatives(red dots) are apparent from this analysis. Bootstrap support values are indicated by circles on nodes—black for support of 85% and above, grey for supportfrom 50 to 84%. The complete ribosomal protein tree is available in rectangular format with full bootstrap values as Supplementary Fig. 1 and in Newickformat in Supplementary Dataset 2.
NATURE MICROBIOLOGY DOI: 10.1038/NMICROBIOL.2016.48 LETTERS
NATURE MICROBIOLOGY | VOL 1 | MAY 2016 | www.nature.com/naturemicrobiology 3
© 2016 Macmillan Publishers Limited. All rights reserved
be published since the development of genome-resolved meta-genomics. We highlight all major lineages with genomic represen-tation, most of which are phylum-level branches (seeSupplementary Fig. 1 for full bootstrap support values). However,we separately identify the Classes of the Proteobacteria, becausethe phylum is not monophyletic (for example, theDeltaproteobacteria branch away from the other Proteobacteria, aspreviously reported2,20).
The tree in Fig. 1 recapitulates expected organism groupings atmost taxonomic levels and is largely congruent with the tree calcu-lated using traditional SSU rRNA gene sequence information(Supplementary Fig. 2). The support values for taxonomic groupsare strong at the Species through Class levels (>85%), with moderate-to-strong support for Phyla (>75% in most cases), but the branch-ing order of the deepest branches cannot be confidently resolved(Supplementary Fig. 1). The lower support for deep branch place-ments is a consequence of our prioritization of taxon samplingover number of genes used for tree construction. As proposedrecently, the Eukarya, a group that includes protists, fungi, plantsand animals, branches within the Archaea, specifically within theTACK superphylum21 and sibling to the Lokiarchaeota22.Interestingly, this placement is not evident in the SSU rRNA tree,which has the three-domain topology proposed by Woese and co-workers in 19901 (Supplementary Fig. 2). The two-domain Eocytetree and the three-domain tree are competing hypotheses for theorigin of Eukarya5; further analyses to resolve these and otherdeep relationships will be strengthened with the availability ofgenomes for a greater diversity of organisms. Important advantagesof the ribosomal protein tree compared with the SSU rRNA genetree are that it includes organisms with incomplete or unavailableSSU rRNA gene sequences and more strongly resolves the deeperradiations. Ribosomal proteins have been shown to contain compo-sitional biases across the three domains, driven by thermophilic,mesophilic and halophilic lifestyles as well as by a primitivegenetic code23. Continued expansion of the number of genomesequences for non-extremophile Archaea, such as the DPANNlineages8,13, may allow clarification of these compositional biases.
A striking feature of this tree is the large number of majorlineages without isolated representatives (red dots in Fig. 1). Manyof these lineages are clustered together into discrete regions of thetree. Of particular note is the Candidate Phyla Radiation (CPR)7,highlighted in purple in Fig. 1. Based on information availablefrom hundreds of genomes from genome-resolved metagenomicsand single-cell genomics methods to date, all members have rela-tively small genomes and most have somewhat (if not highly)restricted metabolic capacities7,13,24. Many are inferred (and somehave been shown) to be symbionts7,25,26. Thus far, all cells lack com-plete citric acid cycles and respiratory chains and most have limitedor no ability to synthesize nucleotides and amino acids. It remainsunclear whether these reduced metabolisms are a consequence ofsuperphylum-wide loss of capacities or if these are inherited charac-teristics that hint at an early metabolic platform for life. If inherited,then adoption of symbiotic lifestyles may have been a later inno-vation by these organisms once more complex organisms appeared.
Figure 2 presents another perspective, where the major lineages ofthe tree are defined using evolutionary distance, so that the maingroups become apparent without bias arising from historicalnaming conventions. This depiction uses the same inferred tree asin Fig. 1, but with groups defined on the basis of average branchlength to the leaf taxa. We chose an average branch length thatbest recapitulated the current taxonomy (smaller values fragmentedmany currently accepted phyla and larger values collapsed acceptedphyla into very few lineages, see Methods). Evident in Fig. 2 is theenormous extent of evolution that has occurred within the CPR.The diversity within the CPR could be a result of the early emergenceof this group and/or a consequence of rapid evolution related to
symbiotic lifestyles. The CPR is early-emerging on the ribosomalprotein tree (Fig. 1), but not in the SSU rRNA tree (SupplementaryFig. 2). Regardless of branching order, the CPR, in combinationwith other lineages that lack isolated representatives (red dots inFig. 2), clearly comprises the majority of life’s current diversity.
Domain Bacteria includes more major lineages of organismsthan the other Domains. We do not attribute the smaller scope ofthe Archaea relative to Bacteria to sampling bias because meta-genomics and single-cell genomics methods detect members ofboth domains equally well. Consistent with this view, Archaea areless prominent and less diverse in many ecosystems (for example,seawater27, hydrothermal vents28, the terrestrial subsurface15 andhuman-associated microbiomes29). The lower apparent phylo-genetic diversity of Eukarya is fully expected, based on theircomparatively recent evolution.
The tree of life as we know it has dramatically expanded due tonew genomic sampling of previously enigmatic or unknownmicrobial lineages. This depiction of the tree captures the currentgenomic sampling of life, illustrating the progress that has beenmade in the last two decades following the first publishedgenome. What emerges from analysis of this tree is the depth ofevolutionary history that is contained within the Bacteria, in partdue to the CPR, which appears to subdivide the domain. Mostimportantly, the analysis highlights the large fraction of diversitythat is currently only accessible via cultivation-independentgenome-resolved approaches.
MethodsA data set comprehensively covering the three domains of life was generated usingpublicly available genomes from the Joint Genome Institute’s IMG-M database (img.jgi.doe.gov), a previously developed data set of eukaryotic genome information30,previously published genomes derived from metagenomic data sets7,8,31,32 and newlyreconstructed genomes from current metagenome projects (see SupplementaryTable 1 for NCBI accession numbers). From IMG-M, genomes were sampled suchthat a single representative for each defined genus was selected. For phyla andcandidate phyla lacking full taxonomic definition, every member of the phylum wasinitially included. Subsequently, these radiations were sampled to an approximategenus level of divergence based on comparison with taxonomically described phyla,thus removing strain- and species-level overlaps. Finally, initial tree reconstructionsidentified aberrant long-branch attraction effects placing the Microsporidia, a groupof parasitic fungi, with the Korarchaeota. The Microsporidia are known tocontribute long branch attraction artefacts confounding placement of the Eukarya33,and were subsequently removed from the analysis.
This study includes 1,011 organisms from lineages for which genomes werenot previously available. The organisms were present in samples collected from ashallow aquifer system, a deep subsurface research site in Japan, a salt crust in theAtacama Desert, grassland meadow soil in northern California, a CO2-rich geysersystem, and two dolphin mouths. Genomes were reconstructed from metagenomesas described previously7. Genomes were only included if they were estimated to be>70% complete based on presence/absence of a suite of 51 single copy genes forBacteria and 38 single copy genes for Archaea. Genomes were additionally requiredto have consistent nucleotide composition and coverage across scaffolds, asdetermined using the ggkbase binning software (ggkbase.berkeley.edu), and to showconsistent placement across both SSU rRNA and concatenated ribosomal proteinphylogenies. This contributed marker gene information for 1,011 newly sampledorganisms, whose genomes were reconstructed for metabolic analyses to bepublished separately.
The concatenated ribosomal protein alignment was constructed as describedpreviously16. In brief, the 16 ribosomal protein data sets (ribosomal proteins L2, L3,L4, L5, L6, L14, L16, L18, L22, L24, S3, S8, S10, S17 and S19) were alignedindependently using MUSCLE v. 3.8.31 (ref. 34). Alignments were trimmed toremove ambiguously aligned C and N termini as well as columns composed of morethan 95% gaps. Taxa were removed if their available sequence data represented lessthan 50% of the expected alignment columns (90% of taxa had more than 80% of theexpected alignment columns). The 16 alignments were concatenated, forming a finalalignment comprising 3,083 genomes and 2,596 amino-acid positions. A maximumlikelihood tree was constructed using RAxML v. 8.1.24 (ref. 35), as implemented onthe CIPRES web server36, under the LG plus gamma model of evolution(PROTGAMMALG in the RAxML model section), and with the number ofbootstraps automatically determined (MRE-based bootstopping criterion). A total of156 bootstrap replicates were conducted under the rapid bootstrapping algorithm,with 100 sampled to generate proportional support values. The full tree inferencerequired 3,840 computational hours on the CIPRES supercomputer.
LETTERS NATURE MICROBIOLOGY DOI: 10.1038/NMICROBIOL.2016.48
NATURE MICROBIOLOGY | VOL 1 | MAY 2016 | www.nature.com/naturemicrobiology4
© 2016 Macmillan Publishers Limited. All rights reserved

To construct Fig. 2, we collapsed branches based on an average branch lengthcriterion. Average branch length calculations were implemented in the InteractiveTree of Life online interface37 using the formula:
Average branch length=mean([root distance to tip]–[root distance to node]) forall tips connecting to a node.
We tested values between 0.25 and 0.75 at 0.05 intervals, and selected a finalthreshold of <0.65 based on generation of a similar number of major lineages ascompared to the taxonomy-guided clustering view in Fig. 1. The taxonomy viewidentified 26 archaeal and 74 bacterial phylum-level lineages (counting theMicrogenomates and Parcubacteria as single phyla each), whereas an average branchlength of <0.65 resulted in 28 archaeal and 76 bacterial clades.
For a companion SSU rRNA tree, an alignment was generated from all SSUrRNA genes available from the genomes of the organisms included in the ribosomalprotein data set. For organisms with multiple SSU rRNA genes, one representativegene was kept for the analysis, selected randomly. As genome sampling was confinedto the genus level, we do not anticipate this selection process will have any impact onthe resultant tree. All SSU rRNA genes longer than 600 bp were aligned using theSINA alignment algorithm through the SILVA web interface38,39. The full alignmentwas stripped of columns containing 95% or more gaps, generating a final alignmentcontaining 1,871 taxa and 1,947 alignment positions. A maximum likelihood treewas inferred as described for the concatenated ribosomal protein trees, with RAxMLrun using the GTRCAT model of evolution. The RAxML inference included thecalculation of 300 bootstrap iterations (extended majority rules-based bootstoppingcriterion), with 100 randomly sampled to determine support values.
To test the effect of site selection stringency on the inferred phylogenies, westripped the alignments of columns containing up to 50% gaps (compared with theoriginal trimming of 95% gaps). For the ribosomal protein alignment, this resultedin a 14% reduction in alignment length (to 2,232 positions) and a 44.6% reduction incomputational time (∼2,100 h). For the SSU rRNA gene alignment, strippingcolumns with 50% or greater gaps reduced the alignment by 24% (to 1,489 positions)and the computation time by 28%. In both cases, the topology of the tree with thebest likelihood was not changed significantly. The ribosomal protein resolved a two-domain tree with the Eukarya sibling to the Lokiarcheaota, while the SSU rRNA treedepicts a three-domain tree. The position of the CPR as deep-branching on theribosomal protein tree and within the Bacteria on the SSU rRNA tree was alsoconsistent. The alignments and inferred trees under the more stringent gap strippingare available upon request.
Nomenclature. We have included names for two lineages for which we havepreviously published complete genomes40. At the time of submission of the paperdescribing these genomes40, the reviewer community was not uniformly open tonaming lineages of uncultivated organisms based on such information. Given thatthis practice is now widely used, we re-propose the names for these phyla.Specifically, for WWE3 we suggest the name Katanobacteria from the Hebrew‘katan’, which means ‘small’, and for SR1 we suggest the name Absconditabacteriafrom the Latin ‘Abscondo’ meaning ‘hidden’, as in ‘shrouded’.
Accession codes. NCBI and/or JGI IMG accession numbers for all genomes used inthis study are listed in Supplementary Table 1. Additional ribosomal protein geneand 16S rRNA gene sequences used in this study have been deposited in Genbankunder accession numbers KU868081–KU869521. The concatenated ribosomalprotein and SSU rRNA alignments used for tree reconstruction are included asseparate files in the Supplementary Information.
Received 25 January 2016; accepted 10 March 2016;published 11 April 2016
References1. Woese, C. R., Kandler, O. & Wheelis, M. L. Towards a natural system of
organisms: proposal for the domains Archaea, Bacteria, and Eucarya. Proc. NatlAcad. Sci. USA 87, 4576–4579 (1990).
2. Yarza, P. et al. Uniting the classification of cultured and uncultured bacteriaand archaea using 16S rRNA gene sequences. Nature Rev. Microbiol. 12,635–645 (2014).
3. Gouy, R., Baurain, D. & Philippe, H. Rooting the tree of life: the phylogeneticjury is still out. Phil. Trans. R. Soc. Lond. B Biol. Sci. 370, 20140329 (2015).
4. Pace, N. R. Time for a change. Nature 441, 289 (2006).5. Williams, T. A., Foster, P. G., Cox, C. J. & Embley, T. M. An archaeal origin
of eukaryotes supports only two primary domains of life. Nature 504,231–236 (2013).
6. Hinchliff, C. E. et al. Synthesis of phylogeny and taxonomy into acomprehensive tree of life. Proc. Natl Acad. Sci. USA 112, 12764–12769 (2015).
7. Brown, C. T. et al. Unusual biology across a group comprising more than 15% ofdomain Bacteria. Nature 523, 208–211 (2015).
8. Castelle, C. J. et al. Genomic expansion of domain archaea highlights rolesfor organisms from new phyla in anaerobic carbon cycling. Curr. Biol. 25,690–701 (2015).
9. Pace, N. R. Mapping the tree of life: progress and prospects.Microbiol. Mol. Biol.Rev. 73, 565–576 (2009).
10. Lane, D. J. et al. Rapid determination of 16S ribosomal RNA sequences forphylogenetic analyses. Proc. Natl Acad. Sci. USA 82, 6955–6959 (1985).
11. Klindworth, A. et al. Evaluation of general 16S ribosomal RNA gene PCRprimers for classical and next-generation sequencing-based diversity studies.Nucleic Acids Res. 41, e1 (2013).
12. Fleischmann, R. et al. Whole-genome random sequencing and assembly ofHaemophilus influenzae Rd. Science 269, 496–512 (1995).
13. Rinke, C. et al. Insights into the phylogeny and coding potential of microbialdark matter. Nature 499, 431–437 (2013).
14. Dick, G. J. et al. Community-wide analysis of microbial genome sequencesignatures. Genome Biol. 10, R85 (2009).
15. Castelle, C. J. et al. Extraordinary phylogenetic diversity and metabolic versatilityin aquifer sediment. Nature Commun. 4, 2120 (2013).
16. Hug, L. A. et al. Community genomic analyses constrain the distribution ofmetabolic traits across the Chloroflexi phylum and indicate roles in sedimentcarbon cycling. Microbiome 1, 22 (2013).
17. Cox, C. J., Foster, P. G., Hirt, R. P., Harris, S. R. & Embley, T. M. Thearchaebacterial origin of eukaryotes. Proc. Natl Acad. Sci. USA 105,20356–20361 (2008).
18. Lake, J. A., Henderson, E., Oakes, M. & Clark, M. W. Eocytes: a new ribosomestructure indicates a kingdom with a close relationship to eukaryotes. Proc. NatlAcad. Sci. USA 81, 3786–3790 (1984).
19. Martin, W. F., Garg, S. & Zimorski, V. Endosymbiotic theories for eukaryoteorigin. Phil. Trans. R. Soc. B Biol. Sci. 370, 20140330 (2015).
20. Garrity, G., Boone, D. R. & Castenholtz, R. W. (eds) Bergey’s Manual ofSystematic Bacteriology. Volume One: The Archaea and the Deeply Branchingand Phototrophic Bacteria 2nd edn (Springer, 2001).
21. Guy, L. & Ettema, T. J. G. The archaeal ‘TACK’ superphylum and the origin ofeukaryotes. Trends Microbiol. 19, 580–587 (2011).
22. Spang, A. et al. Complex archaea that bridge the gap between prokaryotes andeukaryotes. Nature 521, 173–179 (2015).
23. Fournier, G. P. & Gogarten, J. P. Rooting the ribosomal tree of life. Mol. Biol.Evol. 27, 1792–1801 (2010).
24. Wrighton, K. C. et al. Fermentation, hydrogen, and sulfur metabolism inmultiple uncultivated bacterial phyla. Science 337, 1661–1665 (2012).
25. He, X. et al. Cultivation of a human-associated TM7 phylotype reveals areduced genome and epibiotic parasitic lifestyle. Proc. Natl Acad. Sci. USA 112,244–249 (2015).
26. Nelson, W. C. & Stegen, J. C. The reduced genomes of Parcubacteria (OD1)contain signatures of a symbiotic lifestyle. Front. Microbiol. 6, 713 (2015).
27. Lloyd, K. G., May, M. K., Kevorkian, R. T. & Steen, A. D. Meta-analysis ofquantification methods shows that archaea and bacteria have similar abundancesin the subseafloor. Appl. Environ. Microbiol. 79, 7790–7799 (2013).
28. Sievert, S. M., Ziebis, W., Kuever, J. & Sahm, K. Relative abundance of Archaeaand Bacteria along a thermal gradient of a shallow-water hydrothermalvent quantified by rRNA slot-blot hybridization. Microbiology 146,1287–1293 (2000).
29. Hoffmann, C. et al. Archaea and fungi of the human gut microbiome:correlations with diet and bacterial residents. PLoS ONE 8, e66019 (2013).
30. Brown, M. W. et al. Phylogenomics demonstrates that breviate flagellates arerelated to opisthokonts and apusomonads. Proc. Biol. Sci. 280, 20131755 (2013).
31. Hug, L. A. et al. Critical biogeochemical functions in the subsurface areassociated with bacteria from new phyla and little studied lineages. Environ.Microbiol. 18, 159–173 (2016).
32. Baker, B. J., Lazar, C. S., Teske, A. P. & Dick, G. J. Genomic resolution of linkagesin carbon, nitrogen, and sulfur cycling among widespread estuary sedimentbacteria. Microbiome 3, 14 (2015).
33. Inagaki, Y., Susko, E., Fast, N. M. & Roger, A. J. Covarion shifts cause a long-branch attraction artifact that unites microsporidia and archaebacteria in EF-1alpha phylogenies. Mol. Biol. Evol. 21, 1340–1349 (2004).
34. Edgar, R. C. MUSCLE: multiple sequence alignment with high accuracy andhigh throughput. Nucleic Acids Res. 32, 1792–1797 (2004).
35. Stamatakis, A. RAxML-VI-HPC: maximum likelihood-based phylogeneticanalyses with thousands of taxa and mixed models. Bioinformatics 22,2688–2690 (2006).
36. Miller, M., Pfeiffer, W. & Schwartz, T. Creating the CIPRES Science Gateway forinference of large phylogenetic trees. Gatew. Comput. Environ. Work 1–8 (2010).
37. Letunic, I. & Bork, P. Interactive Tree Of Life v2: online annotation and displayof phylogenetic trees made easy. Nucleic Acids Res. 39, W475–W478 (2011).
38. Pruesse, E., Peplies, J. & Glöckner, F. O. SINA: accurate high-throughputmultiple sequence alignment of ribosomal RNA genes. Bioinformatics 28,1823–1829 (2012).
39. Pruesse, E. et al. SILVA: a comprehensive online resource for quality checked andaligned ribosomal RNA sequence data compatible with ARB. Nucleic Acids Res.35, 7188–7196 (2007).
NATURE MICROBIOLOGY DOI: 10.1038/NMICROBIOL.2016.48 LETTERS
NATURE MICROBIOLOGY | VOL 1 | MAY 2016 | www.nature.com/naturemicrobiology 5
© 2016 Macmillan Publishers Limited. All rights reserved

40. Kantor, R. S. et al. Small genomes and sparse metabolisms of sediment-associated bacteria from four candidate phyla. MBio 4, e00708–13 (2013).
AcknowledgementsThis research was largely supported by the Lawrence Berkeley National Laboratory (LBNL)Genomes toWatershed Scientific Focus Area funded by theUSDepartment of Energy (DOE),Office of Science, Office of Biological and Environmental Research (OBER) under contract no.DE-AC02-05CH11231. Additional support was provided by LBNL EFRC award no. DE-AC02-05CH11231, NASA NESSF grant no. 12-PLANET12R-0025 and NSF DEB grant no.1406956, DOE OBER grant no. DOE-SC10010566, Office of Naval Research grants nos.N00014-07-1-0287, N00014-10-1-0233 and N00014-11-1-0918, and by the Thomas C. andJoanM.Merigan Endowment at StanfordUniversity. In addition, fundingwas provided by theMinistry of Economy, Trade and Industry of Japan. The authors thank J. Eisen for comments,S. Venn-Watson, K. Carlin and E. Jensen (US Navy Marine Mammal Program) for dolphinsamples, K.W. Seitz for sequence submission assistance, and the DOE Joint Genome Institutefor generating the metagenome sequence via the Community Science Program.
Author contributionsL.A.H. and J.F.B. defined the research objective. L.A.H. generated data sets and conductedphylogenetic tree inferences. L.A.H., B.J.B. and J.F.B. conducted data analysis. L.A.H.,
B.J.B., K.A., C.T.B., A.J.P., C.J.C., C.N.B., A.W.H., Y.A., K.I., Y.S., N.D., D.A.R., K.M.F., R.A.,B.C.T. and J.F.B. contributed to metagenome binning and genome analysis. L.A.H. andJ.F.B. wrote the manuscript with input from all authors. All authors read and approved thefinal manuscript.
Additional informationSupplementary information is available online. Reprints and permissions information isavailable online atwww.nature.com/reprints. Correspondence and requests formaterials shouldbe addressed to J.F.B.
Competing interestsThe authors declare no competing financial interests.
This work is licensed under a Creative Commons Attribution 4.0International License. The images or other third party material inthis article are included in the article's Creative Commons license,
unless indicated otherwise in the credit line; if the material is not included under theCreative Commons license, users will need to obtain permission from the license holder toreproduce the material. To view a copy of this license, visit http://creativecommons.org/licenses/by/4.0/
LETTERS NATURE MICROBIOLOGY DOI: 10.1038/NMICROBIOL.2016.48
NATURE MICROBIOLOGY | VOL 1 | MAY 2016 | www.nature.com/naturemicrobiology6
© 2016 Macmillan Publishers Limited. All rights reserved