A NEW TOOL FOR EFFECTIVE AND EFFICIENT PROJECT MANAGEMENT … · A New Tool for Effective and...
49
PNNL-20937 Prepared for the U.S. Department of Energy under Contract DE-AC05-76RL01830 A New Tool for Effective and Efficient Project Management JA Willett December 2011
Transcript of A NEW TOOL FOR EFFECTIVE AND EFFICIENT PROJECT MANAGEMENT … · A New Tool for Effective and...
PNNL-20937
Prepared for the U.S. Department of Energy under Contract DE-AC05-76RL01830
A New Tool for Effective and Efficient Project Management JA Willett December 2011
PNNL-20937
A New Tool for Effective and Efficient Project Management An Engineering Report submitted in partial fulfillment of the requirements for the degree of Master of Engineering & Technology Management, Washington State University Engineering &Technology Management Program
JA Willett
December 2011
Prepared for
the U.S. Department of Energy
under Contract DE-AC05-76RL01830
Pacific Northwest National Laboratory
Richland, Washington 99352
ii
To the Faculty of Washington State University:
The members of the Committee appointed to examine the Engineering Report of
JESSE ALAN WILLETT find it satisfactory and recommend that it be accepted.
___________________________
Chair, James Holt
___________________________
Hal Rumsey
__________________________
Ray Ladd
iii
Acknowledgment
It is a pleasure to thank those who made this technical report possible. I would like to thank
Dr. James Holt for his advice, guidance, and classroom instruction as one of my professors and
my graduate committee advisor.
I acknowledge the Pacific Northwest National Laboratory (PNNL) and the Kingwood funding
client for permitting me to use the Kingwood project in my graduate research. I also appreciate
PNNL‟s financial support of my education.
I would like to thank my family members, especially my wife, Shana Willett; my sons, Arthur
and Andrew Willett; and my parents Robert and Crystal Willett for supporting and encouraging
me to pursue this degree. Without their encouragement, I would not have finished my Masters
degree.
Jesse Willett
iv
A NEW TOOL FOR
EFFECTIVE AND EFFICIENT PROJECT MANAGEMENT
Abstract
by JESSE ALAN WILLETT
Master of Engineering & Technology Management
Washington State University
December 2011
Chair: James Holt
Organizations routinely handle thousands of projects per year, and it is difficult to manage all
these projects concurrently. Too often, projects do not get the attention they need when they
need it. Management inattention can lead to late projects or projects with less than desirable
content and/or deliverables. This paper discusses the application of Visual Project Management
(VPM) as a method to track and manage projects. The VPM approach proved to be a powerful
management tool without the overhead and restrictions of traditional management methods.
v
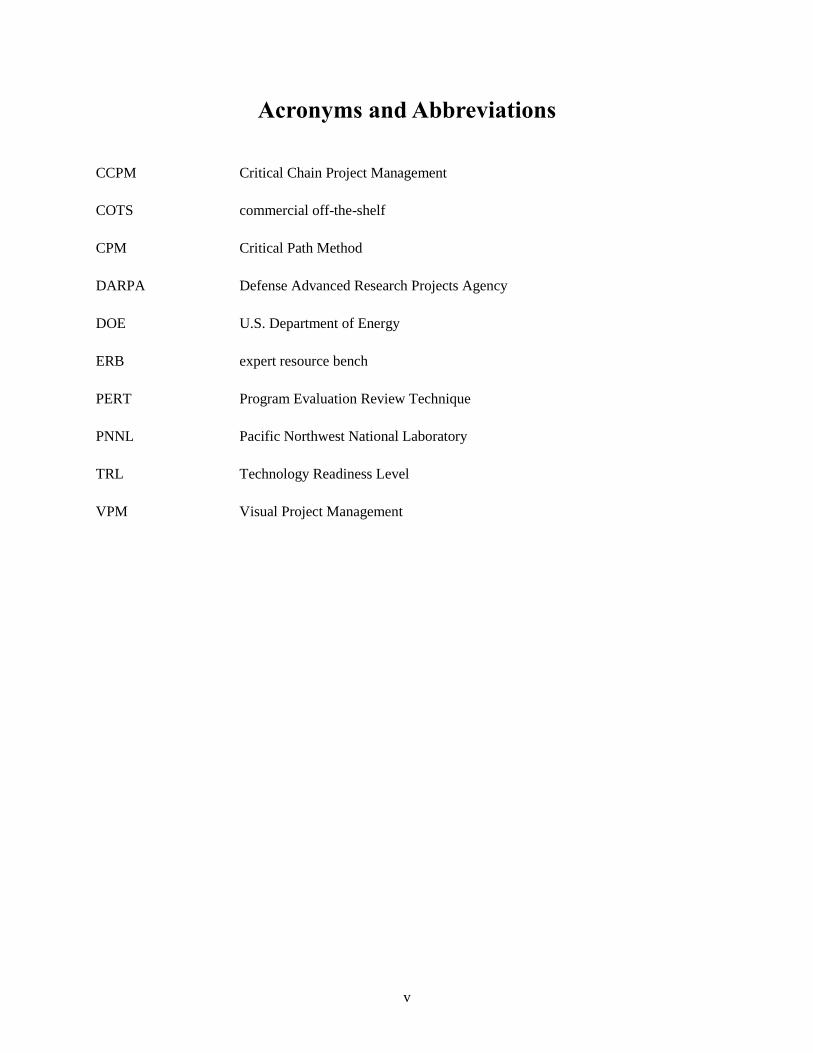
Acronyms and Abbreviations
CCPM Critical Chain Project Management
COTS commercial off-the-shelf
CPM Critical Path Method
DARPA Defense Advanced Research Projects Agency
DOE U.S. Department of Energy
ERB expert resource bench
PERT Program Evaluation Review Technique
PNNL Pacific Northwest National Laboratory
TRL Technology Readiness Level
VPM Visual Project Management
vi
Table of Contents
Acknowledgment ........................................................................................................................... iii
Abstract .......................................................................................................................................... iv
Acronyms and Abbreviations ..........................................................................................................v
List of Figures ............................................................................................................................... vii
List of Tables ............................................................................................................................... viii
Dedication ...................................................................................................................................... ix
I. Introduction ...........................................................................................................................1
II. Background ...........................................................................................................................3
III. Method of Project Execution .................................................................................................7
IV. Implementation ....................................................................................................................15
V. Documented Findings ..........................................................................................................18
VI. Analysis and Evaluation ......................................................................................................25
VII. Conclusions and Recommendations ....................................................................................28
VIII. References ...........................................................................................................................30
IX. Additional Sources ..............................................................................................................31
X. Appendix .............................................................................................................................32
vii
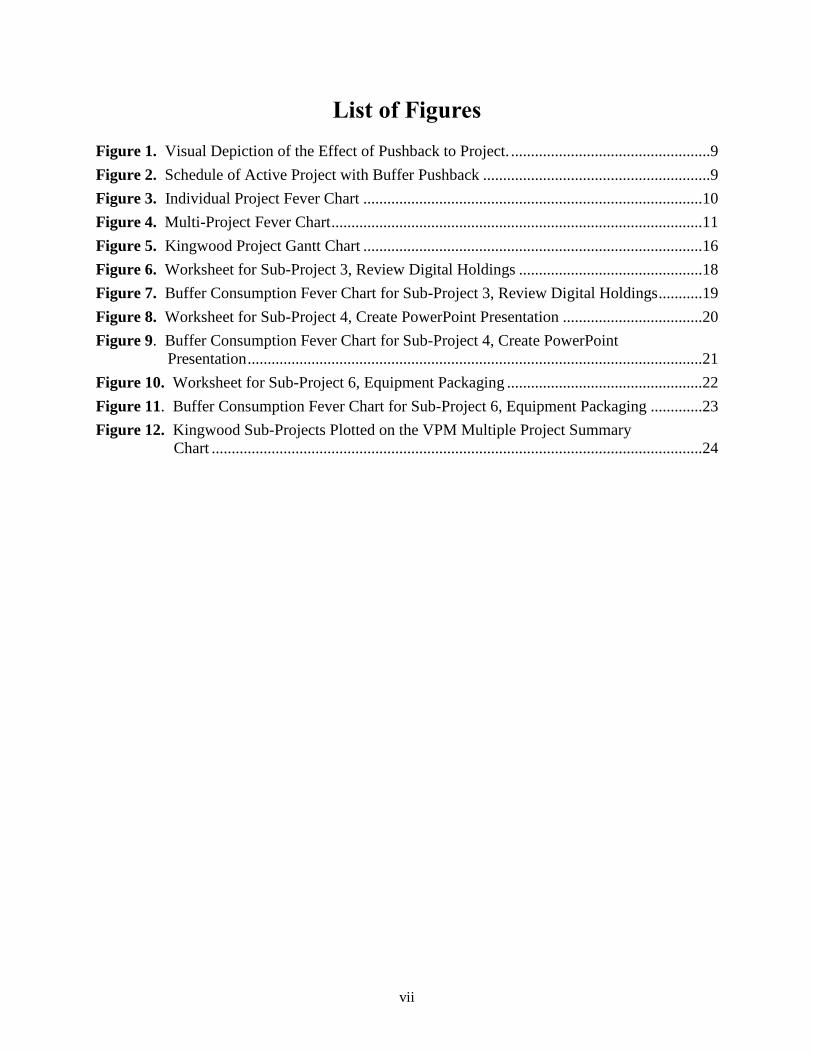
List of Figures
Figure 1. Visual Depiction of the Effect of Pushback to Project. ..................................................9
Figure 2. Schedule of Active Project with Buffer Pushback .........................................................9
Figure 3. Individual Project Fever Chart .....................................................................................10
Figure 4. Multi-Project Fever Chart .............................................................................................11
Figure 5. Kingwood Project Gantt Chart .....................................................................................16
Figure 6. Worksheet for Sub-Project 3, Review Digital Holdings ..............................................18
Figure 7. Buffer Consumption Fever Chart for Sub-Project 3, Review Digital Holdings ...........19
Figure 8. Worksheet for Sub-Project 4, Create PowerPoint Presentation ...................................20
Figure 9. Buffer Consumption Fever Chart for Sub-Project 4, Create PowerPoint
Presentation ..................................................................................................................21
Figure 10. Worksheet for Sub-Project 6, Equipment Packaging .................................................22
Figure 11. Buffer Consumption Fever Chart for Sub-Project 6, Equipment Packaging .............23
Figure 12. Kingwood Sub-Projects Plotted on the VPM Multiple Project Summary
Chart ...........................................................................................................................24

viii
List of Tables
Table 1. Comparison of Traditional Project Management and Critical Chain Project
Management Methods. (Process Quality Associates Inc. 2006). ...................................5

ix
Dedication
This Masters of Engineering & Technology Management Engineering Report
is dedicated to Shana, my wife.
Thank you for all your support and belief
that I can achieve this milestone in my education.
1
I. Introduction
The Kingwood project was designed to be a technology transfer project. Researchers at Pacific
Northwest National Laboratory (PNNL) created a unique capability to employ an unmanned
helicopter for specific reconnaissance missions to assess ground conditions at forward locations
without placing humans in harm‟s way. The researchers integrated several commercial-off-the-
shelf (COTS) products, numerous sensors, and a series of custom electro-mechanical systems
designed and fabricated at the Laboratory. Over the course of the three-year development, the
deliverable system had several spiral developments to increase its capability and reliability to a
Technology Readiness Level 4/5 (U.S. Department of Defense 2009). With the research and
development phase of the project completed, the resulting technology was to be transferred to
another U.S. government organization for field hardening and deployment.
The author of the engineering report is the project manager of the Kingwood Technology
Transfer project. The project was initiated in November 2010. The project‟s schedule for the
transfer allowed for a maximum timeframe of 10 months. The project had a very limited budget
to accomplish the technology transfer. Because of the limited budget, the project manager used a
recently developed management system that proved to be extremely efficient. The new
management approach, Visual Project Management, or VPM required minimal overhead, yet it
provided an accurate assessment of the status of the project and a method to know if a task was
on track or falling behind (Holt 2011a).
VPM is based on the established Theory of Constraints - Critical Chain Project Management
(CCPM) philosophy (Holt 2011b). VPM was developed by Dr. James Holt, an international
speaker and consultant on applications of Theory of Constraints. Dr. Holt is also a professor at
2
Washington State University in the University‟s Engineering & Technology Management
Masters Degree program. VPM uses the strengths of CCPM while reducing the extensive
managerial attention and complex computer software of CCPM. The VPM philosophy is
founded on the following management control systems: a firm and aggressive schedule; frequent
status updates; and a visual-based project status fever chart. VPM benefits from the use of the
expert resource bench concept.
Based on the academic demonstrations of VPM, the PNNL project manager chose to implement
VPM to manage the Kingwood project. The goal was to determine if the VPM methodology is a
robust, efficient management tool capable of achieving the deliverable within the limited budget.
3
II. Background
PNNL is a multi-program national laboratory within the U.S. Department of Energy (DOE)
national laboratory complex. PNNL routinely executes approximately 2,400 projects a year for
DOE and a wide variety of other U.S. government agencies. Most of the projects are fiscal-year-
based and have a period of performance of 9 to 12 months. PNNL is organized according to its
areas of research focus, on national security, energy and environment, and computational and
fundamental science. The Laboratory has built its reputation on responding to clients‟ unique
technical challenges and delivering innovative solutions in a timely manner.
PNNL is a matrixed organization that allows project managers to reach across the research
directorates to access scientists and engineers to solve clients‟ “DARPA Hard”1 problems. The
matrixed structure, while facilitating multidisciplinary teams, lends itself to unique management
challenges. One of the management challenges is that scientists and engineers often work on
multiple projects concurrently and support different project managers. Unfortunately, staff
members often have to divide their attention throughout the day to respond to the multiple
project demands. As a result, task durations increase because of the effort necessary to regain
focus each time the same task is restarted. A task with a two-week duration can easily expand to
two and a half or three weeks to complete as a result of reacquiring project focus. A second
effect of working multiple tasks concurrently is that the completion dates of all of the tasks are
delayed further than if each task were completed prior to starting the next task. This
phenomenon is known as bad multitasking (Fox 2007). The situation of working on multiple
projects concurrently is not unique to PNNL; it is ubiquitous throughout the government and the
1 "DARPA hard” is a set of technical challenges that, if solved, will be of enormous benefit to U.S. national security,
even if the risk of technical failure is high. (Defense Advanced Research Projects Agency. 2003).
4
private sectors. There is a critical need for a better way to manage projects and reduce the bad
multitasking.
If organizations could manage projects effectively and efficiently while greatly eliminating the
bad multitasking, they could complete the projects within a shorter period of time.
Accomplishing projects more quickly has numerous additional benefits including:
increasing project throughput within a given time period
building reputation for delivering projects within a reduced period of performance
increasing sales
increasing revenue.
Only a few new management techniques have evolved over the last 50 years. Notable
management techniques include: Program evaluation review technique (PERT), critical path
method (CPM), LEAN and Six-Sigma. These management tools greatly improve the systematic
execution of projects. Although widely used, these tools do not guarantee that neither a project‟s
individual tasks nor the overall project will be finished on schedule. Therefore, those who use
both PERT and CPM techniques embed significant schedule “safety buffers” in the individual
tasks to prevent slipping the overall project schedule.
In 1997, Eliyahu M. Goldratt developed Critical Chain Project Management (CCPM). This
project management technique has proven to be extremely effective by reducing the completion
time of projects by up to 50 percent and may also reduce the cost of the project when compared
5
to traditional management techniques (Process Quality Associates Inc. 2006). CCPM is
especially effective in multi-project environments.
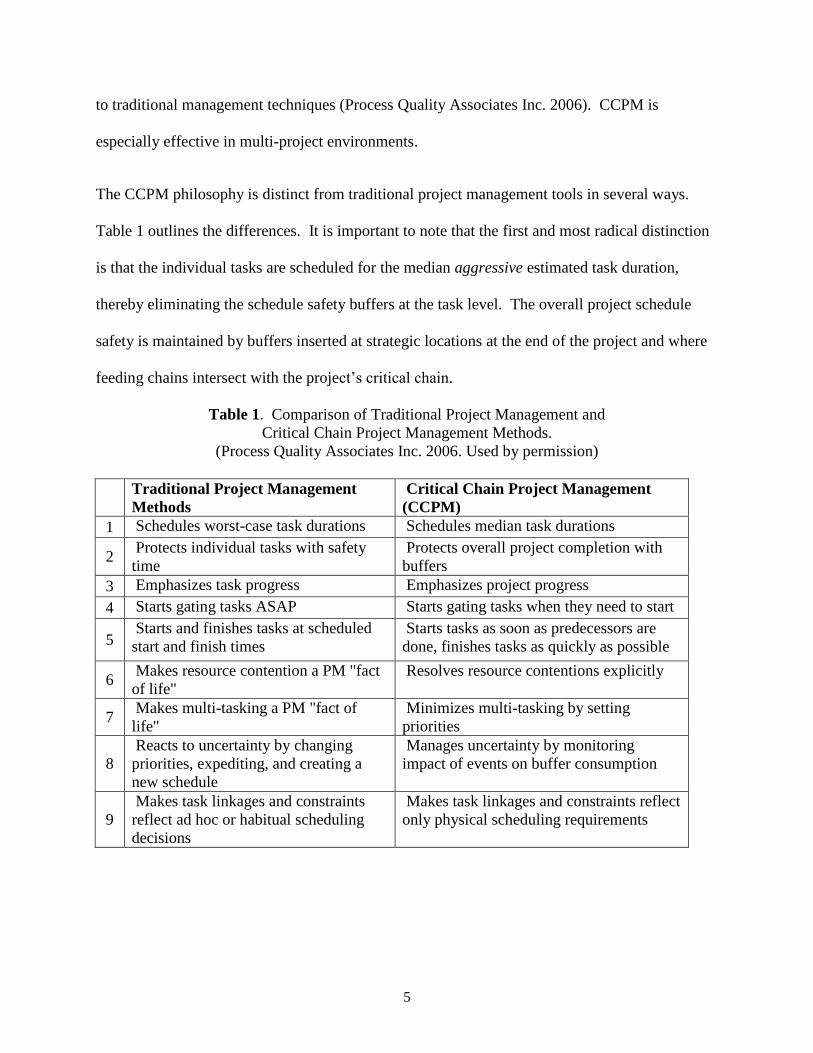
The CCPM philosophy is distinct from traditional project management tools in several ways.
Table 1 outlines the differences. It is important to note that the first and most radical distinction
is that the individual tasks are scheduled for the median aggressive estimated task duration,
thereby eliminating the schedule safety buffers at the task level. The overall project schedule
safety is maintained by buffers inserted at strategic locations at the end of the project and where
feeding chains intersect with the project‟s critical chain.
Table 1. Comparison of Traditional Project Management and
Critical Chain Project Management Methods.
(Process Quality Associates Inc. 2006. Used by permission)
Traditional Project Management
Methods
Critical Chain Project Management
(CCPM)
1 Schedules worst-case task durations Schedules median task durations
2 Protects individual tasks with safety
time
Protects overall project completion with
buffers
3 Emphasizes task progress Emphasizes project progress
4 Starts gating tasks ASAP Starts gating tasks when they need to start
5 Starts and finishes tasks at scheduled
start and finish times
Starts tasks as soon as predecessors are
done, finishes tasks as quickly as possible
6 Makes resource contention a PM "fact
of life"
Resolves resource contentions explicitly
7 Makes multi-tasking a PM "fact of
life"
Minimizes multi-tasking by setting
priorities
8
Reacts to uncertainty by changing
priorities, expediting, and creating a
new schedule
Manages uncertainty by monitoring
impact of events on buffer consumption
9
Makes task linkages and constraints
reflect ad hoc or habitual scheduling
decisions
Makes task linkages and constraints reflect
only physical scheduling requirements
6
While each of the existing project management tools has their strengths, they share the same
downfalls:
excessive complexity
very restrictive process
requirement for excessive management attention
extensive complex computer support and maintenance
overkill for the majority of day-to-day projects.
What is needed for many projects is a management tool that is simple to use, facilitates planning
a project and tracking the execution of the project, and accurately forecasts when a task or
project is jeopardizing the successful timely completion of the total project.
The Kingwood project was managed using a new project management tool, Visual Project
Management (VPM). VPM uses strengths of PERT, CPM, LEAN, Six-Sigma and CCPM while
maintaining a simple, straightforward management approach. This paper examines the benefits,
shortcomings and the lessons learned during the process implementing VPM in a real-world
project environment.
7
III. Method of Project Execution
The success of the Kingwood project depended on completion of the various technology transfer
tasks in an extremely efficient manner. The project manager also required a plan that could be
implemented with minimal effort, yet be robust enough to track the progress of many tasks and
forecast if a task would jeopardize the success of the technology transfer project. VPM was
chosen as the management tool to streamline the management process of this financially
constrained project.
The following is a brief summary of the VPM process and methodology. The first step in
implementing VPM is to create a plan for the project. The project plan may be a PERT plan,
CCPM plan, or even a list of tasks that need to be accomplished.
The second step is the creation of an aggressive schedule. The creation of an aggressive
schedule requires involving those who actually will be performing the work. It is important that
the task‟s aggressive schedule not contain task-level buffer time. Once the project plan and
schedule are established, they are to be held firm. The only reason for the plan to be altered is a
change in scope of more than 20%.
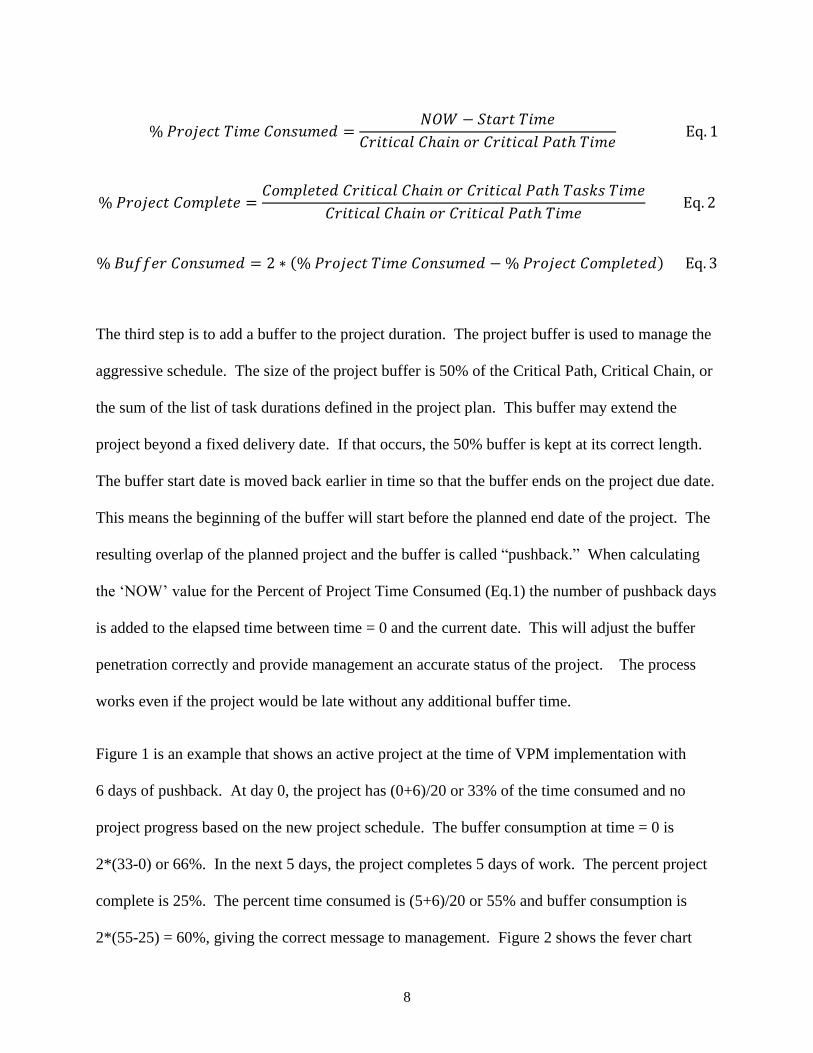
The VPM process is based on the following equations. The Percent of Project Time Consumed
(Eq.1), the Percent of Project Complete (Eq.2), and the buffer status expressed as Percent of
Buffer Consumed (Eq.3). It is possible that the calculated percent of project time consumed may
be greater than 100% if the project is running late.
8
( )
The third step is to add a buffer to the project duration. The project buffer is used to manage the
aggressive schedule. The size of the project buffer is 50% of the Critical Path, Critical Chain, or
the sum of the list of task durations defined in the project plan. This buffer may extend the
project beyond a fixed delivery date. If that occurs, the 50% buffer is kept at its correct length.
The buffer start date is moved back earlier in time so that the buffer ends on the project due date.
This means the beginning of the buffer will start before the planned end date of the project. The
resulting overlap of the planned project and the buffer is called “pushback.” When calculating
the „NOW‟ value for the Percent of Project Time Consumed (Eq.1) the number of pushback days
is added to the elapsed time between time = 0 and the current date. This will adjust the buffer
penetration correctly and provide management an accurate status of the project. The process
works even if the project would be late without any additional buffer time.
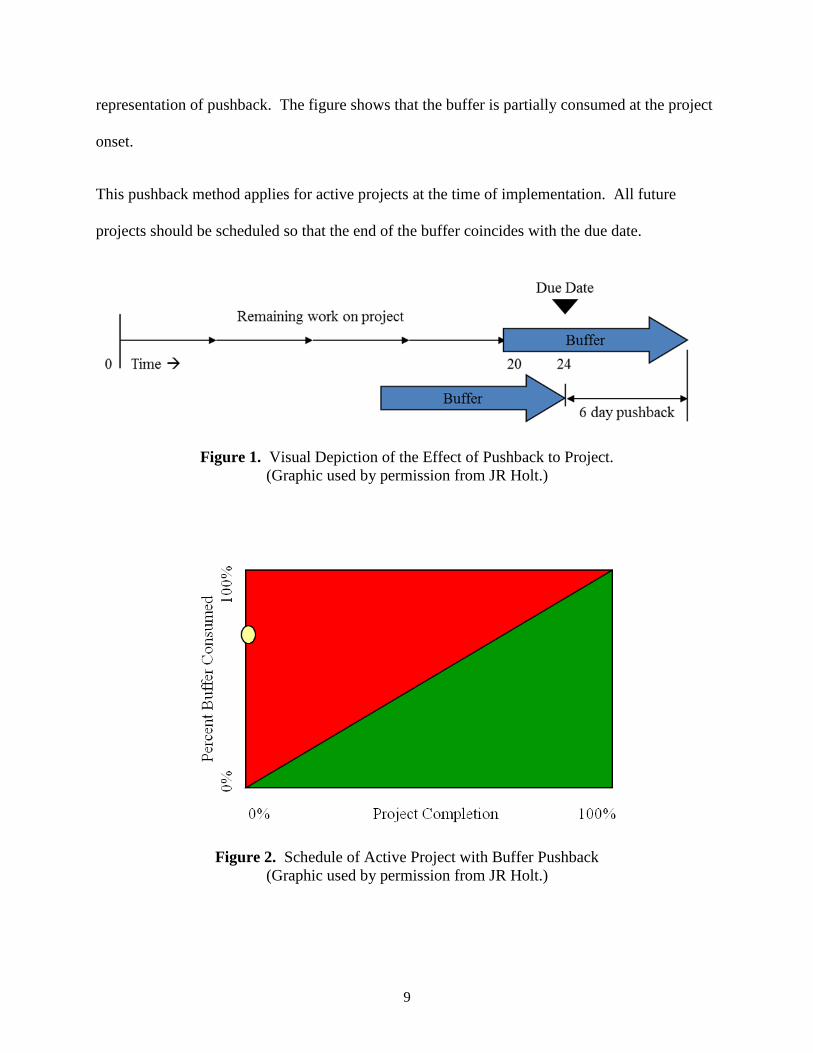
Figure 1 is an example that shows an active project at the time of VPM implementation with
6 days of pushback. At day 0, the project has (0+6)/20 or 33% of the time consumed and no
project progress based on the new project schedule. The buffer consumption at time = 0 is
2*(33-0) or 66%. In the next 5 days, the project completes 5 days of work. The percent project
complete is 25%. The percent time consumed is (5+6)/20 or 55% and buffer consumption is
2*(55-25) = 60%, giving the correct message to management. Figure 2 shows the fever chart
9
representation of pushback. The figure shows that the buffer is partially consumed at the project
onset.
This pushback method applies for active projects at the time of implementation. All future
projects should be scheduled so that the end of the buffer coincides with the due date.
Figure 1. Visual Depiction of the Effect of Pushback to Project.
(Graphic used by permission from JR Holt.)
Figure 2. Schedule of Active Project with Buffer Pushback
(Graphic used by permission from JR Holt.)
10
The fourth step involves picking one individual to be the project recorder. The project staff
sends frequent updates, on a predetermined basis, to the recorder. The recorder has access to the
original project plan showing each task‟s anticipated duration and completion dates. As the tasks
are reported complete, the recorder notes completion and the date on the project plan. If the task
is on the Critical Chain, Critical Path or list, the recorder calculates the following indicators
based on Equations 1-3.
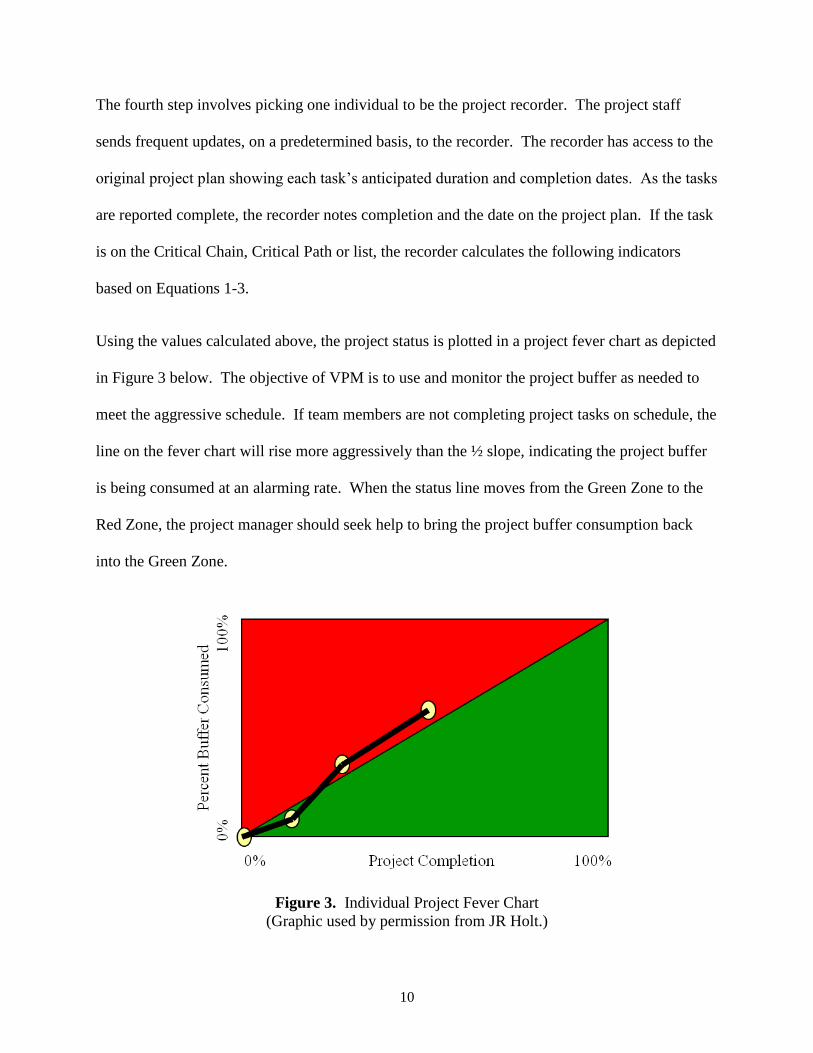
Using the values calculated above, the project status is plotted in a project fever chart as depicted
in Figure 3 below. The objective of VPM is to use and monitor the project buffer as needed to
meet the aggressive schedule. If team members are not completing project tasks on schedule, the
line on the fever chart will rise more aggressively than the ½ slope, indicating the project buffer
is being consumed at an alarming rate. When the status line moves from the Green Zone to the
Red Zone, the project manager should seek help to bring the project buffer consumption back
into the Green Zone.
Figure 3. Individual Project Fever Chart
(Graphic used by permission from JR Holt.)
11
Upon completing the status update in the VPM spreadsheet, the recorder prints out updated
status fever charts. These updated fever charts are forwarded to the project manager.
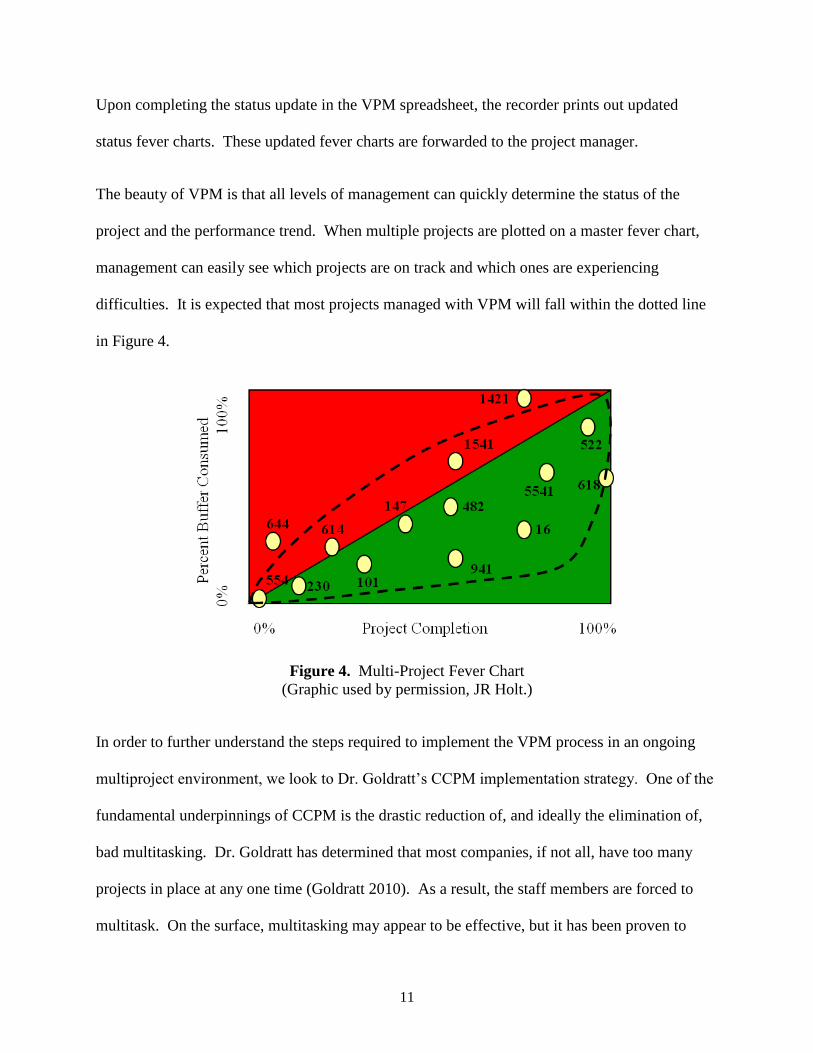
The beauty of VPM is that all levels of management can quickly determine the status of the
project and the performance trend. When multiple projects are plotted on a master fever chart,
management can easily see which projects are on track and which ones are experiencing
difficulties. It is expected that most projects managed with VPM will fall within the dotted line
in Figure 4.
Figure 4. Multi-Project Fever Chart
(Graphic used by permission, JR Holt.)
In order to further understand the steps required to implement the VPM process in an ongoing
multiproject environment, we look to Dr. Goldratt‟s CCPM implementation strategy. One of the
fundamental underpinnings of CCPM is the drastic reduction of, and ideally the elimination of,
bad multitasking. Dr. Goldratt has determined that most companies, if not all, have too many
projects in place at any one time (Goldratt 2010). As a result, the staff members are forced to
multitask. On the surface, multitasking may appear to be effective, but it has been proven to
12
cause queuing of project tasks and delaying of each project that the multitasking touches
(Lechler 2011; Santosus 2003). Multitasking effectively reduces employees‟ productivity and
may cause significant delays in project tasks. It is far more efficient to eliminate, or strictly
limit, employee‟s multitasking to focus on the tasks at hand until complete. If an employee
comes to a standstill because he is waiting on another team member, switching to another mini-
task that can be completed while waiting is productive. In contrast, stopping and starting tasks
before they can be logically handed off to another team member is grossly inefficient.
The fifth step involves the project manager meeting with upper management to establish an
expert resource bench (ERB). The ERB is composed of the best, brightest, and the most
innovative 10% of staff. These individuals should have good communication skills paired with a
history of innovative problem solving.
The ERB could be viewed as a kind of special weapons and tactics (SWAT) team responsible for
improving the project deliverables, providing a fresh perspective to project dilemmas, and
improving system processes. They spend time, as needed, observing the processes, functions,
and tasks of employees, looking for inefficiencies, discussing project technical challenges and
thinking about better methods of accomplishing the tasks. While the projects are in the Green
Zone, the ERB‟s task is to not interfere with the project but, rather, to watch, think about and
discuss the existing or potential problems and the corresponding solutions. They address
questions like:
Why is the buffer being consumed rapidly without progress?
What is the underlying problem?
How can we improve the system?
13
In a research and development environment, they may also address technical roadblocks and how
to overcome them.
If the project enters the Red Zone, the ERB is called in for direct assistance. The ERB is
management‟s first line of defense. It is empowered to address the problems and move the
project back into the Green Zone. The first questions the ERB asks the project team are:
“What are you waiting for?” and, “How can we help you?” If those answers and corresponding
solutions don‟t bring the project back towards the Green Zone, ERB members address the
underlying systemic or technical problems. They are also the first responders or the subject
matter experts, mentors, or trainers who come and help or teach with just-in-time instruction to
those ready to learn.
Management may be hesitant to assign such valuable employees to the ERB. They may fear that
they will not recover the cost of losing their best employees from their other tasks. In order to
put this recommendation into perspective, let us consider the following. A project that is worth
doing has both high monetary and utility values to both the company and the customer. With
that premise in mind, the value of the project should be considered the driving measure in
pursuing the project, not just the cost to the company including the ERB members. In most, if
not all projects, the value of completing the project is usually multiple times the cost of the
project. If it is not, management should examine the motivation of starting or continuing the
project.
The second consideration is when management is involved in the right way, and the ERB is in
place, delays will be reduced. Bad multitasking within the company decreases. Task durations
are shortened, resulting in projects moving quickly and more predictably, ultimately resulting in
14
on-time delivery; something that adds significant value to the projects. Companies that
implement CCPM, upon which VPM is founded, routinely reduce the project completion time by
50% (Process Quality Associates Inc. 2006). By completing projects quickly, more projects will
be completed in the same amount of time thereby generating more profit.
The third consideration is that the company culture will experience a paradigm shift. The culture
will shift from solely a financial focus to that of a mind-trust where the experience of the best
and brightest employees is used to enhance products and generate new innovations and
breakthroughs. Mentoring will become a part of the culture. Being exposed to mentoring,
innovative, and problem-solving senior employees, can assist the organization in achieving
higher goals.
The bottom line is that the financial gain from adopting VPM and the ERB is expected to far
outweigh the cost of the ERB. If needed, the direct cost of the ERB could be incorporated into
the company‟s overhead structure as a vital part of the management team.
15
IV. Implementation
The VPM philosophy, as described above, allows for project managers to plan and efficiently
track projects. As VPM is a new project management approach, one wonders if it is robust
enough to be beneficial in the day-to-day world of project management. To answer that
question, the Kingwood project manager put VPM to the test. VPM is designed to “…keep
things moving, maintain focus on the important elements, yield predictable completion, and
enable workers to deliver quality at every step….” (Holt and Srinivasan 2011). VPM assumes
that projects need to be done as quickly and efficiently as possible and the technical team moves
on to the next project. The Kingwood project did not fit into the standard paradigm of the VPM
philosophy because it had a very relaxed time schedule. However, the project was financially
constrained and only a limited number of man-hours could be charged against the budget. In
order to conserve funds, each of the project‟s tasks were viewed as “team sprints” where the staff
members would dedicate themselves to accomplishing the task in a short amount of time and
then have a reprieve until the next focused activity. The approach of focused “team sprints” is an
example of good multitasking that is well-planned and coordinated. This “team sprint” approach
was possible because most of the tasks did not have complex interdependencies and were
sequential with minimal tasks running in parallel. In order to capitalize on VPM‟s strength of
managing projects to an aggressive schedule, the project manager decided to use VPM to
manage each task as a sub-project. Each of the sub-projects was graphed on a master VPM fever
chart.
In order to give the new management approach a fair evaluation, the project manager explained
to the small, multidisciplinary project team the VPM philosophy. This process allowed
discussion and cautious buy-in from the team. The project team outlined the sub-projects
16
required to complete the project. Although skeptical, the team needed to develop an aggressive
schedule for the project‟s individual sub-projects and to add a 50% buffer for each. The
successful completion of the project demanded that the sub-projects be completed quickly and
efficiently.
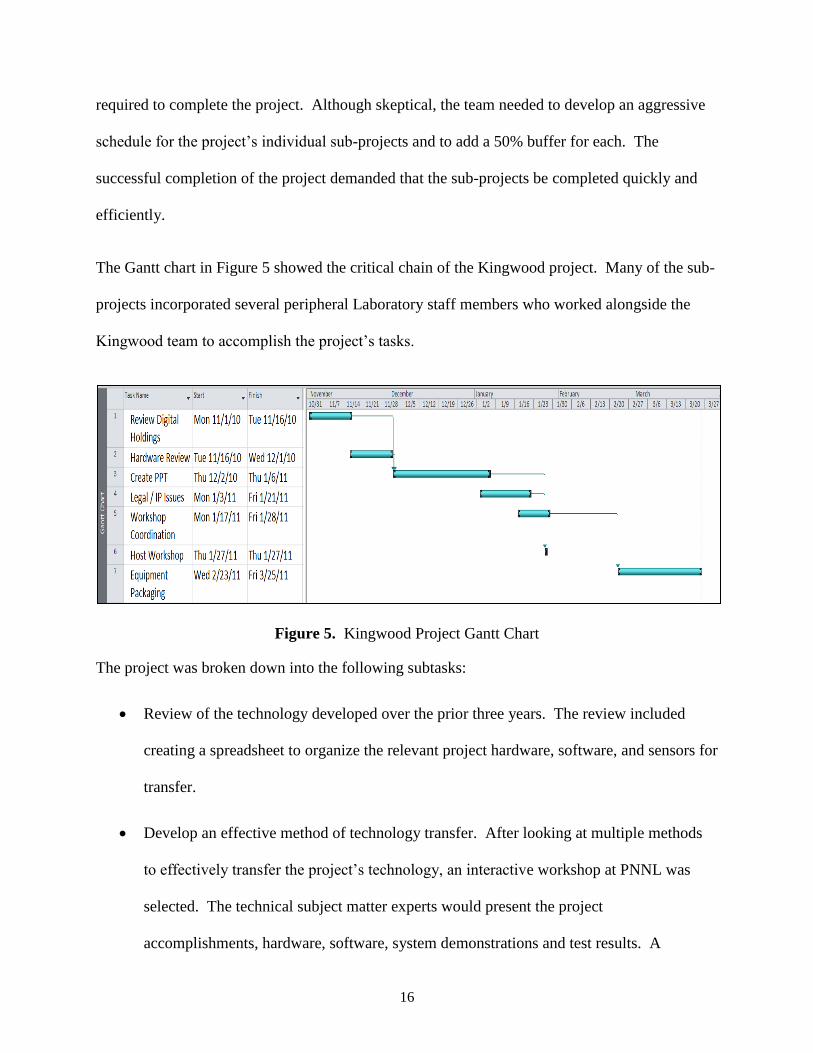
The Gantt chart in Figure 5 showed the critical chain of the Kingwood project. Many of the sub-
projects incorporated several peripheral Laboratory staff members who worked alongside the
Kingwood team to accomplish the project‟s tasks.
Figure 5. Kingwood Project Gantt Chart
The project was broken down into the following subtasks:
Review of the technology developed over the prior three years. The review included
creating a spreadsheet to organize the relevant project hardware, software, and sensors for
transfer.
Develop an effective method of technology transfer. After looking at multiple methods
to effectively transfer the project‟s technology, an interactive workshop at PNNL was
selected. The technical subject matter experts would present the project
accomplishments, hardware, software, system demonstrations and test results. A
17
PowerPoint®2 presentation covering the technology advances, hardware demonstrations
and technical reports would be used to support the workshop objectives.
Collect digital design documentation. The digital mechanical, electrical and software
design files were collected and packaged for transfer.
Address legal issues. Project management worked with the legal and intellectual
property departments to address and resolve potential issues.
Host the technology transfer workshop.
Package and ship the Kingwood equipment.
As the Kingwood project was a small-scale pilot implementation of VPM, the project did not
have a dedicated ERB. As such, the project manager and the principal investigator acted as their
own ERB.
The project was initiated with determination and focus. Each of the sub-projects was tracked
frequently and regularly (daily, if the sub-project was less than a week or weekly if a longer
duration). The status information was plotted on the fever charts to determine if the sub-project
was in the Green or Red Zone of the fever chart. If the sub-project was in the Green Zone, the
manager shared his appreciation for the diligent work. If the sub-project was in the Red Zone,
the manager and the principle investigator, acting as the ERB, would determine what was
causing the delay and work with the team to provide the needed assistance to get the task back
into the Green Zone.
2 PowerPoint is registered trademark of Microsoft.
18
V. Documented Findings
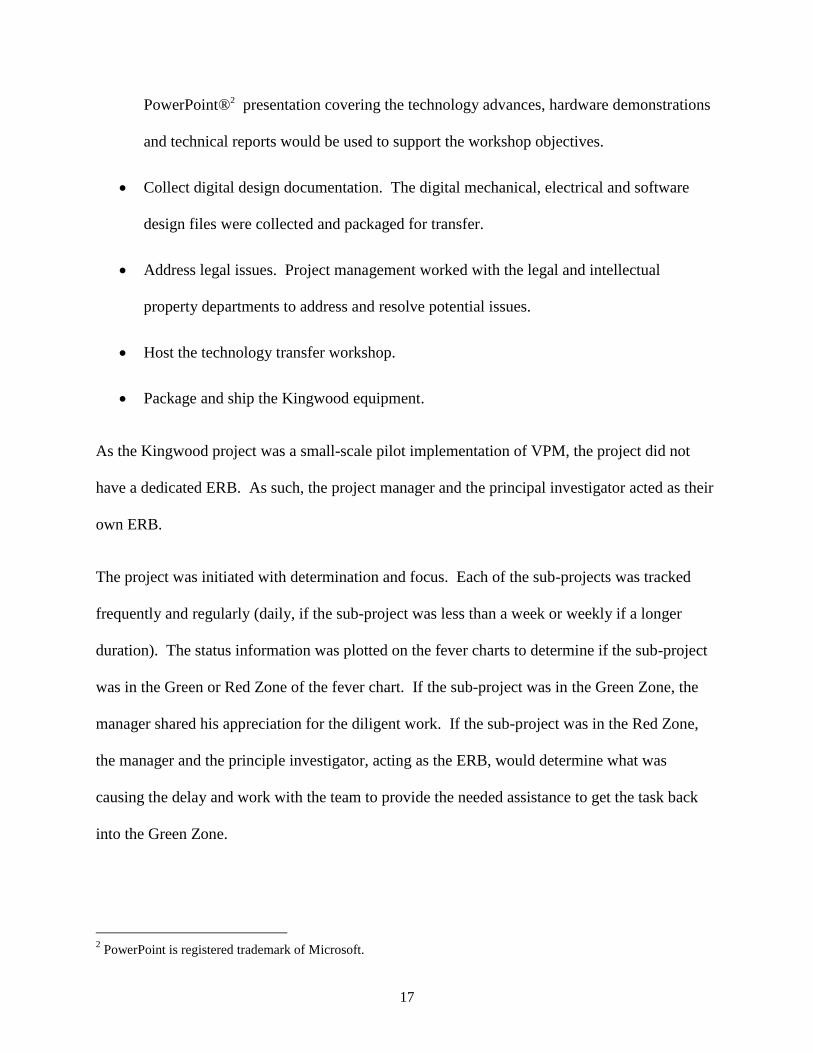
Below are examples of VPM worksheets and fever charts for the sub-project “sprints” within the
Kingwood project. The first example (Figures 6 and 7) is of a sub-project lifecycle that visually
depicts how it operated within the Green Zone. Technical progress was accomplished according
to plan and the sub-project buffer was consumed at an appropriate rate. The tasks were started
by the suggested start date and were accomplished on time.
Figure 6. Worksheet for Sub-Project 3, Review Digital Holdings
Visual Project Management Excel Macro.
(Used by permission from JR Holt.)3
3 Visual Project Management Excel macro is available from JR Holt, [email protected].

19
Figure 7. Buffer Consumption Fever Chart for Sub-Project 3, Review Digital Holdings
Visual Project Management Excel Macro.
(Used by permission from JR Holt.)
-20%
0%
20%
40%
60%
80%
100%
120%
0% 20% 40% 60% 80% 100%
Buff
er C
onsu
mpti
on
Percent Complete
Review Digital Holdings
Buffer Penetration
20
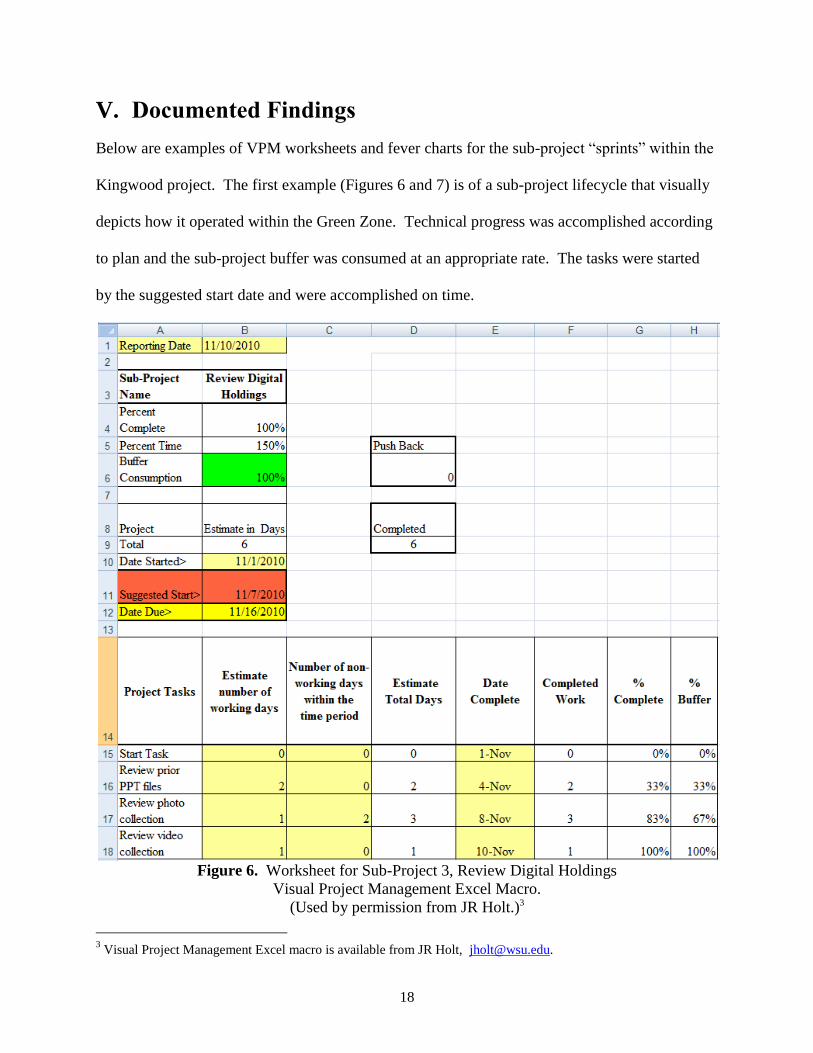
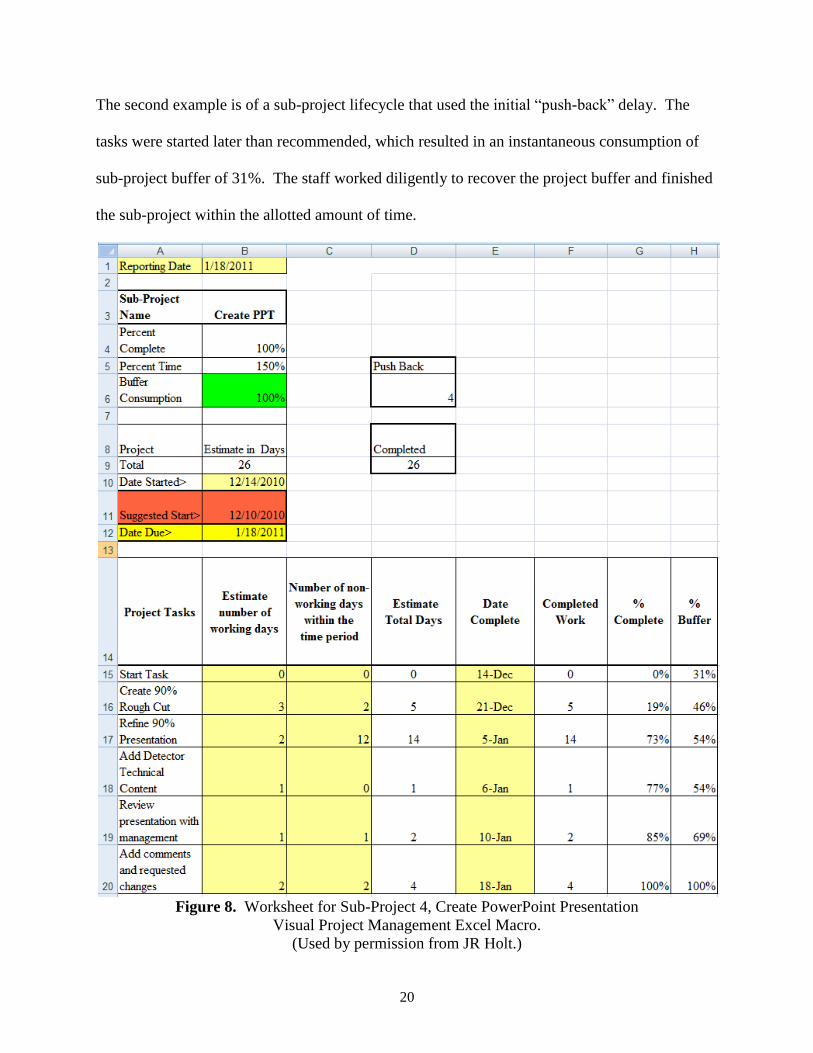
The second example is of a sub-project lifecycle that used the initial “push-back” delay. The
tasks were started later than recommended, which resulted in an instantaneous consumption of
sub-project buffer of 31%. The staff worked diligently to recover the project buffer and finished
the sub-project within the allotted amount of time.
Figure 8. Worksheet for Sub-Project 4, Create PowerPoint Presentation
Visual Project Management Excel Macro.
(Used by permission from JR Holt.)
21
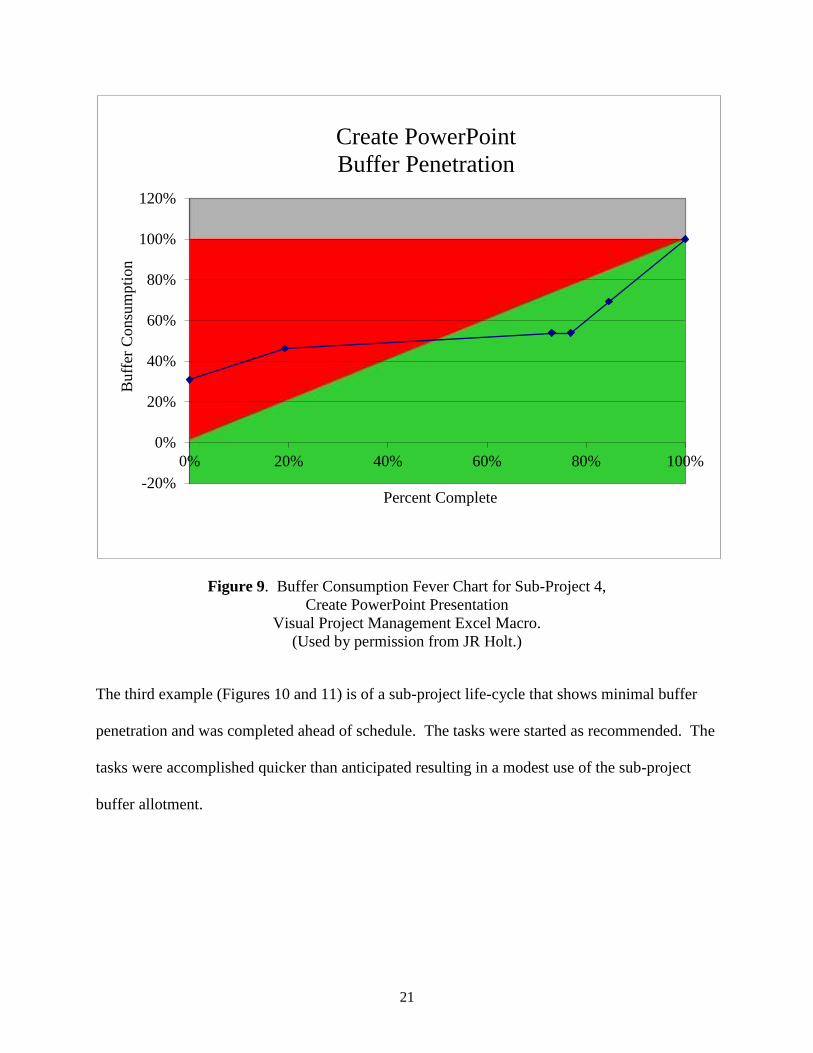
Figure 9. Buffer Consumption Fever Chart for Sub-Project 4,
Create PowerPoint Presentation
Visual Project Management Excel Macro.
(Used by permission from JR Holt.)
The third example (Figures 10 and 11) is of a sub-project life-cycle that shows minimal buffer
penetration and was completed ahead of schedule. The tasks were started as recommended. The
tasks were accomplished quicker than anticipated resulting in a modest use of the sub-project
buffer allotment.
-20%
0%
20%
40%
60%
80%
100%
120%
0% 20% 40% 60% 80% 100%
Buff
er C
onsu
mpti
on
Percent Complete
Create PowerPoint
Buffer Penetration
22
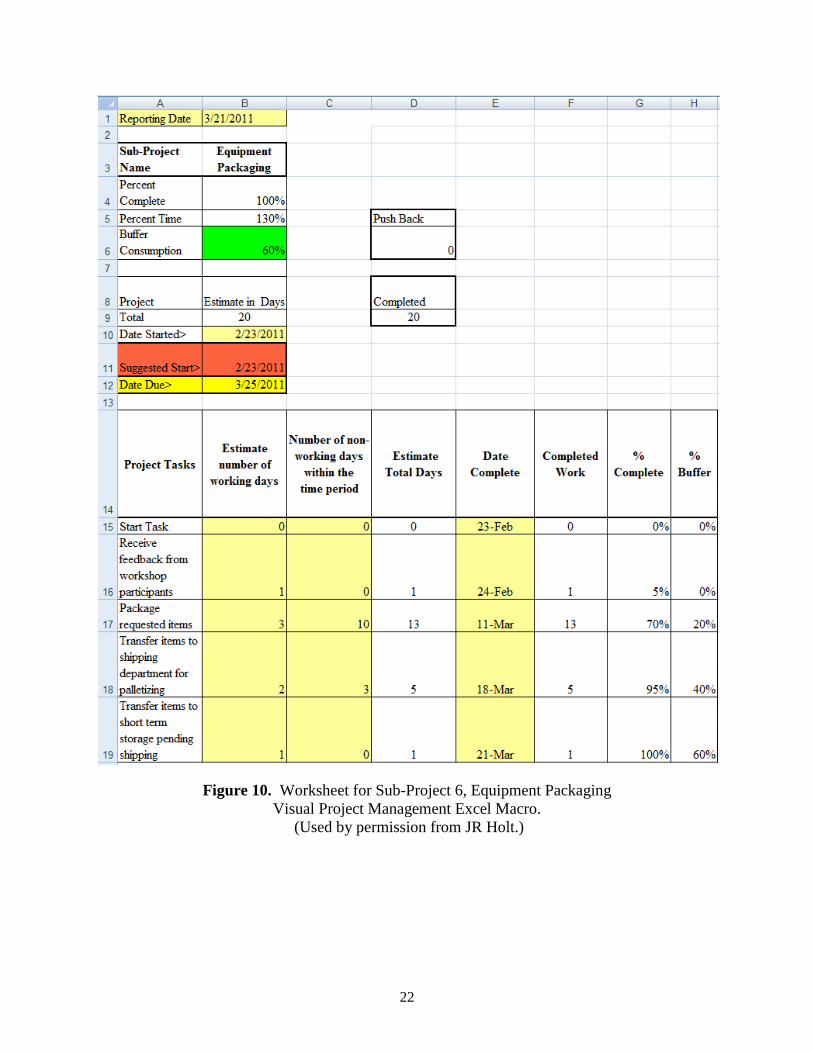
Figure 10. Worksheet for Sub-Project 6, Equipment Packaging
Visual Project Management Excel Macro.
(Used by permission from JR Holt.)
23
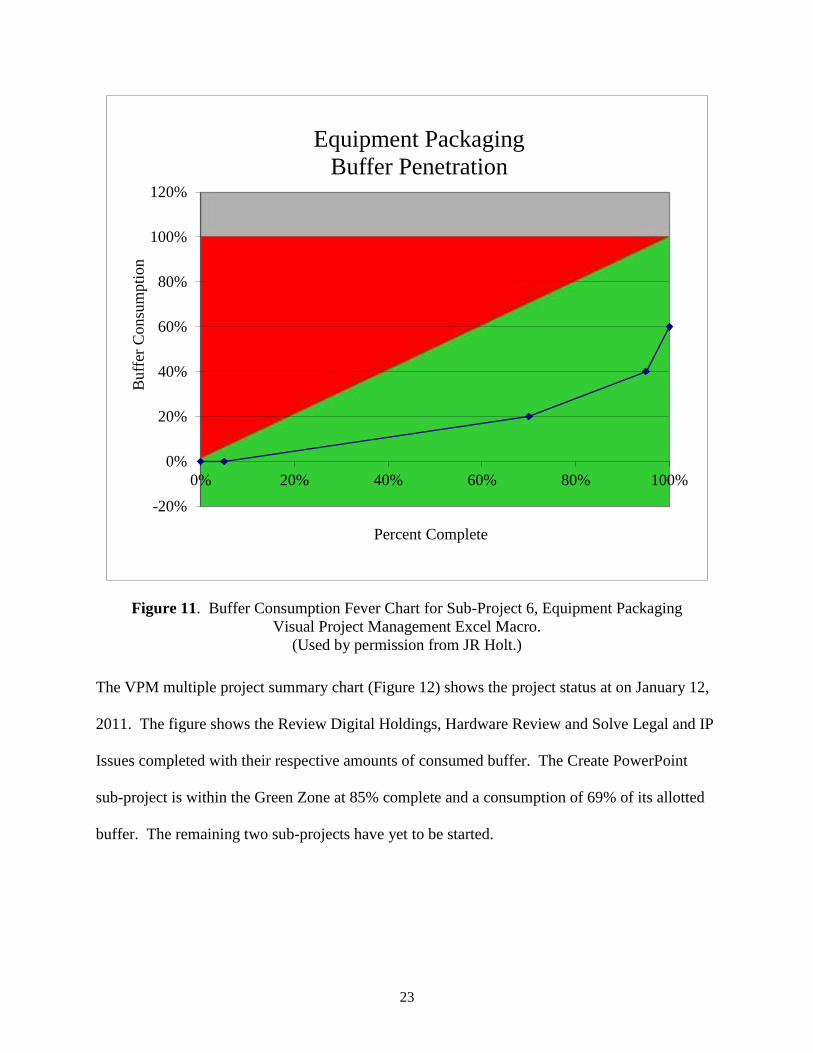
Figure 11. Buffer Consumption Fever Chart for Sub-Project 6, Equipment Packaging
Visual Project Management Excel Macro.
(Used by permission from JR Holt.)
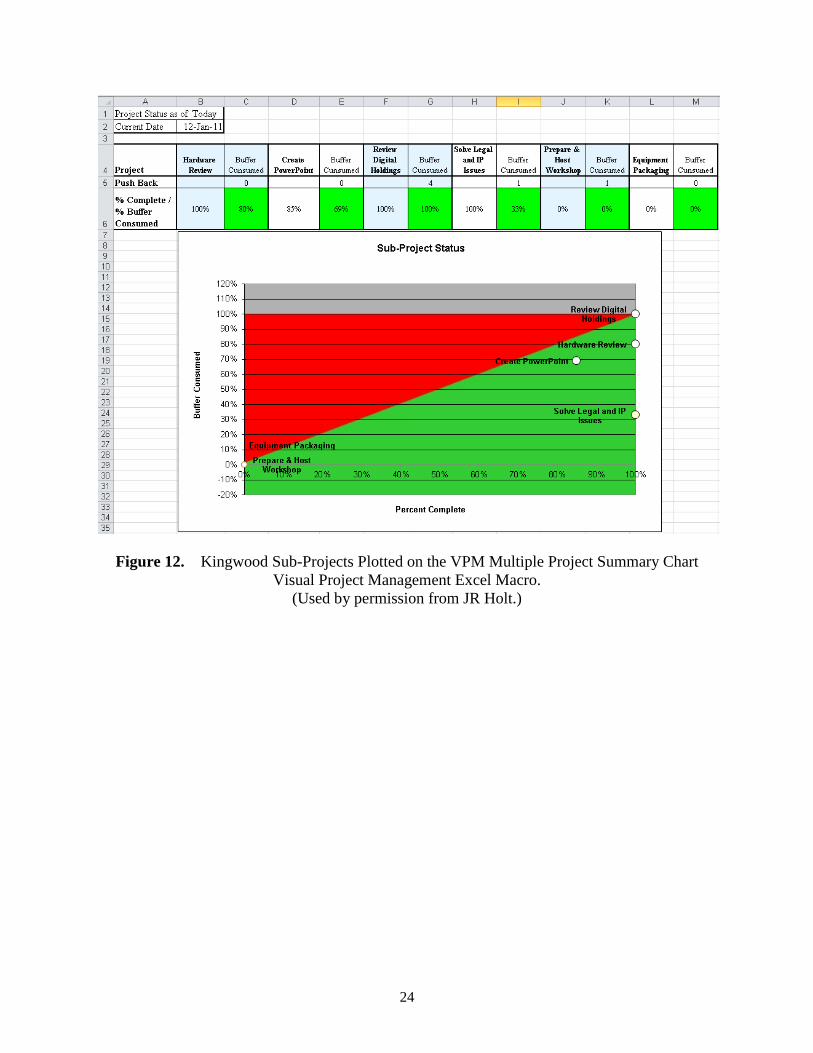
The VPM multiple project summary chart (Figure 12) shows the project status at on January 12,
2011. The figure shows the Review Digital Holdings, Hardware Review and Solve Legal and IP
Issues completed with their respective amounts of consumed buffer. The Create PowerPoint
sub-project is within the Green Zone at 85% complete and a consumption of 69% of its allotted
buffer. The remaining two sub-projects have yet to be started.
-20%
0%
20%
40%
60%
80%
100%
120%
0% 20% 40% 60% 80% 100%
Bu
ffer
Consu
mpti
on
Percent Complete
Equipment Packaging
Buffer Penetration
24
Figure 12. Kingwood Sub-Projects Plotted on the VPM Multiple Project Summary Chart
Visual Project Management Excel Macro.
(Used by permission from JR Holt.)
25
VI. Analysis and Evaluation
During the Kingwood Project, the VPM tool worked well projecting the recommended start dates
for the sub-projects and incorporated the VPM 50% time buffer. If the project started on a date
later than the recommended date, the tool calculated the push-back value and adjusted the fever
chart appropriately. The Hardware Review, Review Digital Holdings, and Equipment Packaging
sub-projects started on time and remained in the Green Zone on the fever chart for the duration
of the task.
The VPM tool correctly calculated the push-back for the Create PowerPoint, Solve Legal and
Intellectual Property Issues, and the Prepare and Host Technology Transfer Workshop sub-
projects. In each case, the fever charts showed the sub-project was in trouble because of a late
start. Consequently, the project manager worked with the team to expedite the related tasks and
bring the project back into the Green Zone. In the case of the Legal and Intellectual Property
Issue sub-project, the manager and principal investigator (acting in the role of the ERB), worked
with the legal and intellectual property staff to accomplish the tasks by the required date.
The Equipment Packaging sub-project had the most relaxed project schedule of the sub-projects.
The low buffer consumption resulted from the longer delivery schedule. In hindsight, this sub-
project did not fit the VPM model as its tasks had not been aggressively scheduled.
The VPM multiple project summary chart was a quick and efficient method to assess and update
upper management and team members on the status of the Kingwood project. It combined the
sub-project‟s percent complete and percent of buffer consumed with a graphical representation is
a readily understandable format.
26
Based on the real-world trial of VPM on the Kingwood project, the project manager found the
tool to be an effective and efficient way to plan and manage a project. The fever chart, as a
reporting tool, was helpful to know when to allow the sub-projects to continue without project
management involvement and when to step in to address a problem.
The identification of bad multitasking and frequent requests to minimize bad multitasking
allowed the staff to remain focused on their tasks. The result was a relatively quick completion
of the required tasks and the project continued to move with minimal delays.
The project manager found some weaknesses with how the VPM spreadsheet managed non-
working and elapsed days, especially in short duration projects. The project manager added a
column in the spreadsheet to capture the non-working and elapsed days, but the automatic buffer
calculation did not take into account the non-working days in determining the buffer size. In
hindsight, the spreadsheet calculations could have been modified to incorporate the non-working
days.
The following are comments provided to the project manager regarding the Kingwood project
execution and the implementation of VPM within the project by PNNL management and clients.
“As a project contributor, I appreciate a management system that minimizes the inefficiencies
that have become widely accepted in a multi-tasking environment. As the principal investigator,
I view the ERB plan as a welcomed and intrinsically valuable part of VPM.” John Smart –
Kingwood Principle Investigator.
“The Kingwood transfer project, while small, was extremely important as it was key in the final
Kingwood product delivery. The project manager was able to use VPM to manage and track
27
resources with optimal results. Implementing VPM on the project made the best of a prior,
difficult situation and delivered results to the client. Credit should also go to the project manager
for recognizing the project challenges and coming up with a viable solution. It should be noted
that VPM is just a tool and still requires a skilled manager to use successfully.” Steven Sharpe –
PNNL client account manager.
“The use of Visual Project Management (VPM) facilitated for a smooth transition of all
technology associated with Kingwood project, starting with a presentation of all material which
included a video presentation demonstrating all of the equipment to be transferred and hands-on
demonstrations. Prior to the equipment transfer, detailed inventory sheets were provided to the
receiving agency in a timely manner. The inventory sheets made possible the efficient tracking
of the transferred material. I found this process promoted better time management and reduced
expenditures.” Jon A. – Funding client within the U.S. government organization responsible for
field hardening and deployment of the Kingwood technology.
“The Kingwood Technology Transfer project was initiated in November 2010. The project
manager used Visual Project Management to plan and manage the project. He developed a
transition plan, summarized the prior three years of research and organized a one day workshop.
The technology transfer workshop used a combination of presentations, technical discussions
with staff engineers, software and hardware demonstrations to train and inform the technology
stakeholders on the unmanned reconnaissance helicopter system. The training was very well
done and thorough. The technology transfer package included the Kingwood system‟s design
documentation/schematics to facilitate further development and hardening of the system. The
technology transfer project was a success and was accomplished within the allotted budget.”
U.S. Government Kingwood Project Funding client. Name withheld upon request.
28
VII. Conclusions and Recommendations
The Kingwood Technology Transfer project was successfully managed. The technology and
equipment developed over the three-year spiral development were transferred to a U.S.
government organization for field hardening and deployment. The Kingwood technical staff did
a remarkable job accomplishing the project within budget while delivering a high-quality
product.
Visual Project Management was instrumental in the planning of an aggressive schedule and
tracking the progress of the team. The approach of breaking the project into “team sprint” sub-
projects was effective. This approach was in harmony with VPM‟s rapid execution of each task
and quick project delivery. VPM mandates an extremely aggressive schedule with a project
level buffer to absorb delays in accomplishing tasks.
One of the strengths of VPM is the straightforward graph charting of the project‟s progress. The
fever charts and the multiple project summary chart allowed the project manager, staff, and
upper management to track the progress of the project‟s tasks frequently. The fever chart was an
effective visual tool for tracking the tasks‟ progress and determining how much of the project
buffer was being consumed. The fever chart also allowed the project manager to determine
when tasks were being delayed and to provide the required resources to get the task moving
forward again.
As part of the VPM philosophy, the project staff members were encouraged to minimize non-
productive multitasking. By staying focused on the tasks, positive momentum was maintained
and the tasks were accomplished quickly.
29
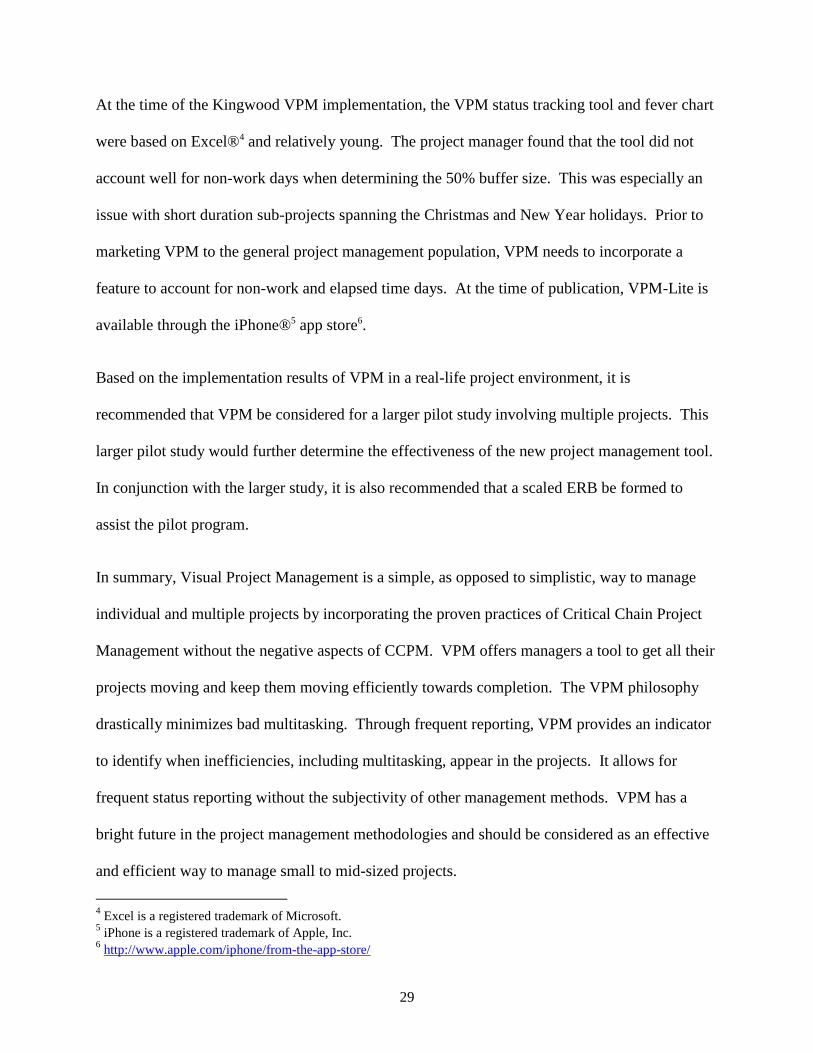
At the time of the Kingwood VPM implementation, the VPM status tracking tool and fever chart
were based on Excel®4 and relatively young. The project manager found that the tool did not
account well for non-work days when determining the 50% buffer size. This was especially an
issue with short duration sub-projects spanning the Christmas and New Year holidays. Prior to
marketing VPM to the general project management population, VPM needs to incorporate a
feature to account for non-work and elapsed time days. At the time of publication, VPM-Lite is
available through the iPhone®5 app store6.
Based on the implementation results of VPM in a real-life project environment, it is
recommended that VPM be considered for a larger pilot study involving multiple projects. This
larger pilot study would further determine the effectiveness of the new project management tool.
In conjunction with the larger study, it is also recommended that a scaled ERB be formed to
assist the pilot program.
In summary, Visual Project Management is a simple, as opposed to simplistic, way to manage
individual and multiple projects by incorporating the proven practices of Critical Chain Project
Management without the negative aspects of CCPM. VPM offers managers a tool to get all their
projects moving and keep them moving efficiently towards completion. The VPM philosophy
drastically minimizes bad multitasking. Through frequent reporting, VPM provides an indicator
to identify when inefficiencies, including multitasking, appear in the projects. It allows for
frequent status reporting without the subjectivity of other management methods. VPM has a
bright future in the project management methodologies and should be considered as an effective
and efficient way to manage small to mid-sized projects.
4 Excel is a registered trademark of Microsoft.
5 iPhone is a registered trademark of Apple, Inc.
6 http://www.apple.com/iphone/from-the-app-store/
30
VIII. References
Defense Advanced Research Projects Agency. (2003, February). Strategic Plan. Retrieved
September 25, 2011, from the DARPA website:
http://www.missilethreat.com/repository/doclib/20030200-DARPA-strategicplan.pdf
Department of Defense. (2009, July). Technology Readiness Assessment (TRA) Deskbook.
Retrieved October 2, 2011, from the DOD website:
http://www.dod.gov/ddre/doc/DoD_TRA_July_2009_Read_Version.pdf
Fox, K. (2007, July 27). Multi-Tasking: Why projects take so long and still go late. Retrieved
September 25, 2011, from the Theory of Constraints website:
http://theoryofconstraints.blogspot.com/2007/07/multi-tasking-why-projects-take-so-
long.html
Goldratt, E. M. (2010) Viable Vision Strategy & Tactic Trees. Retrieved November 15, 2011,
from the WSU EM 534 Contemporary Topics in Constraints Management website:
http://public.wsu.edu/~engrmgmt/holt/em534/SandT-Projects.pdf
Holt, J. R. (2011a, May). Visual Project Management: How to Get Things Done. Continuous
Process Improvement Symposium, Weber State University, Utah.
Holt, J. R., (2011b, June). Simplified Critical Chain Project Management, TOCICO Annual
Conference, Palisades, New York.
Holt, J. R., & Srinivasan, M. M., (2011, February). How to Get Things Done, Visual project
management shows the way, Retrieved September 18, 2011, from the APICS magazine
website:
http://bus.utk.edu/cba/news_articles/2011/documents/JF11_Reprint_Srinivasan_Holt.pdf
Lechler, T. Critical Chain: A New Project Management Paradigm or Old Wine in New Bottles?
(n.d.). Retrieved September 18, 2011, from the All Business website:
http://www.allbusiness.com/management/1054157-1.html
Process Quality Associates Inc. (2006) Differences Between Critical Chain (CCPM) &
Traditional Project Management. Retrieved November 6, 2011, from the Process Quality
Associates Inc website: http://www.pqa.net/ProdServices/ccpm/W05002003.html
Santosus, M. (2003, September 15) Multitasking Wastes Time and Money. Retrieved September
18, 2011, from the CIO website:
http://www.cio.com/article/29708/Multitasking_Wastes_Time_and_Money
31
IX. Additional Sources
Dettmer, W. H. (2007). The logical thinking process: A systems approach to complex problem
solving. Milwaukee: ASQC Quality Press.
Goldratt, E. M. (1997). Critical chain. Great Barrington: North River Press.
Goldratt, E. M. (1994). It’s not luck. Great Barrington: North River Press.
Goldratt, E. M. (2008). The choice. Great Barrington: North River Press.
Goldratt, E. M., Cox, J. (1994). The goal: A process of continuous improvement. 2nd
addition.
Great Barrington: North River Press.
Goldratt, E. M., Eshkoli, I, & Brownleer, J. (2009). Isn't it obvious: A Business Novel on
Retailing Using the Theory of Constraints. Great Barrington: North River Press.
Goldratt, E. M., Fox, R. (1986). The race. Great Barrington: North River Press.
Goldratt, E. M., Schragenheim, E, & Ptak, C. A. (2000). Necessary but not sufficient. Great
Barrington: North River Press.
Newbold, R. (2008). The billion dollar solution - Secrets of ProChain project management. Lake
Ridge: ProChain Press
32
X. Appendix
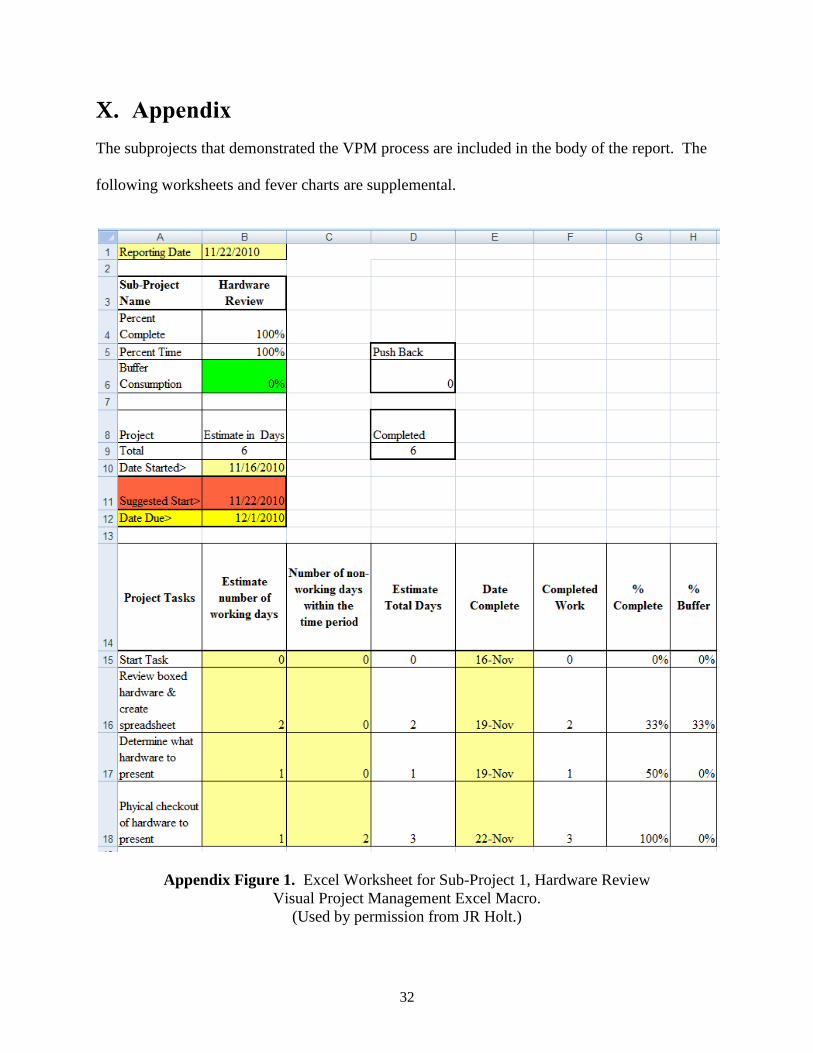
The subprojects that demonstrated the VPM process are included in the body of the report. The
following worksheets and fever charts are supplemental.
Appendix Figure 1. Excel Worksheet for Sub-Project 1, Hardware Review
Visual Project Management Excel Macro.
(Used by permission from JR Holt.)

33
Appendix Figure 2. Fever Chart for Sub-Project 1, Hardware Review.
Visual Project Management Excel Macro.
(Used by permission from JR Holt.)
-20%
0%
20%
40%
60%
80%
100%
120%
0% 20% 40% 60% 80% 100%
Bu
ffer
Con
sum
pti
on
Percent Complete
Hardware Review
Buffer Penetration
34
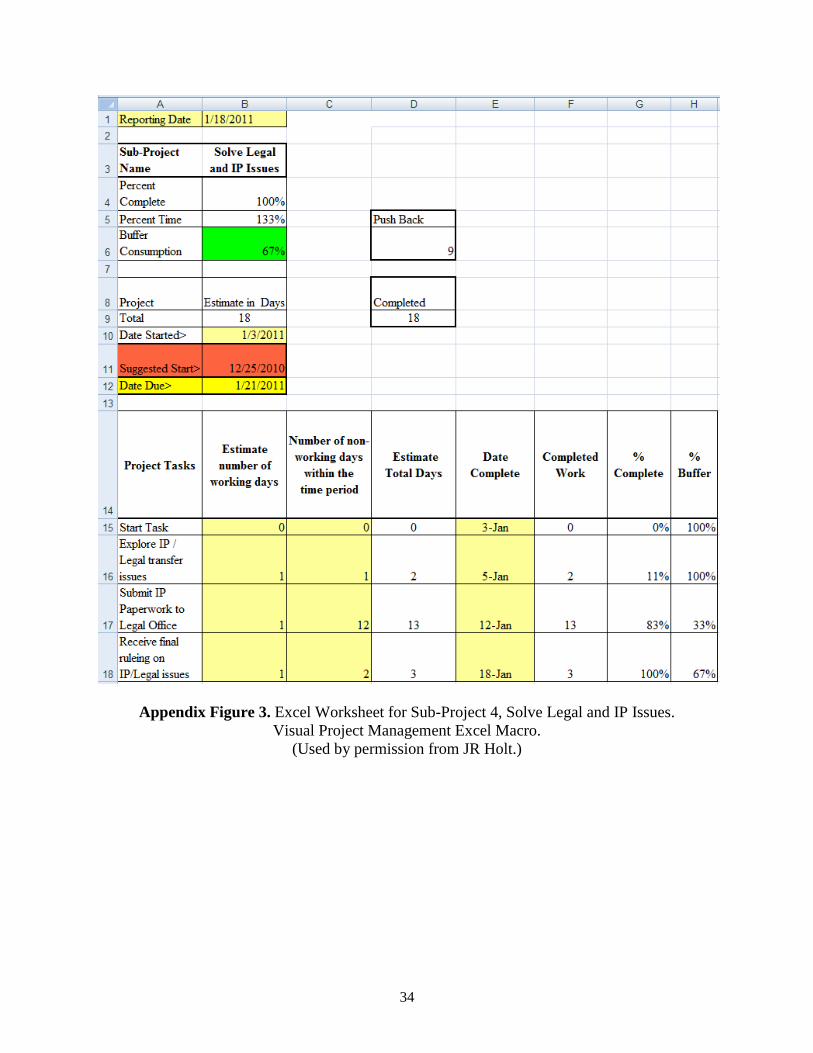
Appendix Figure 3. Excel Worksheet for Sub-Project 4, Solve Legal and IP Issues.
Visual Project Management Excel Macro.
(Used by permission from JR Holt.)
35
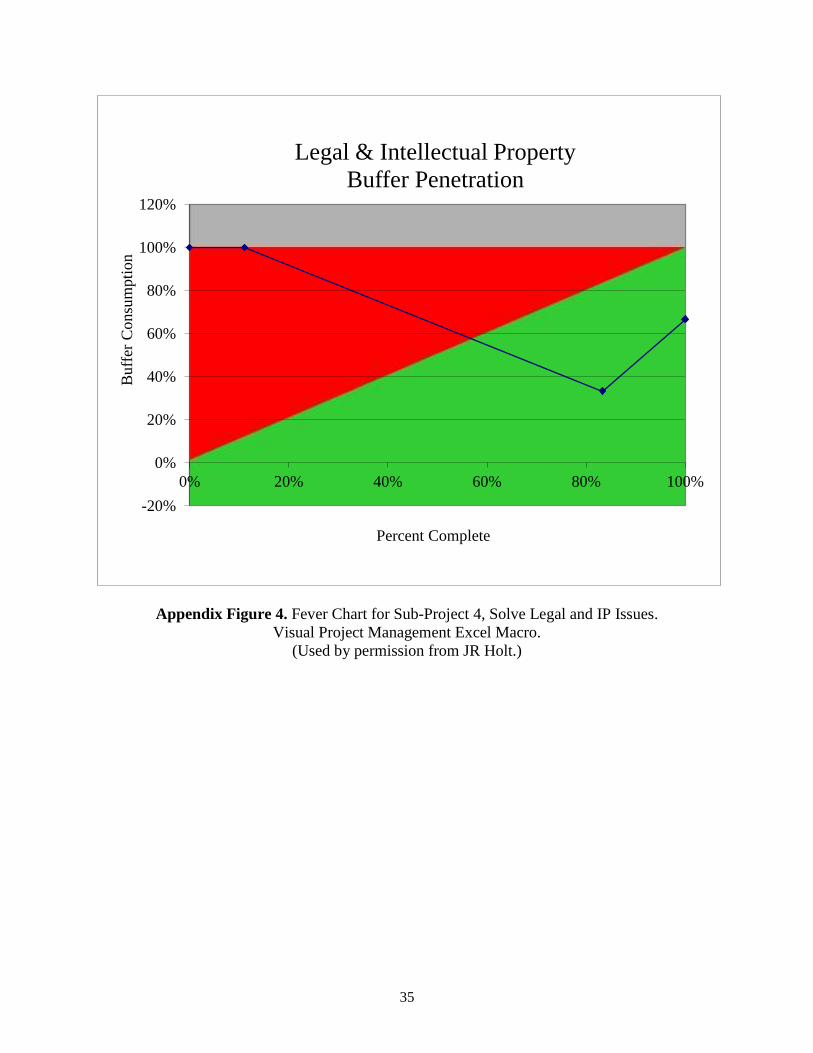
Appendix Figure 4. Fever Chart for Sub-Project 4, Solve Legal and IP Issues.
Visual Project Management Excel Macro.
(Used by permission from JR Holt.)
-20%
0%
20%
40%
60%
80%
100%
120%
0% 20% 40% 60% 80% 100%
Buff
er C
onsu
mpti
on
Percent Complete
Legal & Intellectual Property
Buffer Penetration
36
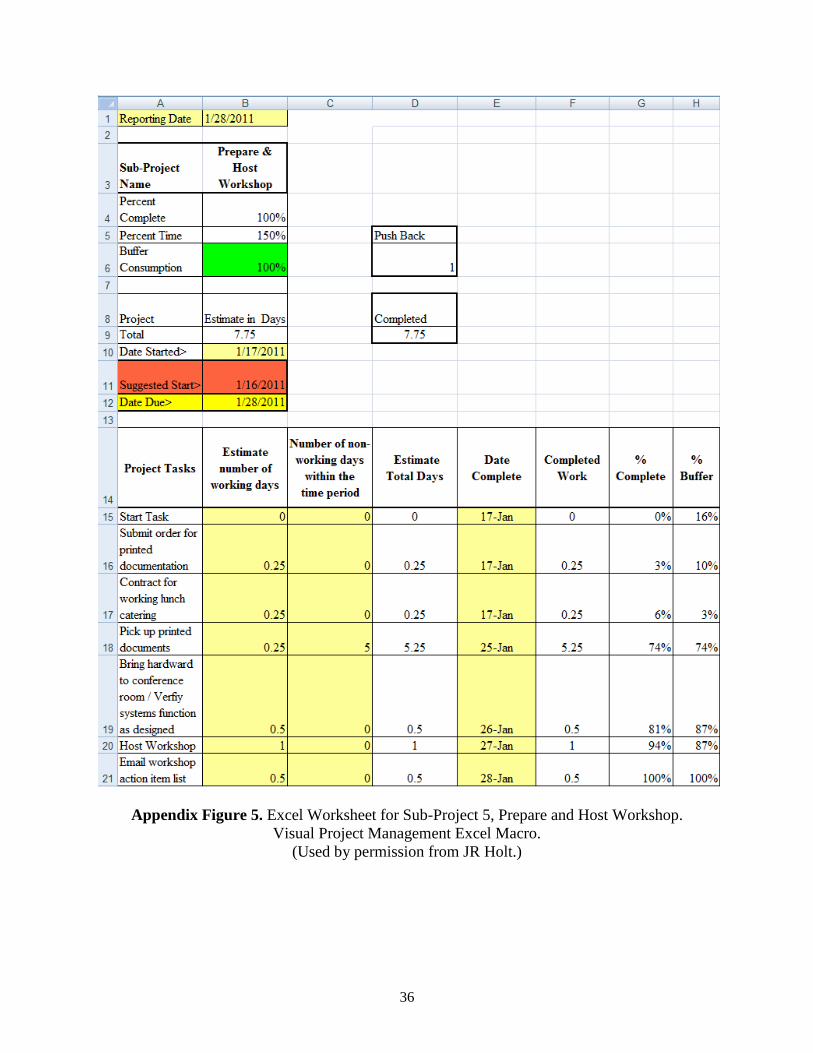
Appendix Figure 5. Excel Worksheet for Sub-Project 5, Prepare and Host Workshop.
Visual Project Management Excel Macro.
(Used by permission from JR Holt.)
37
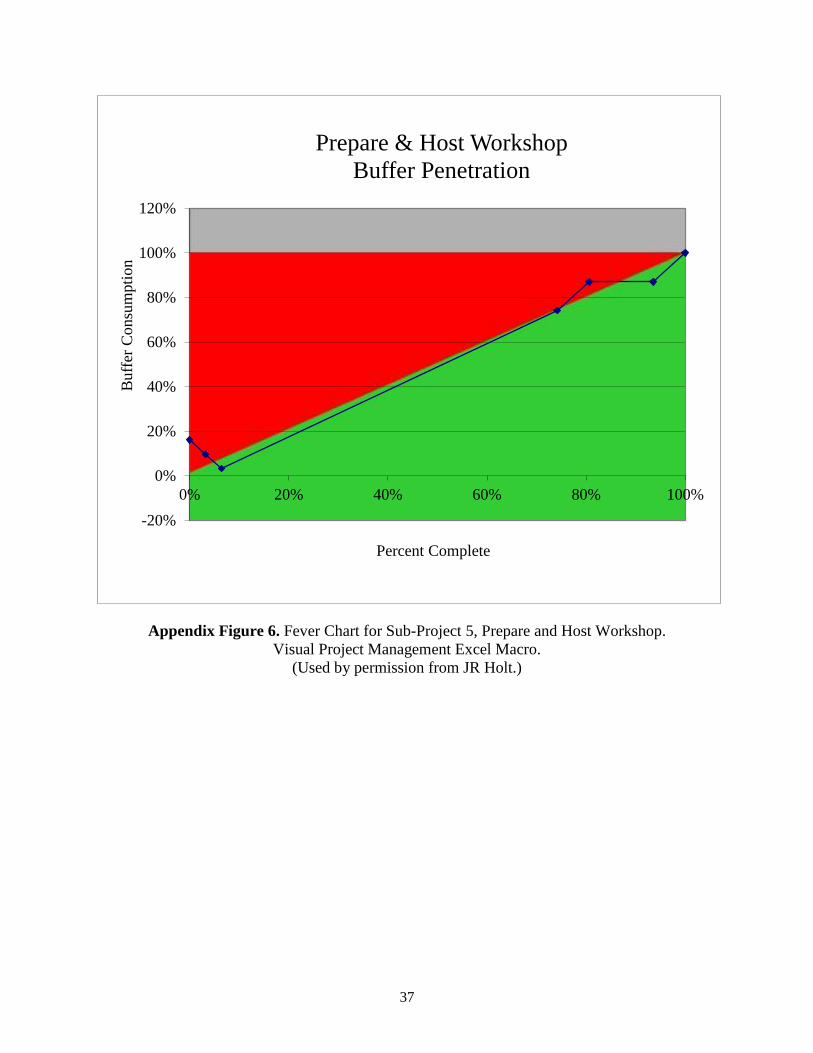
Appendix Figure 6. Fever Chart for Sub-Project 5, Prepare and Host Workshop.
Visual Project Management Excel Macro.
(Used by permission from JR Holt.)
-20%
0%
20%
40%
60%
80%
100%
120%
0% 20% 40% 60% 80% 100%
Buff
er C
onsu
mpti
on
Percent Complete
Prepare & Host Workshop
Buffer Penetration