A New Relational Spatial OLAP Approach For Multi ...
10
HAL Id: hal-00965471 https://hal.uca.fr/hal-00965471 Submitted on 25 Mar 2014 HAL is a multi-disciplinary open access archive for the deposit and dissemination of sci- entific research documents, whether they are pub- lished or not. The documents may come from teaching and research institutions in France or abroad, or from public or private research centers. L’archive ouverte pluridisciplinaire HAL, est destinée au dépôt et à la diffusion de documents scientifiques de niveau recherche, publiés ou non, émanant des établissements d’enseignement et de recherche français ou étrangers, des laboratoires publics ou privés. A New Relational Spatial OLAP Approach For Multi-resolution and Spatio-multidimensional Analysis of Incomplete Field Data Mehdi Zaamoune, Sandro Bimonte, François Pinet, Philippe Beaune To cite this version: Mehdi Zaamoune, Sandro Bimonte, François Pinet, Philippe Beaune. A New Relational Spatial OLAP Approach For Multi-resolution and Spatio-multidimensional Analysis of Incomplete Field Data. ICEIS 2013 INSTICC International Conference on Enterprise Information Systems, Jul 2013, Angers, France. p. hal-00965471
Transcript of A New Relational Spatial OLAP Approach For Multi ...
HAL Id: hal-00965471https://hal.uca.fr/hal-00965471
Submitted on 25 Mar 2014
HAL is a multi-disciplinary open accessarchive for the deposit and dissemination of sci-entific research documents, whether they are pub-lished or not. The documents may come fromteaching and research institutions in France orabroad, or from public or private research centers.
L’archive ouverte pluridisciplinaire HAL, estdestinée au dépôt et à la diffusion de documentsscientifiques de niveau recherche, publiés ou non,émanant des établissements d’enseignement et derecherche français ou étrangers, des laboratoirespublics ou privés.
A New Relational Spatial OLAP Approach ForMulti-resolution and Spatio-multidimensional Analysis
of Incomplete Field DataMehdi Zaamoune, Sandro Bimonte, François Pinet, Philippe Beaune
To cite this version:Mehdi Zaamoune, Sandro Bimonte, François Pinet, Philippe Beaune. A New Relational Spatial OLAPApproach For Multi-resolution and Spatio-multidimensional Analysis of Incomplete Field Data. ICEIS2013 INSTICC International Conference on Enterprise Information Systems, Jul 2013, Angers, France.p. �hal-00965471�
A New Relational Spatial OLAP Approach For Multi-resolution and Spatio-multidimensional Analysis of Incomplete Field Data
Mehdi Zaamoune1, Sandro Bimonte1, François Pinet1, Philippe Beaune2 1IRSTEA, TSCF, 24 Av. des Landais, Aubière, France
2Agaetis, 10 allée Evariste Galois, 63 000 Clermont-Ferrand { mehdi.zaamoune,sandro.bimonte,francois.pinet}@irstea.fr, [email protected]
Keywords: Spatial OLAP, incomplete continuous field, multi-resolution geographic data
Abstract: Integrating continuous spatial data into SOLAP systems is a new research challenge. Moreover, representation of field data at different scales or resolutions is often mandatory for an effective analysis. Thus, in this paper, we propose a logical model to integrate spatial dimensions representing incomplete field data at different resolutions in a classical SOLAP architecture.
1 INTRODUCTION
Spatial Data Warehouse (SDW) and Spatial OLAP (SOLAP) systems play an important role in helping decision-makers obtain the maximum benefits of these large amounts of geographic data (Bédard, Merrett et al. 2001). These technologies extend Data Warehouse (DW) and OLAP systems to integrate spatial data with warehoused classical data to achieve the on-line analysis of large georeferenced data sets. SOLAP systems integrate advanced OLAP and Geographic Information Systems (GIS) in a unique framework usually based on the relational storage (i.e. Oracle, etc.) of spatial data according to the vector model, and their analysis through SOLAP operators (Spatial Roll-Up, Spatial Slice, etc.) implemented by the SOLAP server (e.g. Map4Decision, etc.) and visualized by means of tabular, graphical and cartographic displays (Gomez, Gomez et al. 2012). SDW are modeled according to the spatio-multidimensional model that extends the traditional multidimensional model to define spatial dimensions (i.e. analysis axes with spatial attributes) and spatial measures (i.e. analysis subjects) that integrate geographic information using the vector model (Bédard, Rivest et al. 2007). SOLAP technology can be applied in different domains (e.g. archeology, public health, etc.).
Geographic information can be represented by two models, depending on the nature of data:
discrete (vector) and continuous field (Mennis, Viger et al. 2005). Continuous fields (also called continuous spatial data) represent physical phenomena that continuously change in space (Paolino, Sebillo et al. 2010), for example the temperature, population, etc. Two representations of field data have been proposed: incomplete and complete (Paolino, Sebillo et al. 2010). Incomplete representations store a sample of points and need additional functions to calculate the field in non-sampled areas (e.g. grid of points, TIN, etc.) (e.g. Figure 2). Complete representations associate estimated values to regions and assume that these values are valid for each point in the regions (e.g. raster). For those representations some ad-hoc analysis operators have been defined that allow a point by point analysis (i.e. map algebra (Mennis, Viger et al. 2005)). Representation of geographic data at different scales or resolutions (e.g. Figure 2-b) is mandatory for an effective analysis of spatial complex phenomena since it represents a geovisualization method (Camossi, Bertino et al. 2009). Consequently, these resolutions or scales represent decision-makers analysis needs that should be explicitly represented in any data and query model. Indeed, in the context of Geographic Information Systems and Spatial Databases Management Systems (SDBSM), several works addresses this issue by proposing conceptual, logical and physical data models and analysis techniques (Parent, spaccapietra et al. 2006).
Motivated by the important analysis capabilities offered by the continuous field representation of geographic data when integrated in SOLAP systems
ICEIS 2013 INSTICC International Conference on Enterprise Information Systems, July 3-7, 2013, Angers
2
(visualization, querying, etc.) recently some works investigated the extension of the spatio-multidimensional model and SOLAP operators with complete and incomplete field data (cf. Section 6). In the same way, handling multi-resolutions of spatial data into spatial multidimensional models has been proposed in few works (Yvan, Proulx et al. 2002) (Gascueña and Guadalupe 2009) that propose conceptual models to represent SDW with several representations (scales, resolutions, etc.) of spatial dimensions and measures.
However, to best of our knowledge existing works concerning field data and multi-resolutions lack of a complete implementation in a full-featured SOLAP architecture, or in other terms they do not propose a coupled relational and SOLAP server model for a generic SOLAP architecture allowing (i) the map algebra operators, (ii) the multi-resolution, and (iii) a continuous view of the field.
In order to handle the spatio-multidimensional analysis of incomplete regular grid field data at different resolutions, we propose in this paper: (i) a specific logical model, extending the well-know relational star schema; (ii) and some new MDX-based defined functions. We validate our proposal using a real case study concerning the odor monitoring, and we provide some experiments showing the feasibility also in terms of storage and computation performances.
2 MODELING AND ANALYSIS REQUIREMENTS
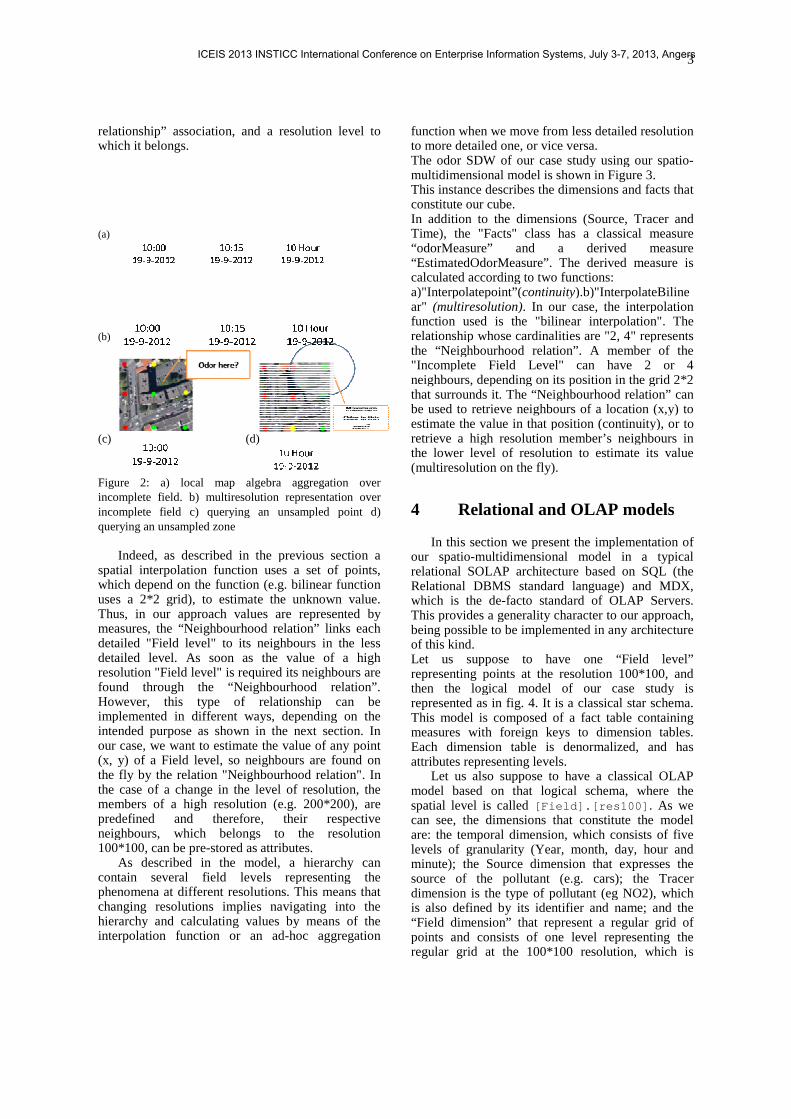
In order to show our proposal, we present a case study based on data issued from the monitoring of urban odor. For each 15 minutes and type of odor (e.g. NO2) a regular grid map (field) is produced by means of some sample points and a simulation model (ADMS5) . The simulation model estimates odors for a whole urban area and produces 100*100 thematic grids. Examples of points grid are provided in figure 2-a (odor values are represented by color: green, yellow, red) for 10:00 19-2-2012 and 10:15 19-2-2012. Let us now suppose that the user wants to aggregate data along a temporal dimension (year, month, day, hour, minute) using the average to obtain an aggregated odor map. This is an OLAP operation of RollUp on the temporal dimension that corresponds to a local map algebra operation (Figure 2-a). Moreover, since space is represented in a continuous way, decision-makers should be able to ask for the result of any OLAP query in any point of the spatial dimension (for example, s/he should be interested in the odor value at 10:00 in the area behind the building) (Figure 2-c). It is also possible
to apply a spatial slice operator on the spatial dimension (i.e. using a spatial predicate to select a subset of warehoused data) (Figure 2-d). In order to answer to these last two queries spatial interpolation methods are necessary, since in incomplete field only the values provided by the simulation model are stored. Spatial interpolation is the process of prediction of almost exact values of attributes at unsampled locations from measurements made at control points within the same area (O'Sullivan and J.Unwin 2002). In our case the interpolation function used is the bilinear interpolation, which is a local deterministic method. It uses the 2 * 2 grid sample points closest to the unknown point and calculates a distance weighted average which determines in what proportion the value of a neighbour impact on the value of the point to be estimated (Figure 1).
Finally, as stated in the previous section, since visualization of spatial data at different resolutions is mandatory for the exploration/analysis process, decision-makers should be able querying spatial warehoused data at different resolutions. It is very important to note that for each spatial phenomenon a set of useful known resolutions exist, so they could be predefined according to data and users needs. Moreover, in order to calculate values at finer resolutions spatial interpolation functions as previously described can be used.
To summarize, spatio-multidimensional analysis of field data implies: supporting (i) OLAP classical operators as Map Algebra, (ii) continuous view of spatial data, (iii) spatial slice operators using field data, and (iv) visualizing and querying data at different predefined resolutions.
3 Spatio-multidimensional model for incomplete field data
In this section we describe our spatio-multidimensional model for handling incomplete fields at different resolutions. Our model extends the classical spatio-multidimensional models to generate the continuity of the phenomena over the studied area, and represents pre-defined levels of resolution. In particular, a “Cube” is composed of “Facts” and “Dimensions”. A “Dimension” is composed of “Hierarchies”, which are composed of “Levels”. A “Level” can be spatial or conventional. This means that it can contain “Spatial attributes” (e.g. points, etc.), or contain only alphanumerical attributes respectively. “Facts” is composed of “Spatial Measures” or “Conventional Measures”. Moreover, our extension defines a “Field level” as a special type of spatial level where each member has a geometric attribute (e.g. point), a “neighbourhood
ICEIS 2013 INSTICC International Conference on Enterprise Information Systems, July 3-7, 2013, Angers
relationship” association, and a rewhich it belongs.
(a)
(b) (c) (d) Figure 2: a) local map algebra incomplete field. b) multiresolution rincomplete field c) querying an unquerying an unsampled zone
Indeed, as described in the prspatial interpolation function uses which depend on the function (e.g. uses a 2*2 grid), to estimate the Thus, in our approach values aremeasures, the “Neighbourhood reladetailed "Field level" to its neighbdetailed level. As soon as the vresolution "Field level" is required ifound through the “NeighbourHowever, this type of relatioimplemented in different ways, deintended purpose as shown in the our case, we want to estimate the v(x, y) of a Field level, so neighbouthe fly by the relation "Neighbourhthe case of a change in the level omembers of a high resolution (e.gpredefined and therefore, thneighbours, which belongs to 100*100, can be pre-stored as attrib
As described in the model, contain several field levels rphenomena at different resolutions.changing resolutions implies navhierarchy and calculating values binterpolation function or an ad-
resolution level to
a aggregation over representation over unsampled point d)
previous section a es a set of points, .g. bilinear function he unknown value. are represented by relation” links each ghbours in the less value of a high d its neighbours are urhood relation”.
ationship can be depending on the he next section. In value of any point bours are found on urhood relation". In l of resolution, the
(e.g. 200*200), are their respective
to the resolution ributes. l, a hierarchy can
representing the ns. This means that avigating into the s by means of the
-hoc aggregation
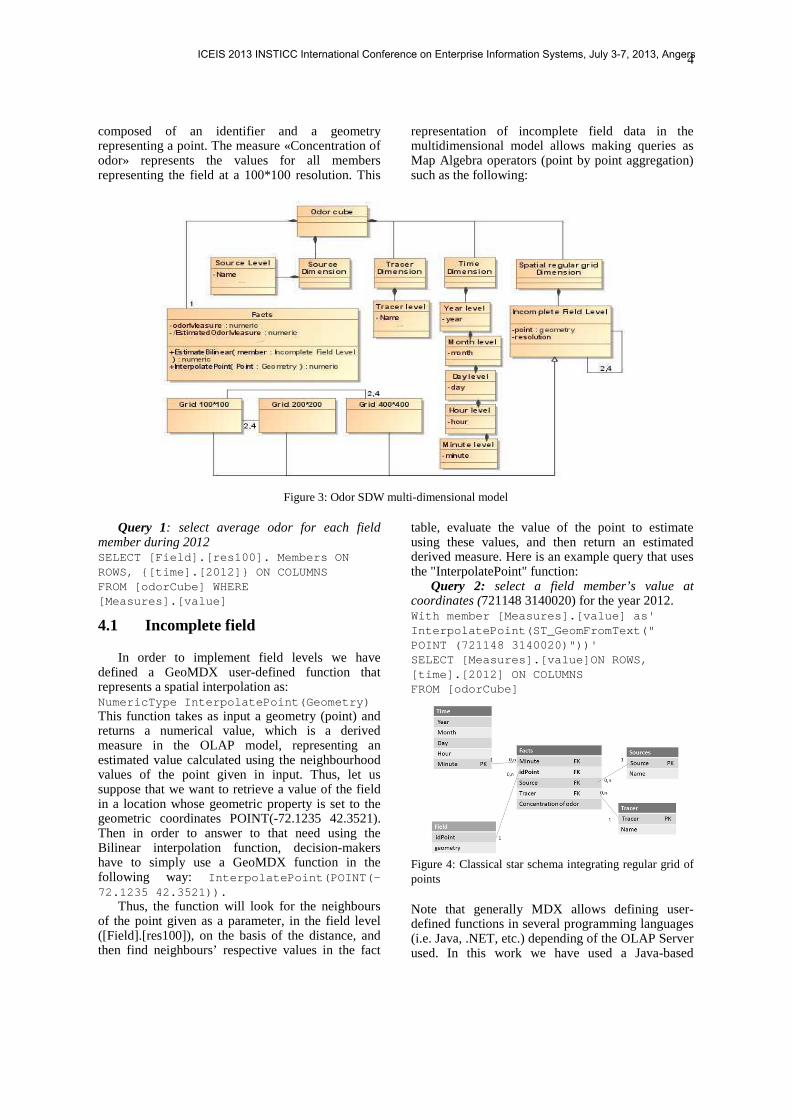
function when we move from lto more detailed one, or vice veThe odor SDW of our case stmultidimensional model is shoThis instance describes the dimconstitute our cube. In addition to the dimensionsTime), the "Facts" class has“odorMeasure” and a “EstimatedOdorMeasure”. Thecalculated according to two funa)"Interpolatepoint”(continuityar" (multiresolution). In our cfunction used is the "bilinearelationship whose cardinalitiethe “Neighbourhood relation”"Incomplete Field Level" neighbours, depending on its pthat surrounds it. The “Neighbbe used to retrieve neighboursestimate the value in that positretrieve a high resolution methe lower level of resolution (multiresolution on the fly).
4 Relational and OLA
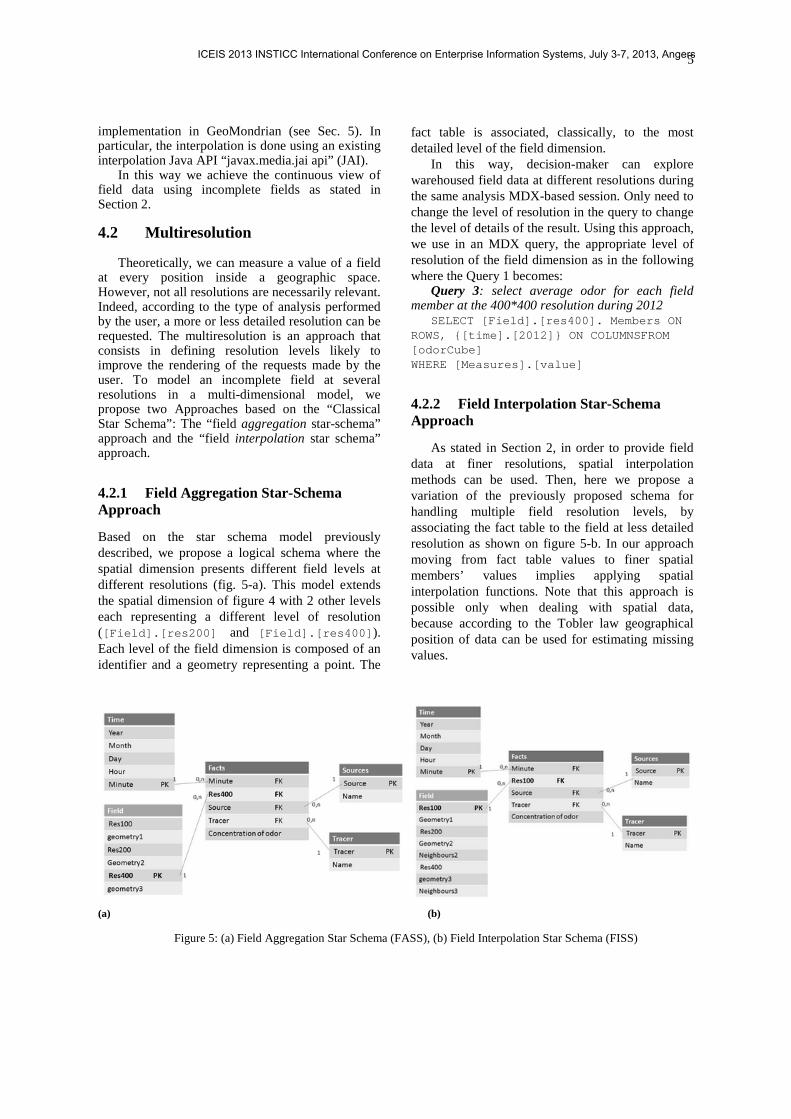
In this section we present tour spatio-multidimensional relational SOLAP architectureRelational DBMS standard lwhich is the de-facto standarThis provides a generality charbeing possible to be implementof this kind. Let us suppose to have representing points at the resthen the logical model of represented as in fig. 4. It is a This model is composed of ameasures with foreign keys Each dimension table is deattributes representing levels.
Let us also suppose to hamodel based on that logicalspatial level is called [Field].[res100]can see, the dimensions that are: the temporal dimension, wlevels of granularity (Year, mminute); the Source dimensiosource of the pollutant (e.gdimension is the type of polluis also defined by its identifie“Field dimension” that represpoints and consists of one lregular grid at the 100*100
3
less detailed resolution versa. study using our spatio-hown in Figure 3. imensions and facts that
ns (Source, Tracer and as a classical measure derived measure
The derived measure is functions: ity).b)"InterpolateBiliner case, the interpolation ear interpolation". The ties are "2, 4" represents on”. A member of the can have 2 or 4
s position in the grid 2*2 hbourhood relation” can urs of a location (x,y) to sition (continuity), or to ember’s neighbours in
on to estimate its value
and OLAP models
nt the implementation of l model in a typical ure based on SQL (the language) and MDX, dard of OLAP Servers. haracter to our approach, ented in any architecture
e one “Field level” resolution 100*100, and of our case study is a classical star schema.
f a fact table containing s to dimension tables. denormalized, and has have a classical OLAP
cal schema, where the d].[res100] . As we
at constitute the model , which consists of five , month, day, hour and sion that expresses the
(e.g. cars); the Tracer llutant (eg NO2), which ifier and name; and the resent a regular grid of level representing the
00 resolution, which is
ICEIS 2013 INSTICC International Conference on Enterprise Information Systems, July 3-7, 2013, Angers
4
composed of an identifier and a geometry representing a point. The measure «Concentration of odor» represents the values for all members representing the field at a 100*100 resolution. This
representation of incomplete field data in the multidimensional model allows making queries as Map Algebra operators (point by point aggregation) such as the following:
Figure 3: Odor SDW multi-dimensional model
Query 1: select average odor for each field member during 2012 SELECT [Field].[res100]. Members ON ROWS, {[time].[2012] } ON COLUMNS FROM [odorCube] WHERE [Measures].[value]
4.1 Incomplete field
In order to implement field levels we have defined a GeoMDX user-defined function that represents a spatial interpolation as: NumericType InterpolatePoint(Geometry) This function takes as input a geometry (point) and returns a numerical value, which is a derived measure in the OLAP model, representing an estimated value calculated using the neighbourhood values of the point given in input. Thus, let us suppose that we want to retrieve a value of the field in a location whose geometric property is set to the geometric coordinates POINT(-72.1235 42.3521). Then in order to answer to that need using the Bilinear interpolation function, decision-makers have to simply use a GeoMDX function in the following way: InterpolatePoint(POINT(-72.1235 42.3521)).
Thus, the function will look for the neighbours of the point given as a parameter, in the field level ([Field].[res100]), on the basis of the distance, and then find neighbours’ respective values in the fact
table, evaluate the value of the point to estimate using these values, and then return an estimated derived measure. Here is an example query that uses the "InterpolatePoint" function:
Query 2: select a field member’s value at coordinates (721148 3140020) for the year 2012. With member [Measures].[value] as' InterpolatePoint(ST_GeomFromText(" POINT (721148 3140020)"))' SELECT [Measures].[value]ON ROWS, [time].[2012] ON COLUMNS FROM [odorCube]
Figure 4: Classical star schema integrating regular grid of points
Note that generally MDX allows defining user-defined functions in several programming languages (i.e. Java, .NET, etc.) depending of the OLAP Server used. In this work we have used a Java-based
ICEIS 2013 INSTICC International Conference on Enterprise Information Systems, July 3-7, 2013, Angers
5
implementation in GeoMondrian (see Sec. 5). In particular, the interpolation is done using an existing interpolation Java API “javax.media.jai api” (JAI).
In this way we achieve the continuous view of field data using incomplete fields as stated in Section 2.
4.2 Multiresolution
Theoretically, we can measure a value of a field at every position inside a geographic space. However, not all resolutions are necessarily relevant. Indeed, according to the type of analysis performed by the user, a more or less detailed resolution can be requested. The multiresolution is an approach that consists in defining resolution levels likely to improve the rendering of the requests made by the user. To model an incomplete field at several resolutions in a multi-dimensional model, we propose two Approaches based on the “Classical Star Schema”: The “field aggregation star-schema” approach and the “field interpolation star schema” approach.
4.2.1 Field Aggregation Star-Schema Approach
Based on the star schema model previously described, we propose a logical schema where the spatial dimension presents different field levels at different resolutions (fig. 5-a). This model extends the spatial dimension of figure 4 with 2 other levels each representing a different level of resolution ([Field].[res200] and [Field].[res400] ). Each level of the field dimension is composed of an identifier and a geometry representing a point. The
fact table is associated, classically, to the most detailed level of the field dimension.
In this way, decision-maker can explore warehoused field data at different resolutions during the same analysis MDX-based session. Only need to change the level of resolution in the query to change the level of details of the result. Using this approach, we use in an MDX query, the appropriate level of resolution of the field dimension as in the following where the Query 1 becomes:
Query 3: select average odor for each field member at the 400*400 resolution during 2012
SELECT [Field].[res400]. Members ON ROWS, {[time].[2012] } ON COLUMNSFROM [odorCube] WHERE [Measures].[value]
4.2.2 Field Interpolation Star-Schema Approach
As stated in Section 2, in order to provide field data at finer resolutions, spatial interpolation methods can be used. Then, here we propose a variation of the previously proposed schema for handling multiple field resolution levels, by associating the fact table to the field at less detailed resolution as shown on figure 5-b. In our approach moving from fact table values to finer spatial members’ values implies applying spatial interpolation functions. Note that this approach is possible only when dealing with spatial data, because according to the Tobler law geographical position of data can be used for estimating missing values.
(a) (b)
Figure 5: (a) Field Aggregation Star Schema (FASS), (b) Field Interpolation Star Schema (FISS)
ICEIS 2013 INSTICC International Conference on Enterprise Information Systems, July 3-7, 2013, Angers
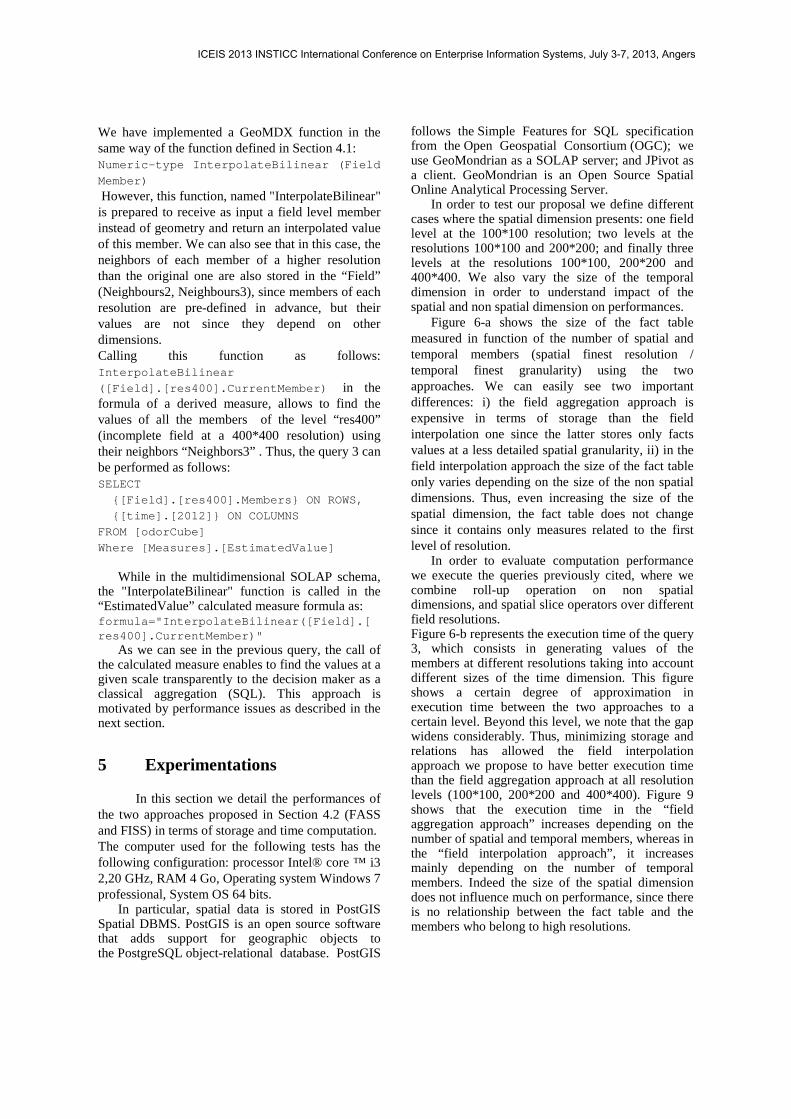
We have implemented a GeoMDX function in the same way of the function defined in Section 4.1: Numeric-type InterpolateBilinear (Field
Member) However, this function, named "InterpolateBilinear" is prepared to receive as input a field level member instead of geometry and return an interpolated value of this member. We can also see that in this case, the neighbors of each member of a higher resolution than the original one are also stored in the “Field” (Neighbours2, Neighbours3), since members of each resolution are pre-defined in advance, but their values are not since they depend on other dimensions. Calling this function as follows: InterpolateBilinear
([Field].[res400].CurrentMember) in the formula of a derived measure, allows to find the values of all the members of the level “res400” (incomplete field at a 400*400 resolution) using their neighbors “Neighbors3” . Thus, the query 3 can be performed as follows: SELECT
{[Field].[res400].Members} ON ROWS,
{ [time].[2012] } ON COLUMNS
FROM [odorCube]
Where [Measures].[EstimatedValue] While in the multidimensional SOLAP schema,
the "InterpolateBilinear" function is called in the “EstimatedValue” calculated measure formula as: formula=" InterpolateBilinear([Field].[ res400].CurrentMember) "
As we can see in the previous query, the call of the calculated measure enables to find the values at a given scale transparently to the decision maker as a classical aggregation (SQL). This approach is motivated by performance issues as described in the next section.
5 Experimentations
In this section we detail the performances of the two approaches proposed in Section 4.2 (FASS and FISS) in terms of storage and time computation. The computer used for the following tests has the following configuration: processor Intel® core ™ i3 2,20 GHz, RAM 4 Go, Operating system Windows 7 professional, System OS 64 bits.
In particular, spatial data is stored in PostGIS Spatial DBMS. PostGIS is an open source software that adds support for geographic objects to the PostgreSQL object-relational database. PostGIS
follows the Simple Features for SQL specification from the Open Geospatial Consortium (OGC); we use GeoMondrian as a SOLAP server; and JPivot as a client. GeoMondrian is an Open Source Spatial Online Analytical Processing Server.
In order to test our proposal we define different cases where the spatial dimension presents: one field level at the 100*100 resolution; two levels at the resolutions 100*100 and 200*200; and finally three levels at the resolutions 100*100, 200*200 and 400*400. We also vary the size of the temporal dimension in order to understand impact of the spatial and non spatial dimension on performances.
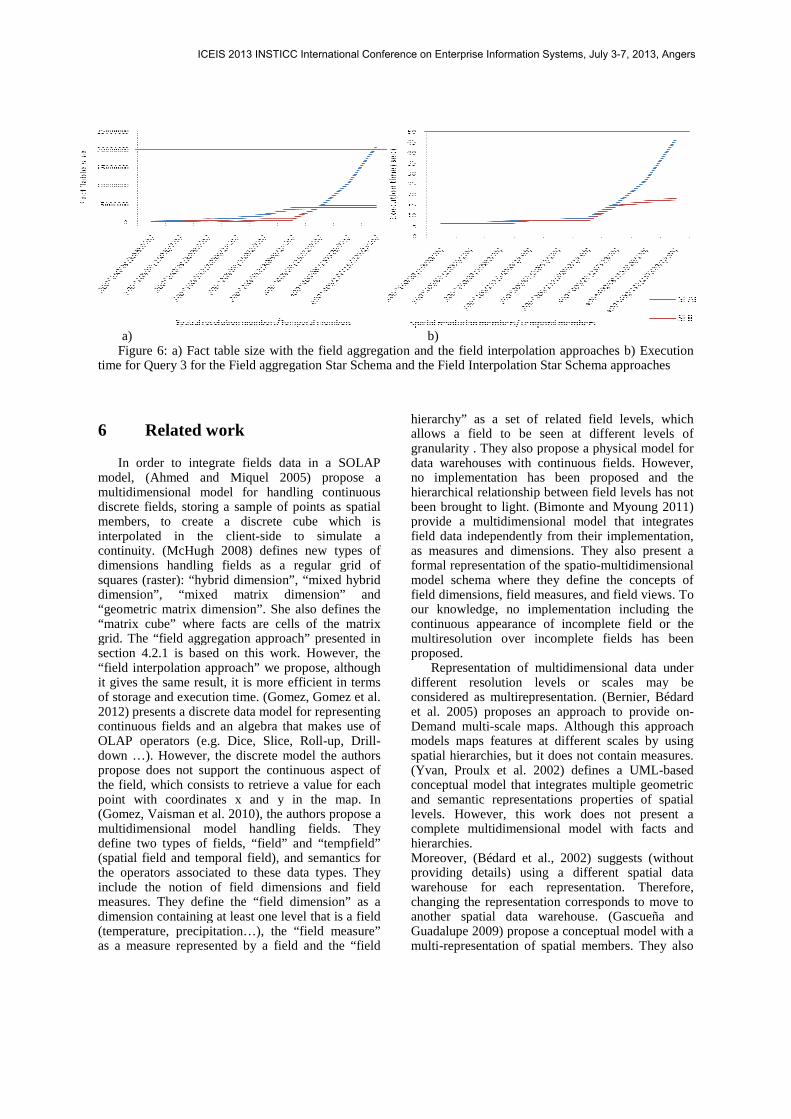
Figure 6-a shows the size of the fact table measured in function of the number of spatial and temporal members (spatial finest resolution / temporal finest granularity) using the two approaches. We can easily see two important differences: i) the field aggregation approach is expensive in terms of storage than the field interpolation one since the latter stores only facts values at a less detailed spatial granularity, ii) in the field interpolation approach the size of the fact table only varies depending on the size of the non spatial dimensions. Thus, even increasing the size of the spatial dimension, the fact table does not change since it contains only measures related to the first level of resolution.
In order to evaluate computation performance we execute the queries previously cited, where we combine roll-up operation on non spatial dimensions, and spatial slice operators over different field resolutions. Figure 6-b represents the execution time of the query 3, which consists in generating values of the members at different resolutions taking into account different sizes of the time dimension. This figure shows a certain degree of approximation in execution time between the two approaches to a certain level. Beyond this level, we note that the gap widens considerably. Thus, minimizing storage and relations has allowed the field interpolation approach we propose to have better execution time than the field aggregation approach at all resolution levels (100*100, 200*200 and 400*400). Figure 9 shows that the execution time in the “field aggregation approach” increases depending on the number of spatial and temporal members, whereas in the “field interpolation approach”, it increases mainly depending on the number of temporal members. Indeed the size of the spatial dimension does not influence much on performance, since there is no relationship between the fact table and the members who belong to high resolutions.
ICEIS 2013 INSTICC International Conference on Enterprise Information Systems, July 3-7, 2013, Angers
a) Figure 6: a) Fact table size with
time for Query 3 for the Field aggre
6 Related work
In order to integrate fields damodel, (Ahmed and Miquel 20multidimensional model for handdiscrete fields, storing a sample of members, to create a discrete interpolated in the client-side continuity. (McHugh 2008) definedimensions handling fields as a squares (raster): “hybrid dimensiondimension”, “mixed matrix d“geometric matrix dimension”. She“matrix cube” where facts are celgrid. The “field aggregation approasection 4.2.1 is based on this wor“field interpolation approach” we pit gives the same result, it is more eof storage and execution time. (Gom2012) presents a discrete data modecontinuous fields and an algebra thOLAP operators (e.g. Dice, Slicedown …). However, the discrete mpropose does not support the contthe field, which consists to retrievepoint with coordinates x and y (Gomez, Vaisman et al. 2010), the amultidimensional model handlindefine two types of fields, “field” (spatial field and temporal field), athe operators associated to these dinclude the notion of field dimenmeasures. They define the “field dimension containing at least one le(temperature, precipitation…), the as a measure represented by a fiel
b) ith the field aggregation and the field interpolation appregation Star Schema and the Field Interpolation Star Sc
data in a SOLAP 2005) propose a
andling continuous of points as spatial e cube which is e to simulate a ines new types of a regular grid of
on”, “mixed hybrid dimension” and e also defines the
cells of the matrix roach” presented in ork. However, the
e propose, although re efficient in terms omez, Gomez et al. del for representing that makes use of ice, Roll-up, Drill- model the authors ntinuous aspect of ve a value for each y in the map. In e authors propose a ling fields. They d” and “tempfield” , and semantics for e data types. They ensions and field
ld dimension” as a level that is a field he “field measure” field and the “field
hierarchy” as a set of relateallows a field to be seen agranularity . They also proposedata warehouses with continuno implementation has beenhierarchical relationship betwebeen brought to light. (Bimonprovide a multidimensional mfield data independently from as measures and dimensions. formal representation of the spmodel schema where they defield dimensions, field measureour knowledge, no implemencontinuous appearance of incmultiresolution over incomplproposed.
Representation of multidimdifferent resolution levels considered as multirepresentatet al. 2005) proposes an appDemand multi-scale maps. Almodels maps features at diffespatial hierarchies, but it does (Yvan, Proulx et al. 2002) dconceptual model that integratand semantic representations levels. However, this work complete multidimensional mhierarchies. Moreover, (Bédard et al., 200providing details) using a dwarehouse for each represchanging the representation coanother spatial data warehoGuadalupe 2009) propose a comulti-representation of spatial
approaches b) Execution Schema approaches
ted field levels, which at different levels of ose a physical model for inuous fields. However, een proposed and the ween field levels has not onte and Myoung 2011) l model that integrates m their implementation, ns. They also present a spatio-multidimensional define the concepts of ures, and field views. To entation including the
incomplete field or the plete fields has been
idimensional data under s or scales may be tation. (Bernier, Bédard pproach to provide on-Although this approach ifferent scales by using es not contain measures.
defines a UML-based rates multiple geometric ns properties of spatial rk does not present a model with facts and
2002) suggests (without different spatial data resentation. Therefore, corresponds to move to house. (Gascueña and conceptual model with a ial members. They also
ICEIS 2013 INSTICC International Conference on Enterprise Information Systems, July 3-7, 2013, Angers
8
propose a physical schema, but any implementation into a classical ROLAP architecture is presented. Finally, (McGuire, Gangopadhyay et al. 2008)define a snowflake schema for an environmental application where three dimensions represent the same spatial members at different resolutions.
7 Conclusion and future work
In this paper we present a multidimensional model for incomplete fields at several resolutions and its implementation in a SOLAP architecture based on standards (e.g. SQL and MDX). We are working on using spatial data mining to speed-up map algebra operations and implement a SOLAP visualization client. We also work in integrating other interpolation functions to generalize the proposed approach.
Acknowledgements The authors wish to thank the FEDER and the region for funding this project and project partners who provide us the data. References Ahmed, T. O. and M. Miquel (2005). "Multidimensional
Structures Dedicated to Continuous Spatiotemporal Phenomena." 01/2005; In proceeding of: Database: Enterprise, Skills and Innovation, 22nd British National Conference on Databases, BNCOD 22, Sunderland, UK, July 5-7, 2005, Proceedings.
Bédard, Y., T. Merrett, et al. (2001). "Fundamentals of Spatial Data Warehousing for Geographic Knowledge Discovery." Data Mining and Knowledge Discovery
Bédard, Y., S. Rivest, et al. (2007). "Spatial On-Line Analytical Processing (SOLAP): Concepts, Architectures and Solutions from a Geomatics Engineering Perspective." Data Warehouses and OLAP: Concepts, Architectures and Solutions. IGI Global, 2007. 298-319. Web. 23 Jan. 2013. doi:10.4018/987-1-59904-364-7.ch013.
Bernier, E., Y. Bédard, et al. (2005). "UMapIT: An On-Demand Web Mapping Tool Based On A Multiple Representation Database." 8th ICA WORKSHOP on Generalisation and Multiple Representation, A Coruña, July 7-8th.
Bimonte, S. and K. Myoung (2011). "Towards a Model for the Multidimensional Analysis of Field Data." Advances in Databases and Information Systems
,Lecture Notes in Computer Science Volume 6295, 2011, pp 58-72.
Camossi, E., E. Bertino, et al. (2009). " Adaptive Management of Multigranular Spatio-Temporal Object Attributes." SSTD 2009: 320-337.
Gascueña, C. M. and R. Guadalupe (2009). "A MULTIDIMENSIONAL METHODOLOGY WITH SUPPORT FOR SPATIO-TEMPORAL MULTIGRANULARITY IN THE CONCEPTUAL AND LOGICAL PHASES." IGI Global.
Gomez, L., A. Vaisman, et al. (2010). "Physical Design and Implementation of Spatial Data Warehouses Supporting Continuous Fields." DaWaK'10 Proceedings of the 12th international conference on Data warehousing and knowledge discovery, Pages 25-39
Gomez, L. I., S. A. Gomez, et al. (2012). "A Generic Data Model and Query Language for Spatiotemporal OLAP Cube Analysis." EDBT '12 Proceedings of the 15th International Conference on Extending Database Technology, Pages 300-311 ACM New York, NY, USA ©2012
McGuire, M., A. Gangopadhyay, et al. (2008). "A user-centered design for a spatial data warehouse for data exploration in environmental research." Ecological Informatics, Volume 3, Issues 4–5, Pages 273–285.
McHugh, R. (2008). "Intégration de la structure matricielle dans les cubes spatiaux."
Mennis, J., R. Viger, et al. (2005). "Cubic Map Algebra functions for spatio-temporal analysis." Cartography and Geographic Information Systems.
Paolino, L., M. Sebillo, et al. (2010). "Integrating Discrete and Continuous Data in an OpenGeospatial-Compliant Specification." Transactions in GIS Volume 14, Issue 6, pages 731–753, December 2010.
Parent, C., S. spaccapietra, et al. (2006). "Conceptual Modelling for Traditional and Spatio-temporal Applications." 2006 XVIII, 465 p. 115 Illus. Hardcover.
Yvan, B., M. J. Proulx, et al. (2002). "Modeling multirepresentations into spatial data warehouses : A UML-Based approach." Symposium on Geospatial Theory, Processing and Applications, Ottawa
O'Sullivan, D. and D. J.Unwin (2002). Geographic Information Analysis - John Wiley & Sons, 15 nov. 2002 - 448 pages
ICEIS 2013 INSTICC International Conference on Enterprise Information Systems, July 3-7, 2013, Angers

9
ICEIS 2013 INSTICC International Conference on Enterprise Information Systems, July 3-7, 2013, Angers