
A New Model for Economic Optimization of Water Diversion System During Dam Construction Using PSO...
7
Abstract—The usual method of river flow diversion involves construction of tunnels and cofferdams. Given the fact that the cost of diversion works could be as high as 10-20% of the total dam construction cost, due attention should be paid to optimum design of the diversion works. The cost of diversion works depends, on factors, such as: the tunnel dimensions and the intended tunneling support measures during and after excavation; quality and characterizes of the rock through which the tunnel should be excavated; the dimensions of the upstream (and downstream) cofferdams; and the magnitude of river flood the system is designed to divert. In this paper by use of the cost of unit prices for tunnel excavation, tunnel lining, tunnel support (rock bolt + shotcrete) and cofferdam fill the cost function was determined. The function is then minimized by the aid of PSO Algorithm (particle swarm optimization). It is found that the optimum diameter and the total diversion cost are directly related to the river flood discharge (Q). It has also shown that in addition to optimum diameter design discharge (Q), river length, tunnel length, is mainly a function of the ratios (not the absolute values) of the unit prices and does not depend on the overall price levels in the respective country. The results of optimization use in some of the case study lead us to significant changes in the cost. Keywords—Diversion Tunnel, Optimization, PSO Algorithm I. INTRODUCTION ESPITE the rising concerns in developed countries over the environmental impacts of large dams numerous large dams are still being planned or built around the world, especially in developing countries [1]. Construction of dams may take up to 10 or more years. In this period, the river has to be diverted in other to create a dry environment for the construction of the dam. The usual method of river flow diversion involves construction of tunnels and cofferdams. S. Sedighizadeh is with the Islamic Azad University, Saveh branch, Saveh, Iran, phone: +98 (255) 2244468; fax: +98 (255) 2244468; e-mail: saeed_s60@ yahoo.com). A. Mansoori is with the Islamic Azad University- South Tehran branch, Tehran, Iran, phone: +98 (912) 121958394; e-mail: [email protected]). M. R. Pirestani is with the Islamic Azad University- South Tehran branch, Tehran, Iran, phone: +98 (912) 3752768; e-mail: mr_pirestani@ yahoo.ir). D. Sedighizadeh is with the Islamic Azad University, Saveh branch, Saveh, Iran, phone: +98 (255) 2244468; fax: +98 (255) 2244468; e-mail: sedighizadeh@ modares.ac.ir). The tunnel is excavated in either of the abutments to divert the entire river flow, both its normal and flood discharges, around the site. The cofferdams are watertight structures, usually embankments, constructed of the upstream and downstream of the site to isolate the area that has to be kept dry. The tunnel entrance is located at the upper side of the upstream cofferdam and discharges into the river on lower side of the downstream cofferdam [2]. Occasionally, some future use may be made of the diversion structures such as incorporation of part of the tunnel into the outlet or spillway systems, or inclusion of the upstream cofferdam into the upstream section of the main body of embankment (earth fill or rock fill) dams. However, once the dam is completed, the diversion works are entirely or partly discarded partly or completely. The diversion tunnels are carefully plugged and deserted. The upstream cofferdams, particularly in the case of concrete dams, will be removed in order not to impair the full utility of the dam reservoir or the operation of the dam structures. The cost of diversion works depends, among other factors, such as: the tunnel dimensions and the intended tunneling support measures during and after excavation; quality and specifications of the rock through which the tunnel should be excavated; the dimensions of the upstream (and downstream) cofferdams; and the magnitude of river flood the system is designed to divert. In a given project, most of these factors are invariant: tunnel length depends on the geometry of the valley and the dam; upstream cofferdam depends on the width of the valley upstream of the dam; the side slopes of the cofferdams are usually between 2 to 2.5 horizontal to 1 vertical; the design flood depends on the river flow regime and on the level of risk adopted by the engineer in flood frequency and hydrological analysis; the downstream cofferdam height depends on the depth of the design flow along the river once out of the tunnel; the usual pre-cofferdam dimensions are quite independent of the other diversion works; and the tunnel portals (reinforced concrete [RC] structures at the inlet of the tunnel to provide a stable and smooth entrance) are necessary for most cases regardless of the tunnel size. Apart from these fixed factors, two factors are subjected to change by the designer: tunnel diameter (D) and the height of the upstream cofferdam. Depending on the project specifications and on the designer’s choice, D and upstream cofferdam height could be A New Model for Economic Optimization of Water Diversion System during Dam Construction using PSO Algorithm Saeed Sedighizadeh, Abbas Mansoori, Mohammad Reza Pirestani and Davoud Sedighizadeh D World Academy of Science, Engineering and Technology Vol:5 2011-01-20 835 International Science Index Vol:5, No:1, 2011 waset.org/Publication/1763
-
Upload
ali-oeztuerk -
Category
Documents
-
view
4 -
download
0
description
A New Model for Economic Optimization of Water Diversion System During Dam Construction Using PSO Algorithm
Transcript of A New Model for Economic Optimization of Water Diversion System During Dam Construction Using PSO...
Abstract—The usual method of river flow diversion involves
construction of tunnels and cofferdams. Given the fact that the cost of diversion works could be as high as 10-20% of the total dam construction cost, due attention should be paid to optimum design of the diversion works. The cost of diversion works depends, on factors, such as: the tunnel dimensions and the intended tunneling support measures during and after excavation; quality and characterizes of the rock through which the tunnel should be excavated; the dimensions of the upstream (and downstream) cofferdams; and the magnitude of river flood the system is designed to divert. In this paper by use of the cost of unit prices for tunnel excavation, tunnel lining, tunnel support (rock bolt + shotcrete) and cofferdam fill the cost function was determined. The function is then minimized by the aid of PSO Algorithm (particle swarm optimization). It is found that the optimum diameter and the total diversion cost are directly related to the river flood discharge (Q). It has also shown that in addition to optimum diameter design discharge (Q), river length, tunnel length, is mainly a function of the ratios (not the absolute values) of the unit prices and does not depend on the overall price levels in the respective country. The results of optimization use in some of the case study lead us to significant changes in the cost.
Keywords—Diversion Tunnel, Optimization, PSO Algorithm
I. INTRODUCTION ESPITE the rising concerns in developed countries over the environmental impacts of large dams numerous large dams are still being planned or built around the world,
especially in developing countries [1]. Construction of dams may take up to 10 or more years. In this period, the river has to be diverted in other to create a dry environment for the construction of the dam. The usual method of river flow diversion involves construction of tunnels and cofferdams.
S. Sedighizadeh is with the Islamic Azad University, Saveh branch, Saveh, Iran, phone: +98 (255) 2244468; fax: +98 (255) 2244468; e-mail: saeed_s60@ yahoo.com).
A. Mansoori is with the Islamic Azad University- South Tehran branch, Tehran, Iran, phone: +98 (912) 121958394; e-mail: [email protected]).
M. R. Pirestani is with the Islamic Azad University- South Tehran branch, Tehran, Iran, phone: +98 (912) 3752768; e-mail: mr_pirestani@ yahoo.ir).
D. Sedighizadeh is with the Islamic Azad University, Saveh branch, Saveh, Iran, phone: +98 (255) 2244468; fax: +98 (255) 2244468; e-mail: sedighizadeh@ modares.ac.ir).
The tunnel is excavated in either of the abutments to divert
the entire river flow, both its normal and flood discharges, around the site. The cofferdams are watertight structures, usually embankments, constructed of the upstream and downstream of the site to isolate the area that has to be kept dry. The tunnel entrance is located at the upper side of the upstream cofferdam and discharges into the river on lower side of the downstream cofferdam [2].
Occasionally, some future use may be made of the diversion structures such as incorporation of part of the tunnel into the outlet or spillway systems, or inclusion of the upstream cofferdam into the upstream section of the main body of embankment (earth fill or rock fill) dams. However, once the dam is completed, the diversion works are entirely or partly discarded partly or completely. The diversion tunnels are carefully plugged and deserted. The upstream cofferdams, particularly in the case of concrete dams, will be removed in order not to impair the full utility of the dam reservoir or the operation of the dam structures.
The cost of diversion works depends, among other factors, such as: the tunnel dimensions and the intended tunneling support measures during and after excavation; quality and specifications of the rock through which the tunnel should be excavated; the dimensions of the upstream (and downstream) cofferdams; and the magnitude of river flood the system is designed to divert. In a given project, most of these factors are invariant: tunnel length depends on the geometry of the valley and the dam; upstream cofferdam depends on the width of the valley upstream of the dam; the side slopes of the cofferdams are usually between 2 to 2.5 horizontal to 1 vertical; the design flood depends on the river flow regime and on the level of risk adopted by the engineer in flood frequency and hydrological analysis; the downstream cofferdam height depends on the depth of the design flow along the river once out of the tunnel; the usual pre-cofferdam dimensions are quite independent of the other diversion works; and the tunnel portals (reinforced concrete [RC] structures at the inlet of the tunnel to provide a stable and smooth entrance) are necessary for most cases regardless of the tunnel size. Apart from these fixed factors, two factors are subjected to change by the designer: tunnel diameter (D) and the height of the upstream cofferdam. Depending on the project specifications and on the designer’s choice, D and upstream cofferdam height could be
A New Model for Economic Optimization of Water Diversion System during Dam Construction using PSO Algorithm
Saeed Sedighizadeh, Abbas Mansoori, Mohammad Reza Pirestani and Davoud Sedighizadeh
D
World Academy of Science, Engineering and TechnologyVol:5 2011-01-20
835
Inte
rnat
iona
l Sci
ence
Ind
ex V
ol:5
, No:
1, 2
011
was
et.o
rg/P
ublic
atio
n/17
63
as large as 15m and 90m, respectively. Cooke (1984) reported on Areia dam with its 93m high cofferdam and Cai et. al (2000) discussed orifices installed in the 14.5m diameter diversion tunnels of XiaoLangDi hydro project on the Yellow river in China.
Theoretically, one may choose a very large diameter tunnel capable of carrying the largest flood predicted for the given return period leading to a small cofferdam height, only enough to form a barrier to the river. Alternatively, one may theoretically design a very high upstream cofferdam providing sufficient head to carry the predicted flood through a tunnel of very small diameter. Practical considerations aside, both these extreme designs serve the purpose of diverting the design flood. In the first case, the cost of the tunnel will be large and that of the cofferdam will be small, while it is the opposite in the second case. Between these two extreme cases, there lie numerous possible combinations of tunnel diameter and cofferdam height, from which the best practical combination entailing the least cost should be sought. Given the fact that the cost of diversion works could be as high as 10-20% of the total cost of dam construction, more attention should be paid to optimum design of the diversion works.
II. BASIC ASSUMPTIONS AND LIMITATIONS Table I contains the summary of the basic assumptions
employed in this study to attain the necessary guides in the selecting optimum tunnel diameter and cofferdam height in dam diversion works. The assumptions are classified as follows.
A. Geometric assumptions The average side slope of the upstream cofferdam is
considered 1 vertical to 2.25 horizontal, as the typical values are 1 to 2.5 and 1 to 2 for the upstream and downstream faces, respectively. The top width of the cofferdam is assumed to be 5m. The cofferdam length is the same as the valley width at the respective river section. This width is fixed for a given cofferdam height. If the maximum hydrostatic head of the water accumulated behind the cofferdam measured above the tunnel invert is H, then the cofferdam height is H plus the freeboard, Fb. The freeboard, defined as the vertical distance between the maximum water surface elevation and the cofferdam crest elevation, allows for safety against cofferdam overtopping. The freeboard here is considered to be 1.5m [5]. The tunnel length L depends on the extent of the site needed to remain dry and is typically a few tens of meters more than the base width of the dam. It is generally greater for embankment dams than for concrete dams. In any given project, L is fairly fixed and is not subjected to optimization. The tunnel longitudinal slope, S, has no typical value as it depends on the geometry of the river and the valley but generally is of the order of the riverbed slope at the site. The effect of the slope is to add L*S to H. Therefore, if the slope increases, the discharge capacity of the tunnel will increase and the required cofferdam height will decrease. When S is
significantly different from the average value assumed in Table 1, the effect on the cofferdam height estimated from guides presented in this study should be accounted for. A circular diameter (D) of the tunnel is used to represent and compute the tunnel cross-sectional area available for the flow. In the case of the horseshoe section, the equivalent circular section should be employed. In the optimization process, D and H are inter-related and vary together. Greater H requires smaller D and vice versa. B. Tunnel support types
Tunnel excavation includes surveying, drilling (and blasting in the drill and blast method), mucking, drainage, ventilation and lighting. Immediately after excavation of each longitudinal segment of the tunnel, support measures for the exposed area of the tunnel are required in various degrees. The typical support measures are stabilization of the tunnel by firstly installing rock bolts into the rock, grouting cement mixtures to fill the gaps, the fissures and the drilled holes around the bolts, and then placing a shotcrete layer containing a mesh of steel wires (diameter ~ 5mm). However, depending on the ground stresses, other support measures such as steel ribs, timber lagging, dowels, etc may be required in some locations along the tunnel. To provide for better stability, more durable surface and smoother flow conduit, the water carrying tunnels are often lined with formed reinforced concrete of about 0.3- 0.75m thickness depending on the tunnel diameter and rock quality. This shotcrete and the RC lining are called Support Type I here. When dealing with a better quality rock and intending to save on support cost, RC lining may be avoided. This is called Support Type II involving rock bolts, grouting and shotcrete only. In some rare cases, the rock is so competent that little support (i.e., only local and scattered rock bolting and concreting) is regarded sufficient and water is allowed to flow through the tunnel along the natural rock surfaces (Support Type III) [2]. An example of tunnels with no rock support is Walgau Tunnel in the power plant scheme of Walgauwerk in Austria [7].
C. Hydraulic assumptions With a design flood significantly larger than the average
river flow, water flows thoroughly in the tunnel, similar to a pressurized culvert flow with the free exit (not submerged). This happens when H/D > 1.2~1.5. The whole available head will be used up by four losses: the entrance loss at the tunnel inlet, friction loss along the tunnel surface, the exit loss at the tunnel outlet and bending loss. The first, the third and the fourth can be represented by KV2/2g where K is the loss coefficient (equal to a conservative value 0.5 for the entrance and 1 for the exit and 0.3 for bending) and V is the flow velocity. The second headless is influences by the involves a roughness coefficient such as Manning's n. Manning's roughness coefficient n is assumed to be equal to 0.14, 0.022, and 0.030 for the tunnel Support Types I, II, and III, respectively, as defined in Table 1 [6].
World Academy of Science, Engineering and TechnologyVol:5 2011-01-20
836
Inte
rnat
iona
l Sci
ence
Ind
ex V
ol:5
, No:
1, 2
011
was
et.o
rg/P
ublic
atio
n/17
63
D. Hydrological considerations The most important factor in determining the final values of
D and H is the design diversion discharge, Q. the discharge comes from hydrological analysis of the river flow and, in particular, from the flood frequency analysis. The respective return period is chosen in view of the hazards involved. A more conservative design flood (i.e., a higher return period) has to be considered for situations where overtopping during construction would have disastrous results. The return period may be 5, 10, 20, 50, 100 years or even higher, depending on the river flow regime and the importance of the project [2]. For example, one of the cofferdams with the least known chance of overtopping was the main cofferdam at Areia dam (Cooke 1984) that was designed to prevent overtopping by a 500-year return period. E. Cost assumptions
To obtain a simple mathematical framework for the optimization, unit prices of tunneling and cofferdam works should be used. Engineers routinely make this use in preliminary cost estimation of the civil projects in the reconnaissance phase of the design. The range of unit prices listed in Table 1, demonstrate all the influencing factors
The question of the optimum diameter is inseparable from the cost of works involved in the diversion. For example, if for any reason the price of tunnel excavation is very high and the price of embankment construction is relatively low, the design tends towards smaller D and larger H. Apart from obvious dependency of the prices on the overall economical situation of the country, the cost of civil works is related to specifications of the project such as the locality and topography, availability of the required materials and equipment, quality of the soil and the rock, the execution methods adopted by the contractor, and un-anticipated situations regarding water, weather and ground, among other factors.
A wide range of various practical unit prices is included in the present study to examine the rule of dependency of the results on the price levels. Table 1 shows the price ranges. The lower limits relate to the developing countries while the upper limits are likely to apply in developed countries. An excellent but rare price documentation of diversion works among other dam and tunneling works, appear in USBR (1983). A few points are worthy of mention: (i) numerous combinations of prices within the above-mentioned ranges have been tried in this study. However, the core of the trial prices can be categorized in Class 1 and 2 for cofferdam embankment fill (2 and 4 1000Rials/m3, respectively, as average for impervious and rock fill materials) and nine different types for the set of prices for tunnel excavation, tunnel support, and reinforced concrete lining. (ii) The prices are direct prices and do not include costs such as mobilization, overhead, insurance, etc. The difference, represented by a constant multiplier (of the order of 1.4 to 2.0), has no effect on the optimization results; (iii) The costs such as those related to pre-cofferdam,
downstream cofferdam, open-cut excavations and portals at the tunnel ends are not included in the total diversion cost in this study. They do not affect optimization results, as they are almost independent of D. F. Limitations
Velocity limitation in tunnels is depends on the existence of lining. In tunnels without lining the maximum velocity is 2 to 3 m2/s and in tunnel with lining that is 4 to 5 m2/s. which is probably due to erosion & cavitation. However there are many diversion tunnels designed for the maximum velocity 8 m/s2 maximum velocity. For example MOSSYROCK diversion tunnel in USA design for 8 m/s2 maximum velocity. This tunnel with a 10 m radius does not have any linings [7].
TABLE I ASSUMPTIONS EMPLOYED IN THE GUIDES ON OPTIMUM DIAMETER OF
DIVERSION TUNNEL Upstream cofferdam
Type Top width, B (m)
Average length, W(m)
Average side slope
Freeboard, Fb (m)
Embankment 5 100 to 1200 1H:2.25V 1.5
Diversion tunnel geometry
Length, L (m) Diameter, D (m)
Longitudinal slope, S
(-)
Lining thickness,
T(cm)
100 to 1400 3 to 15 0.005
(0.001 to 0.015)
30 to 75, varying linearly with D
Tunnel hydraulics
Discharge, Q (m3/s)
Manning Roughness Coefficient
, n
Manning Roughness Coefficient
, n
Manning Roughness Coefficient
, n
Flow regime Exit
50 to 1900 0.014 for RC lining
0.022 for shotcrete
0.030 for natural
rock
Pressurized (full
flow)
Unsubmerged
Tunnel support Type I
(n=0.014) Type II
(n=0.022) Type III
(n=0.030) Rock bolts Shotcrete
Rock bolts + Shotcrete + Reinforced
concrete (RC)
Rock bolts + shotcrete
Little rock bolts + little
shotcrete
~3m long
10cm thick with steel wires
Unit prices
Tunnel excavation, C1 (1000Rials/m3)
Concrete lining C2
(1000Rials/m3)
Support (rock bolts
+ shotcrete),
C3 (1000Rials
/m3)
Fill for the cofferdam,
C4 (1000Rials
/m3)
40 to 140 24 to 70 2 to 8
III. MATHEMATICAL DESCRIPTION
Let C1 (1000Rials/m3), C2 (1000Rials/m3), C3 (1000Rials
/m2) and C4 (1000Rials /m3) be the unit prices for tunnel excavation, tunnel lining, tunnel support (rock bolt + shotcrete) and cofferdam fill, respectively.
World Academy of Science, Engineering and TechnologyVol:5 2011-01-20
837
Inte
rnat
iona
l Sci
ence
Ind
ex V
ol:5
, No:
1, 2
011
was
et.o
rg/P
ublic
atio
n/17
63
Denoting the respective amount of works by V1 (m3), V2 (m3), V3 (m2) and V4 (m3), in the same order, it follows that
V1 = 0.785L [D + 2(T+0.1)] 2 (1) V2 = 3.14LT (D + T) (2) V3 = 3.14L (D+2T) (3)
V4 = W [B + 0.5 (zu + zd) (H + F)] (H + F) (4) H = [1+k+2gn2L/ (0.25D) 1.333] *
Q2 / [2g (0.785D2)2] - LS+ 0.5D (5)
where L(m) is the tunnel length, D(m) is the tunnel final diameter, T(m) is the lining thickness, W(m) is the average upstream cofferdam length, B(m) is the cofferdam top width, zu(-) and zd(-) are the upstream and downstream side slopes of the cofferdam section respectively, H(m) is the head of the water above the tunnel invert, F(m) is the cofferdam freeboard, k(-) is the coefficient of tunnel entrance loss, g(m/s2) is the gravitational acceleration, n(s/m1/3) is the Manning's roughness coefficient, Q(m3/s) is the design diversion discharge, and S(-) is the longitudinal slope of the tunnel. Note that Eq. 5 is the mathematical form of a simple hydraulic statement that the total available head (H+L*S-0.5D) is used to overcome three losses mentioned in 'Hydraulic Assumptions' above (also see USBR 1987 for a full account of hydraulics of such tunnels). The losses relate to the entrance, the friction along the tunnel surface, and the exit. The objective function then becomes Total Diversion Cost
Noting that T is assumed to vary linearly with D (see Table 1), V1 to V3 are all functions of D to the first or second degree while V4 is mainly a function of H. Accepting some degree of approximation for the tunneling cost Ct (excavation, support and lining) and cofferdam cost Cc, one may write Ct~a1LD2 and Cc~a2WH2. Because the freeboard F is relatively small compared to the cofferdam height, it is feasible to appoint H as approximate cofferdam height. Hence,
CT = a1LD2 + a2WH2 (7) H= a3LD-5.33Q2 (8) dH/dD= a4LD-6.33Q2 (9)
Where a1, a2, a3 and a4 are constants. CT does not have a maximum value because there is no theoretical limit to D or H, and CT in Eq. 7 is increasable to any large number. Therefore, solving dCT/dD=0 will result in a D corresponding to the minimum of CT.
dCT/dD = 2a1LD + 2a2WH*dH/dD = 0 (10) Substituting (9) in (10) leads to
Dopt= a5(WL)0.08 Q0.32 (11)
In which a5 is a constant and Dopt is the tunnel optimum diameter. As W and L are fairly constant in a given project, then
Dopt= a6 Q0.32 (12) With a6 being a constant depending on many parameters including W and L. Eq. 12 implies that Dopt is approximately proportional to Q0.32.
IV. MINIMIZATION FOR THE WHOLE DATA RANGE
Minimization of Eq. 6 in view of Eq.s 1 to 5 under the constraint H/D>1.2 for any set of given fixed parameters using any optimization technique will lead to Dopt. This was performed for the whole range of the data mentioned in Table 1 and variations of D (and H) were carefully examined.
V. INTRODUCTION TO OPTIMIZATION
A. Particle Swarm Optimization PSO is an evolutionary computation technique developed
by Kenney and Eberhart in 1995. The method has been developed through a simulation of simplified social models. PSO is based on swarms such as fish schooling and bird flocking. According to the research results for bird flocking, birds are finding food by flocking (not by each individual). Like GA, PSO must also have a fitness evaluation function that takes the particle’s position and assigns a fitness value to it. The position with the highest fitness value in the entire run is called the global best (gbest). Each particle also keeps track of its highest fitness value. The location of this value is called its personal best (pbest). The basic algorithm involves casting a population of particles over the search space and remembering the best (most fit) solution encountered. At each iteration, every particle adjusts its velocity vector, based on its momentum and the influence of both its best solution and the best solution of its neighbors, and then computes a new point to examine. The studies shows that the PSO has more chance to “fly” into the better solution areas more quickly, so it can discover reasonable quality solution much faster than other evolutionary algorithms. The original PSO formula is described as follows:
CT = C1 V1 + C2 V2 + C3 V3 + C4 V4 (6)
Optimization is the act of obtaining the best result under given circumstances. In design, construction, and maintenance of any engineering system, engineers have to take many technological and managerial decisions at several stages. The ultimate goal of such decisions is either to minimize the effort required or to maximize the desired benefit. Since the effort required or the benefit desired in any practical situation can be expressed as a function of certain decision variables, optimization can be defined as the process of finding the main component of optimization problems are design various, design limitation and target function. In every procedure we define values collection. At the first, constant and variable values are introduced. Design limitations are the boundary line in design that introduces a function of design result [8].
World Academy of Science, Engineering and TechnologyVol:5 2011-01-20
838
Inte
rnat
iona
l Sci
ence
Ind
ex V
ol:5
, No:
1, 2
011
was
et.o
rg/P
ublic
atio
n/17
63
vi,d(t+1)=T*vi,d(t)+c1* rand( ) *(pbesti,d(t) – xi,d(t)) + c2* rand ( ) *(gbesti,d(t) – xi,d(t)) (13)
xi,d(t+1)= xi,d(t)) + vi,d(t+1) (14) Where d is the number of dimensions (variables), i am a particle in the population, gbest is the best position vector found in a certain neighborhood of the particle, V is the velocity vector, X is the position vector, T is the inertia factor, and pbest is the position vector for a particle’s best fitness yet encountered. Parameters c1 and c2 are the cognitive and social learning rates, respectively. These two rates control the relative influence of the memory of the neighborhood and the memory of the particle [9].
VI. RESULT OF MINIMIZING THE TARGET FUNCTION BY MEANS OF PSO ALGORITHM
With definition Eq. (6) and constant values and design variables in this algorithm by means of MATLAB programming we are able to compare those with exact solution results.
0
2
4
6
8
10
12
14
16
0 500 1000 1500 2000 2500
Q(m3/s)
D(m
) Acc(n=0.014)
pso(n=0.014)
Acc(n=0.022)
pso(n=0.022)
Acc(n=0.030)
pso(n=0.030)
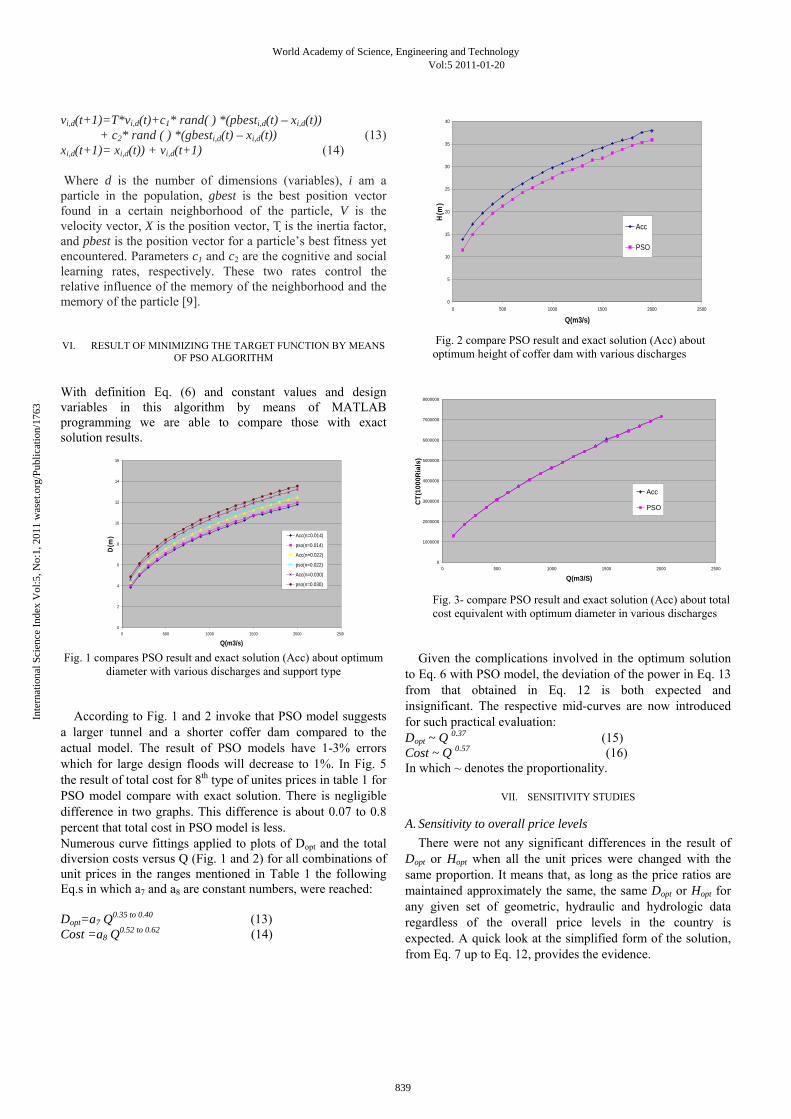
Fig. 1 compares PSO result and exact solution (Acc) about optimum
diameter with various discharges and support type
According to Fig. 1 and 2 invoke that PSO model suggests a larger tunnel and a shorter coffer dam compared to the actual model. The result of PSO models have 1-3% errors which for large design floods will decrease to 1%. In Fig. 5 the result of total cost for 8th type of unites prices in table 1 for PSO model compare with exact solution. There is negligible difference in two graphs. This difference is about 0.07 to 0.8 percent that total cost in PSO model is less. Numerous curve fittings applied to plots of Dopt and the total diversion costs versus Q (Fig. 1 and 2) for all combinations of unit prices in the ranges mentioned in Table 1 the following Eq.s in which a7 and a8 are constant numbers, were reached: Dopt=a7 Q0.35 to 0.40 (13) Cost =a8 Q0.52 to 0.62 (14)
0
5
10
15
20
25
30
35
40
0 500 1000 1500 2000 2500
Q(m3/s)
H(m
)
Acc
PSO
Fig. 2 compare PSO result and exact solution (Acc) about optimum height of coffer dam with various discharges
0
1000000
2000000
3000000
4000000
5000000
6000000
7000000
8000000
0 500 1000 1500 2000 2500
Q(m3/S)
CT(
1000
Ria
ls)
Acc
PSO
Fig. 3- compare PSO result and exact solution (Acc) about total cost equivalent with optimum diameter in various discharges
Given the complications involved in the optimum solution to Eq. 6 with PSO model, the deviation of the power in Eq. 13 from that obtained in Eq. 12 is both expected and insignificant. The respective mid-curves are now introduced for such practical evaluation: Dopt ~ Q 0.37 (15) Cost ~ Q 0.57 (16) In which ~ denotes the proportionality.
VII. SENSITIVITY STUDIES
A. Sensitivity to overall price levels There were not any significant differences in the result of
Dopt or Hopt when all the unit prices were changed with the same proportion. It means that, as long as the price ratios are maintained approximately the same, the same Dopt or Hopt for any given set of geometric, hydraulic and hydrologic data regardless of the overall price levels in the country is expected. A quick look at the simplified form of the solution, from Eq. 7 up to Eq. 12, provides the evidence.
World Academy of Science, Engineering and TechnologyVol:5 2011-01-20
839
Inte
rnat
iona
l Sci
ence
Ind
ex V
ol:5
, No:
1, 2
011
was
et.o
rg/P
ublic
atio
n/17
63
B. Sensitivity to relative price levels The solution may present significant sensitivity to the
relative price levels of the works particularly for projects involving narrow valleys (small W) and long tunnels (large L). This sensitivity diminishes for higher values of W/L ratio (W/L>0.5).
C. Sensitivity to geometry and support type Cases with smaller W/L ratio show more sensitivity to
relative variation of the unit prices. As W becomes larger, the sensitivity of the solution to L becomes negligible for Support Type I (involving RC lining) while it becomes more pronounced for Support Types II and III. The difference being in lining, this is because RC lining forms a significant portion of the total diversion cost in most projects. For a given project, Dopt is smallest for Support Type I and the largest for Support type III.
0
2
4
6
8
10
12
14
16
0 500 1000 1500 2000 2500
Q(m 3/s)
Dop
t
L=200 m
L=1500 w=100 mn=0.014C1=36C2=100C3=50C4=4
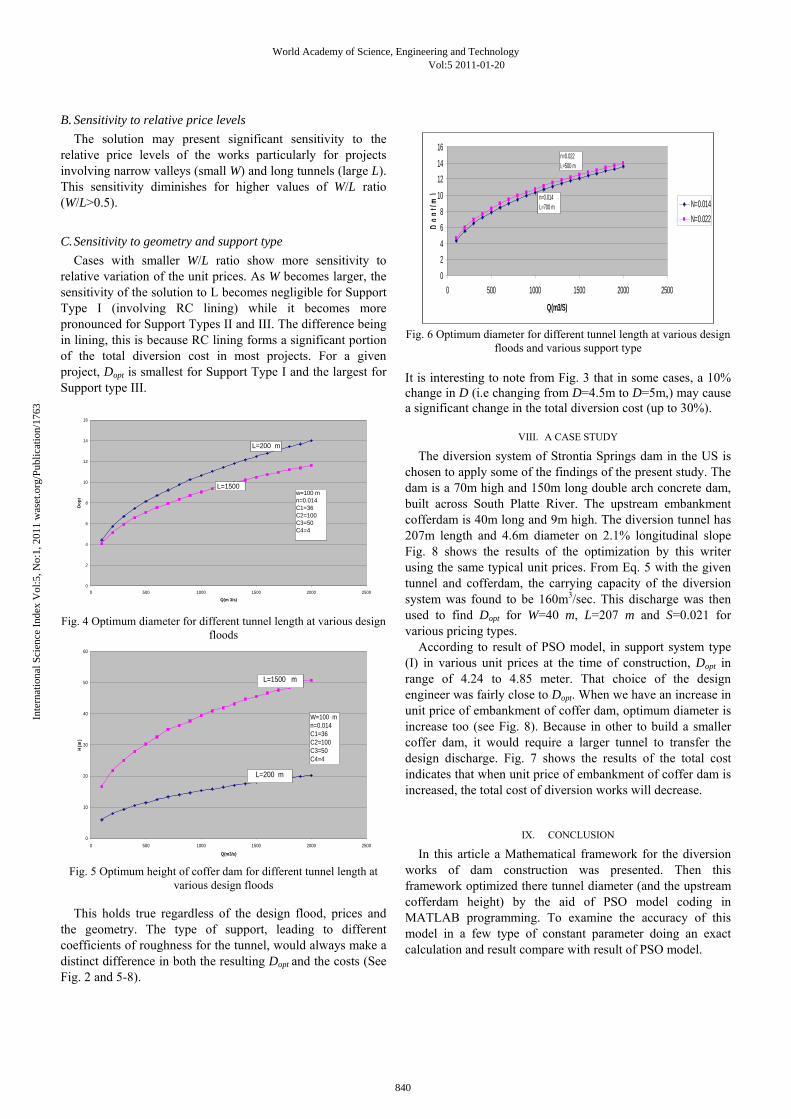
Fig. 4 Optimum diameter for different tunnel length at various design
floods
0
10
20
30
40
50
60
0 500 1000 1500 2000 2500
Q(m3/s)
H(m
)
L=1500 m
L=200 m
W=100 mn=0.014C1=36C2=100C3=50C4=4
Fig. 5 Optimum height of coffer dam for different tunnel length at
various design floods
This holds true regardless of the design flood, prices and the geometry. The type of support, leading to different coefficients of roughness for the tunnel, would always make a distinct difference in both the resulting Dopt and the costs (See Fig. 2 and 5-8).
02468
10
1214
16
0 500 1000 1500 2000 2500
Q(m3/S)
Dop
t(m)
N=0.014N=0.022
n=0.014L=700 m
n=0.022L=500 m
Fig. 6 Optimum diameter for different tunnel length at various design
floods and various support type
It is interesting to note from Fig. 3 that in some cases, a 10% change in D (i.e changing from D=4.5m to D=5m,) may cause a significant change in the total diversion cost (up to 30%).
VIII. A CASE STUDY
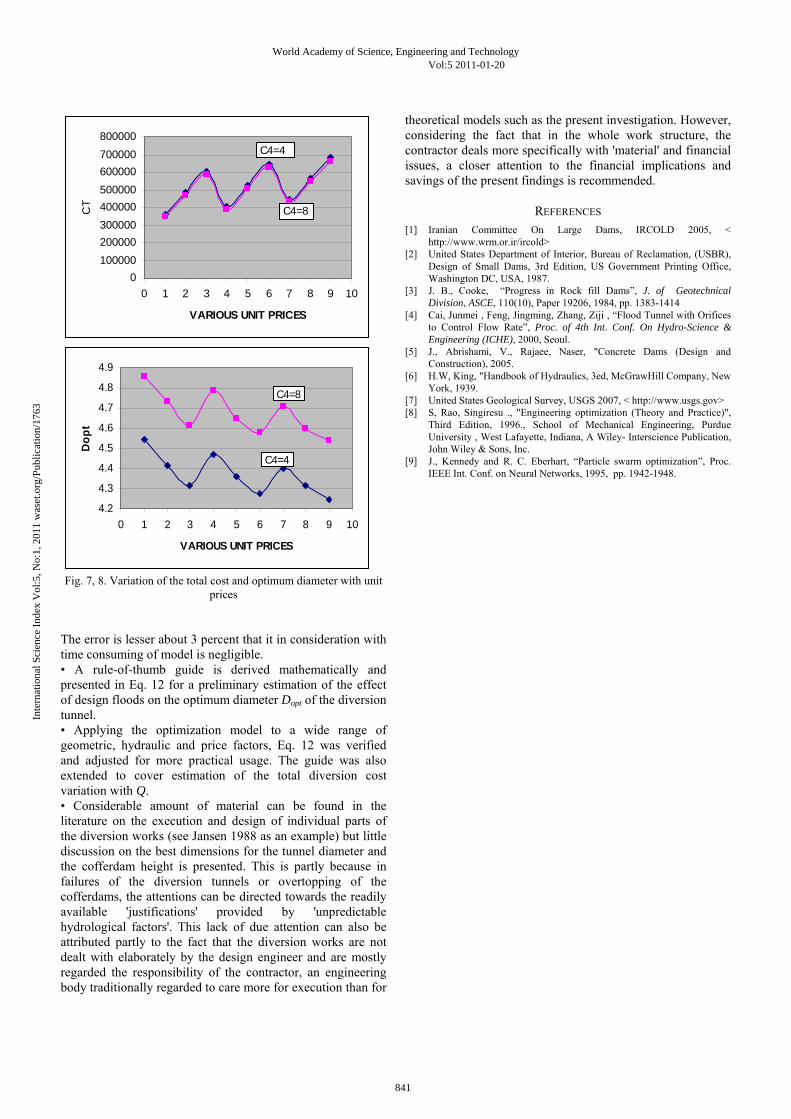
The diversion system of Strontia Springs dam in the US is chosen to apply some of the findings of the present study. The dam is a 70m high and 150m long double arch concrete dam, built across South Platte River. The upstream embankment cofferdam is 40m long and 9m high. The diversion tunnel has 207m length and 4.6m diameter on 2.1% longitudinal slope Fig. 8 shows the results of the optimization by this writer using the same typical unit prices. From Eq. 5 with the given tunnel and cofferdam, the carrying capacity of the diversion system was found to be 160m3/sec. This discharge was then used to find Dopt for W=40 m, L=207 m and S=0.021 for various pricing types.
According to result of PSO model, in support system type (I) in various unit prices at the time of construction, Dopt in range of 4.24 to 4.85 meter. That choice of the design engineer was fairly close to Dopt. When we have an increase in unit price of embankment of coffer dam, optimum diameter is increase too (see Fig. 8). Because in other to build a smaller coffer dam, it would require a larger tunnel to transfer the design discharge. Fig. 7 shows the results of the total cost indicates that when unit price of embankment of coffer dam is increased, the total cost of diversion works will decrease.
IX. CONCLUSION
In this article a Mathematical framework for the diversion works of dam construction was presented. Then this framework optimized there tunnel diameter (and the upstream cofferdam height) by the aid of PSO model coding in MATLAB programming. To examine the accuracy of this model in a few type of constant parameter doing an exact calculation and result compare with result of PSO model.
World Academy of Science, Engineering and TechnologyVol:5 2011-01-20
840
Inte
rnat
iona
l Sci
ence
Ind
ex V
ol:5
, No:
1, 2
011
was
et.o
rg/P
ublic
atio
n/17
63
0100000200000300000400000500000600000700000800000
0 1 2 3 4 5 6 7 8 9 10
VARIOUS UNIT PRICES
CT
C4=4
C4=8
4.2
4.3
4.4
4.5
4.6
4.7
4.8
4.9
0 1 2 3 4 5 6 7 8 9 10
VARIOUS UNIT PRICES
Dop
t
C4=8
C4=4
Fig. 7, 8. Variation of the total cost and optimum diameter with unit
prices The error is lesser about 3 percent that it in consideration with time consuming of model is negligible. • A rule-of-thumb guide is derived mathematically and presented in Eq. 12 for a preliminary estimation of the effect of design floods on the optimum diameter Dopt of the diversion tunnel. • Applying the optimization model to a wide range of geometric, hydraulic and price factors, Eq. 12 was verified and adjusted for more practical usage. The guide was also extended to cover estimation of the total diversion cost variation with Q. • Considerable amount of material can be found in the literature on the execution and design of individual parts of the diversion works (see Jansen 1988 as an example) but little discussion on the best dimensions for the tunnel diameter and the cofferdam height is presented. This is partly because in failures of the diversion tunnels or overtopping of the cofferdams, the attentions can be directed towards the readily available 'justifications' provided by 'unpredictable hydrological factors'. This lack of due attention can also be attributed partly to the fact that the diversion works are not dealt with elaborately by the design engineer and are mostly regarded the responsibility of the contractor, an engineering body traditionally regarded to care more for execution than for
theoretical models such as the present investigation. However, considering the fact that in the whole work structure, the contractor deals more specifically with 'material' and financial issues, a closer attention to the financial implications and savings of the present findings is recommended.
REFERENCES [1] Iranian Committee On Large Dams, IRCOLD 2005, <
http://www.wrm.or.ir/ircold> [2] United States Department of Interior, Bureau of Reclamation, (USBR),
Design of Small Dams, 3rd Edition, US Government Printing Office, Washington DC, USA, 1987.
[3] J. B., Cooke, “Progress in Rock fill Dams”, J. of Geotechnical Division, ASCE, 110(10), Paper 19206, 1984, pp. 1383-1414
[4] Cai, Junmei , Feng, Jingming, Zhang, Ziji , “Flood Tunnel with Orifices to Control Flow Rate”, Proc. of 4th Int. Conf. On Hydro-Science & Engineering (ICHE), 2000, Seoul.
[5] J., Abrishami, V., Rajaee, Naser, "Concrete Dams (Design and Construction), 2005.
[6] H.W, King, "Handbook of Hydraulics, 3ed, McGrawHill Company, New York, 1939.
[7] United States Geological Survey, USGS 2007, < http://www.usgs.gov> [8] S, Rao, Singiresu ., "Engineering optimization (Theory and Practice)",
Third Edition, 1996., School of Mechanical Engineering, Purdue University , West Lafayette, Indiana, A Wiley- Interscience Publication, John Wiley & Sons, Inc.
[9] J., Kennedy and R. C. Eberhart, “Particle swarm optimization”, Proc. IEEE Int. Conf. on Neural Networks, 1995, pp. 1942-1948.
World Academy of Science, Engineering and TechnologyVol:5 2011-01-20
841
Inte
rnat
iona
l Sci
ence
Ind
ex V
ol:5
, No:
1, 2
011
was
et.o
rg/P
ublic
atio
n/17
63