A new methodology for sensory quality assessment of garlic ...
12
A new methodology for sensory quality assessment of garlic based on metabolomics and an artificial neural network† Jian Liu,‡ ab Lixia Liu,‡ a Wei Guo, a Minglang Fu, a Minli Yang, a Shengxiong Huang, b Feng Zhang * a and Yongsheng Liu * b This study has established a new method for the sensory quality determination of garlic and garlic products on the basis of metabolomics and an artificial neural network. A total of 89 quality indicators were obtained, mainly through the metabolomics analysis using gas chromatography/mass spectrometry (GC/MS) and high performance liquid chromatography coupled with tandem mass spectrometry (HPLC-MS/MS). The quality indicator data were standardized and fused at a low level, and then seven representative indicators including the a* (redness) value, and the contents of S-methyl-L-cysteine, 3-vinyl-1,2- dithiacyclohex-5-ene, glutamic acid, L-tyrosine, D-fructose and propene were screened by partial least squares discriminant analysis (PLS-DA), analysis of variance (ANOVA) and correlation analysis (CA). Subsequently, the seven representative indicators were employed as the input data, while the sensory scores for the garlic obtained by a traditional sensory evaluation were regarded as the output data. A back propagation artificial neural network (BPANN) model was constructed for predicting the sensory quality of garlic from four different areas in China. The R 2 value of the linear regression equation between the predicted scores and the traditional sensory scores for the garlic was 0.9866, with a mean square error of 0.0034, indicating that the fitting degree was high and that the BPANN model built in this study could predict the sensory quality of garlic accurately. In general, the method developed in this study for the sensory quality determination of garlic and garlic products is rapid, simple and efficient, and can be considered as a potential method for application in quality control in the food industry. Introduction Garlic (Allium sativum L.) is one of the most frequently consumed vegetables belonging to the Liliaceae family. Because of its special avor and taste, garlic has been enjoyed as a food and condiment by people in almost all parts of the world for a long time. 1,2 Moreover, garlic is characterized by its enormous nutritional value and biological activities, including its effect in reducing blood lipid, resisting bacteria, eliminating inam- mation, and preventing cardiovascular diseases. 3–5 Recently, various garlic products have become available, such as garlic paste, garlic slices, salted garlic, picked garlic and fermented garlic, so as to suit the growing demands of consumers. As one of the important aspects of garlic quality, the sensory quality of garlic and garlic products is easily inuenced by the cultivars, geographical origin, and processing methods of the garlic. 6,7 In addition, researchers have proved that the sensory quality of garlic and garlic products is not only associ- ated with its content of organosulfur compounds, but also closely related to the contents of sugars, amino acids, and phenolics. For example, Pardo et al. 7 analyzed relationships between the physicochemical and sensory parameters of 14 garlic varieties, and showed that the total sugar content was positively connected with the color parameters a* and h* (indicating red-green component and hue angle, respectively). Zhang et al. 8 found that the temperature had a signicant inuence on the basic indictors of sensory quality of black garlic, including the browning intensity, reducing sugar, total acids and allicin. Li et al. 9 identied several phenolic compounds in garlic which could inhibit the decomposition of alliin and alliinase. Allicin can be produced when alliin reacts with alliinase, and allicin is easily decomposed into a series of S- containing volatiles, which are the main source of the avor of garlic. However, the literature on garlic sensory quality reported so far does not fully reect the sensory quality of garlic and garlic products by considering both physical and chemical traits. Moreover, the relationship between physical and a Institute of Food Safety, Chinese Academy of Inspection & Quarantine, Beijing 100176, China. E-mail: [email protected]; [email protected]; Fax: +86- 10-53898008; Tel: +86 13651290763 b School of Food Science and Engineering, Hefei University of Technology, Hefei 230009, China † Electronic supplementary information (ESI) available. See DOI: 10.1039/c9ra01978b ‡ These authors contributed equally to this work. Cite this: RSC Adv. , 2019, 9, 17754 Received 14th March 2019 Accepted 6th May 2019 DOI: 10.1039/c9ra01978b rsc.li/rsc-advances 17754 | RSC Adv. , 2019, 9, 17754–17765 This journal is © The Royal Society of Chemistry 2019 RSC Advances PAPER Open Access Article. Published on 06 June 2019. Downloaded on 3/15/2022 12:29:48 PM. This article is licensed under a Creative Commons Attribution-NonCommercial 3.0 Unported Licence. View Article Online View Journal | View Issue
Transcript of A new methodology for sensory quality assessment of garlic ...
RSC Advances
PAPER
Ope
n A
cces
s A
rtic
le. P
ublis
hed
on 0
6 Ju
ne 2
019.
Dow
nloa
ded
on 3
/15/
2022
12:
29:4
8 PM
. T
his
artic
le is
lice
nsed
und
er a
Cre
ativ
e C
omm
ons
Attr
ibut
ion-
Non
Com
mer
cial
3.0
Unp
orte
d L
icen
ce.
View Article OnlineView Journal | View Issue
A new methodol
aInstitute of Food Safety, Chinese Academ
100176, China. E-mail: [email protected]
10-53898008; Tel: +86 13651290763bSchool of Food Science and Engineering, Hef
China
† Electronic supplementary informa10.1039/c9ra01978b
‡ These authors contributed equally to th
Cite this: RSC Adv., 2019, 9, 17754
Received 14th March 2019Accepted 6th May 2019
DOI: 10.1039/c9ra01978b
rsc.li/rsc-advances
17754 | RSC Adv., 2019, 9, 17754–17765
ogy for sensory quality assessmentof garlic based on metabolomics and an artificialneural network†
Jian Liu,‡ab Lixia Liu,‡a Wei Guo,a Minglang Fu,a Minli Yang,a Shengxiong Huang,b
Feng Zhang *a and Yongsheng Liu*b
This study has established a newmethod for the sensory quality determination of garlic and garlic products
on the basis of metabolomics and an artificial neural network. A total of 89 quality indicators were obtained,
mainly through the metabolomics analysis using gas chromatography/mass spectrometry (GC/MS) and
high performance liquid chromatography coupled with tandem mass spectrometry (HPLC-MS/MS). The
quality indicator data were standardized and fused at a low level, and then seven representative
indicators including the a* (redness) value, and the contents of S-methyl-L-cysteine, 3-vinyl-1,2-
dithiacyclohex-5-ene, glutamic acid, L-tyrosine, D-fructose and propene were screened by partial least
squares discriminant analysis (PLS-DA), analysis of variance (ANOVA) and correlation analysis (CA).
Subsequently, the seven representative indicators were employed as the input data, while the sensory
scores for the garlic obtained by a traditional sensory evaluation were regarded as the output data. A
back propagation artificial neural network (BPANN) model was constructed for predicting the sensory
quality of garlic from four different areas in China. The R2 value of the linear regression equation
between the predicted scores and the traditional sensory scores for the garlic was 0.9866, with a mean
square error of 0.0034, indicating that the fitting degree was high and that the BPANN model built in this
study could predict the sensory quality of garlic accurately. In general, the method developed in this
study for the sensory quality determination of garlic and garlic products is rapid, simple and efficient, and
can be considered as a potential method for application in quality control in the food industry.
Introduction
Garlic (Allium sativum L.) is one of the most frequentlyconsumed vegetables belonging to the Liliaceae family. Becauseof its special avor and taste, garlic has been enjoyed as a foodand condiment by people in almost all parts of the world fora long time.1,2 Moreover, garlic is characterized by its enormousnutritional value and biological activities, including its effect inreducing blood lipid, resisting bacteria, eliminating inam-mation, and preventing cardiovascular diseases.3–5
Recently, various garlic products have become available,such as garlic paste, garlic slices, salted garlic, picked garlic andfermented garlic, so as to suit the growing demands ofconsumers. As one of the important aspects of garlic quality, the
y of Inspection & Quarantine, Beijing
; [email protected]; Fax: +86-
ei University of Technology, Hefei 230009,
tion (ESI) available. See DOI:
is work.
sensory quality of garlic and garlic products is easily inuencedby the cultivars, geographical origin, and processingmethods ofthe garlic.6,7 In addition, researchers have proved that thesensory quality of garlic and garlic products is not only associ-ated with its content of organosulfur compounds, but alsoclosely related to the contents of sugars, amino acids, andphenolics. For example, Pardo et al.7 analyzed relationshipsbetween the physicochemical and sensory parameters of 14garlic varieties, and showed that the total sugar content waspositively connected with the color parameters a* and h*(indicating red-green component and hue angle, respectively).Zhang et al.8 found that the temperature had a signicantinuence on the basic indictors of sensory quality of blackgarlic, including the browning intensity, reducing sugar, totalacids and allicin. Li et al.9 identied several phenoliccompounds in garlic which could inhibit the decomposition ofalliin and alliinase. Allicin can be produced when alliin reactswith alliinase, and allicin is easily decomposed into a series of S-containing volatiles, which are the main source of the avor ofgarlic. However, the literature on garlic sensory quality reportedso far does not fully reect the sensory quality of garlic andgarlic products by considering both physical and chemicaltraits. Moreover, the relationship between physical and
This journal is © The Royal Society of Chemistry 2019
Paper RSC Advances
Ope
n A
cces
s A
rtic
le. P
ublis
hed
on 0
6 Ju
ne 2
019.
Dow
nloa
ded
on 3
/15/
2022
12:
29:4
8 PM
. T
his
artic
le is
lice
nsed
und
er a
Cre
ativ
e C
omm
ons
Attr
ibut
ion-
Non
Com
mer
cial
3.0
Unp
orte
d L
icen
ce.
View Article Online
chemical traits and sensory quality needs a further study, whichmay promote the sensory evaluation of garlic and the develop-ment of garlic breeding for special avor.
Currently, the most commonly used method for evaluatingthe sensory quality of garlic and garlic products depends ona descriptive sensory analysis and uses a trained panel,10–12 butthis has the disadvantages of being time-consuming and easilyaffected by subjective factors. Although some new instrumentshave already been used in sensory analysis of food, such as anelectronic tongue and nose, they are still too expensive to beroutinely used for quality control.
Since metabolomics offers a powerful means of monitoringall component concentrations that may be related to the sensoryquality of a food sample,13 it has been widely applied in the foodindustry and it makes the sensory quality assessment of garlicmore accurate and comprehensive. Besides, a combination ofmultiple instrumental techniques can be more effective indiscovering broader types of metabolites, and has been widelyapplied in the eld of food.14,15 In particular, multivariatestatistical analysis is used to screen the most important qualityindicators of a food, and includes analysis of variance (ANOVA),principal component analysis (PCA) and correlation analysis(CA).16,17 These screened sensory quality indicators offer moreaccurate information about food quality and simplify theprogression of the food quality assessment. However, thesensory evaluation of garlic based on metabolomics has notbeen reported.
The back propagation articial neural network (BPANN)model is an articial intelligence information processingsystem and is recognized as one of the mostly extensively usedarticial neural network models. Since the BPANN modelmainly imitates the human brain in processing complicatedissues, a BPANNmodel generally includes three layers: an inputlayer, a hidden layer, and an output layer.18 Central to theconstruction of a BPANN model is the continual training of theinput data and the target output data until the accuracy of thepredicted results is satisfactory, which is very convenient anddoes not require any mathematical formula, or weighting ofinput data.19 Therefore, a BPANN model not only has thecapability to solve linear problems, but can also be applied tothe handling of nonlinear problems. Nevertheless, the BPANNmodel does have several drawbacks: for instance, the model-related parameters (which are the sensitivity factors forapplying the BPANNmodel) are difficult for learners to conrm,and non-ideal reproducibility is oen encountered. However,a number of investigations have reported satisfactory results forfood quality assessment using a BPANN model. For example,Wang et al.20 established a BPANN model based on the data ofhyperspectral imaging and successfully discriminated ricevariety and quality. Lu et al.21 developed an efficient approachbased on a grade classication model and a BPANN model, andthe accuracy of this new approach for predicting the eatingquality of rice reached 90%. In order to accurately assess thestorage quality of fresh-cut green peppers, Meng et al.22 builta BPANN model using oxygen, carbon dioxide, temperature andhumidity as the input data, and b value, water loss, rmness
This journal is © The Royal Society of Chemistry 2019
and vitamin C content as the output data, and the establishedBPANN model gave good predicted results.
The present study aims to establish a new methodology forsensory quality assessment of garlic and garlic productsbased on metabolomics and an articial neural network.Firstly, the whole chemical constituents of garlic wereacquired by a non-targeted metabolomics method, mainlyusing gas chromatography/mass spectrometry (GC/MS) andhigh performance liquid chromatography coupled withtandem mass spectrometry (HPLC-MS/MS) for detectingdifferent classes of compounds. Secondly, the obtained dataon the garlic constituents was combined through low-levelfusion, and ltered by partial least squares discriminantanalysis (PLS-DA), ANOVA and CA, in order to identifyrepresentative sensory quality indicators for garlic. Thirdly,a BPANN model was established for predicting the sensoryquality of garlic; the representative sensory quality indicatorsof garlic were used as the input data of the BPANN model,and the sensory scores of garlic obtained by traditionalsensory evaluation were regarded as the output data. Acorrelation coefficient between the predicted scores (from thedeveloped BPANN model) and the sensory scores of garlic(obtained by traditional sensory evaluation) using a linearregression model was adopted to validate the BPANN model.This method is valuable not only for evaluating the quality ofgarlic and garlic products comprehensively and objectively,so determining the quality characteristics of different garliccultivars, but also for developing garlic products andpromoting the development of the garlic industry.
Material and methodsGarlic samples
A total of twenty-eight garlic samples (Allium sativum L.) werecollected from the four main garlic-producing areas in China:Shandong (7 samples, SD1-SD7), Henan (7 samples, HN1–HN7),Jiangsu (7 samples, JS1–JS7) and Yunnan (7 samples, YN1–YN7).The detailed information for the samples is listed in Table S1.†The varieties were authenticated by Prof. Minli Yang at theInstitute of Food Safety, Chinese Academy of Inspection &Quarantine (China). All of the garlic samples were harvested inJune 2018, collected directly from the producers, and thenstored at 4–8 �C until analysis.
Chemicals
Methanol (MeOH), chloroform (CHCl3), n-hexane, and aceto-nitrile were obtained from Merck (Darmstadt, Germany).Methoxyamine hydrochloride, N-methyl-N-(trimethylsilyl) tri-uoroacetamide (MSTFA), pyridine, normal alkane standards(C7–C30), isopentanol, ribitol, and standards of phenoliccompounds (including apigenin, isorhamnetin, naringenin,hyperoside, luteolin, quercetin, quercitrin, myricetin, caffeicacid, ferulic acid, chlorogenic acid, p-coumaric acid, proto-catechuic acid, resveratrol, and phthalic acid) were supplied bySigma-Aldrich (St. Louis, Missouri, USA).
RSC Adv., 2019, 9, 17754–17765 | 17755
RSC Advances Paper
Ope
n A
cces
s A
rtic
le. P
ublis
hed
on 0
6 Ju
ne 2
019.
Dow
nloa
ded
on 3
/15/
2022
12:
29:4
8 PM
. T
his
artic
le is
lice
nsed
und
er a
Cre
ativ
e C
omm
ons
Attr
ibut
ion-
Non
Com
mer
cial
3.0
Unp
orte
d L
icen
ce.
View Article Online
Analysis of volatile metabolites
The method adopted for determination of volatile metaboliteswas modied on the basis of previous studies.23,24 Garlic (2 g)was weighed and chopped, and then placed into a 20 mL glassvial. Isopentanol (5 mL) was added into the above glass vial asthe internal standard, and then sample preparation was carriedout immediately on a CTC CombiPal autosampler (Zwingen,Switzerland). A solid-phase microextraction (SPME) coated ber(50/30 mm, DVB/CAR/PDMS) was selected based on the previousliterature.25 The sample was incubated (40 �C, 10 min) and theextraction of volatiles was then performed with continuousstirring (40 �C, 40 min). The volatiles were determined utilizingan Agilent 7890A gas chromatograph connected to an AgilentMS detector (5975C inert XL MSD with Triple-Axis Detector).Aer the extraction, the ber was inserted into the GC inlet foranalysis of volatiles (250 �C, 5 min, split ratio of 5 : 1). Thevolatiles were separated using a HP-Innowax column (60 m �0.25 mm � 0.25 mm, Agilent Technologies, USA), using heliumas the carrier gas (1.0 mL min�1). The column temperatureprogram was as follows: 40 �C (0–3 min), 40–240 �C (3–43 min),and 240 �C (43–48 min). The MS quadrupole and the transferline were both operated at the same temperature of 150 �C. Theoperating temperature for MS and the mass range studied were230 �C and 40–500 m/z, respectively.26 The measurements ofvolatile metabolites were repeated six times for each sample.The identication of volatile metabolites was mainly accom-plished according to the NIST library and assisted by theretention indices, which were evaluated using C7–C30alkanes.27 Moreover, the content of volatile metabolites wasdetermined relative to the content of isopentanol.
Analysis of primary metabolites
Based on the method of Lisec et al.,28 the procedure for testingprimary metabolites was as follows: 100 mg lyophilized samplewas weighed into a 2 mL Eppendorf tube, then mixed with1.4 mL of 60% aqueous methanol and 60 mL ribitol in distilledwater (0.2 mg mL�1). A sonicator (30 Hz, 10 min) and a ther-momixer (950 rpm, 70 �C, and 10 min) were used for thoroughmixing. Then, the sample was centrifuged at 11 000g for 15 minat 4 �C, aer which the supernatant was extracted with 0.75 mLchloroform and 1.5 mL distilled water, and vortexed for 10 s.Subsequently, the centrifugation step was repeated, and a poly-tetrauoroethylene (PTFE) lter (0.2 mm) was used for furtherpurication of the supernatant, which was then dried for oxi-mation. The oximation of the dried sample was performed with40 mL of methoxyamine hydrochloride in pyridine (20 mgmL�1), with a reaction temperature of 37 �C and a reaction timeof 90 min. Finally, MSTFA (70 mL) was added into the abovesolution and the temperature was held at 37 �C for another30 min to nish the silylation. Another Agilent 7890A GC systemequipped with a MS detector (5975C inert XL MSD with Triple-Axis Detector, Agilent) was applied for the analysis of primarymetabolites. The sample (1 mL) was inserted into the GC inlet(250 �C, 5 min, split ratio of 5 : 1). A DB-5MS capillary column(30 m � 0.25 mm � 0.25, Agilent Technologies, USA) wasemployed using helium as the carrier gas (1.5 mL min�1). The
17756 | RSC Adv., 2019, 9, 17754–17765
column temperature program was as follows: 70 �C (0–2 min),70–300 �C (2–23 min), and 300 �C (23–29 min). The MS quad-rupole and the transfer line were both operated at the sametemperature (150 �C). The operating temperature for MS andthe mass range studied were 230 �C and 40–600 m/z, respec-tively. The measurements of primary metabolites were repeatedsix times for each sample. Identication of primary metaboliteswas performed in the same way as that for volatile metabolites,by reference to the NIST library and the retention indices. Theconcentration of primary metabolites was determined relativeto the content of ribitol.
Analysis of secondary metabolites
A lyophilized sample (100 mg) was weighed into a 2 mLEppendorf tube, and then extracted using 1.5 mL of 60%aqueous methanol. The mixture was put into a sonicator (30 Hz,10 min) for sufficient homogenization. The next step was tocentrifuge the sample at 11 000g for 15 min at 4 �C, aer whicha PTFE lter (0.2 mm) was used for further purication of thesupernatant. A Symbiosis Pharma HPLC linked with a triplequadrupole mass analyzer (API 6500QTRAP, AppliedBiosystems/MDS Sciex) was used for the secondary metaboliteanalysis. The sample (10 mL) was injected into a ZORBAX SB-C18column (150 mm � 4.6 mm, 5 mm particle size, Agilent, SantaClara, USA) for separation, and a gradient system (0.8mL min�1) was adopted. Formic acid aqueous solution (0.1%)(A) and acetonitrile (B) constituted the mobile phase. Thegradient program was set as follows: 0–2 min, 90% A; 2–7 min,90% to 40% A; 7–15 min, 40% to 20% A; 15–16 min, 20% to 90%A; and 16–17 min, 90% A. The spray voltage in negative modewas set at 4500 V. The other parameters were set as follows:nebulizer gas, 55 psi; curtain gas 40 psi; and auxiliary heatinggas, 55 psi. Tandem MS analysis of the secondary metaboliteswas performed in multiple reaction monitoring mode. Theevaluation of secondary metabolites was repeated six times foreach sample. Identication of secondary metabolites was basedon the MS information provided by authentic standards, andexternal standard curves of the authentic standards were usedto gain quantitative information about the target metabolites.
Color measurements
The measurement of garlic color was based on the method ofDan et al.29 Each sample (50 g) was weighed and extracted using50 mL aqueous methanol. Aer adequate homogenization, themixture was centrifugated (10 000g, 4 �C, 10 min) to obtaina clear supernatant that was then tested by a colorimeter(NH300, Beijing Hongruida Technology Co., Ltd, Beijing,China). The color results of the garlic sample were representedwith values of L*, a* and b*, which represent lightness, rednessand yellowness, respectively. Every sample was assessed andrecorded three times.
Determination of hardness
The hardness of the peeled garlic was determined using anelectronic hardness tester (GY-4, Beijing Hongruida TechnologyCo., Ltd, Beijing, China). The peeled garlic sample was placed
This journal is © The Royal Society of Chemistry 2019
Paper RSC Advances
Ope
n A
cces
s A
rtic
le. P
ublis
hed
on 0
6 Ju
ne 2
019.
Dow
nloa
ded
on 3
/15/
2022
12:
29:4
8 PM
. T
his
artic
le is
lice
nsed
und
er a
Cre
ativ
e C
omm
ons
Attr
ibut
ion-
Non
Com
mer
cial
3.0
Unp
orte
d L
icen
ce.
View Article Online
on the plate of the tester, and a cylinder with a diameter of3.5 mm was slowly inserted into the garlic to a depth of 10 mm.The electronic data reading of the tester was recorded and themean value of three measurements was used to represent thehardness of each garlic sample.
Other quality indicators
Moisture content was measured according to the Chinesenational standard (GB5009.3-2016).30 Reducing sugar contentwas determined by reference to the method of Zhang et al.31 Thecontent determination of allicin was performed according tothe method of Ramirez et al.32 Four sulfur-amino acids, namely(+)-S-allyl-L-cysteine (SAC), (+)-S-methyl-L-cysteine (SMC), (+)-S-allyl-L-cysteine sulfoxide (alliin) and (+)-S-methyl-L-cysteinesulfoxide (methiin) were evaluated on the basis of Kim et al.33 Inaddition, the ascorbic acid content was assessed according tothe method of Montano et al.34 All experiments were carried outin triplicate.
Traditional sensory evaluation
A traditional sensory evaluation was performed using a methodadapted from Horita et al.35 and Constenla and Lozano36 Twelveeducated panelists carried out the sensory evaluation and theoverall scores were evaluated according to four characteristics(texture, taste, appearance and avor) of the garlic samples, aspresented in Table S2.† A 9-point hedonic scale was used toassess the overall sensory score of each garlic sample37 and thesensory evaluation of every garlic sample was repeated threetimes.
Statistical analysis
The data obtained aer normalization of all the indicators wasentered into the soware SIMCA-P+ (Version 13.0) for PLS-DA,and the variable inuence on projection (VIP) of the PLS-DAwas used to perform a preliminary screen of quality indica-tors. Subsequently, ANOVA and CA were executed by SPSSsoware (version 20, IBM Inc. USA), to further select represen-tative sensory quality indicators of the garlic samples. Finally,the BPANN model for predicting the sensory quality of garlicwas established by Matlab (version R2016a, The MathworksInc., MA, USA).
Result and discussionTraditional sensory evaluation
Sensory evaluation is one of the essential techniques used in thefood area, and provides a reasonable assessment of the targetfood by evaluation experts based on their olfactory senses, tastesenses and visual senses. According to the result of the tradi-tional sensory evaluation presented in Table 1, the character-istics (texture, taste, appearance, avor and overall impression)of 28 garlic samples from different provinces showed remark-able geographical differences. Specically, garlic samples fromYunnan gained lower texture scores due to their hard texture,possibly caused by the drought climate of Yunnan which leadsto the low content of water in the garlic. Besides, garlic samples
This journal is © The Royal Society of Chemistry 2019
from Yunnan showed the strongest spicy taste and garlic avor.Compared with garlic samples from Yunnan, Jiangsu andHenan, the taste and avor of garlic samples from Shandonghad the lowest scores, suggesting that garlic samples fromShandong have the weakest spicy taste and garlic avor.
Data fusion and preliminary screening of quality indicators
This research rstly investigated the physical and chemicalproperties of garlics sourced from four different areas, mainlybased on metabolomics, to provide a data basis for thescreening of sensory quality indicators. Aer data pre-processing, 76 metabolites were tentatively identied,including 25 volatile metabolites, 39 primary metabolites and12 secondary metabolites. In the meantime, we also measuredfour sulfur-amino acids, allicin, ascorbic acid, reducing sugar,hardness, L* value, a* value, b* value and moisture content ofthe garlic samples.
The next step was to combine the multiple data sets ob-tained from the different instrumental sources, to realizea complementarity between instruments and produce a morecomprehensive and accurate sensory quality assessment ofthe garlic. Before the data fusion, the initial data werenormalized to eliminate dimensional disturbances. Thus,zero-mean normalization of initial data was adapted in thisstudy.38 In order to distinguish the garlic samples andinvestigate the differences in the sensory quality indicators,the normalized data was entered into the soware SIMCA-P+to perform PLS-DA. A PLS-DA model with 3 components wasestablished (Fig. 1a) and the model quality was evaluated,with R2(X) ¼ 0.583, R2(Y) ¼ 0.969, and Q2¼ 0.948. A permu-tation test (n ¼ 200) was performed to validate the PLS-DAmodel and the results are shown in Fig. 1b, indicating thatthe PLS-DA model based on 89 sensory quality indicators wasnot overtted and was statistically acceptable. Each dot inFig. 1a represents a garlic sample and the correspondinggarlic name is marked nearby. The garlic samples that areplaced together have similar levels of quality indicators andthe garlic samples that are well separated have extremelydifferent levels of quality indicators. From the PLS-DA score,it can obviously be seen that the garlic samples collectedfrom the same province are closely placed, which implies thatthey have similar levels of sensory quality indicators. Inparticular, the garlic samples produced in Shandong andYunnan are separated signicantly from those from Jiangsuand Henan, suggesting that the sensory quality of garlics inShandong and Yunnan is quite different from that in garlicsfrom the other two provinces. In addition, the garlic samplescollected from Henan and Jiangsu are mixed together in thescore plot, indicating that there is little difference in thesensory quality of garlic samples from these two places.
As one of the most frequently used criteria in variableselection methods, VIP claries the importance of variablesin the projection and determines the variables thatcontribute the most to a PLS model.39 Therefore, the variableswith VIP > 1 in the present study were thought to be impor-tant sensory quality indicators of garlics from the four
RSC Adv., 2019, 9, 17754–17765 | 17757
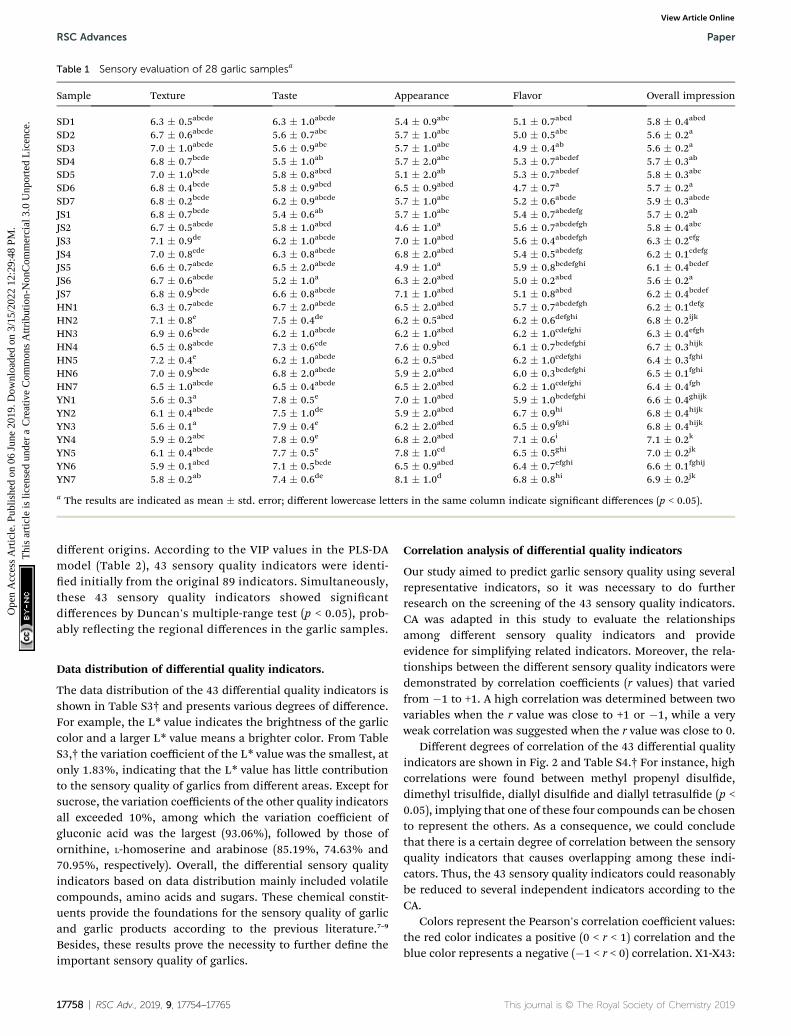
Table 1 Sensory evaluation of 28 garlic samplesa
Sample Texture Taste Appearance Flavor Overall impression
SD1 6.3 � 0.5abcde 6.3 � 1.0abcde 5.4 � 0.9abc 5.1 � 0.7abcd 5.8 � 0.4abcd
SD2 6.7 � 0.6abcde 5.6 � 0.7abc 5.7 � 1.0abc 5.0 � 0.5abc 5.6 � 0.2a
SD3 7.0 � 1.0abcde 5.6 � 0.9abc 5.7 � 1.0abc 4.9 � 0.4ab 5.6 � 0.2a
SD4 6.8 � 0.7bcde 5.5 � 1.0ab 5.7 � 2.0abc 5.3 � 0.7abcdef 5.7 � 0.3ab
SD5 7.0 � 1.0bcde 5.8 � 0.8abcd 5.1 � 2.0ab 5.3 � 0.7abcdef 5.8 � 0.3abc
SD6 6.8 � 0.4bcde 5.8 � 0.9abcd 6.5 � 0.9abcd 4.7 � 0.7a 5.7 � 0.2a
SD7 6.8 � 0.2bcde 6.2 � 0.9abcde 5.7 � 1.0abc 5.2 � 0.6abcde 5.9 � 0.3abcde
JS1 6.8 � 0.7bcde 5.4 � 0.6ab 5.7 � 1.0abc 5.4 � 0.7abcdefg 5.7 � 0.2ab
JS2 6.7 � 0.5abcde 5.8 � 1.0abcd 4.6 � 1.0a 5.6 � 0.7abcdefgh 5.8 � 0.4abc
JS3 7.1 � 0.9de 6.2 � 1.0abcde 7.0 � 1.0abcd 5.6 � 0.4abcdefgh 6.3 � 0.2efg
JS4 7.0 � 0.8cde 6.3 � 0.8abcde 6.8 � 2.0abcd 5.4 � 0.5abcdefg 6.2 � 0.1cdefg
JS5 6.6 � 0.7abcde 6.5 � 2.0abcde 4.9 � 1.0a 5.9 � 0.8bcdefghi 6.1 � 0.4bcdef
JS6 6.7 � 0.6abcde 5.2 � 1.0a 6.3 � 2.0abcd 5.0 � 0.2abcd 5.6 � 0.2a
JS7 6.8 � 0.9bcde 6.6 � 0.8abcde 7.1 � 1.0abcd 5.1 � 0.8abcd 6.2 � 0.4bcdef
HN1 6.3 � 0.7abcde 6.7 � 2.0abcde 6.5 � 2.0abcd 5.7 � 0.7abcdefgh 6.2 � 0.1defg
HN2 7.1 � 0.8e 7.5 � 0.4de 6.2 � 0.5abcd 6.2 � 0.6defghi 6.8 � 0.2ijk
HN3 6.9 � 0.6bcde 6.2 � 1.0abcde 6.2 � 1.0abcd 6.2 � 1.0cdefghi 6.3 � 0.4efgh
HN4 6.5 � 0.8abcde 7.3 � 0.6cde 7.6 � 0.9bcd 6.1 � 0.7bcdefghi 6.7 � 0.3hijk
HN5 7.2 � 0.4e 6.2 � 1.0abcde 6.2 � 0.5abcd 6.2 � 1.0cdefghi 6.4 � 0.3fghi
HN6 7.0 � 0.9bcde 6.8 � 2.0abcde 5.9 � 2.0abcd 6.0 � 0.3bcdefghi 6.5 � 0.1fghi
HN7 6.5 � 1.0abcde 6.5 � 0.4abcde 6.5 � 2.0abcd 6.2 � 1.0cdefghi 6.4 � 0.4fgh
YN1 5.6 � 0.3a 7.8 � 0.5e 7.0 � 1.0abcd 5.9 � 1.0bcdefghi 6.6 � 0.4ghijk
YN2 6.1 � 0.4abcde 7.5 � 1.0de 5.9 � 2.0abcd 6.7 � 0.9hi 6.8 � 0.4hijk
YN3 5.6 � 0.1a 7.9 � 0.4e 6.2 � 2.0abcd 6.5 � 0.9fghi 6.8 � 0.4hijk
YN4 5.9 � 0.2abc 7.8 � 0.9e 6.8 � 2.0abcd 7.1 � 0.6i 7.1 � 0.2k
YN5 6.1 � 0.4abcde 7.7 � 0.5e 7.8 � 1.0cd 6.5 � 0.5ghi 7.0 � 0.2jk
YN6 5.9 � 0.1abcd 7.1 � 0.5bcde 6.5 � 0.9abcd 6.4 � 0.7efghi 6.6 � 0.1fghij
YN7 5.8 � 0.2ab 7.4 � 0.6de 8.1 � 1.0d 6.8 � 0.8hi 6.9 � 0.2jk
a The results are indicated as mean � std. error; different lowercase letters in the same column indicate signicant differences (p < 0.05).
RSC Advances Paper
Ope
n A
cces
s A
rtic
le. P
ublis
hed
on 0
6 Ju
ne 2
019.
Dow
nloa
ded
on 3
/15/
2022
12:
29:4
8 PM
. T
his
artic
le is
lice
nsed
und
er a
Cre
ativ
e C
omm
ons
Attr
ibut
ion-
Non
Com
mer
cial
3.0
Unp
orte
d L
icen
ce.
View Article Online
different origins. According to the VIP values in the PLS-DAmodel (Table 2), 43 sensory quality indicators were identi-ed initially from the original 89 indicators. Simultaneously,these 43 sensory quality indicators showed signicantdifferences by Duncan's multiple-range test (p < 0.05), prob-ably reecting the regional differences in the garlic samples.
Data distribution of differential quality indicators.
The data distribution of the 43 differential quality indicators isshown in Table S3† and presents various degrees of difference.For example, the L* value indicates the brightness of the garliccolor and a larger L* value means a brighter color. From TableS3,† the variation coefficient of the L* value was the smallest, atonly 1.83%, indicating that the L* value has little contributionto the sensory quality of garlics from different areas. Except forsucrose, the variation coefficients of the other quality indicatorsall exceeded 10%, among which the variation coefficient ofgluconic acid was the largest (93.06%), followed by those ofornithine, L-homoserine and arabinose (85.19%, 74.63% and70.95%, respectively). Overall, the differential sensory qualityindicators based on data distribution mainly included volatilecompounds, amino acids and sugars. These chemical constit-uents provide the foundations for the sensory quality of garlicand garlic products according to the previous literature.7–9
Besides, these results prove the necessity to further dene theimportant sensory quality of garlics.
17758 | RSC Adv., 2019, 9, 17754–17765
Correlation analysis of differential quality indicators
Our study aimed to predict garlic sensory quality using severalrepresentative indicators, so it was necessary to do furtherresearch on the screening of the 43 sensory quality indicators.CA was adapted in this study to evaluate the relationshipsamong different sensory quality indicators and provideevidence for simplifying related indicators. Moreover, the rela-tionships between the different sensory quality indicators weredemonstrated by correlation coefficients (r values) that variedfrom �1 to +1. A high correlation was determined between twovariables when the r value was close to +1 or �1, while a veryweak correlation was suggested when the r value was close to 0.
Different degrees of correlation of the 43 differential qualityindicators are shown in Fig. 2 and Table S4.† For instance, highcorrelations were found between methyl propenyl disulde,dimethyl trisulde, diallyl disulde and diallyl tetrasulde (p <0.05), implying that one of these four compounds can be chosento represent the others. As a consequence, we could concludethat there is a certain degree of correlation between the sensoryquality indicators that causes overlapping among these indi-cators. Thus, the 43 sensory quality indicators could reasonablybe reduced to several independent indicators according to theCA.
Colors represent the Pearson's correlation coefficient values:the red color indicates a positive (0 < r < 1) correlation and theblue color represents a negative (�1 < r < 0) correlation. X1-X43:
This journal is © The Royal Society of Chemistry 2019
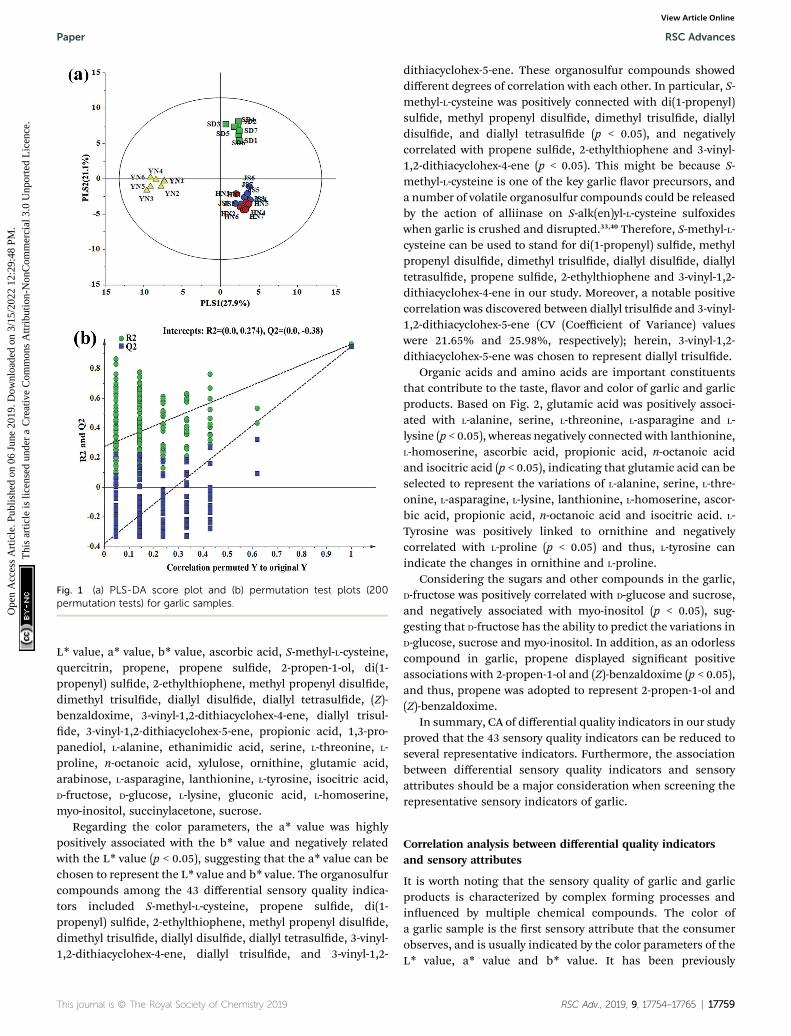
Fig. 1 (a) PLS-DA score plot and (b) permutation test plots (200permutation tests) for garlic samples.
Paper RSC Advances
Ope
n A
cces
s A
rtic
le. P
ublis
hed
on 0
6 Ju
ne 2
019.
Dow
nloa
ded
on 3
/15/
2022
12:
29:4
8 PM
. T
his
artic
le is
lice
nsed
und
er a
Cre
ativ
e C
omm
ons
Attr
ibut
ion-
Non
Com
mer
cial
3.0
Unp
orte
d L
icen
ce.
View Article Online
L* value, a* value, b* value, ascorbic acid, S-methyl-L-cysteine,quercitrin, propene, propene sulde, 2-propen-1-ol, di(1-propenyl) sulde, 2-ethylthiophene, methyl propenyl disulde,dimethyl trisulde, diallyl disulde, diallyl tetrasulde, (Z)-benzaldoxime, 3-vinyl-1,2-dithiacyclohex-4-ene, diallyl trisul-de, 3-vinyl-1,2-dithiacyclohex-5-ene, propionic acid, 1,3-pro-panediol, L-alanine, ethanimidic acid, serine, L-threonine, L-proline, n-octanoic acid, xylulose, ornithine, glutamic acid,arabinose, L-asparagine, lanthionine, L-tyrosine, isocitric acid,D-fructose, D-glucose, L-lysine, gluconic acid, L-homoserine,myo-inositol, succinylacetone, sucrose.
Regarding the color parameters, the a* value was highlypositively associated with the b* value and negatively relatedwith the L* value (p < 0.05), suggesting that the a* value can bechosen to represent the L* value and b* value. The organosulfurcompounds among the 43 differential sensory quality indica-tors included S-methyl-L-cysteine, propene sulde, di(1-propenyl) sulde, 2-ethylthiophene, methyl propenyl disulde,dimethyl trisulde, diallyl disulde, diallyl tetrasulde, 3-vinyl-1,2-dithiacyclohex-4-ene, diallyl trisulde, and 3-vinyl-1,2-
This journal is © The Royal Society of Chemistry 2019
dithiacyclohex-5-ene. These organosulfur compounds showeddifferent degrees of correlation with each other. In particular, S-methyl-L-cysteine was positively connected with di(1-propenyl)sulde, methyl propenyl disulde, dimethyl trisulde, diallyldisulde, and diallyl tetrasulde (p < 0.05), and negativelycorrelated with propene sulde, 2-ethylthiophene and 3-vinyl-1,2-dithiacyclohex-4-ene (p < 0.05). This might be because S-methyl-L-cysteine is one of the key garlic avor precursors, anda number of volatile organosulfur compounds could be releasedby the action of alliinase on S-alk(en)yl-L-cysteine sulfoxideswhen garlic is crushed and disrupted.33,40 Therefore, S-methyl-L-cysteine can be used to stand for di(1-propenyl) sulde, methylpropenyl disulde, dimethyl trisulde, diallyl disulde, diallyltetrasulde, propene sulde, 2-ethylthiophene and 3-vinyl-1,2-dithiacyclohex-4-ene in our study. Moreover, a notable positivecorrelation was discovered between diallyl trisulde and 3-vinyl-1,2-dithiacyclohex-5-ene (CV (Coefficient of Variance) valueswere 21.65% and 25.98%, respectively); herein, 3-vinyl-1,2-dithiacyclohex-5-ene was chosen to represent diallyl trisulde.
Organic acids and amino acids are important constituentsthat contribute to the taste, avor and color of garlic and garlicproducts. Based on Fig. 2, glutamic acid was positively associ-ated with L-alanine, serine, L-threonine, L-asparagine and L-lysine (p < 0.05), whereas negatively connected with lanthionine,L-homoserine, ascorbic acid, propionic acid, n-octanoic acidand isocitric acid (p < 0.05), indicating that glutamic acid can beselected to represent the variations of L-alanine, serine, L-thre-onine, L-asparagine, L-lysine, lanthionine, L-homoserine, ascor-bic acid, propionic acid, n-octanoic acid and isocitric acid. L-Tyrosine was positively linked to ornithine and negativelycorrelated with L-proline (p < 0.05) and thus, L-tyrosine canindicate the changes in ornithine and L-proline.
Considering the sugars and other compounds in the garlic,D-fructose was positively correlated with D-glucose and sucrose,and negatively associated with myo-inositol (p < 0.05), sug-gesting that D-fructose has the ability to predict the variations inD-glucose, sucrose and myo-inositol. In addition, as an odorlesscompound in garlic, propene displayed signicant positiveassociations with 2-propen-1-ol and (Z)-benzaldoxime (p < 0.05),and thus, propene was adopted to represent 2-propen-1-ol and(Z)-benzaldoxime.
In summary, CA of differential quality indicators in our studyproved that the 43 sensory quality indicators can be reduced toseveral representative indicators. Furthermore, the associationbetween differential sensory quality indicators and sensoryattributes should be a major consideration when screening therepresentative sensory indicators of garlic.
Correlation analysis between differential quality indicatorsand sensory attributes
It is worth noting that the sensory quality of garlic and garlicproducts is characterized by complex forming processes andinuenced by multiple chemical compounds. The color ofa garlic sample is the rst sensory attribute that the consumerobserves, and is usually indicated by the color parameters of theL* value, a* value and b* value. It has been previously
RSC Adv., 2019, 9, 17754–17765 | 17759
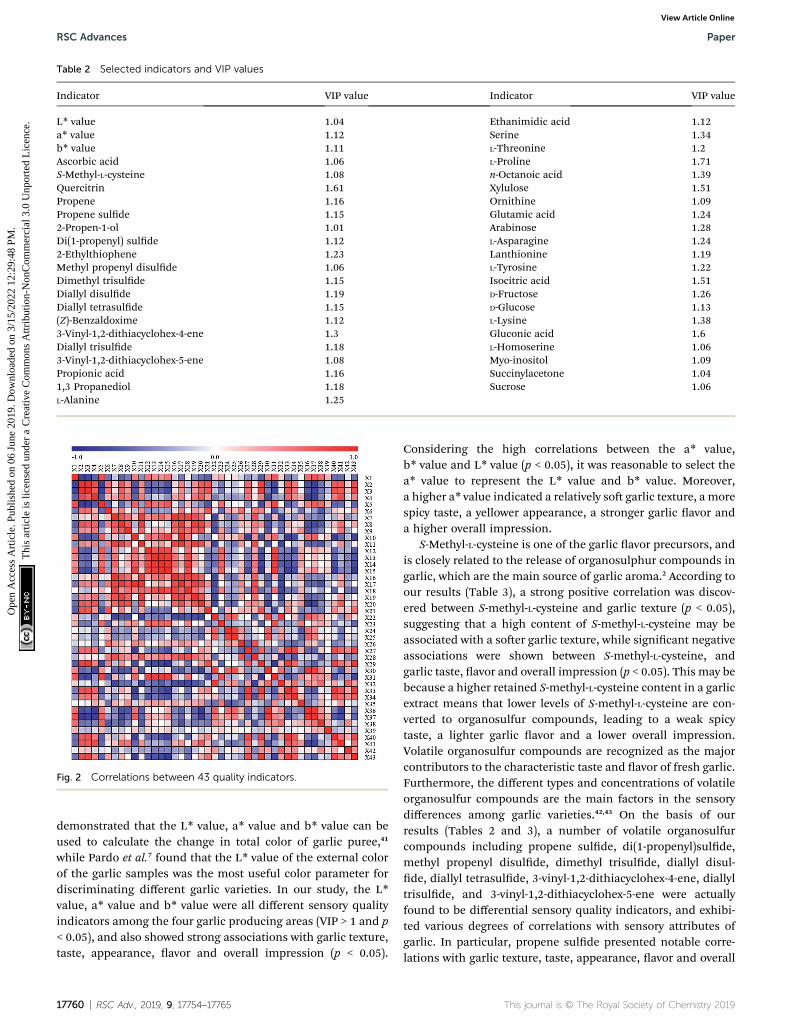
Table 2 Selected indicators and VIP values
Indicator VIP value Indicator VIP value
L* value 1.04 Ethanimidic acid 1.12a* value 1.12 Serine 1.34b* value 1.11 L-Threonine 1.2Ascorbic acid 1.06 L-Proline 1.71S-Methyl-L-cysteine 1.08 n-Octanoic acid 1.39Quercitrin 1.61 Xylulose 1.51Propene 1.16 Ornithine 1.09Propene sulde 1.15 Glutamic acid 1.242-Propen-1-ol 1.01 Arabinose 1.28Di(1-propenyl) sulde 1.12 L-Asparagine 1.242-Ethylthiophene 1.23 Lanthionine 1.19Methyl propenyl disulde 1.06 L-Tyrosine 1.22Dimethyl trisulde 1.15 Isocitric acid 1.51Diallyl disulde 1.19 D-Fructose 1.26Diallyl tetrasulde 1.15 D-Glucose 1.13(Z)-Benzaldoxime 1.12 L-Lysine 1.383-Vinyl-1,2-dithiacyclohex-4-ene 1.3 Gluconic acid 1.6Diallyl trisulde 1.18 L-Homoserine 1.063-Vinyl-1,2-dithiacyclohex-5-ene 1.08 Myo-inositol 1.09Propionic acid 1.16 Succinylacetone 1.041,3 Propanediol 1.18 Sucrose 1.06L-Alanine 1.25
Fig. 2 Correlations between 43 quality indicators.
RSC Advances Paper
Ope
n A
cces
s A
rtic
le. P
ublis
hed
on 0
6 Ju
ne 2
019.
Dow
nloa
ded
on 3
/15/
2022
12:
29:4
8 PM
. T
his
artic
le is
lice
nsed
und
er a
Cre
ativ
e C
omm
ons
Attr
ibut
ion-
Non
Com
mer
cial
3.0
Unp
orte
d L
icen
ce.
View Article Online
demonstrated that the L* value, a* value and b* value can beused to calculate the change in total color of garlic puree,41
while Pardo et al.7 found that the L* value of the external colorof the garlic samples was the most useful color parameter fordiscriminating different garlic varieties. In our study, the L*value, a* value and b* value were all different sensory qualityindicators among the four garlic producing areas (VIP > 1 and p< 0.05), and also showed strong associations with garlic texture,taste, appearance, avor and overall impression (p < 0.05).
17760 | RSC Adv., 2019, 9, 17754–17765
Considering the high correlations between the a* value,b* value and L* value (p < 0.05), it was reasonable to select thea* value to represent the L* value and b* value. Moreover,a higher a* value indicated a relatively so garlic texture, a morespicy taste, a yellower appearance, a stronger garlic avor anda higher overall impression.
S-Methyl-L-cysteine is one of the garlic avor precursors, andis closely related to the release of organosulphur compounds ingarlic, which are the main source of garlic aroma.2 According toour results (Table 3), a strong positive correlation was discov-ered between S-methyl-L-cysteine and garlic texture (p < 0.05),suggesting that a high content of S-methyl-L-cysteine may beassociated with a soer garlic texture, while signicant negativeassociations were shown between S-methyl-L-cysteine, andgarlic taste, avor and overall impression (p < 0.05). This may bebecause a higher retained S-methyl-L-cysteine content in a garlicextract means that lower levels of S-methyl-L-cysteine are con-verted to organosulfur compounds, leading to a weak spicytaste, a lighter garlic avor and a lower overall impression.Volatile organosulfur compounds are recognized as the majorcontributors to the characteristic taste and avor of fresh garlic.Furthermore, the different types and concentrations of volatileorganosulfur compounds are the main factors in the sensorydifferences among garlic varieties.42,43 On the basis of ourresults (Tables 2 and 3), a number of volatile organosulfurcompounds including propene sulde, di(1-propenyl)sulde,methyl propenyl disulde, dimethyl trisulde, diallyl disul-de, diallyl tetrasulde, 3-vinyl-1,2-dithiacyclohex-4-ene, diallyltrisulde, and 3-vinyl-1,2-dithiacyclohex-5-ene were actuallyfound to be differential sensory quality indicators, and exhibi-ted various degrees of correlations with sensory attributes ofgarlic. In particular, propene sulde presented notable corre-lations with garlic texture, taste, appearance, avor and overall
This journal is © The Royal Society of Chemistry 2019
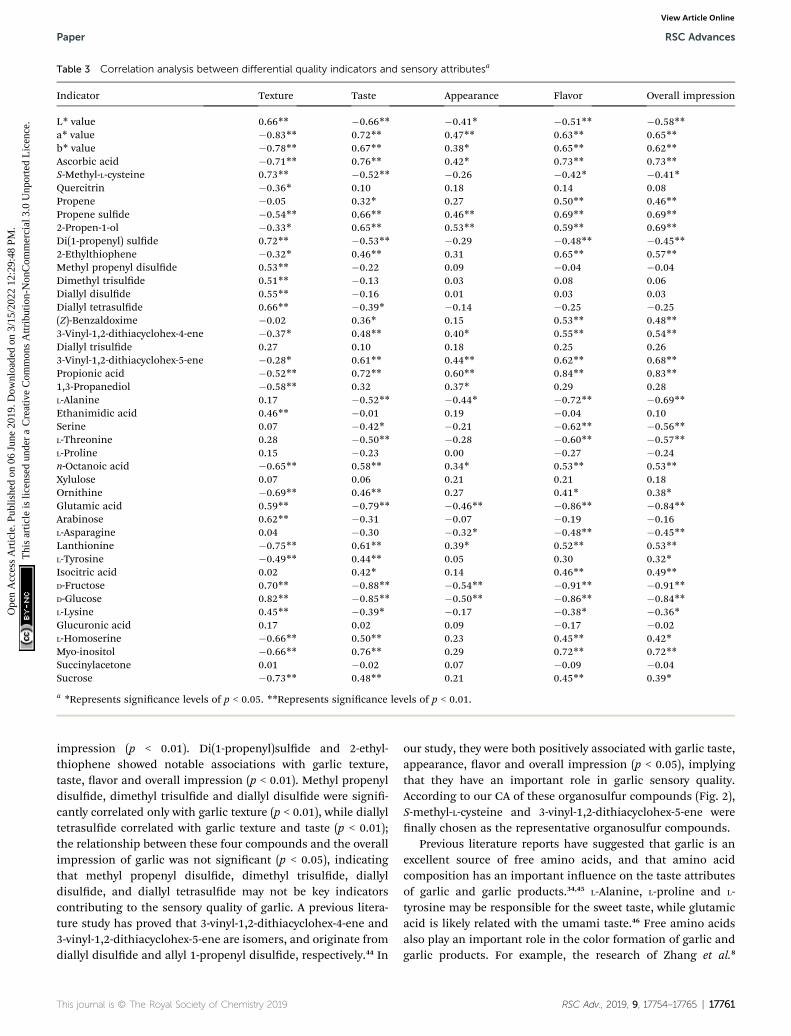
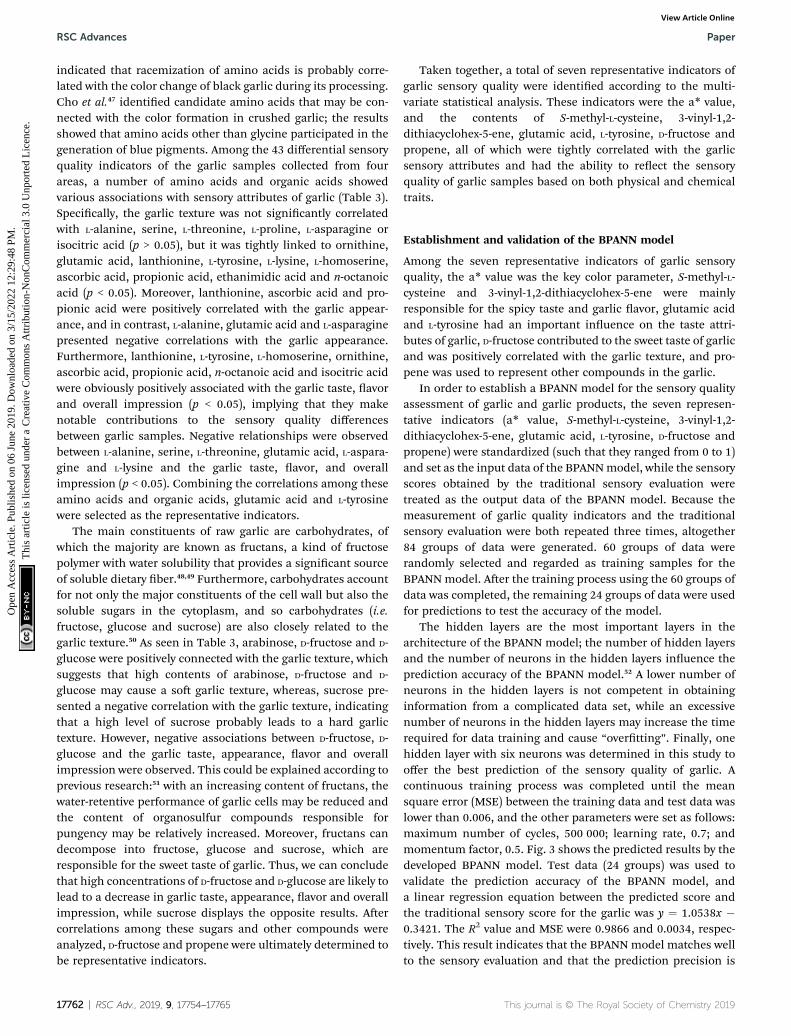
Table 3 Correlation analysis between differential quality indicators and sensory attributesa
Indicator Texture Taste Appearance Flavor Overall impression
L* value 0.66** �0.66** �0.41* �0.51** �0.58**a* value �0.83** 0.72** 0.47** 0.63** 0.65**b* value �0.78** 0.67** 0.38* 0.65** 0.62**Ascorbic acid �0.71** 0.76** 0.42* 0.73** 0.73**S-Methyl-L-cysteine 0.73** �0.52** �0.26 �0.42* �0.41*Quercitrin �0.36* 0.10 0.18 0.14 0.08Propene �0.05 0.32* 0.27 0.50** 0.46**Propene sulde �0.54** 0.66** 0.46** 0.69** 0.69**2-Propen-1-ol �0.33* 0.65** 0.53** 0.59** 0.69**Di(1-propenyl) sulde 0.72** �0.53** �0.29 �0.48** �0.45**2-Ethylthiophene �0.32* 0.46** 0.31 0.65** 0.57**Methyl propenyl disulde 0.53** �0.22 0.09 �0.04 �0.04Dimethyl trisulde 0.51** �0.13 0.03 0.08 0.06Diallyl disulde 0.55** �0.16 0.01 0.03 0.03Diallyl tetrasulde 0.66** �0.39* �0.14 �0.25 �0.25(Z)-Benzaldoxime �0.02 0.36* 0.15 0.53** 0.48**3-Vinyl-1,2-dithiacyclohex-4-ene �0.37* 0.48** 0.40* 0.55** 0.54**Diallyl trisulde 0.27 0.10 0.18 0.25 0.263-Vinyl-1,2-dithiacyclohex-5-ene �0.28* 0.61** 0.44** 0.62** 0.68**Propionic acid �0.52** 0.72** 0.60** 0.84** 0.83**1,3-Propanediol �0.58** 0.32 0.37* 0.29 0.28L-Alanine 0.17 �0.52** �0.44* �0.72** �0.69**Ethanimidic acid 0.46** �0.01 0.19 �0.04 0.10Serine 0.07 �0.42* �0.21 �0.62** �0.56**L-Threonine 0.28 �0.50** �0.28 �0.60** �0.57**L-Proline 0.15 �0.23 0.00 �0.27 �0.24n-Octanoic acid �0.65** 0.58** 0.34* 0.53** 0.53**Xylulose 0.07 0.06 0.21 0.21 0.18Ornithine �0.69** 0.46** 0.27 0.41* 0.38*Glutamic acid 0.59** �0.79** �0.46** �0.86** �0.84**Arabinose 0.62** �0.31 �0.07 �0.19 �0.16L-Asparagine 0.04 �0.30 �0.32* �0.48** �0.45**Lanthionine �0.75** 0.61** 0.39* 0.52** 0.53**L-Tyrosine �0.49** 0.44** 0.05 0.30 0.32*Isocitric acid 0.02 0.42* 0.14 0.46** 0.49**D-Fructose 0.70** �0.88** �0.54** �0.91** �0.91**D-Glucose 0.82** �0.85** �0.50** �0.86** �0.84**L-Lysine 0.45** �0.39* �0.17 �0.38* �0.36*Glucuronic acid 0.17 0.02 0.09 �0.17 �0.02L-Homoserine �0.66** 0.50** 0.23 0.45** 0.42*Myo-inositol �0.66** 0.76** 0.29 0.72** 0.72**Succinylacetone 0.01 �0.02 0.07 �0.09 �0.04Sucrose �0.73** 0.48** 0.21 0.45** 0.39*
a *Represents signicance levels of p < 0.05. **Represents signicance levels of p < 0.01.
Paper RSC Advances
Ope
n A
cces
s A
rtic
le. P
ublis
hed
on 0
6 Ju
ne 2
019.
Dow
nloa
ded
on 3
/15/
2022
12:
29:4
8 PM
. T
his
artic
le is
lice
nsed
und
er a
Cre
ativ
e C
omm
ons
Attr
ibut
ion-
Non
Com
mer
cial
3.0
Unp
orte
d L
icen
ce.
View Article Online
impression (p < 0.01). Di(1-propenyl)sulde and 2-ethyl-thiophene showed notable associations with garlic texture,taste, avor and overall impression (p < 0.01). Methyl propenyldisulde, dimethyl trisulde and diallyl disulde were signi-cantly correlated only with garlic texture (p < 0.01), while diallyltetrasulde correlated with garlic texture and taste (p < 0.01);the relationship between these four compounds and the overallimpression of garlic was not signicant (p < 0.05), indicatingthat methyl propenyl disulde, dimethyl trisulde, diallyldisulde, and diallyl tetrasulde may not be key indicatorscontributing to the sensory quality of garlic. A previous litera-ture study has proved that 3-vinyl-1,2-dithiacyclohex-4-ene and3-vinyl-1,2-dithiacyclohex-5-ene are isomers, and originate fromdiallyl disulde and allyl 1-propenyl disulde, respectively.44 In
This journal is © The Royal Society of Chemistry 2019
our study, they were both positively associated with garlic taste,appearance, avor and overall impression (p < 0.05), implyingthat they have an important role in garlic sensory quality.According to our CA of these organosulfur compounds (Fig. 2),S-methyl-L-cysteine and 3-vinyl-1,2-dithiacyclohex-5-ene werenally chosen as the representative organosulfur compounds.
Previous literature reports have suggested that garlic is anexcellent source of free amino acids, and that amino acidcomposition has an important inuence on the taste attributesof garlic and garlic products.34,45 L-Alanine, L-proline and L-tyrosine may be responsible for the sweet taste, while glutamicacid is likely related with the umami taste.46 Free amino acidsalso play an important role in the color formation of garlic andgarlic products. For example, the research of Zhang et al.8
RSC Adv., 2019, 9, 17754–17765 | 17761
RSC Advances Paper
Ope
n A
cces
s A
rtic
le. P
ublis
hed
on 0
6 Ju
ne 2
019.
Dow
nloa
ded
on 3
/15/
2022
12:
29:4
8 PM
. T
his
artic
le is
lice
nsed
und
er a
Cre
ativ
e C
omm
ons
Attr
ibut
ion-
Non
Com
mer
cial
3.0
Unp
orte
d L
icen
ce.
View Article Online
indicated that racemization of amino acids is probably corre-lated with the color change of black garlic during its processing.Cho et al.47 identied candidate amino acids that may be con-nected with the color formation in crushed garlic; the resultsshowed that amino acids other than glycine participated in thegeneration of blue pigments. Among the 43 differential sensoryquality indicators of the garlic samples collected from fourareas, a number of amino acids and organic acids showedvarious associations with sensory attributes of garlic (Table 3).Specically, the garlic texture was not signicantly correlatedwith L-alanine, serine, L-threonine, L-proline, L-asparagine orisocitric acid (p > 0.05), but it was tightly linked to ornithine,glutamic acid, lanthionine, L-tyrosine, L-lysine, L-homoserine,ascorbic acid, propionic acid, ethanimidic acid and n-octanoicacid (p < 0.05). Moreover, lanthionine, ascorbic acid and pro-pionic acid were positively correlated with the garlic appear-ance, and in contrast, L-alanine, glutamic acid and L-asparaginepresented negative correlations with the garlic appearance.Furthermore, lanthionine, L-tyrosine, L-homoserine, ornithine,ascorbic acid, propionic acid, n-octanoic acid and isocitric acidwere obviously positively associated with the garlic taste, avorand overall impression (p < 0.05), implying that they makenotable contributions to the sensory quality differencesbetween garlic samples. Negative relationships were observedbetween L-alanine, serine, L-threonine, glutamic acid, L-aspara-gine and L-lysine and the garlic taste, avor, and overallimpression (p < 0.05). Combining the correlations among theseamino acids and organic acids, glutamic acid and L-tyrosinewere selected as the representative indicators.
The main constituents of raw garlic are carbohydrates, ofwhich the majority are known as fructans, a kind of fructosepolymer with water solubility that provides a signicant sourceof soluble dietary ber.48,49 Furthermore, carbohydrates accountfor not only the major constituents of the cell wall but also thesoluble sugars in the cytoplasm, and so carbohydrates (i.e.fructose, glucose and sucrose) are also closely related to thegarlic texture.50 As seen in Table 3, arabinose, D-fructose and D-glucose were positively connected with the garlic texture, whichsuggests that high contents of arabinose, D-fructose and D-glucose may cause a so garlic texture, whereas, sucrose pre-sented a negative correlation with the garlic texture, indicatingthat a high level of sucrose probably leads to a hard garlictexture. However, negative associations between D-fructose, D-glucose and the garlic taste, appearance, avor and overallimpression were observed. This could be explained according toprevious research:51 with an increasing content of fructans, thewater-retentive performance of garlic cells may be reduced andthe content of organosulfur compounds responsible forpungency may be relatively increased. Moreover, fructans candecompose into fructose, glucose and sucrose, which areresponsible for the sweet taste of garlic. Thus, we can concludethat high concentrations of D-fructose and D-glucose are likely tolead to a decrease in garlic taste, appearance, avor and overallimpression, while sucrose displays the opposite results. Aercorrelations among these sugars and other compounds wereanalyzed, D-fructose and propene were ultimately determined tobe representative indicators.
17762 | RSC Adv., 2019, 9, 17754–17765
Taken together, a total of seven representative indicators ofgarlic sensory quality were identied according to the multi-variate statistical analysis. These indicators were the a* value,and the contents of S-methyl-L-cysteine, 3-vinyl-1,2-dithiacyclohex-5-ene, glutamic acid, L-tyrosine, D-fructose andpropene, all of which were tightly correlated with the garlicsensory attributes and had the ability to reect the sensoryquality of garlic samples based on both physical and chemicaltraits.
Establishment and validation of the BPANN model
Among the seven representative indicators of garlic sensoryquality, the a* value was the key color parameter, S-methyl-L-cysteine and 3-vinyl-1,2-dithiacyclohex-5-ene were mainlyresponsible for the spicy taste and garlic avor, glutamic acidand L-tyrosine had an important inuence on the taste attri-butes of garlic, D-fructose contributed to the sweet taste of garlicand was positively correlated with the garlic texture, and pro-pene was used to represent other compounds in the garlic.
In order to establish a BPANN model for the sensory qualityassessment of garlic and garlic products, the seven represen-tative indicators (a* value, S-methyl-L-cysteine, 3-vinyl-1,2-dithiacyclohex-5-ene, glutamic acid, L-tyrosine, D-fructose andpropene) were standardized (such that they ranged from 0 to 1)and set as the input data of the BPANNmodel, while the sensoryscores obtained by the traditional sensory evaluation weretreated as the output data of the BPANN model. Because themeasurement of garlic quality indicators and the traditionalsensory evaluation were both repeated three times, altogether84 groups of data were generated. 60 groups of data wererandomly selected and regarded as training samples for theBPANN model. Aer the training process using the 60 groups ofdata was completed, the remaining 24 groups of data were usedfor predictions to test the accuracy of the model.
The hidden layers are the most important layers in thearchitecture of the BPANN model; the number of hidden layersand the number of neurons in the hidden layers inuence theprediction accuracy of the BPANN model.52 A lower number ofneurons in the hidden layers is not competent in obtaininginformation from a complicated data set, while an excessivenumber of neurons in the hidden layers may increase the timerequired for data training and cause “overtting”. Finally, onehidden layer with six neurons was determined in this study tooffer the best prediction of the sensory quality of garlic. Acontinuous training process was completed until the meansquare error (MSE) between the training data and test data waslower than 0.006, and the other parameters were set as follows:maximum number of cycles, 500 000; learning rate, 0.7; andmomentum factor, 0.5. Fig. 3 shows the predicted results by thedeveloped BPANN model. Test data (24 groups) was used tovalidate the prediction accuracy of the BPANN model, anda linear regression equation between the predicted score andthe traditional sensory score for the garlic was y ¼ 1.0538x �0.3421. The R2 value and MSE were 0.9866 and 0.0034, respec-tively. This result indicates that the BPANN model matches wellto the sensory evaluation and that the prediction precision is
This journal is © The Royal Society of Chemistry 2019
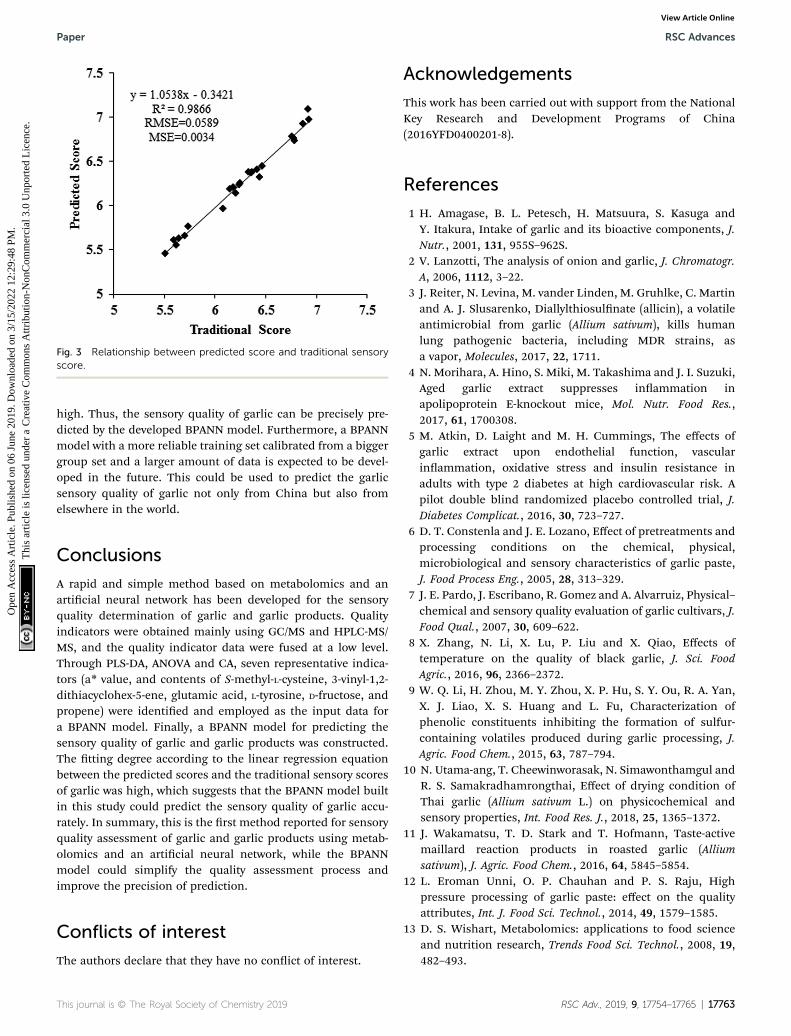
Fig. 3 Relationship between predicted score and traditional sensoryscore.
Paper RSC Advances
Ope
n A
cces
s A
rtic
le. P
ublis
hed
on 0
6 Ju
ne 2
019.
Dow
nloa
ded
on 3
/15/
2022
12:
29:4
8 PM
. T
his
artic
le is
lice
nsed
und
er a
Cre
ativ
e C
omm
ons
Attr
ibut
ion-
Non
Com
mer
cial
3.0
Unp
orte
d L
icen
ce.
View Article Online
high. Thus, the sensory quality of garlic can be precisely pre-dicted by the developed BPANN model. Furthermore, a BPANNmodel with a more reliable training set calibrated from a biggergroup set and a larger amount of data is expected to be devel-oped in the future. This could be used to predict the garlicsensory quality of garlic not only from China but also fromelsewhere in the world.
Conclusions
A rapid and simple method based on metabolomics and anarticial neural network has been developed for the sensoryquality determination of garlic and garlic products. Qualityindicators were obtained mainly using GC/MS and HPLC-MS/MS, and the quality indicator data were fused at a low level.Through PLS-DA, ANOVA and CA, seven representative indica-tors (a* value, and contents of S-methyl-L-cysteine, 3-vinyl-1,2-dithiacyclohex-5-ene, glutamic acid, L-tyrosine, D-fructose, andpropene) were identied and employed as the input data fora BPANN model. Finally, a BPANN model for predicting thesensory quality of garlic and garlic products was constructed.The tting degree according to the linear regression equationbetween the predicted scores and the traditional sensory scoresof garlic was high, which suggests that the BPANN model builtin this study could predict the sensory quality of garlic accu-rately. In summary, this is the rst method reported for sensoryquality assessment of garlic and garlic products using metab-olomics and an articial neural network, while the BPANNmodel could simplify the quality assessment process andimprove the precision of prediction.
Conflicts of interest
The authors declare that they have no conict of interest.
This journal is © The Royal Society of Chemistry 2019
Acknowledgements
This work has been carried out with support from the NationalKey Research and Development Programs of China(2016YFD0400201-8).
References
1 H. Amagase, B. L. Petesch, H. Matsuura, S. Kasuga andY. Itakura, Intake of garlic and its bioactive components, J.Nutr., 2001, 131, 955S–962S.
2 V. Lanzotti, The analysis of onion and garlic, J. Chromatogr.A, 2006, 1112, 3–22.
3 J. Reiter, N. Levina, M. vander Linden, M. Gruhlke, C. Martinand A. J. Slusarenko, Diallylthiosulnate (allicin), a volatileantimicrobial from garlic (Allium sativum), kills humanlung pathogenic bacteria, including MDR strains, asa vapor, Molecules, 2017, 22, 1711.
4 N. Morihara, A. Hino, S. Miki, M. Takashima and J. I. Suzuki,Aged garlic extract suppresses inammation inapolipoprotein E-knockout mice, Mol. Nutr. Food Res.,2017, 61, 1700308.
5 M. Atkin, D. Laight and M. H. Cummings, The effects ofgarlic extract upon endothelial function, vascularinammation, oxidative stress and insulin resistance inadults with type 2 diabetes at high cardiovascular risk. Apilot double blind randomized placebo controlled trial, J.Diabetes Complicat., 2016, 30, 723–727.
6 D. T. Constenla and J. E. Lozano, Effect of pretreatments andprocessing conditions on the chemical, physical,microbiological and sensory characteristics of garlic paste,J. Food Process Eng., 2005, 28, 313–329.
7 J. E. Pardo, J. Escribano, R. Gomez and A. Alvarruiz, Physical–chemical and sensory quality evaluation of garlic cultivars, J.Food Qual., 2007, 30, 609–622.
8 X. Zhang, N. Li, X. Lu, P. Liu and X. Qiao, Effects oftemperature on the quality of black garlic, J. Sci. FoodAgric., 2016, 96, 2366–2372.
9 W. Q. Li, H. Zhou, M. Y. Zhou, X. P. Hu, S. Y. Ou, R. A. Yan,X. J. Liao, X. S. Huang and L. Fu, Characterization ofphenolic constituents inhibiting the formation of sulfur-containing volatiles produced during garlic processing, J.Agric. Food Chem., 2015, 63, 787–794.
10 N. Utama-ang, T. Cheewinworasak, N. Simawonthamgul andR. S. Samakradhamrongthai, Effect of drying condition ofThai garlic (Allium sativum L.) on physicochemical andsensory properties, Int. Food Res. J., 2018, 25, 1365–1372.
11 J. Wakamatsu, T. D. Stark and T. Hofmann, Taste-activemaillard reaction products in roasted garlic (Alliumsativum), J. Agric. Food Chem., 2016, 64, 5845–5854.
12 L. Eroman Unni, O. P. Chauhan and P. S. Raju, Highpressure processing of garlic paste: effect on the qualityattributes, Int. J. Food Sci. Technol., 2014, 49, 1579–1585.
13 D. S. Wishart, Metabolomics: applications to food scienceand nutrition research, Trends Food Sci. Technol., 2008, 19,482–493.
RSC Adv., 2019, 9, 17754–17765 | 17763
RSC Advances Paper
Ope
n A
cces
s A
rtic
le. P
ublis
hed
on 0
6 Ju
ne 2
019.
Dow
nloa
ded
on 3
/15/
2022
12:
29:4
8 PM
. T
his
artic
le is
lice
nsed
und
er a
Cre
ativ
e C
omm
ons
Attr
ibut
ion-
Non
Com
mer
cial
3.0
Unp
orte
d L
icen
ce.
View Article Online
14 S. Y. Lee, S. Lee, S. Lee, J. Y. Oh, E. J. Jeon, H. S. Ryu andC. H. Lee, Primary and secondary metabolite proling ofdoenjang, a fermented soybean paste during industrialprocessing, Food Chem., 2014, 165, 157–166.
15 W. L. Hung and Y. Wang, Metabolite Proling of CandidatusLiberibacter Infection in Hamlin Sweet Oranges, J. Agric.Food Chem., 2018, 66, 3983–3991.
16 J. Bi, X. Wang, Q. Chen, X. Liu, X. Wu, Q. Wang, J. Lv andA. Yang, Evaluation indicators of explosion puffing Fujiapple chips quality from different Chinese origins, LWT–Food Sci. Technol., 2015, 60, 1129–1135.
17 J. Lyu, L. Y. Zhou, J. F. Bi, X. Liu and X. Y. Wu, Qualityevaluation of yellow peach chips prepared by explosionpuffing drying, J. Food Sci. Technol., 2015, 52, 8204–8211.
18 Y. Liu, X. Sun and A. Ouyang, Nondestructive measurementof soluble solid content of navel orange fruit by visible-NIRspectrometric technique with PLSR and PCA-BPNN, LWT–Food Sci. Technol., 2010, 43, 602–607.
19 J. Sun, Learning algorithm and hidden node selectionscheme for local coupled feedforward neural networkclassier, Neurocomputing, 2012, 79, 158–163.
20 L. Wang, D. Liu, H. Pu, D. W. Sun, W. Gao and Z. Xiong, Useof hyperspectral imaging to discriminate the variety andquality of rice, Food Anal. Methods, 2015, 8, 515–523.
21 L. Lu, C. Fang, Z. Hu, X. Hu and Z. Zhu, Grade classicationmodel tandem BpNN method with multi-metal sensor forrice eating quality evaluation, Sens. Actuators, B, 2019, 281,22–27.
22 X. Meng, M. Zhang and B. Adhikari, Prediction of storagequality of fresh-cut green peppers using articial neuralnetwork, Int. J. Food Sci. Technol., 2012, 47, 1586–1592.
23 A. C. Kimbaris, N. G. Siatis, D. J. Daferera, P. A. Tarantilis,C. S. Pappas and M. G. Polissiou, Comparison ofdistillation and ultrasound-assisted extraction methods forthe isolation of sensitive aroma compounds from garlic(Allium sativum), Ultrason. Sonochem., 2006, 13, 54–60.
24 F. Priego-Capote and M. D. L. D. Castro, HS-GC/MS volatileprole of different varieties of garlic and their behaviorunder heating, Anal. Bioanal. Chem., 2016, 408, 3843–3852.
25 S. N. Lee, N. S. Kim and D. S. Lee, Comparative study ofextraction techniques for determination of garlic avorcomponents by gas chromatography-mass spectrometry,Anal. Bioanal. Chem., 2003, 377, 749–756.
26 J. Liu, F. Ji, F. Chen, W. Guo, M. Yang, S. Huang, F. Zhangand Y. Liu, Determination of garlic phenolic compoundsusing supercritical uid extraction coupled to supercriticaluid chromatography/tandem mass spectrometry, J.Pharm. Biomed. Anal., 2018, 159, 513–523.
27 E. Kovats, Gas chromatographic characterization of organicsubstances in the retention index system, Adv.Chromatogr., 1965, 1, 229–247.
28 J. Lisec, N. Schauer, J. Kopka, L. Willmitzer and A. R. Fernie,Gas chromatography mass spectrometry-based metaboliteproling in plants, Nat. Protoc., 2006, 1, 387–396.
29 T. D. Dan, Z. Bin, Z. L. Yao, H. X. Song, L. X. Jun and Z. Yan,Kinetics of “laba” garlic greening and its physiochemical
17764 | RSC Adv., 2019, 9, 17754–17765
properties treated by dense phase carbon dioxide, LWT–Food Sci. Technol., 2015, 64, 775–780.
30 GB5009.3-2016, National Food Safety Standard, Determinationof Moisture in Foods, Standards Press of China, China,Beijing, 2016.
31 Y. Q. Zhang, Z. P. Wang, Y. M. Song, D. L. Luan andC. H. Xue, Comparative study on the determination ofreducing sugar, Sci. Technol. Food Ind., 2010, 6, 321–326.
32 D. A. Ramirez, D. A. Locatelli, C. A. Torres-Palazzolo,J. C. Altamirano and A. B. Camargo, Development of garlicbioactive compounds analytical methodology based onliquid phase microextraction using response surfacedesign. Implications for dual analysis: cooked andbiological uids samples, Food Chem., 2017, 215, 493–500.
33 S. Kim, S. L. Park, S. Lee, S. Y. Lee, S. Ko and M. Yoo, UPLC/ESI-MS/MS analysis of compositional changes fororganosulfur compounds in garlic (Allium sativum L.)during fermentation, Food Chem., 2016, 211, 555–559.
34 A. Montano, F. J. Casado, A. de Castro, A. H. Sanchez andL. Rejano, Vitamin content and amino acid composition ofpickled garlic processed with and without fermentation, J.Agric. Food Chem., 2004, 52, 7324–7330.
35 C. N. Horita, A. M. Farıas-Campomanes, T. S. Barbosa,E. A. Esmerino, A. Gomesda Cruz, H. M. A. Bolini,M. A. A. Meireles and M. A. R. Pollonio, The antimicrobial,antioxidant and sensory properties of garlic and itsderivatives in Brazilian low-sodium frankfurters alongshelf-life, Food Res. Int., 2016, 84, 1–8.
36 D. T. Constenla and J. E. Lozano, Effect of pretreatments andprocessing conditions on the chemical, physical,microbiological and sensory characteristics of garlic paste,J. Food Process Eng., 2005, 28, 313–329.
37 M. C. Meilgaard, B. T. Carr and G. V. Civille, Sensoryevaluation techniques, CRC Press, 1999.
38 Y. K. Jain and S. K. Bhandare, Min max normalization baseddata perturbation method for privacy protection,International Journal of Computer & CommunicationTechnology, 2011, 2, 45–50.
39 M. Farres, S. Platikanov, S. Tsakovski and R. Tauler,Comparison of the variable importance in projection (VIP)and of the selectivity ratio (SR) methods for variableselection and interpretation, J. Chemom., 2015, 29, 528–536.
40 M. Keusgen, H. Schulz, J. Glodek, I. Krest, H. Kruger,N. Herchert and J. Keller, Characterization of some Alliumhybrids by aroma precursors, aroma proles, and alliinaseactivity, J. Agric. Food Chem., 2002, 50, 2884–2890.
41 J. Ahmed and U. S. Shivhare, Thermal kinetics of colorchange, rheology, and storage characteristics of garlicpuree/paste, J. Food Sci., 2001, 66, 754–757.
42 R. E. Gonzalez, V. C. Soto, M. M. Sance, A. B. Camargo andC. R. Galmarini, Variability of solids, organosulfurcompounds, pungency and health-enhancing traits ingarlic (Allium sativum L.) cultivars belonging to differentecophysiological groups, J. Agric. Food Chem., 2009, 57,10282–10288.
43 A. Montano, V. M. Beato, F. Mansilla and F. Orgaz, Effect ofgenetic characteristics and environmental factors on
This journal is © The Royal Society of Chemistry 2019
Paper RSC Advances
Ope
n A
cces
s A
rtic
le. P
ublis
hed
on 0
6 Ju
ne 2
019.
Dow
nloa
ded
on 3
/15/
2022
12:
29:4
8 PM
. T
his
artic
le is
lice
nsed
und
er a
Cre
ativ
e C
omm
ons
Attr
ibut
ion-
Non
Com
mer
cial
3.0
Unp
orte
d L
icen
ce.
View Article Online
organosulfur compounds in garlic (Allium sativum L.) grownin Andalusia, Spain, J. Agric. Food Chem., 2011, 59, 1301–1307.
44 M. Molina-Calle, F. Priego-Capote and M. D. de Castro, HS–GC/MS volatile prole of different varieties of garlic and theirbehavior under heating, Anal. Bioanal. Chem., 2016, 408,3843–3852.
45 Y. Ueda, H. Kawajiri, N. Miyamura and R. Miyajima, Contentof some sulfur-containing components and free amino acidsin various strains of garlic, J. Jpn. Soc. Food Sci., 2009, 38,429–434.
46 H. Kato, M. R. Rhue and T. Nishimura, Role of free aminoacids and peptides in food taste, 1989, pp. 158–174.
47 J. Cho, E. J. Lee, K. S. Yoo, S. K. Lee and B. S. Patil,Identication of candidate amino acids involved in theformation of blue pigments in crushed garlic cloves (Alliumsativum L.), J. Food Sci., 2009, 74, 11–16.
48 P. M. Chandrashekara and Y. P. Venkatesh,Immunostimulatory properties of fructans derived from
This journal is © The Royal Society of Chemistry 2019
raw garlic (Allium sativum L.), Bioact. Carbohydr. Diet. Fibre,2016, 8, 65–70.
49 A. T. Mankarios, C. F. G. Jones, M. C. Jarvis, D. R. Threfalland J. Friend, Hydrolysis of plant polysaccharides and GLCanalysis of their constituent neutral sugars, Phytochemistry,1979, 18, 419–422.
50 C. Ohsumi and T. Hayashi, Carbohydrate analysis of aninterspecic hybrid between onion and garlic, Biosci.,Biotechnol., Biochem., 1994, 58, 959–960.
51 M. J. Havey, C. R. Galmarini, A. F. Gokçe and C. Henson, QTLaffecting soluble carbohydrate concentrations in storedonion bulbs and their association with avor and health-enhancing attributes, Genome, 2004, 47, 463–468.
52 S. Karsoliya, Approximating number of hidden layer neuronsin multiple hidden layer BPNN architecture, InternationalJournal of Engineering Trends and Technology, 2012, 3, 714–717.
RSC Adv., 2019, 9, 17754–17765 | 17765