
A new measurement tool to help safeguard the nation’s … · Statistics: a world of uncertainty...
36
Los Alamos Science and Technology Magazine | October 2017 Solutions for next-gen computing Statistics: a world of uncertainty Unsung scientists of the secret city One-atom-thick carbon coating A new measurement tool to help safeguard the nation’s stockpile
Transcript of A new measurement tool to help safeguard the nation’s … · Statistics: a world of uncertainty...

L o s A l amo s S c i e nc e and Te ch nol o g y Mag a z i ne | O c tob e r 2 0 1 7
Solutions for next-gen computing
Statistics: a world of uncertainty
Unsung scientists of the secret city
One-atom-thick carbon coating
A new measurement tool to helpsafeguard the nation’s stockpile

Often the only woman in the room, physicist and Laboratory assistant director Jane Hall sits among weapons-program colleagues and guest dignitaries during a briefing. Hall came to Los Alamos during the Manhattan Project in 1945 and quickly became a leader in nuclear technology for the Laboratory and the country. To learn more about Hall and other female scientists who came to Los Alamos in its early years, see “Women Scientists of the Secret City” on page 10.Photo courtesy of Linda Hall

CREDIT: Joel Rowland/LANL
About the Cover: After the cessation of full-scale nuclear testing, nuclear-weapons science took a sophisticated new direction that was largely grounded in computer simulation, leading to groundbreaking new discoveries essential to national and global security. However, certain kinds of data needed for simulations are especially hard to acquire without access to the conditions inside an exploding nuclear weapon. Now scientists are developing a new kind of measurement tool that will restore their ability to study the fission behavior of plutonium under conditions like those found inside a nuclear explosion—but without the nuclear explosion. Tools like this enable science-based stewardship of the nuclear weapons stockpile in the absence of full-scale testing, thus ensuring the nation’s stockpile is safe, secure, and reliable.
About Our Name: During World War II, all that the outside world knew of Los Alamos and its top-secret laboratory was the mailing address—P. O. Box 1663, Santa Fe, New Mexico. That box number, still part of our address, symbolizes our historic role in the nation’s service.
About the Logo: Laboratory Directed Research and Development (LDRD) is a competitive internal program by which Los Alamos National Laboratory is authorized by Congress to invest in research and development that is both highly innovative and vital to national interests. Whenever 1663 reports on research that received support from LDRD, this logo appears at the end of the article.
In Their Own Words
Hidden figures revealed from the days of Los Alamos’s Manhattan Project
Spotlights
The strongest and most conductive material known—in a layer just one atom thick
Overcoming the vulnerability that goes hand in hand with increasing computing power
Making critical nuclear-weapons measurements—without going critical
2618
1610
52
Rigorous statistical methods are key to a broad spectrum of scientific endeavors
• Diagnosis: Drought • From Cosmos to Canyons
Two Roads to Next‑gen Computing
The Bomb without the Boom
Grappling with Graphene
Women Scientists of the Secret City
StaffCraig Tyler
Eleanor HuttererRebecca McDonald
Dan JudgeSarah Hedeen Tasseff
Leslie SandovalDenise SessionsAndrea Maestas
Editor-in-ChiefScience Editor Science Writer DesignerDesignerDesign ConsultantCopyeditorCopyeditor
About This Issue:This issue of 1663 features research led by female scientists and an historical segment highlighting women who contributed to the Manhattan Project.
1663 October 2017

Diagnosis: DroughtG LO BALLY, D R O UG H T S AR E B ECOM I N G M O R E FR EQ U E N T and more severe. Because the availability of water controls a plant’s ability to exchange gas with the atmosphere, taking in carbon dioxide and releasing oxygen—both processes that humans rely on plants to do—scientists need to understand how different kinds of plants respond to drought. That means they need instruments that can measure water in plants over long periods of time. However, most methods in use today involve puncturing the plant and probing the inside, which damages the plant and creates confounding dryness at the site being measured. There aren’t many options for objective, non‑destructive, low‑cost, lightweight, and scalable water measurement in the field.
Nuclear magnetic resonance (NMR) is the leading technology for non‑destructively measuring plant water content (though it misses most of the other marks above). NMR is not an imaging tool, but it can measure the total amount of hydrogen atoms in a given section of tree trunk or branch. The technique relies on the magnetic properties of hydrogen nuclei: When placed in a magnetic field, the hydrogen nuclei align themselves with the field according to their magnetic spin properties. In this stage, the nuclei absorb energy from electromagnetic radiation. When the magnetic field is removed, the nuclei return to their normal, unaligned state, and emit the absorbed energy at a specific resonance frequency. (NMR can be tuned to measure different elements, each of which has its own resonance frequency.) The energy emitted by the hydrogen atoms, when compared to previous measurements, reveals whether there were any changes in the hydrogen content of the sample. More hydrogen generally means more water.
Spotlights
Neutron images of a tree branch before and after taking up heavy water. (Left) A tree branch (A) is shown with the NMR device (B) wrapped around it and standing in a vessel of heavy water (C) after having first taken up normal water. (Right) Subtracting subsequent neutron images from the first image creates a picture of water transport and reveals how much (and how quickly) the heavy water is taken up by the branch (D). The bright green regions in the image on the right are the areas of greatest difference from the image on the left.
C
B
C
D
B
A A15 mm15 mm
2 1663 October 2017

across a twenty‑degree temperature range, during a two‑month period of peak drought season. They also experimentally mimicked naturally occurring extreme conditions that alter trees’ water content and were able to detect changes on a time scale as short as 30 minutes.
To confirm that the NMR measurement was actually measuring water transport through the plants’ conduits and not the water inside the plants’ cells, the scientists needed to validate the NMR findings with an imaging method. For this, the team conducted neutron imaging at the Los Alamos Neutron Science Center. Because it wasn’t practical to bring whole trees into the facility, they used freshly cut branches, which can still transport water.
The branches were first given normal water and then switched to heavy water (H₂O in which the hydrogen atoms have an extra neutron) just before being placed in the neutron beam. Whereas normal water tends to stop neutrons from passing through the tree branch to detectors on the other side, heavy water does not. So as the normal water was displaced by the heavy water entering the tree branch, the images of the branch gradually changed from fairly dark (opaque to neutrons) to much more transparent. Conveniently, NMR can also distinguish between normal and heavy water, so the researchers conducted NMR simultaneously with the neutron imaging. By comparing neutron imaging and NMR data, they were able to conclude that the NMR technique was indeed capturing water transport within conduits, not water inside cells.
“There are two branches to what we’re doing,” explains Sevanto. “There’s the new technology—developing low‑field NMR to look at trees in nature—and then there’s the new kinds of data we’re getting. If we understand both things as thoroughly as possible, we will be able to combine the new technique and new data with others’ studies and really improve the state of drought science moving forward.”
—Eleanor Hutterer
The drawbacks to traditional NMR come from its dependence on a large magnetic field for high‑resolution measurement, which can only come from heavy and costly permanent magnets that interfere with other instrumentation and require the work to be confined to a laboratory. Los Alamos scientist Sanna Sevanto and her colleagues have developed a radically different approach to measuring water uptake and transport in living plants that avoids permanent magnets entirely and relies on comparatively miniscule magnetic fields. An adaptation of ultra‑low magnetic field technology pioneered at the Laboratory by scientists Michelle Espy and Michael Malone for medical magnetic resonance imaging (MRI), the new plant NMR system consists of an air‑cored electromagnet operating at an ultra‑low field strength (about a million times weaker than a conventional hospital MRI).
The setup provides a number of advantages over conventional NMR or other techniques. First, because it’s an electromagnet—created basically by coiling an insulated current‑carrying wire around the tree trunk—it is affordable, lightweight, and easily adapted to trees of different sizes. Second, because the magnetic field is so weak, the scientists can use other instruments in tandem, and the NMR electromagnet won’t interfere. Third, it provides more complete data than the usual invasive techniques because it allows water measurement from the entire cross section of a tree. And last, because of the reduced interference, modest price tag, and small size, multiple systems can be set up within the same study area, or even on different parts of the same tree, which enables more comprehensive study of the drought response.
To test their setup, Sevanto and her colleagues did a variety of experiments in a greenhouse setting. They were able to distinguish rates of water transport clearly in four different types of trees,
From Cosmos to CanyonsHERE’S THE PROBLEM: YOU’VE GOT A NATURAL LANDSCAPE with the possibility of past exposure to chemical or nuclear contamination, and you want to keep a watchful eye for contaminants that could discharge to a major river system through storm‑water runoff. It’s a rugged, remote, and expansive region, with few roads and no electricity, and you’re going to need to monitor it continuously, rain or shine, for years. How do you do it?
You could try to design from scratch a versatile network of a hundred or more low‑power sensors that operate reliably in variable weather conditions using a robust data‑transmission system to send the measurement data from remote locations without line of sight to any kind of receiver. Or you could call someone accustomed to handling that kind of thing.
That’s how it went down when Armand Groffman and Steve Veenis, environmental science specialists from the Lab’s Surface Water Program, met with Janette Frigo of the Laboratory’s Space Data Science and Systems group. Groffman and Veenis wanted to monitor
1663 October 2017 3

the storm‑water runoff in the wide expanse of hills and canyons surrounding Los Alamos in a cost‑effective manner, and Frigo knew just how to do it.
Frigo based her solution on radiofrequency transmission circuitry initially designed for networked Department of Defense surveillance satellites with many of the same design requirements as the storm‑water samplers: transmission versatility to overcome line‑of‑sight issues, wide temperature range functionality, and extremely low power use. She set out to design and build field‑deployable units that, in addition to being resilient against temperature swings and other weather extremes, could run on limited battery power for years on end and yet transmit more information farther than any comparable existing hardware.
“The easiest thing would have been to use satellite modems,” says Frigo. “You measure something, send the information up to a commercial satellite on a subscription‑based, pay‑per‑bit paradigm and then
download it to your computer. We’ve had success with that approach in the past, but we couldn’t use it here. With all the data we would be sending from every sampling location, the satellite uplink would cost a fortune in hardware and data subscription fees.”
Frigo and applied physics specialist Alexandra Saari opted for a multi‑pronged alternative. First, they would design each sampling unit to operate in a low‑power idle mode except when transmitting. Second, they would give each unit a smart processor that could analyze the raw measurement data locally, filtering for important events and compressing the data to limit the duration of power‑consuming transmissions to less than one second. But these advances alone would not be sufficient to overcome the power demands and prohibitive cost of satellite‑based communications.
Instead, the units were modified to transmit messages and alarms through local, low‑power radio broadcasts. That meant each unit would be both sender and receiver, sampling station and relay station. In idle mode, the units would always be listening, allowing them to communicate with one another in a smart “mesh” network, intelligently taking turns passing data from one unit, or “node,” to another until the data reaches a common base station. They would also automatically reroute signals around busy or damaged nodes as changing field conditions may require.
“There simply are no commercial off‑the‑shelf components that come close to meeting our needs in terms of cost, compactness, power use, data processing, transmission flexibility, and multi‑hop mesh capability,” says Saari. “So we had to design our own system.” Indeed, the Los Alamos team now has more than 100 nodes operating in the surrounding canyon country, with each drawing power at a low enough rate that it can be accommodated by the sampler’s 12‑volt battery, trickle‑charged by a solar panel. Ultimately, the mesh will be expanded to 150 nodes, although it could accommodate another 100 more.
“All we have to do to add a new node to the existing mesh is turn it on,” Saari says. “And if a node goes down for some reason”—she identifies lightning, raging floodwaters, and even elk antlers as potential culprits—“its neighbors will automatically seek a new route home around the missing node.” In addition, the nodes can be adapted to transmit and receive on different frequencies, should there ever be too much radio noise on a chosen frequency. This flexibility also allows them to operate within unusually narrow bandwidths, as required to obey regulations within controlled bandwidth environments, such as the region around Los Alamos National Laboratory.
Farther afield, Frigo and others had already deployed an earlier version of the sensor‑transmitter technology to support data collection in other diverse environments. The sensor units are helping ranchers in Northern New Mexico keep tabs on moisture, wind, and soil conditions across their sweeping ranchlands. They’re also recording and transmitting climate data from the northern reaches of Alaska and Sweden. It was the Los Alamos storm‑water project, however, that advanced the system into a true self‑forming, self‑healing mesh network, allowing hundreds of nodes to coordinate reliably over mountainous terrain, from burning deserts to freezing icescapes. Perhaps that’s not so crazy for a system that had its origins in the ultra‑remote, alternately searing and freezing wilderness of outer space.
—Craig Tyler
Alexandra Saari configures an automated storm-water sampling station in the Jemez mountains near Los Alamos.
4 1663 October 2017

Laboratory statistician JOANNE WENDELBERGER explains
how the use of statistics is central to strong national security research.
W h e n I wa s a s t u d e n t at O b e r l i n C o l l e g e , I especially enjoyed my math and science courses. I majored in math, but I wondered what I would do with a math degree, and I also worried that I would miss the excitement of the sciences. During my junior year, Joseph Kadane, a statistician from Carnegie Mellon University, visited my department and gave a seminar on statistical work he did for the United Nations related to negotiations of their Law of the Sea Treaty. I had the opportunity to meet with Dr. Kadane to talk about careers in statistics. Our conversation that day did two things for me: it convinced me I wanted to go to graduate school, and it also introduced me to the idea that statisticians can engage in interdisciplinary problem-solving. As part of a team of experts from different fields, they can tackle important issues, rather than working in isolation or simply acting as an outside consultant. That idea stuck with me and has helped to shape my career. This approach—taking on the substance of a complex question—was perfect for me because I didn’t really want to choose between math and science. Although I specialize in statistics, I have been able to work on problems in many different scientific disciplines.
There’s a popular saying in statistics and other fields: “All models are wrong, but some are useful.” While there are varying viewpoints on this, my Ph.D. advisor at the University
of Wisconsin-Madison, Professor George Box, to whom the quote is attributed, imprinted this idea on me during my graduate training. A model is a simplification or normalization of a complex and varied system, intended to aid in the study of that system. Most complex questions in science require the use of models, at least in part, to make them tractable. Even if it is not possible to completely and precisely capture all of the intricate details of a complex system, that’s no cause for despair—models, as the saying goes, can be quite useful, despite shortcomings. Complex models can sometimes predict the behavior of a system quite accurately, whereas a simpler model might still yield valuable information by focusing on the essential features of a complex system.
Some models are physical, like a miniature replica or mockup, and some are visual, like a chart or diagram. The kinds of models I use are statistical models, which use mathematical notation to represent particular situations that include randomness, which can add to the complexity of predicting their behavior. For example, in material aging studies, anticipated observations can sometimes be modeled as the sum of low-order polynomial expressions plus an error term that accounts for variability in individual observations. Despite their simplicity, these often do a good job of capturing the main
IN THEIR OWN WORDS
1663 October 2017 5

impacts of the experimental factors. This commonly occurs in experiments across many different fields and can be a good starting point when beginning to model complex phenomena. If needed, more complicated models can be developed that incorporate more of the mechanistic details and complex interactions between variables.
Some of the most important considerations when building a statistical model are: the question to be answered (what information is needed), sampling and experiment design (how to measure and collect data), and error (what types of variability are present, and how accurate are the measurements). Both physical and computational experiments can be used to test whether a model is valid. Such experiments benefit from the use of statistical methodologies in their design to help identify the best possible experimental settings. A well-designed experiment can be powerful and illuminating, whereas a poorly designed experiment can be
essentially useless, a situation that is often avoidable. This is the part of model building where my research fits in.
At Los Alamos, I’ve worked on statistical aspects of many different groundbreaking research problems, including analysis of ocean-simulation results that contribute to our understanding of the earth’s climate, and sampling and visualization of particles from simulations of the origins of the universe. These are big questions that can’t be tackled without the unique confluence of math and science capabilities that national laboratories like Los Alamos have come to be known for. Thanks to that fateful seminar back in college, my educational experiences, and my Los Alamos colleagues, I have been fortunate to be a part of that confluence and have tremendously enjoyed it.
Nature and nurture (with a dash of good timing)I live and breathe statistics on a daily basis. Both at work
and outside of work, I think about everything in terms of distributions. For example, when I take an early morning walk, I automatically count how many rabbits I see. The number varies depending on the time of year and my mind tracks those changes as seasonal distributions. Another example is the experimentation inherent in cooking. Over the years I have amassed a personal catalog of high-altitude cake baking outcomes—some terrible, some fantastic, most somewhere in between—in which the average quality has gradually improved, and the distribution has steadily shifted. Thinking in distributions like this comes naturally to me, so I suppose it’s not surprising that I’ve made a career out of it.
I wound up at Los Alamos through a combination of chance and courage. Near the end of my Ph.D. program, I came across an ad for a position at Los Alamos that looked like a perfect fit for me—and it even came with mountains! I wasn’t really looking for a job yet, but my husband and I researched the town and the Laboratory and agreed that it looked like a great place to live and work, so I applied for the job. Because I was still several months away from graduating, it was the only job I applied for, and when it was offered to me, I took a leap. That was 25 years ago, and our initial impression has panned out—it’s been an excellent match.
One of the most important things to me about working at the Lab is being a part of a broad science effort across many disparate fields. Computer scientists, mathematicians, chemists, physicists, engineers, and more all work together here. Being a statistician means I have a special set of skills that I can use to help them design experiments and analyze data. It can be very challenging to figure out how to do this in the presence of practical constraints. For example, experiments may need to be arranged in groups of runs that fit into a heating chamber, or scheduled to minimize the need to collect measurements on weekends or holidays. Or there may be limited quantities of special materials available with which to work. As challenging as these kinds of limitations are, it is that much more rewarding when we figure out the best solution.
With the current explosion of computing power, more and more applications rely on streaming data, such as images, video, or spectra. In the case of images, the data can be quite noisy and may require cleaning as part of the analysis process. I recently collaborated with statistics colleague Sarah Michalak and Los Alamos applied mathematician Laura Monroe to create a statistical solution to a noisy radio-astronomy data
Six different presentations of the same northern Pacific Ocean data using different color schemes. Standard color maps (top row) are sometimes unable to resolve differences or areas of interest. Improvements in the perceptual range of color were achieved by developing new color maps (bottom row), which provide scientists with more useful data images. The author helped design and analyze experiments where subjects looked at the old and new maps and reported how many colors they could distinguish, thus establishing a mathematical means of comparison and estimation of improvement.CREDIT: Francesca Samsel
There’s a popular saying in statistics:
“All models are wrong,but some are useful.”
6 1663 October 2017

problem (discussed in more detail in “Two Roads to Next-gen Computing” on page 26). Dr. Michalak and I brought the necessary statistical expertise for this project, including the use of binomial models, theory of ranks and sorted observations, and experiment design for selecting different sets of parameter values. We’re still looking at the performance of our solution algorithm and exploring ways to further optimize it. But that evaluation process, too, involves statistical concepts—we’re using statistics both to solve the noisy-data problem and also to evaluate and improve the resulting solution.
Big dataData is often expensive to generate, expensive to collect,
and expensive to store, so it is important to get the most we can out of it and not waste resources on uninformative data. This is an excellent reason to work with a statistician. There are also challenges associated with the current trend toward working with extremely large datasets. The Laboratory has huge supercomputers for doing complex simulations, and many scientists and engineers are producing and collecting massive amounts of data. Whether the data are observational, experimental, or come from simulation models, statistics provides a rigorous framework for drawing inferences from these data. But our ability to generate data is outpacing our capacity to transfer and store data. Our data sets are so massive—cosmology simulations, for example, can exceed tens of billions of multi-dimensional points—that we can’t realistically keep it all; we have to pick and choose which data to store. Which are the most informative or valuable data points, and which can be deleted or processed into a more compact form? How do we make that call?
One way to handle massive data sets is by using an in situ approach, in which sampling and analysis are embedded in a simulation while it is still running. One such method that I collaborated on was designed to perform statistical calculations while a simulation is still running, in order to identify which of the resulting data are the most important, and to transfer and store those data, along with sufficient information to reconstruct an approximate representation of the complete set.
This approach can be used for different types of simulations. For example, what if an asteroid were to collide with the earth? We would need to know what happens, when it happens, and what happens next. In this hypothetical scenario, there are some time points when not much, or maybe even nothing is happening, such as before the collision or after, once all the ejecta have been launched onto well-established trajectories. We don’t need to waste resources storing all of those data. But at other time points, such as the moments immediately following the impact, the behavior of the simulation is changing rapidly, so we would want to collect and store data frequently. We’ve been able to implement basic algorithms that run in real time to explore computer models developed by other scientists that use samples to approximate whole processes. This method also stores data in a smaller number of bits. There are two benefits to our approach: smarter time steps and more efficient data capture.
The race to exascale computing drives an increasingly urgent requirement to streamline our data storage and analysis solutions. This next revolution in supercomputing refers to the global goal of developing computing platforms that conduct over a billion-billion calculations per second. As the size and complexity of computer simulations continue to grow,
our agility and creativity has to keep pace, which requires an understanding of sampling, error analysis, and design of experiments. Statistical methods built on these concepts are ever-evolving and advancing over time to keep up with the increasingly complex challenges of modern science.
Sampling schemaA general challenge in experiment design is sampling,
or choosing which data to collect out of all the data that could be collected. Many different types of sampling procedures have been proposed to address different types of scenarios. Traditionally, attention has focused on straightforward sampling scenarios, such as random sampling, in which each item is selected with equal probability from the entire population of interest; stratified random sampling, in which items are selected from different subsets of the overall population; and systematic sampling, in which items are selected systematically, according to some preset rationale. For one project, I used a systematic sampling plan to obtain information from Laboratory historical records (which were on microfilm!) that involved sampling records at equal intervals.
Over the years, sampling theory has enabled many other, more complicated types of sampling to be developed, studied, and implemented. Sampling theory is a subfield of statistics that provides a mathematical structure for understanding and probing statistical populations. It describes many different sampling procedures as well as the resulting estimates and associated uncertainties involved with using those procedures.
Observations from large and complex data sets may take the form of curves, spectra, or more general types of functions. In order to employ effective sampling approaches on these types of data, it is important to understand the population to be sampled, the sampling objective, and any practical constraints. Sampling strategies have evolved as increasingly complex problems have arisen, leading to new advances in the field of statistics. Customized sampling plans and procedures have played an important role in addressing institutional issues at Los Alamos including environmental remediation, analysis of historical records, and assessment of security procedures.
transfer and store data.
is outpacing our capacity togenerate data
Our ability to
1663 October 2017 7

When problems become larger and the data become more complex, it’s important to develop and apply sampling, design, and analysis methods that can provide representative samples and effective analysis results. With the rise of computational models and sophisticated estimation schemes, substantial growth has occurred in the use of specialized statistical techniques. Several highly sophisticated techniques that are now standard tools of statisticians worldwide have historical origins here at Los Alamos (perhaps most famously, Monte Carlo methods, a class of computational algorithms that use a statistical approach to solve complex problems).
Understanding uncertaintyBecause of the uncertainty present in data and decisions,
I sometimes feel uncomfortable making decisions. I often say that being a statistician means never having to be sure about anything, because there’s always some amount of uncertainty. But, evasive maneuvering aside, uncertainty and error quanti-fication are critical to any statistical analysis, and ultimately, decisions must be made even in the presence of uncertainty.
While the field of statistics focuses on uncertainty, the field of metrology focuses on measurement. Measurement error creates uncertainty, and has long been a concern of both statisticians and metrologists, requiring careful analysis of the process used to collect the data. These two fields really go hand in hand, as they each provide perspective on the sources of variability. For example, if we measure a variable x, what we observe is actually the sum of x plus an associated measurement error (which could be positive or negative). The overall error includes an intrinsic variation in the underlying variable—
some values naturally shift around, such as the precise location of eddies circulating in an ocean—as well as the variability associated with the instrument and method of measurement. This type of assessment quickly gets complicated in situations with multiple measurements and multiple measuring devices. Despite its importance, measurement error is often underemphasized or even ignored. Measurement processes and their associated errors will interact and propagate throughout the analysis, sometimes compounding one another, so failure to consider errors associated with the measurement process can result in misleading analyses, even for basic methods, such as pairwise comparisons and linear regression.
When carrying out statistical analyses, an important concept to understand is that sample variances—the typical plus or minus variation any one measurement might have
with respect to the mean—are inherently much more variable than the means themselves. While I was working on my Ph.D. my advisor asked me to determine how many samples would be needed to obtain a coefficient of variation (standard deviation divided by mean) of 5 percent, for the variance of a normal distribution—the famous “bell curve” used to characterize many kinds of distributions, such as heights of different individuals in a class. The coefficient of variation is a measure of relative variability of a population, so the more samples there are, the lower the coefficient of variation. But I was shocked to find that 801 samples were needed to bring it down to 5 percent—although the number of samples required to estimate a mean depends on the specifics of the problem, a common rule of thumb is to take about 30 samples. This exercise made a huge impression on me as it so clearly illustrated the peril that lies in ignoring the inherent variability in sample variances, even for a distribution so well-defined and commonly used as the normal distribution.
The analysis of outputs from computer models is an increasingly important concern in scientific modeling. Ultimately, the uncertainty in measured data will have an impact not just on the analysis of the measured values themselves but also on subsequent analyses, where the measured data is used as input to models, and the associated variation is transmitted to the resulting model outputs. There are statistical techniques for approximating the behavior of complex computer models and associated discrepancy of these models from observed data. The traditional approach involves first fitting low-order polynomial expressions (as in the earlier example on aging materials), then subtracting the model predictions from the actual data values, and finally examining the discrepancies, or residual errors, left behind to see how the model can be improved.
New methods are being developed to fit more flexible types of curves, ones that may not be fit well by low-order polynomials. But as with the traditional approach, these more sophisticated methods can estimate an entire curve and reveal the error between the model predictions and the actual data points. This gives us a sense of how good our predictions are and how far off they might be from the true underlying values. Residual errors and discrepancy functions provide clues about what aspects of a model need to be adjusted to obtain a better fit between the model and the data.
Pursuit of patternsMy first introduction to experiment design, though
I didn’t know it at the time, was a puzzle I was given when I was about eight. The challenge of this puzzle was to arrange 16 colored shapes on a 4×4 grid such that each row and each column contained each color and each shape exactly once. I later learned that this puzzle was formally known as a 4×4 Graeco-Latin Square and represents an example of an experiment design. It is essentially a two-variable experiment where the variables are color and shape, each variable has four possibilities, and the solved puzzle contains every combi-nation with no repeats. (The popular Japanese number puzzles Sudoku and Kakuro are also connected to experiment design
measurement error.
When a variable is measured, the result is actually the sum of
the measurement AND THE associated
8 1663 October 2017

methodologies. My family, which contains a higher-than-statis-tically-expected concentration of statisticians, named our two pet gerbils Sudoku and Kakuro.)
Advances in our understanding of design patterns support the development of new statistical designs to address increasingly complex problems. Agricultural experiments are an ancient and quintessential example of a simple, two-way experiment layout. The application of different treatments to rows and columns in a field, like different amounts of water, or different fertilizers, or variable spacing of seeds, has long been how growers learn to optimize their crops. The two-way layout that arises naturally from a field can be used first to represent two variables and then generalized to many variables. As we look back at how the discipline of statistical experiment design expanded beyond traditional two-way layouts like this, we see the evolution of the search for balanced patterns to obtain information about multiple experimental factors. This search for balanced patterns and the discovery of new or more complex patterns has always fascinated me.
My personal lifelong interest in patterns and arrangements has influenced and motivated much of my statistical work. When designing real-world experiments, there are often practical considerations and constraints that must be taken into account, which can, in turn, motivate new advances. For example, a couple years ago, I was involved in a project in which the need to generate a design for a physical experiment to learn about material properties eventually led to the development of a new algorithm. The algorithm generates matrices of experiment designs for studying computer models by looking at the outputs obtained by varying different parameters in the model. This design algorithm takes methods that can be carried out using traditional hand calculations and extends the functionality to computational experiments. This is particularly useful because these types of computational experiments, involving computer simulations that are run on very large computers, are used extensively for many different research projects at the Laboratory.
Women and statisticsWith the rise of data science, interest in statistical concepts
has expanded beyond traditional statisticians. To address the needs of this broader audience, I think some changes are needed in how statistics is taught. Instead of focusing on formulas, students should be taught to ask themselves, “What is the problem I’m trying to solve? What are the different ways I can look at this?” It’s about statistical thinking—and often thinking about someone else’s problem. But that’s the fun part for me, digging into the worlds of other scientists, getting a taste of many different projects, being a part of all these cool ideas. Those are the things that sometimes go missing in the classroom. During the course of my career, I’ve been very involved in outreach activities aimed at getting students excited about math and science and helping them think like statisticians.
As a woman in science, and as the mother of three daughters with technical degrees, two of whom have chosen to become statisticians themselves, it came naturally to direct much of my outreach over the years toward activities sponsored by women’s associations and professional groups. I’ve volunteered with ten-year-old girl scouts, participated in activities sponsored by the Los Alamos National Laboratory Women’s Group, and enjoyed presenting workshops on statistics and careers in related fields. I value being able to support and encourage women, from kindergarten to early career, in pursuits both technical and practical.
It’s no secret that women are underrepresented in technical fields. Some people find it surprising that statistics is one of the technical fields that has a higher proportion of women, about 30 percent, compared to 24 percent in computer and information science, 15 percent in engineering, and 11 percent in physics and astronomy, according to the National Science Board’s Science and Engineering Indicators 2016 report. These numbers are climbing, with the proportion of women graduating in these fields much higher today than they used to be, but we’re still the minority, and that can be difficult. I think that Los Alamos provides a stimulating work environment overall, but it’s not without challenges. It’s not uncommon, for instance, for me to find myself working in situations where I’m the only woman in the room. When an important decision is being made, technical or nontechnical, my opinion often comes from a minority perspective, and nearly always being outnumbered can be frustrating, but I don’t let that dominate my experience. I have been fortunate throughout my career to work with great colleagues on exciting projects.
I believe the experience of women in science has improved significantly in the 25 years that I’ve been at Los Alamos, and I think that trend will continue. I’m seeing more women in management positions, more technical positions filled by women, and more opportunities for women to advance their technical careers. I think it’s important to acknowledge the challenges women in science face while still fostering enthusiasm and a sense of discovery about science itself. It’s that excitement after all, that draws us all here!
—Joanne Wendelberger
This puzzle toy illustrates an approach to experiment design. To solve the puzzle, each row and column must contain each color and each shape exactly once. The solution represents a two-variable experiment where the variables are color and shape, each variable has five possibilities, and the solved puzzle contains every combination.
1663 October 2017 9

In 1942, physicist Elizabeth “Diz” Riddle Graves was one of only a few scientists in the country who had experience with fast-neutron scattering and a device called a Cockcroft-Walton accelerator. She had received her doctorate in nuclear physics at the University of Chicago; however, she was working only as a volunteer researcher at the University of Texas in Austin because her husband Alvin’s faculty position there precluded her from paid employment in the same department.
At some point that year, the Graves couple was invited to join a secret wartime endeavor called the Manhattan Project. They returned to Chicago to work at the Metallurgical Laboratory, which was one of the Project sites. Then, in 1943, Alvin and Elizabeth Graves were among dozens of people and pieces of equipment that were recruited and relocated practically overnight to another Project site, a clandestine one in the remote location of Los Alamos, New Mexico.
Manhattan Project leaders J. Robert Oppenheimer and General Leslie R. Groves scoured the country that year looking for anyone and anything that would help achieve their goal: to end the war by building a “gadget” that exploited the newly discovered phenomenon of nuclear fission. They did not discriminate; women or men, young or old, Ph.D. or nominal technical experience—all were considered. And even if a university department was actively using a specific instrument, they plucked it right up, along with whoever was trained to use it, and brought them both to Los Alamos. The war was relentless, and people around the country were willing to disrupt their lives—leaving faculty positions or graduate studies—if it meant helping to end the fighting.
It took all of them. Like cogs in a wheel, each individual who contributed to the Manhattan Project helped make possible an historic scientific achievement that was kept secret until the first atomic bomb was used in 1945. Since then, the story has slowly flowed out about the individuals who made it happen—gushing at first about the leaders of the project whose names are indelibly etched into the history of the bomb, followed by a trickle about the others, many of whom are largely still unknown, but all of whom were elemental to the origin of Los Alamos National Laboratory.
P.O. Box 1663In Los Alamos, unlike Austin, it wasn’t a problem that
Elizabeth and Alvin were both nuclear physicists; Oppenheimer insisted to the University of California (which managed the Project) that anti-nepotism rules could not apply to his recruits. He knew that he must take advantage of all the expertise that was available and put everyone to work, regardless of a spouse’s position. In fact, Groves urged that wives and soldiers with any technical training whatsoever be pulled into Laboratory
jobs, while others were encouraged to work in any suitable capacity in order to maximize the productivity of the small Los Alamos population.
So when she arrived at Los Alamos, Elizabeth Graves joined the Research Division and began applying her expertise to examining the role of neutrons in the gadget. The gadget relied on nuclear fission reactions. Fission happens when a heavy atom (such as uranium or plutonium)
absorbs a neutron and splits. When this occurs, more neutrons are released, some of which can cause fission in other atoms, potentially leading to a runaway chain reaction and a catastrophic release of energy. Therefore, in order to control a fission reaction for use in a bomb—to make sure that it detonates reliably but only when desired—the scientists of the Manhattan Project had to understand how to control neutrons.
Graves used her knowledge of nuclear structure, coupled with experiments using the Cockcroft-Walton accelerator that had come from the University of Illinois, to measure various materials and their ability to scatter high-energy neutrons. This work would help her group select a material to be used as a reflector to surround the core of the bomb. The reflector would keep neutrons inside, close to the core mass, so that the fission would continue and speed up the growth of the chain reaction. Graves also made cross-section measurements and calculated neutron-multiplication effects in uranium metal in order to further understand how the neutrons would interact with the target element.
During the first experimental test of the gadget, the Trinity test, Elizabeth was pregnant, so she and Alvin stayed at a cabin in Carrizozo, New Mexico, 50 miles from the test site, to observe and measure the explosion’s aftermath. They monitored the spread of radiation with a Geiger counter, the electromagnetic radiation with a shortwave radio (to see if it got disrupted), and the ground shock with a seismograph.
Element 49During the Manhattan Project, of which the Los Alamos
section was named Project Y, everything was a secret. Even the word plutonium was classified; instead, they called it “copper” and “Element 49”—a code using the number 4 from the last digit in 94 (the atomic number of plutonium) and 9 for the last digit in the isotope plutonium-239. Plutonium had recently been discovered and was desirable because its production could be controlled, as opposed to isolating enough naturally occurring uranium-235. For this and other reasons pertaining to the ignition of the device, Project scientists decided to design two kinds of gadget: one that used uranium and one that used plutonium.
1663 October 2017 11

An experimental graphite reactor was developed in Oak Ridge, Tennessee, as a prototype for making plutonium, and a production reactor was established in Hanford, Washington. In fact, more than 90 percent of the cost of the Manhattan Project was spent producing such fissile material, and the Project was spread out over 30 sites in the United States, United Kingdom, and Canada.
When the fissile material was delivered to Los Alamos, it still required chemical purification and physical preparation to enable further study and use. Physicist Elda Anderson is credited with preparing the first sample of nearly pure uranium-235 acquired by Los Alamos for experimentation. Anderson had been recruited to Los Alamos from Princeton University, where she worked in the Office of Scientific Research and Development. She had been there on sabbatical from her position as Chair of the Physics Department at Downer College in Milwaukee, Wisconsin.
With a Ph.D. in atomic spectroscopy, Anderson’s time on Project Y was spent examining the fission process and measuring parameters such as the number of neutrons produced per fission and the possible time delay before the emission of neutrons. However, working with such “hot” samples of material piqued Anderson’s interest in the emerging field of health physics: the study of protecting people and their environment from the effects of ionizing radiation. After the war, Anderson pursued this area for the rest of her career.
More than 1000 miles away from Los Alamos in Hanford, Washington, another physicist, Jane Hall, was also engaged in health physics and the pursuit of ways to protect radiation scientists working on the reactors. Hall and her husband had been working at the Metallurgical Laboratory in Chicago when they were recruited to help set up the reactors at Hanford. However, Hall was not allowed to work on the reactors with her husband, again due to anti-nepotism rules, so she began research in the Health Physics Division.
At the time, it was understood that radiation would cause sickness and cancer, but little was known about how and why. Hall and other Hanford health physicists were interested in monitoring the people working on the reactors to determine their exposure. This would not necessarily help scientists understand the effects of the radiation, but it would at least tell them if someone was receiving too much. The scientists at Hanford, along with other departments around the country where radiation was being used, all began to design dosimetry devices to detect exposure and methods to interpret the data. The devices, similar versions of which are still used today, consisted of photographic film held inside a plastic container
that could be worn as a badge. Upon exposure to radiation, an image of the protective case would appear on the film, thus recording the incident.
However, when Hall came to Los Alamos in late 1945, she returned to her original areas of physics expertise and worked on neutron diffusion and reactor research. In 1946, Hall and her husband worked as co-group leaders on a project to develop the world’s first fast plutonium reactor, called Clementine. This reactor would facilitate exploring the use of plutonium as a reactor fuel and enable further research about its use in weapons.
Integrating with Business MachinesIsolating and producing uranium and plutonium was one
challenge the Manhattan Project faced; however, the difference between the two bomb designs also created a significant theoretical hurdle. The first design, which used uranium, was a gun-type bomb: one mass would be shot at another to create a “supercritical” mass of the size required to begin
Project Y security badges were issued to all employees who worked in Los Alamos during the Manhattan Project.
12 1663 October 2017
a fission chain reaction. The design was rather straightforward, so the scientists were reasonably confident in its construction and execution.
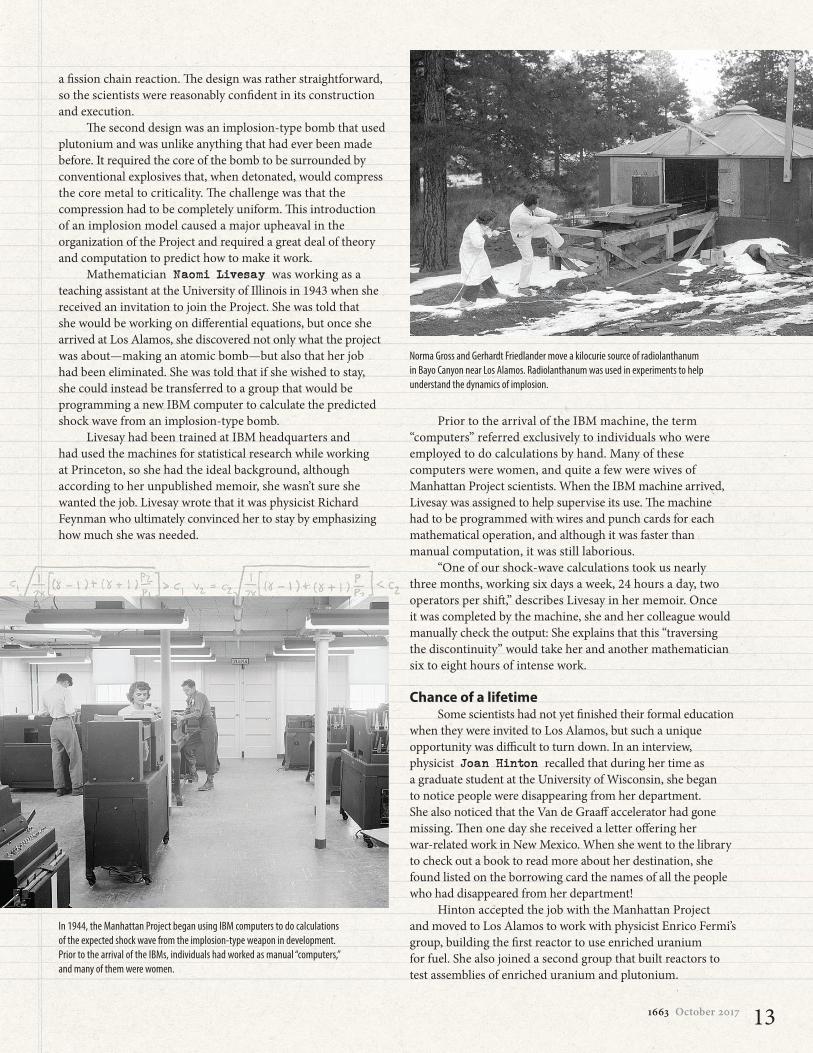
The second design was an implosion-type bomb that used plutonium and was unlike anything that had ever been made before. It required the core of the bomb to be surrounded by conventional explosives that, when detonated, would compress the core metal to criticality. The challenge was that the compression had to be completely uniform. This introduction of an implosion model caused a major upheaval in the organization of the Project and required a great deal of theory and computation to predict how to make it work.
Mathematician Naomi Livesay was working as a teaching assistant at the University of Illinois in 1943 when she received an invitation to join the Project. She was told that she would be working on differential equations, but once she arrived at Los Alamos, she discovered not only what the project was about—making an atomic bomb—but also that her job had been eliminated. She was told that if she wished to stay, she could instead be transferred to a group that would be programming a new IBM computer to calculate the predicted shock wave from an implosion-type bomb.
Livesay had been trained at IBM headquarters and had used the machines for statistical research while working at Princeton, so she had the ideal background, although according to her unpublished memoir, she wasn’t sure she wanted the job. Livesay wrote that it was physicist Richard Feynman who ultimately convinced her to stay by emphasizing how much she was needed.
Prior to the arrival of the IBM machine, the term “computers” referred exclusively to individuals who were employed to do calculations by hand. Many of these computers were women, and quite a few were wives of Manhattan Project scientists. When the IBM machine arrived, Livesay was assigned to help supervise its use. The machine had to be programmed with wires and punch cards for each mathematical operation, and although it was faster than manual computation, it was still laborious.
“One of our shock-wave calculations took us nearly three months, working six days a week, 24 hours a day, two operators per shift,” describes Livesay in her memoir. Once it was completed by the machine, she and her colleague would manually check the output: She explains that this “traversing the discontinuity” would take her and another mathematician six to eight hours of intense work.
Chance of a lifetimeSome scientists had not yet finished their formal education
when they were invited to Los Alamos, but such a unique opportunity was difficult to turn down. In an interview, physicist Joan Hinton recalled that during her time as a graduate student at the University of Wisconsin, she began to notice people were disappearing from her department. She also noticed that the Van de Graaff accelerator had gone missing. Then one day she received a letter offering her war-related work in New Mexico. When she went to the library to check out a book to read more about her destination, she found listed on the borrowing card the names of all the people who had disappeared from her department!
Hinton accepted the job with the Manhattan Project and moved to Los Alamos to work with physicist Enrico Fermi’s group, building the first reactor to use enriched uranium for fuel. She also joined a second group that built reactors to test assemblies of enriched uranium and plutonium.
In 1944, the Manhattan Project began using IBM computers to do calculations of the expected shock wave from the implosion-type weapon in development. Prior to the arrival of the IBMs, individuals had worked as manual “computers,” and many of them were women.
Norma Gross and Gerhardt Friedlander move a kilocurie source of radiolanthanum in Bayo Canyon near Los Alamos. Radiolanthanum was used in experiments to help understand the dynamics of implosion.
1663 October 2017 13

A significant effort was made by the Project leadership to recruit locally as well, which again included students. Agnes Naranjo was a member of the Santa Clara Pueblo who came to Los Alamos in 1945 when she finished her Bachelor of Science degree at the University of New Mexico. As a research technician in hematology for the Manhattan Project, Naranjo gained valuable work experience studying the effects of radiation on blood—something that ultimately shaped her career after the war.
People also joined Project Y through the military. Norma Gross was educated as a chemist but joined the Women’s Army Corps (WAC) during the war in order to stay near her husband, who was in the army and had been assigned to Los Alamos. Because of her training in chemistry, Gross was asked to work with a group that was assessing the progress of the implosion bomb design.
“In the mid-1960s, the catalog at Princeton University
stated that women were not welcome in the graduate
school,” recalls Ruth Howes, who was looking for a
graduate program in physics at the time and instead
decided to attend Columbia. Howes is co-author of
“Their Day in the Sun: Women of the Manhattan Project,”
a book based on interviews with about 300 individuals
about the women who worked on the 1940s-era secret
wartime project to develop an atomic bomb. She explains
that the women who worked on this project were
extraordinary. Although it was difficult for Howes to
become educated—especially in science—in the 1960s,
it was far more difficult in the 1930s, when Manhattan
Project scientists Elizabeth Graves and Jane Hall
were studying, or even earlier in the 1900s when their
colleague Elda Anderson was attending university.
AGAINST THE ODDS
“These women were tough,” says Howes. She explains
that because women in these time periods were
actively discouraged from getting educated, the ones
who succeeded had to be especially persistent. In the
1930s, women earned only about 3 percent of the
doctorates awarded in physics in the United States.
Furthermore, due to anti-nepotism rules, many were
unable to work in science departments at universities
if their husbands worked there—not an uncommon
problem, since people often meet their spouses during
college or graduate school, where they could be
studying the same thing.
Some women recall discrimination at Los Alamos
during the Manhattan Project; others described an
environment that was progressive
for the time period. In fact,
one of the reasons so many
women worked on the Project was
because the Director, J. Robert
Oppenheimer, insisted that anti-
nepotism rules be ignored, which
enabled many women to contribute
who otherwise would not have.
“Furthermore, it will be a great
help both from the point of view
of getting the work done and
from that of reinforcing the
morale of our people to allow
those women who are qualified
and experienced to work in the
laboratory,” wrote Oppenheimer
in a February 8, 1943, letter
to the Secretary to the Regents
of the University of California,
which managed the laboratory
at Los Alamos.
Even with the extensive calculations that were being done to predict the feasibility of the implosion model, experiments were still needed to verify the compression on the core of the bomb. To do this, Gross helped design and test a system that used radiolanthanum (RaLa), which emits gamma rays. As the explosion compressed the core, the radiation of the gamma rays would decrease. By detecting and measuring the gamma rays, Gross and her coworkers could understand what was happening to the density inside the core to verify the compression model.
“Norma Gross was an important contributor to the Project. Her work at Bayo Canyon, in the field and in the remote chemistry laboratory there, supported the RaLa tests, which were the implosion experiments that most affected the final design of the implosion weapon,” says Los Alamos National Laboratory historian Ellen McGehee.
Physicist Jane Hall was the first woman to serve on the General Advisory Committee of the Atomic Energy
Commission (AEC). She was also the first woman to be awarded the AEC Citation and gold medal. Hall
started her career during the Manhattan Project and came to Los Alamos in 1945, where she worked on the
Clementine nuclear reactor and later moved into management, becoming Assistant Director of the Lab in 1955.
Photo courtesy of Linda Hall

Leaving their marksAfter the war ended, many scientists left Los Alamos;
they returned to their faculty positions or their graduate studies. Elda Anderson changed careers after the war and became one of the founders of modern health physics. She moved to Oak Ridge National Laboratory and became the first chief of education and training in the new Health Physics Division. She established the professional certification agency known as the American Board of Health Physics, and helped create the Health Physics Society, which now gives an annual Elda E. Anderson award for excellence in the field.
Norma Gross moved to New York and began teaching and doing research in organic chemistry, while Joan Hinton left physics completely after the war. Naomi Livesay and her husband bought a car from Manhattan Project colleague Klaus Fuchs (who was later discovered to be a spy!) and drove to the East Coast, where they packed up and moved to England to pursue their science careers and start a family. Agnes Naranjo returned to school, earned a Ph.D. in zoology, and pursued a career in radiation biology and cytogenetics. She served as director of the Department of Tissue Culture at the Pasadena Foundation for Medical Research and was a senior scientist at the Jet Propulsion Laboratory, also in Pasadena, California, before returning to Los Alamos to be a radiobiologist in the Lab’s Mammalian Biology Group.
Some scientists never left Los Alamos and helped it transition into the national laboratory it is today. Elizabeth Graves continued to work on weapons, improving
the ones that had been used in the war and exploring new ones. Her husband Alvin was injured in the Slotin incident—a criticality-experiment accident in 1946 that killed his colleague, Louis Slotin. And, shocking to many, Elizabeth was tasked with calculating the dosage of her husband’s exposure without knowing he was the subject in question! Fortunately, Alvin survived, although he did suffer badly from radiation sickness. They both continued to work at the Laboratory, and Elizabeth became a group leader in the Physics Division, where she remained until her death in 1972.
Jane Hall also stayed at the Laboratory. After building the Clementine reactor, Hall quickly moved into management, first as assistant technical associate director and then as the Laboratory’s assistant director in 1955. She was the only person ever to hold this exact title (today the role is called deputy director) and the first of only three women so far to act in this capacity.
Having not been allowed to even work on nuclear reactors when she joined the Manhattan Project, Hall ultimately became one of the country’s most influential advisors on nuclear weapons when, in 1966, President Lyndon Johnson appointed Hall to a six-year term on the General Advisory Committee of the Atomic Energy Commission.
And so, the stories continue to trickle out. The history of Los Alamos is a great tale: world-renowned scientists are recruited to a secret location in the remote southwest (known only by its P.O. box address) to build a weapon to put an end to World War II. Project Y has been written about dozens of times and, with each retelling, is beginning to include more of the characters.
—Rebecca McDonald
One of the reasons that these and other women’s contributions are not widely known is that they were not well documented at the time. This article could not have been written without the extensive first-hand interviews conducted by authors Ruth H. Howes and Caroline L. Herzenberg for their book "Their Day in the Sun: Women of the Manhattan Project." Additional research and assistance from Alan Carr, AnnMarie Cutler, Glen McDuff, Ellen McGehee, and John Moore were also invaluable.
Passing the torch to a future scientist? Elizabeth Graves shows her daughter a $40,000 ball of gold at a Laboratory event. Gold and other metals were used as surrogates for fissile material in experiments during the Manhattan Project as well as after the war as the nuclear age continued.
1663 October 2017 15
f l e x i b l e t h i n - f i l m t o u c h - pa n e l d i s p l ay s .
Spray-on solar cells and extremely long-lasting batteries. Nanoelectronic computer chips and optoelectronic communications devices. Ion and gas transport membranes. Precision sensors and biosensors. All this and more, graphene can do.
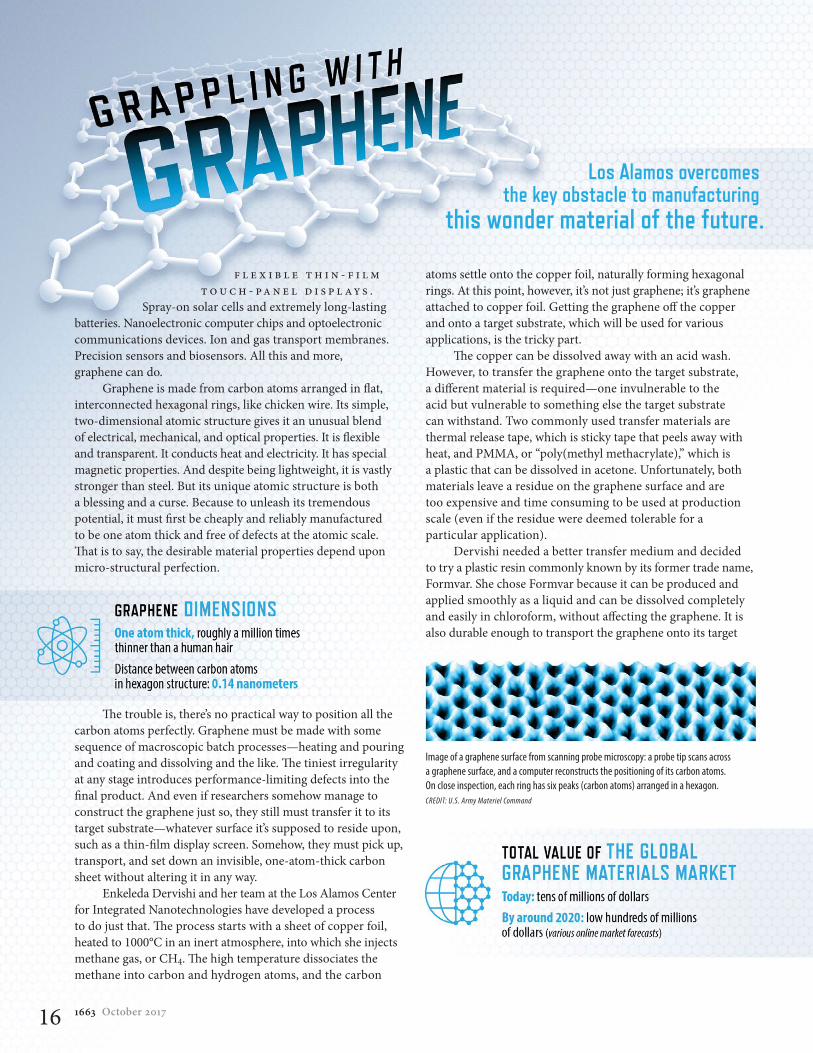
Graphene is made from carbon atoms arranged in flat, interconnected hexagonal rings, like chicken wire. Its simple, two-dimensional atomic structure gives it an unusual blend of electrical, mechanical, and optical properties. It is flexible and transparent. It conducts heat and electricity. It has special magnetic properties. And despite being lightweight, it is vastly stronger than steel. But its unique atomic structure is both a blessing and a curse. Because to unleash its tremendous potential, it must first be cheaply and reliably manufactured to be one atom thick and free of defects at the atomic scale. That is to say, the desirable material properties depend upon micro-structural perfection.
The trouble is, there’s no practical way to position all the carbon atoms perfectly. Graphene must be made with some sequence of macroscopic batch processes—heating and pouring and coating and dissolving and the like. The tiniest irregularity at any stage introduces performance-limiting defects into the final product. And even if researchers somehow manage to construct the graphene just so, they still must transfer it to its target substrate—whatever surface it’s supposed to reside upon, such as a thin-film display screen. Somehow, they must pick up, transport, and set down an invisible, one-atom-thick carbon sheet without altering it in any way.
Enkeleda Dervishi and her team at the Los Alamos Center for Integrated Nanotechnologies have developed a process to do just that. The process starts with a sheet of copper foil, heated to 1000°C in an inert atmosphere, into which she injects methane gas, or CH4. The high temperature dissociates the methane into carbon and hydrogen atoms, and the carbon
atoms settle onto the copper foil, naturally forming hexagonal rings. At this point, however, it’s not just graphene; it’s graphene attached to copper foil. Getting the graphene off the copper and onto a target substrate, which will be used for various applications, is the tricky part.
The copper can be dissolved away with an acid wash. However, to transfer the graphene onto the target substrate, a different material is required—one invulnerable to the acid but vulnerable to something else the target substrate can withstand. Two commonly used transfer materials are thermal release tape, which is sticky tape that peels away with heat, and PMMA, or “poly(methyl methacrylate),” which is a plastic that can be dissolved in acetone. Unfortunately, both materials leave a residue on the graphene surface and are too expensive and time consuming to be used at production scale (even if the residue were deemed tolerable for a particular application).
Dervishi needed a better transfer medium and decided to try a plastic resin commonly known by its former trade name, Formvar. She chose Formvar because it can be produced and applied smoothly as a liquid and can be dissolved completely and easily in chloroform, without affecting the graphene. It is also durable enough to transport the graphene onto its target
Los Alamos overcomesthe key obstacle to manufacturing
this wonder material of the future.
Image of a graphene surface from scanning probe microscopy: a probe tip scans across a graphene surface, and a computer reconstructs the positioning of its carbon atoms. On close inspection, each ring has six peaks (carbon atoms) arranged in a hexagon.CREDIT: U.S. Army Materiel Command
16 1663 October 2017

substrate, and it scales inexpensively for commercial use. In addition, it possesses sufficient flexibility to transfer the graphene onto its target substrate, properly adapting to any atomic-scale irregularities on the substrate’s surface.
Next, Dervishi and her students, Eric Auchter and Justin Marquez, set out to develop a reliable transfer procedure. They found that they could affix the Formvar to the graphene by simply dipping the copper-graphene sheet graphene-side down in a liquid Formvar mixture and allowing it to air dry. Then, handling the Formvar side only, they could lower the copper-graphene-Formvar stack into an acid bath to dissolve away the copper.
After several washes in ultrapure water, the graphene-Formvar sheet floats graphene-side down, and the target substrate is inserted underwater and raised up until it meets the graphene layer. It is then baked for ten minutes to evaporate the water and adhere the graphene to the target substrate. All that remains is a soak in chloroform to dissolve away the Formvar, leaving a graphene atomic monolayer bonded to its intended substrate. Done and done. But how well did it work?
Dervishi and her team used a number of microscopy and spectroscopy techniques to characterize the transferred graphene. One of these, Raman spectroscopy, is a mainstay of modern chemistry for assessing atomic structure via
the frequency shift that a material induces in laser light. The analysis revealed two things: first, that there were minimal crystalline imperfections (deviations from regular hexagonal structure) relative to other methods, and second, that the graphene layer was indeed one atom thick.
The entire process was repeated several times with different target substrates commonly used in key electronic applications. Each time, the Raman spectroscopy revealed the same thing: purity, a high level of crystallinity, and single-atom thickness. The same analysis for thermal release tape and PMMA, however, continued to turn up evidence of unwanted residue.
Not significantly limited by time, cost, or size, the new method should make possible a whole fleet of emerging technologies.
“One of the best things about it,” Dervishi says, “is that there are no size limitations. The graphene sheets can be made any size, for virtually any application, and the process should work just as well.”
—Craig Tyler
Optical microscope images of graphene transferred over a silicon-dioxide substrate using (left to right) thermal release tape, PMMA, and Formvar. In addition to having visibly fewer defects compared to earlier methods, the Los Alamos process using Formvar reliably produces single‐atom‐thick graphene of remarkable purity and crystallinity.
More carbon tech at Los Alamos• All-carbon nanoelectronics
http://www.lanl.gov/discover/publications/1663/2014-april/growing-nanowires.php
• Optoelectronic thin-film deviceshttp://www.lanl.gov/discover/publications/1663/2013-july/powered-by-plastic.phphttp://www.lanl.gov/discover/publications/1663/2014-april/organic-light.php
• Tamper-evident graphene sealshttp://www.lanl.gov/discover/publications/1663/2016-march/without-trace.php
171663 October 2017

Twenty-five years ago last month, deep underground in the remote Nevada desert, the United States conducted its last full-scale test of a nuclear weapon. That test, led by Los Alamos National Laboratory, was code-named “Divider” and, though not known at the time, would serendipitously come to represent a divide between two eras of nuclear-weapons science. With the cessation in the 1990s of underground nuclear explosions, nuclear-weapons science was forced in a new direction. Grounded now in computer simulation, modern nuclear-weapons science has produced groundbreaking new discoveries essential to national and global security.
A new subcritical measurement tool will help scientists protect and preserve the nation’s stockpile.

191663 October 2017

In addition to ceasing full-scale testing, the United States has been reducing the size of its arsenal, which is down by more than 90 percent since its peak in the 1960s. How to maintain the nuclear deterrent and look after the stockpile as it ages is one of the national security challenges with which Los Alamos National Laboratory has been charged. This challenge, in the absence of nuclear testing, necessitated a paradigm flip: instead of from the top down, scientists began to study nuclear weapons from the bottom up. Rather than seeking to understand the parts by studying the whole, inferring that if the whole functions as expected, then each part must have worked as predicted, designers began to operate from the other direction—by seeking to understand each and every piece and part, to be able to infer the function of the whole.
Science-based stockpile stewardship, as this process has come to be called, is how scientists at Los Alamos and other national labs ensure that nuclear weapons remain safe, secure, and reliable. The change from top-down to bottom-up science has helped shape the Laboratory’s evolution. Initial computer simulations were insufficient to accurately model the details of a nuclear explosion, so new codes had to be written. The new codes required more computing power than existed, so new computers had to be built. The new computers needed higher-quality data for their simulations, so new types of experiments had to be invented. These three arenas of innovation—codes, computers, and experiments—allow scientists to ask and answer questions vital to maintaining our country’s aging stockpile. And now a new type of experiment—one that can make measurements that haven’t been made since the cessation of underground testing—is going to provide new insight into the conditions inside exploding nuclear weapons.
Peculiar plutoniumLos Alamos physicist Anemarie DeYoung was always
enamored of the cleanness and purity of solving problems with exact formulae.
“Take the standard model of particle physics for example,” she explains, “I think it’s the purest, most beautiful theory in the universe. You can describe all the physics with just a few particles; it’s really amazing.”
But DeYoung never imagined she would have weapons expertise listed on her resume; it was never her goal. She knew she would go into some field of physics, having had both early exposure—her father was a physicist—and positive scholastic mentors. But when a project came along that she found especially interesting and challenging—namely designing and building an experiment to study the implosion of plutonium—she jumped at the chance to lead it.
It’s very, very difficult to model the details of a nuclear device. At the heart of the issue lies the enigmatic metal plutonium. Plutonium—an almost entirely manmade material—has a number of properties that make it difficult to work with: it expands and contracts more than most metals, it increases rather than decreases in density when it melts, it’s not as magnetic as it ought to be, and it’s radioactive. The weapons in the U.S. stockpile have pits of plutonium at their cores.
During the era of mass production, weapons were built with the assumption that they would be periodically replaced and updated. Today, a combination of limited production and life-extension programs has been established to keep the stockpile updated. Although the days of full-scale testing provided a lot of understanding, some of the details of oddball plutonium, especially its behavior inside a weapon, are still lacking. Over the past 25 years, through the bottom-up approach, many of the missing details have come together. But DeYoung and colleagues are finding that they need to be able to measure the nuclear reactivity of plutonium under conditions like those found inside a nuclear explosion, a measurement that has been unavailable since the cessation of testing.
To give them better insight into plutonium’s behavior, scientists study one of its most unique capabilities: fission. Fission is the process in which the nucleus of a heavy atom, like plutonium, absorbs an additional neutron and subsequently splits into pieces (typically two), releasing more neutrons, gamma radiation, and of course energy. The neutrons released can then be absorbed by other nuclei, causing them, too, to break apart and release even more
Nuclear fission is the process in which the nucleus of a heavy atom, like plutonium, absorbs an incident neutron (red) and consequently splits into (typically) two pieces, releasing more neutrons, gamma rays (yellow waves), and energy.
Science-based stockpile stewardship is how scientists ensure that nuclear weapons remain safe, secure, and reliable.
20 1663 October 2017

neutrons in a fission chain reaction. The denser the material is, the closer the nuclei are to one another, and the faster the chain reaction progresses.
Once a chain reaction is established, neutrons are both generated and lost from the system (neutrons can just travel out of the material rather than be absorbed by a nucleus). If the number of neutrons generated is exactly equal to the number lost, the system is described as critical. This is what occurs in nuclear-power reactors: control rods are used to absorb excess neutrons to maintain criticality while preventing a runaway chain reaction or, in an emergency, to quench the reaction. If the number of neutrons generated in a nuclear system exceeds the number lost, then the neutron population increases as a function of time and the system is called supercritical. Supercriticality is the condition underpinning the inside of a nuclear weapon, which results in a fast outburst of tremendous energy.
If, however, the neutron population decreases as a function of time—that is, more neutrons are lost than are generated—then a chain reaction will not, can not, be sustained. Although fission does occur, the chain reaction is dying as soon as it begins. This condition is called subcritical and it’s where weapons testing lies today. DeYoung and her team are developing a new kind of fission measurement, called a neutron-diagnosed subcritical experiment (NDSE) that will restore their ability to study the fission behavior of plutonium under conditions like those found inside a nuclear explosion, but without the nuclear explosion.
Subcrits and hydrotests“An NDSE is not a new idea,” says DeYoung, “but it’s
an idea that has only recently reached maturity, due to related advances. Things like new neutron sources, better detector technologies, faster electronics, and improved supercomputer simulation capabilities have made this the perfect time to build it.”
Subcritical experiments, or subcrits, to use the parlance of the field, are physical experiments that explore the dynamic behavior of fissile materials like plutonium. Subcriticality is achieved through careful design to ensure that neutron multiplication—the release of multiple neutrons by each nucleus undergoing fission—is always decreasing in rate, toward inevitable extinction. Because subcrits use the actual fissile materials that are used in weapons, and because they reach the physical conditions of the early parts of a nuclear explosion, the data that subcrits provide are directly relevant to the computer codes that support stockpile stewardship. Ongoing improvements in experimental diagnostics—such as a major new radiographic capability that is part of the same project as the NDSE (the Enhanced Capabilities for Subcritical Experiments project) and just as transforma-tional—continue to increase the importance of subcrits for stockpile stewardship.
Hydrotests, another mainstay of stockpile-stewardship research, study the process of implosion, the triggering event for a nuclear weapon to go supercritical. (“Hydro” comes from the Greek word for water, and refers to the fact that the high
Simulation setup of neutron-diagnosed subcritical experiment (NDSE). Laboratory supercomputers running the Monte Carlo N-Particle transport code were used to simulate trillions of neutrons, one at a time, traveling from the dense plasma focus (DPF) machine to the target, as well as all of the resulting particles and their flight paths. Neutrons travel from the DPF machine through a tunnel and then collide with the target object. Gamma rays (and neutrons) leave the object in all directions at once, with some traveling down a second tunnel toward the gamma-ray detectors (not shown).
1663 October 2017 21

pressures and temperatures generated inside an implosion cause some of the materials to behave like liquid). During a hydrotest, x-ray imaging and other diagnostic methods are used to study the symmetry and compression of an imploding
pit-like target, usually made of some other heavy metal that shares certain properties of plutonium.
An NDSE is very particular kind of subcritical hydrotest that uses neutrons to probe the state of plutonium itself during an implosion. That’s correct, it can use a real plutonium pit very similar to those inside of stockpile weapons. The NDSE’s coupling of the implosion process with plutonium as a target and a direct measurement of neutron multiplication as the resultant data will be more like a real test than any of the experiments done since real testing ceased. The addition of neutron data from the subcritical implosion of a dynamic object would enable much of the data generated during the testing era to be tied together with data generated after the cessation of testing. It will help scientists continue to meet the challenge of using old test data to validate new simulations and models.
The NDSE setup is basically this: a dynamic device—either a pit or a pit-like target—is imploded by explosives and bombarded by neutrons from a controlled external source. A pulse of about a trillion neutrons causes a momentary fission chain reaction in the target, just like what occurs in the first
The object under study, whether fabricated from boron, highly enriched uranium, or plutonium, is located in the direct line of sight of both the DPF machine and the gamma-ray detectors, while these themselves are out of sight of one another. Neutrons from the DPF cause nuclei in the test object to fission and release additional neutrons and gamma rays in all directions, with some hitting the gamma-ray detectors.
A representative DPF neutron pulse showing that the machine produces sufficient neutrons (about a trillion) in a short enough period of time (about 100 nanoseconds) to be a good neutron source for the neutron-diagnosed subcritical experiment.
A simulation showing a typical neutron pulse forming within the DPF head. The color scale indicates deuterium-tritium density, the x-axis indicates radial position within the cylindrical chamber (with 0 at the center), and the y-axis indicates the length of the chamber (with 0 at the base). The model can recreate, and thus predict, how neutron pulses are formed in the DPF, allowing scientists to optimize the system.
Detail of the DPF machine head showing the region inside the deuterium and tritium gas-filled chamber where the neutron pulse forms. The DPF machine was developed by National Security Technologies LLC, with modeling and simulation conducted by Los Alamos’s Theoretical Division.
This will help scientists study plutonium under the conditions found inside a nuclear explosion—without the nuclear explosion.
22 1663 October 2017

The gamma-ray detectors use a liquid scintillator that absorbs the energy of incoming gamma rays, then re-emits that energy as light. The light signal gets converted to an electrical signal before being collected and stored on a computer.
Monte Carlo N-Particle simulations of gamma flux under two sets of experimental conditions help to determine optimal experimental settings. Gamma flux is a measurement of how many gamma rays hit the detector’s vertical face per unit time. The rate of the gamma-flux decrease is known as gamma falloff and is given by the slope of the decline to the right of the peak: the steeper the slope, the faster the falloff. The gamma falloff is extremely sensitive to reactivity at this timescale, allowing scientists to adjust reactivity in the simulation for a high degree of control over the gamma falloff, which traces the rate of the subcritical chain-reaction decay. Because gamma rays travel faster and more uniformly than neutrons, the gamma-ray signal is used to calculate the neutron population.
instant of a detonation, but instead of exponentially increasing as in a detonation, the assembly is subcritical, so the chain reaction goes extinct. The ability to control and extend the time it takes to go extinct is one of the key achievements of the NDSE—the longer it takes, the more data can be collected and the better the process can be understood. Even still, it’s all over in a fraction of a second.
By determining the rate at which neutrons are generated, absorbed, or lost, scientists can calculate how a nuclear weapon would perform if allowed to go supercritical. Every fission event releases an average of three neutrons and eight gamma rays. The gamma flux—how many gammas hit the vertical plane of the detector’s face per unit time—is measured, and because gammas and neutrons are generated at the same time and in proportional quantities, the gamma flux reveals the neutron population.
Why count gammas when what they’re really after is neutrons? Because gammas are the cleaner measurement. The detectors are sensitive to both neutrons and gammas, but gammas travel faster than neutrons (even the high-energy neutrons produced by fission), so the gammas arrive at the detectors first. Unlike gamma rays, which travel uniformly at the speed of light, neutrons travel at varying velocities, so they trickle in to the detectors while the gammas arrive mostly all at once. Also, as the neutrons exit the target, they scatter off of surfaces and bounce into nuclei in the air, and these antics occasionally produce secondary gamma rays, which could conceivably hit a detector. By placing the detectors a certain distance away from the target, in what’s called time-of-flight separation, the initial round of direct fission gamma rays can be tidily collected just before the mess of neutrons and non-fission gammas that follow. From there it’s relatively straightforward to calculate the neutron population. In this way, key performance characteristics can be determined in the absence of a full-scale nuclear test.
Everything but detonation“This is more like a real full-scale test. It’s as close as we’ve
ever come,” explains retired Los Alamos physicist and NDSE consultant George Morgan. “Since the cessation of testing we’ve been oriented toward understanding material properties rather than evaluating a whole device. This is, in fact, a real device, designed to stop just short of going supercritical. And the question is, ‘how well did it function up to that point?’”
There are multiple challenges to developing an NDSE. One is getting enough neutrons in the initial pulse while ensuring comparatively few neutrons are generated thereafter; another is developing an experimental setup that provides gamma-ray detection with maximal signal and minimal noise. DeYoung’s team, in collaboration with Department of Energy contractor National Security Technologies LLC (NSTec), has developed an improved neutron source, as well as improved gamma-ray detectors, and has successfully completed the proof-of-principle experiments. They started with a non-fissile static target (static meaning non-imploding) and are presently working with a fissile static target, inching with each iteration closer to the end-goal of fissile and dynamic—though always subcritical—plutonium.
231663 October 2017

“We don’t want to do everything that goes with using dynamic material until we know that our system is working as it should,” says Morgan. “So we use a simple, safe, well-understood object to vet the system.”
The isotope boron-10 is an ideal choice because it’s non-fissile and static, but it has the convenient property that every time a nucleus captures a neutron, the nucleus emits a single gamma ray. Actually, when a boron-10 nucleus captures a neutron it emits an alpha particle (comprised of two protons and two neutrons) which leaves behind lithium-7. The lithium-7 is in an excited state, and when it relaxes to its ground state, it emits a gamma ray. So as scientists measure gamma emissions, they’re basically watching boron-10 capture neutrons.
By shooting neutrons one at a time, the team created a time history of how gamma rays are emitted by the target. After that, the next step was to do a bunch of neutrons in one big pulse and see how well that matched the results from the piecemeal approach. If the results from both approaches matched, it meant the system was working. And DeYoung’s system is working.
During the experiment, the gamma falloff—a data plot of the gamma flux—will show a single strong peak, one that increases then decreases rapidly to zero over several hundred nanoseconds. This measurement is important because the subcritical assembly produces about ten orders of magnitude fewer gammas than a nuclear test would, making it that much harder to get a reading, let alone a clean and precise one. The gamma falloff tells the scientists that the target is generating neutrons as predicted and that the neutron population is
decaying as predicted, and it also reveals the accuracy and precision of the measurement itself. The actual measurements are compared to supercomputer simulation predictions to validate and fine-tune the simulation.
Previously, with the boron-10 target, and now with a static fissile target made with highly enriched uranium, the (now much larger) team is seeing good gamma falloff measurements that are similar in duration to what they predict—based on simulations—for plutonium. This is good news because it proves that the neutron source and electronics are working well, and that the simulations are good. Taken together, these conclusions suggest that the NDSE is indeed the long-desired innovative alternative to nuclear testing.
New innovationsOne of the key advances enabling the NDSE is an
improved neutron source, which is a modified version of an old design. A dense plasma focus (DPF) machine produces neutrons by heating and compressing a mixture of deuterium
and tritium (both isotopes of hydrogen endowed with extra neutrons) to the point that the nuclei fuse, creating helium nuclei and freeing neutrons. The new version of the DPF was developed with help from the Laboratory’s Theoretical Division, which used its modeling capabilities to simulate DPF neutron pulses. The simulations proved to be a powerful tool for characterizing the DPF and for working out some of the kinks in its performance. What makes this DPF unique is that it shoots more neutrons in a shorter time period than previous
The initial proof-of-principle work for the NDSE used a static (non-imploding), non-fissile target. Presently, researchers from the Laboratory’s Nuclear Engineering and Nonproliferation and Physics divisions are experimenting with static but fissile highly enriched uranium in an above-ground laboratory at the Nevada National Security Site (NNSS). Here, a test object is positioned at the intersection of the line of sight of the dense plasma focus neutron pulse (tunnel on right) and the line of sight of the gamma-ray detectors (tunnel on left).
The next stage of the NDSE will be to measure a dynamic (imploding) and fissile plutonium target. This will require building the NDSE in the U1a underground facility at the NNSS. Comprising nearly a mile and a half of underground tunnels and alcoves, the U1a facility is a state-of-the-art laboratory dedicated to subcritical experiments and other physics experiments in support of science-based stockpile stewardship.CREDIT: Nevada National Security Site
This is a real device, designed to stop just short of going supercritical. And the question is,
how well did it function up to that point?
24 1663 October 2017

versions (approximately 1012 neutrons in 100 nanoseconds, compared to 101⁰ neutrons in 250 nanoseconds ten years ago), and it produces them in a more controllable way. With its bigger and faster neutron pulse, the DPF enables a longer-lasting and more uniform gamma falloff, demonstrating its suitability as a neutron source for the NDSE.
The gamma flux emitted from a fissioning system is a function of the system’s reactivity, so in a subcritical system, this flux is small, and the detectors have to be quite sensitive. One approach for measuring the faint NDSE gamma flux is to use a liquid scintillator, which is a liquid medium that, when struck by an incoming particle of ionizing radiation (e.g., a gamma ray), absorbs the energy of the particle and re-emits the absorbed energy in the form of light. The team improved upon a well-known scintillator medium, making it faster and brighter than the conventional version, and called it Liquid VI. Each NDSE gamma-ray detector consists of a
box containing a volume of Liquid VI, with a photomultiplier tube connected to the back to convert the light signal into an electrical signal, which can then be digitized and collected.
Essential to the effectiveness of both the DPF and the gamma-ray detectors is the ability to create a tightly controlled line of sight with the object under study. The physical layout of the NDSE test facility involves multiple meters-long tunnels, down which the neutrons and gammas must fly. The setup had to be precisely modeled before it could be built because the team needed to be sure that enough neutrons from the DPF would reach the object and enough gammas from the object would reach the detectors.
Experts from the Laboratory’s Physics Division first designed custom shielding and collimators to define the lines of sight and block interference so that the detectors could pick up a very small signal amidst a very large background. These, then, were optimized using simulations with the Monte Carlo N-Particle (MCNP) transport code developed by the Laboratory’s Computational Physics Division. The MCNP simulations launched one neutron at a time and tracked with high precision everything that resulted—mostly neutrons and gammas. This was a critical step because it told the researchers whether, with the lines of sight they could create, they had any hope of making a good measurement with an actual experiment. The answer, obviously, was yes, and so the NDSE test facility was built.
The initial proof-of-principle experiments, a collaboration between Los Alamos and NSTec, were completed using the DPF neutron source and Liquid VI gamma-ray detector with
the static boron target. The project is moving incrementally forward, now using static but fissile targets fabricated with highly enriched uranium to validate and improve the techniques. These experiments are being conducted at a dedicated above-ground facility at the Nevada National Security Site (NNSS). But for the NDSE to reach full maturity, it has to go underground.
Past but not passéThe end-goal of the NDSE is to probe a dynamic
plutonium target. For safety and security reasons, this necessitates a move to an underground facility. Well, not a move exactly—the above-ground facility will stay put, but the team will build another one underground. All subcritical testing is done at the U1a facility at the NNSS. Built in the final years of the full-scale testing era, this underground facility was brand new when the cessation of nuclear testing nearly made it obsolete. It has since been repurposed into a highly sophisticated and specialized laboratory that meets all of the infrastructural, regulatory, and safety criteria needed for subcrits.
As the full-scale testing era recedes further and further into the past, making the most of the data from that bygone time becomes more and more crucial. Stockpile stewardship tools like the NDSE help advance scientists’ abilities to ensure that nuclear weapons remain safe, secure, and reliable. The NDSE in particular holds the promise to restore access to the kind of data that has been out of reach since the days of testing.
The attrition of older employees from the Lab, people who actually worked on full-scale tests, poses the problem of knowledge transfer to today’s scientists. The remedy, such as it is, is to fill in the gaps between decades-old test data and present-day simulation predictions with new data from subcritical experiments like the NDSE.
“Ideally we could just model,” says DeYoung, “but we’ve found that we actually still have to measure too. So we need the right tools for that. To me, it’s a no-brainer; I believe we absolutely need this tool, and the sooner the better.”
—Eleanor Hutterer
As the testing era recedes further into the past, making the most of the data from that bygone time requires tools like the NDSE.
More stockpile stewardship at Los Alamos• Science that supports the nation’s nuclear deterrent
http://www.lanl.gov/discover/publications/_assets/docs/vistas-winter-2017.pdf
• Do subcritical experiments help?http://www.lanl.gov/discover/publications/national-security-science/2016-december/do-subcritical.php
• Modeling nuclear explosions with the Trinity supercomputerhttp://www.lanl.gov/discover/publications/national-security-science/2015-july/trinity-trinity.php
• Reengineering insensitive high explosives for better safetyhttp://www.lanl.gov/discover/publications/1663/2015-october/digging-crystal-deep.php
• Bottom-up approach to nuclear-weapons sciencehttp://www.lanl.gov/discover/publications/national-security-science/2014-july/ detonation-from-the-bottom-up.php
• Nuclear-weapons science without all the destructionhttp://www.lanl.gov/discover/publications/1663/2014-august/critical-subcritical.php
1663 October 2017 25


M o s t o f t h e e l e c t r i c a l p o w e r g e n e r at e d i n Los Alamos County goes to the national laboratory, with the largest chunk, about 25 percent of the county’s power, going to the Lab’s proton accelerator. But its next-largest power-hungry behemoth after that, consuming about 20 percent of the county’s total production—roughly equal to the power consumed by all of Los Alamos’s businesses and residences combined—is a collection of computers. These are supercomputers that, by virtue of their sophistication, are pushing up against serious power and performance limitations.
The Lab’s high-performance computing (HPC) facilities primarily comprise more than ten supercomputers, one quantum-annealing computer, and several other HPC systems frequently used as test beds for experimentation. Lab scientists use these machines to perform computationally intensive simulations of many complex phenomena, from submicroscopic material changes inside the high-radiation environment of a nuclear weapon to the sensitive atmospheric dynamics that govern the global climate; from the evolution of cancer to the evolution of the universe. For a given top-of-the-line supercomputer, the performance of such simulations is largely limited by two things, one of which is the allotted electrical power.
The other limitation comes from an accumulation of tiny hardware glitches, called faults, often caused by natural radiation. These faults can randomly alter computer information, causing a zero to become a one, for example. Some faults are harmless, changing values that an application isn’t using anyway. Others produce errors, manifesting as incorrect outputs or procedures. And occasionally one causes a crash, changing something so foundational that the operating system can no longer function without a full restart.
In the next ten years, computing advances will facesevere limitations. We can either try to overcome them or
drive headlong into them.
1663 October 2017 27271663 October 2017

PACKING IN MORE TRANSISTORS WILLINCREASE A CHIP’S VULNERABILITY
ALONG WITH ITS PERFORMANCE
In personal computers, even those rare faults that get amplified to become crashes generally constitute little more than a nuisance nowadays. In supercomputers, however, a multitude of faults can develop in succession due to the sheer number of chips that can be affected. These constitute a serious drain on performance. Los Alamos is on the forefront of advanced supercomputing, pushing toward the exascale (1018 “flops,” or floating-point operations per second, for those in the know). That’s more than a hundred times faster than the world’s current leading supercomputer and many millions of times faster than a new top-of-the-line laptop—and vastly more vulnerable to both faults and power insufficiency than either one.
Los Alamos scientists are pursuing two novel and somewhat contradictory paths to get around these limitations. One of these, as might be expected, involves tighter control over every bit of information: aggressively ferreting out faults and correcting them as they occur. The other, perhaps paradoxically, involves looser control of information: tolerating some randomness or reduced precision to save power and capacity for higher-precision operations elsewhere. Both strategies are likely to contribute to overall higher performance within power constraints and may ultimately find their way to consumer-market devices like phones and laptops, improving battery life and maybe, just maybe, eliminating those interminable hourglass and pinwheel icons from all of our lives.
No more MooreMoore’s Law famously asserts that the number of
transistors per unit area that can be manufactured on a computer chip doubles every year or two—every year when the law was first postulated in the 1960s and every 18–24 months now. Historically, this has meant a steady increase in processing power, memory, and other measures of computer performance and has contributed strongly to economic growth around the world.
There have been many incorrect predictions of the end of Moore’s Law, when the computing industry would no longer be able to count on its steady gains. At least one such prediction, however, seems very difficult to avoid, because with a higher transistor density comes a higher sensitivity to radiation-induced faults. A single stray neutron, streaking
down from the upper atmosphere in the wake of a cosmic-ray collision with an air molecule, could pass through a computer chip and introduce a fault into not just one bit of information—something called a single-event upset, or SEU—but perhaps as many as 16 bits within a closely packed area of memory. When 16 zeros and ones change all at once, it’s more likely that a calculation will be noticeably affected.
28 1663 October 20171663 October 201728

SOME RESOURCE-INTENSIVEOPERATIONS DO NOT REQUIRE PERFECT
DETERMINISTIC COMPUTATIONS
Such multiple faults also make it more difficult to successfully implement a remedy known as an error-correcting code (ECC). Typically, that code works by appending additional, redundant bits to a number, so that a value of zero, say, might become a zero followed by two additional zeros. If, somewhere down the line, the value is no longer 0 00, but perhaps 0 10 or 1 00, then the ECC knows something is wrong. It can fix the problem by making the most likely assumption, that of a single bit flip—in this case, the 1 should be a 0.
But if 16 bits change at once, this becomes much more difficult to do. If every bit of information requires two redundant bits just to safeguard against the simplest kind of fault, an SEU, then computational resources would be much more seriously taxed by having to provide enough redundancy to fix severe multiple-event upsets. Short of building in an enormous amount of redundancy and taking an enormous hit in terms of power and performance, there would be no way of knowing what had been corrupted. Some of the corrupted bits might even reside in the error-correcting operation itself.
Heather Quinn and her colleagues in the Los Alamos Space Data Science and Systems group have spent years working to understand and combat radiation effects on computer chips. Until recently, it has been very specialized work because standard ECCs could do a satisfactory job for computers on the ground; but on aircraft and spacecraft—that is, closer to the cosmic rays—and in other high-radiation environments, computer systems would be particularly vulnerable to serious, uncorrectable errors. Indeed, the Cibola Flight Experience satellite, which has been studying Earth’s ionosphere for more than ten years, successfully uses specialized Los Alamos hardware and software to recover from SEUs that occur on a daily basis.
“We’ve made a lot of progress locking down the SEU issue,” says Quinn. “But Moore’s Law is taking us to a place where SEU correction will not be enough. Packing in more transistors will increase a chip’s vulnerability alongside its performance.” She points out that while the danger is more pronounced in space-based systems, it will soon be a major problem on the ground for consumer electronics—ten years by most projections and even sooner for HPC. “But if we can come up with a solution for space,” she says, “where radiation is abundant and electrical power is at a premium, then we should be able to use that for HPC and other computing environments on the ground.”
Trying TrikayaSpecialized computing systems have some form of fault
protection now. HPC systems have a similar safeguard to what most people probably use in their own personal computing: they save often. That is, at various checkpoints, they record a last-known state to be restored in the event of a serious fault event. Along with servers and high-end desktop computers, HPC systems also have a form of ECC protection known as a SECDED code (“single event correct, double event detect”). The redundant bits are checked as values are moved in and out of memory—at a significant cost to power, memory, and chip
space. (Laptops, tablets, and phones generally forego these protections in favor of speed and battery life.) But as Moore’s Law approaches its limit and faults begin to arrive en masse, SECDED codes (as well as more cumbersome double-event-correcting codes) will become less effective. That’s why Quinn and collaborators have been working on a broader approach.
When a computer program is written, or coded, it is written in a programming language that expresses logical instructions: arithmetic operations, calls to subroutines, if-thens, do-whiles, and the like. The program is then “compiled” by another program (called a compiler) to convert the human-comprehensible code into machine instructions. Quinn’s approach is essentially to force the compiler to build programs such that they operate in triplicate, using a technique that she validated for a sweeping new ECC called Trikaya. (The name refers to a Buddhist doctrine recognizing Buddha’s three “kayas,” or bodies.)
A simpler version of this approach might cover a compu-tation, such as adding two numbers. If this is done three times, and the results are 4, 4, and 79, then an ECC could assume that a fault occurred in the third calculation because it lost a “best two out of three” contest. Essentially it was outvoted: two votes for “4” and only one vote for “79” strongly suggests that a fault disrupted the final calculation. (Alternatively, an identical fault event could have affected the first two calculations in exactly the same way, but this is an extremely unlikely scenario.) Trikaya extends this three-vote concept to full, simple programs, with more advanced capabilities planned. In effect, everything the software does, it does three times, and then it
takes a vote to establish the results. Or, to save power and other computational resources (e.g., access to hardware also needed for other tasks), it might do everything twice and only conduct a third vote if the first two disagree.
Theoretical work at Los Alamos over the past several years has verified Trikaya’s algorithms, and operational testing is currently underway at the Los Alamos Neutron Science Center—the same proton accelerator and neutron source that typically consumes a quarter of Los Alamos County’s electrical power. It can spray neutrons on a chip and cause faults at a much higher rate than would happen naturally, even in space. That way, researchers can test how reliably Trikaya actually fixes errors caused by radiation. If successful, Trikaya protection will likely appear on the next generation of satellites tasked with detecting nuclear detonations from space. And if it proves successful there, it may influence future microprocessor designs and ultimately filter down to the personal-computer market.
Still, Trikaya, like earlier fault-protection strategies, is resource intensive. It depends on repeating computations and therefore saps power and performance. It may protect satellites, and maybe personal computers, but by itself,
1663 October 2017 29

SOMETIMES GUESS-AND-CHECKIS FASTER THAN DOING THINGS
THE USUAL WAY
it doesn’t solve the HPC resource problem. For that, Quinn collaborates with Los Alamos colleague and HPC expert Laura Monroe.
Inexact computing“Not every problem requires an exact answer,” says
Monroe. “Sometimes it’s good enough—or even better—to use inexact computing methods to get a high-probability, close-enough answer faster and with less power than an exact answer.”
Wait, what? Isn’t the whole point of computers that they are reliable and calculate correct answers lightning fast?
Well, yes, that was the point. But as the Moore’s Law crisis approaches, and with HPC systems already resource-strained, the situation has changed. In addition, certain resource-intensive operations, such as image processing, social networking, searching, and sorting, genuinely do not require perfect, deterministic computations. And other emerging areas of advanced computing that require fast-but-not-perfect calculations, such as machine learning and perception, are likely to operate as well or better with inexact algorithms. Even some traditional computations, including, ironically, error correction, appear to be amenable to inexact methods. It is now an important research challenge to understand which problems might benefit from the speed and cost savings of an inexact approach.
“Research into inexact computing started in the early days of computing as an approach to unreliable systems,” says Monroe. “But that need abated with the move away from vacuum tubes to more reliable transistors and integrated circuits in the 1950s. Now it’s becoming important again.”
Inexact computing consists of two similar-sounding but distinct approaches: probabilistic computing and approximate computing. Probabilistic computing, like a large number of coin flips to converge on 50-50 odds, is non-deterministic, meaning that the computational paths are different each time a computation is performed, and the results may well be different too. Approximate computing is deterministic and straightforward, but it is abbreviated, such as by reducing the numerical precision (e.g., number of decimal places) or shaving off iterations in a looping calculation.
Another way to characterize these approaches involves the difference between accuracy and precision. Accuracy is the correctness of a calculation (or measurement), or how close it is to the actual answer. Precision is how close each calculation (or measurement) is to other calculations of the same problem. So, accuracy or precision—for inexact computing purposes, it is possible to relax either one.
For non-resource-limited computers today, both accuracy and precision are widely understood to be at acceptable levels, with both limited only by the finite number of bits used in a digital-computer calculation. Most calculations are brute-force applications of cumbersome but straightforward arithmetic carried out with many more decimal places than are needed. And because of the deterministic nature of the hardware and software used, if a calculation is repeated, exactly the same answer will emerge.
As a conceptual example, consider the irrational number pi, which requires an infinite number of decimal places to express it exactly. To calculate it, a computer could carry out a formula to add up an infinite but converging series of decreasing terms. (See “Two Slices of Pi” on the next page.) After adding up a huge number of terms, pi is guaranteed to be correct up to some number of decimal places. One could then choose to trade accuracy for reduced resource consumption (power, time, hardware requirements) by choosing to sum only the first few terms. The precision would be perfect (to however many terms one chooses to add), in the sense that repeated calculations
would always yield precisely the same answer, but the answer would be off from the true value of pi, so the accuracy would be relaxed. This is an example of approximate computing.
Alternatively, one could choose an accurate method with precision relaxed—namely, the exact geometric definition of pi, the ratio of a circle’s circumference to its diameter—but use an imprecise, probabilistic computation to get there. The computer could generate random numbers to represent pixels and basically draw a circle from which to obtain pi; the more pixels, the more closely the estimate will approach pi. One could design this process with enough pixels that the result is x percent likely to be within y percent of the correct value. The answer would be different each time the calculation is performed, but a large number of trials would converge toward the exact answer.
Unlike in conversational use, accuracy and precision mean different things in technical use. Accuracy refers to the ability to produce a correct or optimal result. Precision refers to limiting the amount of variation in a result. (Precision can also refer to the number of significant digits or decimal places in a calculated or measured value, since a measurement of 3.28 could mean 3.277 or 3.28412, and these represent variation in the result.) In inexact computing, fault vulnerability and power consumption may be reduced by deliberately restricting either the accuracy of a computation (by using an approximation) or its precision (by restricting the number of significant digits or using probabilistic methods).
Neither accurate nor precise
Accurate but not precise Accurate and precise
Precise but not accurate
30 1663 October 2017

SOMETIMES GUESS-AND-CHECKIS FASTER THAN DOING THINGS
THE USUAL WAY
This is an example of probabilistic computing (not one used in practice to calculate pi). For some tasks, including many HPC simulations, such probabilistic and approximate algorithms may be sufficiently accurate and precise, and yet considerably less resource-intensive than a standard deterministic computation.
Turn up the radioSome probabilistic computing requires specialized
hardware. Prototypes from academia, industry, and government already exist, delivering impressive improvements
in speed and power use. Image processing, in particular, has proven to be fertile ground for the potential benefits of probabilistic computing.
Why image processing? “There are really two reasons,” explains Monroe. “Most obviously, images don’t always need to be perfect; sometimes minor variations will make no difference in how the image is used, even in scientific contexts. In addition, existing image-processing algorithms can be very resource-intensive, so there’s a lot of opportunity for savings.”
Two Slicesof Pi
Which is the better way to compute the value of pi—an irrational number that can only be expressed exactly with an in�nite number of decimal places—a deterministic or probabilistic calculation?
Each version below will be based on a ¼ slice of pi, or π/4.
DETERMINISTIC APPROACHBecause there’s no direct way to calculate pi as it is de�ned—the circumference of a circle divided by its diameter—computers must calculate pi by some other method. As an instructive example, consider that the tangent of π/4 radians (equivalent to 45°) is 1:tan(π/4) = 1.
By taking the arctangent (inverse of the tangent) and multiplying by 4 on both sides of that equation, one gets: π = 4 × arctan(1).
The arctangent (and many other functions) can be expressed as a power series—an exact formula based on the sum of an in�nite number of terms. For the arctangent, this is:
PROBABILISTIC APPROACHAlternatively, one could develop an exact geometric method and use random numbers to make the irrational-number computation tractable. For example:
The area of a circle is πr 2.
The area of a square just barely containing that circle is the length of its side, squared; here the side length is just the circle’s diameter, or twice its radius, 2r. Therefore the ratio of the area of the circle to that of the square is:
Area ratio (circle’s area/square’s area) = πr 2 / (2r)2 = πr 2 / 4r 2 = π/4.Equivalently, π = 4 × (circle’s area/square’s area).
After just one term, we have π = 4. After two terms, it’s π = 4 × (1 – 1/3) = 2.666666667. After 3 terms, it’s π = 4 × (1 – 1/3 + 1/5) = 3.466666667, and so on. Because the terms get smaller and alternate signs (plus, minus, plus, minus), each additional term helps to zero in on the correct value (3.14159…). A computer program could meet reduced power and computational resource requirements by adding only the �rst few terms (the �rst ten? hundred? thousand?) and ignoring the in�nite number of terms that follow.
The result would have good precision, in the sense that repeated calculations adding the same number of terms give the exact same result, but it might not be accurate enough—that is, not close enough to the correct value of pi for a given task. In fact, the arctangent power series nicely illustrates this limitation because it converges very slowly; an enormous number of terms would have to be added to arrive at a reasonably accurate approximation of pi. Fortunately, other power series, with terms that also alternate signs but diminish much more rapidly, can be used for calculating pi.
A computer capable of generating random numbers could place dots at random pixel locations within the square. After some number of pixels is placed, it could divide the number inside the circle by the total number inside the square (including those inside the circle). Pi should then equal four times that amount. Just as �ipping a coin many times causes a 50–50 probability to emerge, more dots should lead to a more accurate result.
That result would have limited precision because repeated calculations, with di�erent random numbers each time, would yield di�erent results. But with enough dots, such variations would be small, and there would be a high degree of probability of a highly accurate result (close to 3.14159…). In some applications, calculating with random numbers like this can be better (less power, more speed, better fault tolerance, etc.) than an equivalent deterministic calculation.
so the formula for π, with x set to 1, becomes
x11 3 5 7
x3 x5 x7arctan(x) …
3 5 71
π ( )4 × 1 …1 1
1663 October 2017 31311663 October 2017

For example, when doing image processing for radio astronomy, one wants to keep the extraterrestrial radio sources and remove the radio noise. This is typically done with an iterative algorithm called CLEAN. You start by identifying the x brightest pixels. Then you apply a mathematical operation called a Fast Fourier Transform (FFT) to develop a “point spread function” for those pixels. That’s just what it sounds like: a way to take a perfect point source (of radio waves in this case, such as a quasar) and calculate how that point will spread into neighboring pixels in the instrument recording the image. Then the resulting blurred bright spots are subtracted from the original image and the whole process is repeated many times. When done, all that remains in the image should be noise. Then, finally, the saved bright spots are combined with a noise-subtracted background that hopefully, but not for certain, displays a good image of real astronomical radio sources. Whew.
Radio telescopes are usually located in remote locations far from sources of interference, where power is at a premium. Good computational performance is therefore essential, and a graphics processing unit (GPU) is a reasonable choice because it is designed for parallel processing—subdividing compu-tations into pieces that can be carried out simultaneously—provided that parallel algorithms exist to take advantage of this capability. At the time Monroe started to look into inexact methods for image processing, there was a good parallel algorithm for FFT on a GPU, but selecting the x brightest pixels was a bottleneck.
Monroe and collaborators (including Joanne Wendelberger, whose work is also featured on page 5, and Sarah Michalak) developed an alternative, probabilistic approach for the pixel-selection problem on a GPU. They used a randomized process to select “pivots”: values for pixel brightness with a user-chosen probability of bounding the x brightest pixels and were used to sort pixels into bins. By repeating this
randomized sorting procedure to do the bright-pixel selection, they were able to improve the corresponding processing times by a factor of 1.5–6 and remove the bottleneck for the CLEAN algorithm. This also increased capacity to handle images four times larger than previous methods.
“It’s basically a Las Vegas algorithm—even though it is probabilistic, it always gives the correct answer,” says Monroe. “Sometimes, for the right problems, guess-and-check can be faster in practice than doing things deterministically.”
So far, all these advances—probabilistic chips, probabilistic algorithms, and advanced error correction like Trikaya—are being created for special-purpose computations, not for the general computing market. General consumer computing will likely follow as new chips become increasingly susceptible to radiation-induced faults. But one inexact-computing improvement may be relatively easy to come by right now.
Many programmers today carry out deterministic math with higher decimal-place precision than necessary. “Floating point” decimal numbers used in software coding carry either single precision, which is encoded in 32 bits, or double precision, which is encoded in 64 bits. Yet so many bits (and corresponding decimal places) may not always be needed. For example, Monroe is working with Lab colleagues to develop codes that can be improved in terms of the tradeoff between quality and resource use simply by going from double to single or even half precision in some parts of the code. For HPC, that would mean saving precious power or doing more without consuming any additional power. It would also mean saving memory and storage space. And it would mean faster performance, or at least offsetting the performance reduction caused by the advanced ECCs that will soon be necessary.
It’s a little thing, limiting numerical precision, but every little bit helps when you’re under constant assault by radiation from space.
—Craig Tyler
Certain resource-intensive image-processing tasks, such as “cleaning” a radio-astronomy image as seen here, can be sped up with an inexact-computing algorithm. In this case, a probabilistic approach to a bottleneck in the calculation yields a noise-reduced image more quickly and efficiently than a deterministic approach. CREDIT: Bill Junor/LANL
More high-performance computing at Los Alamos• Facilities and capabilities
http://www.lanl.gov/org/padste/adtsc/hpc/index.phphttp://www.lanl.gov/projects/advanced-simulation-computing/index.php
• Quantum computinghttp://www.lanl.gov/discover/publications/1663/2016-july/not-magic-quantum.php
• Exascale computing for materials sciencehttp://www.lanl.gov/discover/publications/1663/issues-archive/june2012.pdf
• History of supercomputers at Los Alamoshttp://www.lanl.gov/discover/publications/alumni/2015-01/science-100supercomputers.php
• Select supercomputer applicationsClimate science: http://www.lanl.gov/discover/publications/1663/2016-december/ice-sheet-demise.phpCancer genetics: http://www.lanl.gov/discover/publications/1663/2016-december/what-causes-cancer.phpPetascale cosmology: http://www.lanl.gov/discover/publications/1663/issues-archive/october2012.pdfOcean ecology: http://www.lanl.gov/discover/publications/1663/2013-july/the-bottom-of-the- ocean-food-chain.php
32 1663 October 2017

Supercomputer simulations can produce so much data that, taken as a whole, it becomes difficult to work with or visualize effectively. Here, in a Los Alamos large-scale cosmological simulation, a supercomputer tracks particles that move according to the law of gravity and the expansion of the universe within a cube-shaped 3D volume. Various statistical sampling approaches have been implemented to select data that reveal particular structures of interest, such as galaxy clusters (large bright regions) and evidence of dark-matter filaments (faint connecting lines). For more on statistical methods in Los Alamos research, see “In Their Own Words” on page 5.CREDIT: Jon Woodring/LANL

ISSN: 1942-6631 Presorted Standard U.S. Postage Paid Albuquerque, NM
Permit No. 532
Los Alamos National Laboratory, an affirmative action/equal opportunity employer, is operated by Los Alamos National Security, LLC, for the National Nuclear Security Administration of the U.S. Department of Energy under contract DE-AC52-06NA25396. A U.S. Department of Energy Laboratory LALP-17-003
Printed onrecycled paper
Mail Stop M711 Los Alamos National Laboratory
P.O. Box 1663 Los Alamos, NM 87545
For a free subscription, visit:www.lanl.gov/discover/publications/1663
A highlight of Santa Fe’s historic Fiesta de Santa Fe is the burning of Zozobra, a 50-foot tall marionette nicknamed Old Man Gloom. During its construction, locals contribute paper for the effigy’s stuffing; divorce decrees, court summonses, mortgages, and traffic tickets are common. The annual event draws crowds of more than 60,000 people eager to see Zozobra—and whatever gloom they’ve amassed during the past year—go up in flames.Zozobra™®, Will Shuster's Zozobra™®, Old Man Gloom™®, and the Zozobra image(s)™® are Registered Trademarks of The Kiwanis Club of Santa Fe, NM. All Rights Reserved.
CREDIT: Tobias Roybal Photography