](https://static.fdocuments.us/doc/165x107/5ff1fafb48246d56a22d43a8/intertwiningvertexoperatorsandcertain-representationsof-sl-n-representation-l0.jpg)
A New Look on the Representation of Electrical …acta-arhiv.chem-soc.si/56/56-1-01.pdf · ·...
17
1 Acta Chim. Slov. 2009, 56, 1–17 Apelblat: A New Look on the Representation of Electrical Conductivities in Mixed Solvents ... Review A New Look on the Representation of Electrical Conductivities in Mixed Solvents. The Universal Curves of Limiting Conductances of Electrolytes and the Modified and the Excess Walden Products Alexander Apelblat* Department of Chemical Engineering, Ben Gurion University of the Negev, Beer Sheva, Israel * Corresponding author: E-mail: apelblat@bgu.ac.il Received: 14-10-2008 Dedicated to Professor Josef Barthel on the occasion of his 80 th birthday Abstract Concepts of the modified and the excess Walden products are introduced and discussed when applied together with the ordinary Walden product. The existence of the universal curves of limiting conductances for electrolytes (or for ions) in a given pair of solvents are further examined for a number of mixtures which include ethanol, 2-propanol, 1,1,1,3,3,3- hexafluoro-2-propanol, N,N,-dimethylformamide and 1,4-dioxane with acetone; methanol, 1,4-dioxane, carbon tetrach- loride and toluene with acetonitrile; water, methanol and γ-butyrolactane with tetramethylene sulfone; methanol, aceto- nitrile, toluene, dimethoxymethane and dimethoxyethane with propylene carbonate. Many electrolytes were involved in the evaluation of the universal curves, but the majority are alkali metal halides and tetraalkylammonium salts. These universal curves allow to estimate values of limiting conductances of electrolytes and give an indication about the qua- lity of the performed conductivity measurements. The existence of universal curves of limiting conductances indicates that the properties of electrolytes in pure solvents are, to a great extent, preserved also in the mixture of solvents due to the simple dilution effect. In some cases, for a limited concentration range, it was observed that for a given electrolyte, the limiting conductances are weakly dependent on the type of the second component in the mixture, e.g. in water- rich–alcohol mixtures. A formal mathematical representation of the universal curves (two-adjustable parameter equa- tion) and the limiting conductances (three-adjustable parameter equation) are introduced and for many electrolytes in numerous mixed-solvent systems these parameters are reported. Keywords: Electrical conductivity, mixed solvents, limiting conductances, various Walden products, universal curves of limiting conductances of electrolytes and ions, formal mathematical representation of limiting conductances in mi- xed-solvent systems. 1. Introduction Extensive experimental and theoretical investiga- tions were dedicated to the study of electrical conductivi- ties in the mixed solvent systems 1–13 . Most of them are dealing with conductances of various electrolytes in the water-organic solvent mixtures. 14 Smaller number of elec- trolytes was considered in binary organic solvents becau- se such studies were often related to the solution of parti- cular technological problems (e.g. high-energy batteries). These studies provided an important source of informa- tion about ion-ion and ion-solvent interactions in solu- tions when the charge transfer is continuously affected by changing conditions, the change of viscosity η(x,T) and dielectric constant D(x,T) resulting from the change in composition of the mixture. The mixture composition is usually expressed by the mole fraction of one of solvents x or by the weight fraction of it w. As a rule, from the experimental data, Λ(c,T), by us- ing a suitable conductivity equation, four derived parame- ters are reported for each electrolyte at given composition x: the limiting conductance Λ 0 (x,T), the association con-
Transcript of A New Look on the Representation of Electrical …acta-arhiv.chem-soc.si/56/56-1-01.pdf · ·...

1Acta Chim. Slov. 2009, 56, 1–17
Apelblat: A New Look on the Representation of Electrical Conductivities in Mixed Solvents ...
Review
A New Look on the Representation of Electrical Conductivities in Mixed Solvents.
The Universal Curves of Limiting Conductances of Electrolytes and the Modified and
the Excess Walden Products
Alexander Apelblat*
Department of Chemical Engineering, Ben Gurion University of the Negev, Beer Sheva, Israel
* Corresponding author: E-mail: [email protected]
Received: 14-10-2008
Dedicated to Professor Josef Barthel on the occasion of his 80th birthday
AbstractConcepts of the modified and the excess Walden products are introduced and discussed when applied together with the
ordinary Walden product. The existence of the universal curves of limiting conductances for electrolytes (or for ions) in
a given pair of solvents are further examined for a number of mixtures which include ethanol, 2-propanol, 1,1,1,3,3,3-
hexafluoro-2-propanol, N,N,-dimethylformamide and 1,4-dioxane with acetone; methanol, 1,4-dioxane, carbon tetrach-
loride and toluene with acetonitrile; water, methanol and γ-butyrolactane with tetramethylene sulfone; methanol, aceto-
nitrile, toluene, dimethoxymethane and dimethoxyethane with propylene carbonate. Many electrolytes were involved in
the evaluation of the universal curves, but the majority are alkali metal halides and tetraalkylammonium salts. These
universal curves allow to estimate values of limiting conductances of electrolytes and give an indication about the qua-
lity of the performed conductivity measurements. The existence of universal curves of limiting conductances indicates
that the properties of electrolytes in pure solvents are, to a great extent, preserved also in the mixture of solvents due to
the simple dilution effect. In some cases, for a limited concentration range, it was observed that for a given electrolyte,
the limiting conductances are weakly dependent on the type of the second component in the mixture, e.g. in water-
rich–alcohol mixtures. A formal mathematical representation of the universal curves (two-adjustable parameter equa-
tion) and the limiting conductances (three-adjustable parameter equation) are introduced and for many electrolytes in
numerous mixed-solvent systems these parameters are reported.
Keywords: Electrical conductivity, mixed solvents, limiting conductances, various Walden products, universal curves
of limiting conductances of electrolytes and ions, formal mathematical representation of limiting conductances in mi-
xed-solvent systems.
1. IntroductionExtensive experimental and theoretical investiga-
tions were dedicated to the study of electrical conductivi-ties in the mixed solvent systems1–13. Most of them aredealing with conductances of various electrolytes in thewater-organic solvent mixtures.14 Smaller number of elec-trolytes was considered in binary organic solvents becau-se such studies were often related to the solution of parti-cular technological problems (e.g. high-energy batteries).These studies provided an important source of informa-
tion about ion-ion and ion-solvent interactions in solu-tions when the charge transfer is continuously affected bychanging conditions, the change of viscosity η(x,T) anddielectric constant D(x,T) resulting from the change incomposition of the mixture. The mixture composition isusually expressed by the mole fraction of one of solvents xor by the weight fraction of it w.
As a rule, from the experimental data, Λ(c,T), by us-ing a suitable conductivity equation, four derived parame-ters are reported for each electrolyte at given compositionx: the limiting conductance Λ0(x,T), the association con-
2 Acta Chim. Slov. 2009, 56, 1–17
Apelblat: A New Look on the Representation of Electrical Conductivities in Mixed Solvents ...
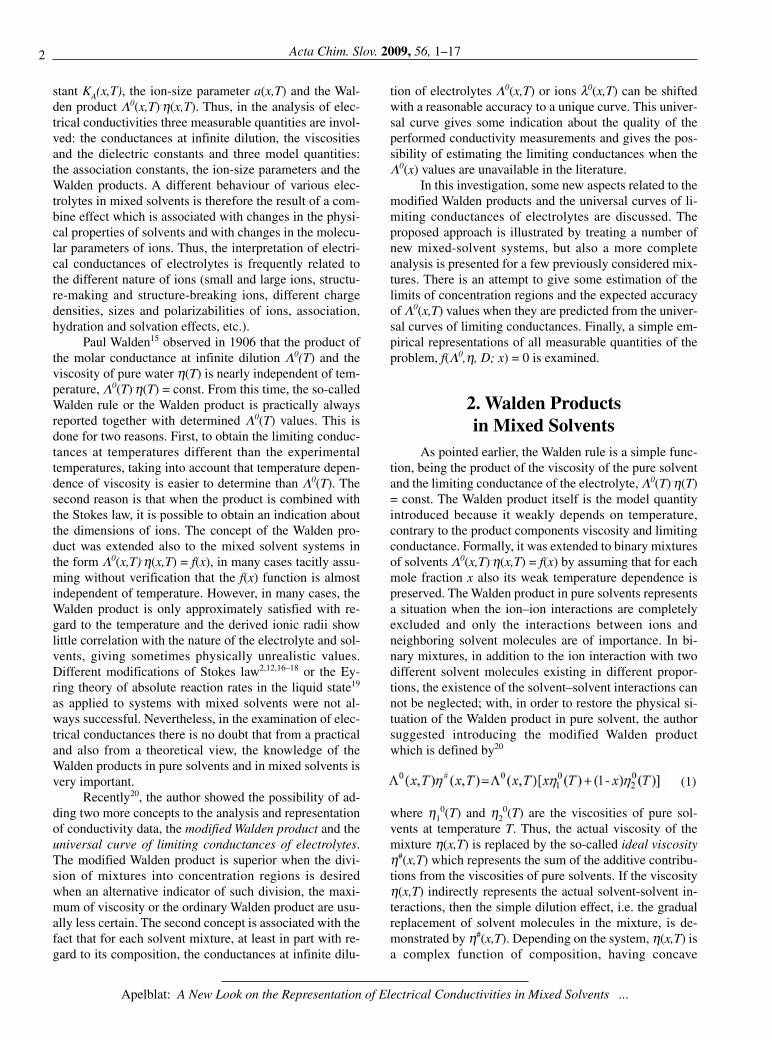
stant KA(x,T), the ion-size parameter a(x,T) and the Wal-den product Λ0(x,T).η(x,T). Thus, in the analysis of elec-trical conductivities three measurable quantities are invol-ved: the conductances at infinite dilution, the viscositiesand the dielectric constants and three model quantities:the association constants, the ion-size parameters and theWalden products. A different behaviour of various elec-trolytes in mixed solvents is therefore the result of a com-bine effect which is associated with changes in the physi-cal properties of solvents and with changes in the molecu-lar parameters of ions. Thus, the interpretation of electri-cal conductances of electrolytes is frequently related tothe different nature of ions (small and large ions, structu-re-making and structure-breaking ions, different chargedensities, sizes and polarizabilities of ions, association,hydration and solvation effects, etc.).
Paul Walden15 observed in 1906 that the product ofthe molar conductance at infinite dilution Λ0(T) and theviscosity of pure water η(T) is nearly independent of tem-perature, Λ0(T).η(T) = const. From this time, the so-calledWalden rule or the Walden product is practically alwaysreported together with determined Λ0(T) values. This isdone for two reasons. First, to obtain the limiting conduc-tances at temperatures different than the experimentaltemperatures, taking into account that temperature depen-dence of viscosity is easier to determine than Λ0(T). Thesecond reason is that when the product is combined withthe Stokes law, it is possible to obtain an indication aboutthe dimensions of ions. The concept of the Walden pro-duct was extended also to the mixed solvent systems inthe form Λ0(x,T).η(x,T) = f(x), in many cases tacitly assu-ming without verification that the f(x) function is almostindependent of temperature. However, in many cases, theWalden product is only approximately satisfied with re-gard to the temperature and the derived ionic radii showlittle correlation with the nature of the electrolyte and sol-vents, giving sometimes physically unrealistic values.Different modifications of Stokes law2,12,16–18 or the Ey-ring theory of absolute reaction rates in the liquid state19
as applied to systems with mixed solvents were not al-ways successful. Nevertheless, in the examination of elec-trical conductances there is no doubt that from a practicaland also from a theoretical view, the knowledge of theWalden products in pure solvents and in mixed solvents isvery important.
Recently20, the author showed the possibility of ad-ding two more concepts to the analysis and representationof conductivity data, the modified Walden product and theuniversal curve of limiting conductances of electrolytes.The modified Walden product is superior when the divi-sion of mixtures into concentration regions is desiredwhen an alternative indicator of such division, the maxi-mum of viscosity or the ordinary Walden product are usu-ally less certain. The second concept is associated with thefact that for each solvent mixture, at least in part with re-gard to its composition, the conductances at infinite dilu-
tion of electrolytes Λ0(x,T) or ions λ0(x,T) can be shiftedwith a reasonable accuracy to a unique curve. This univer-sal curve gives some indication about the quality of theperformed conductivity measurements and gives the pos-sibility of estimating the limiting conductances when theΛ0(x) values are unavailable in the literature.
In this investigation, some new aspects related to themodified Walden products and the universal curves of li-miting conductances of electrolytes are discussed. Theproposed approach is illustrated by treating a number ofnew mixed-solvent systems, but also a more completeanalysis is presented for a few previously considered mix-tures. There is an attempt to give some estimation of thelimits of concentration regions and the expected accuracyof Λ0(x,T) values when they are predicted from the univer-sal curves of limiting conductances. Finally, a simple em-pirical representations of all measurable quantities of theproblem, f(Λ0,η, D; x) = 0 is examined.
2. Walden Products in Mixed Solvents
As pointed earlier, the Walden rule is a simple func-tion, being the product of the viscosity of the pure solventand the limiting conductance of the electrolyte, Λ0(T).η(T)= const. The Walden product itself is the model quantityintroduced because it weakly depends on temperature,contrary to the product components viscosity and limitingconductance. Formally, it was extended to binary mixturesof solvents Λ0(x,T).η(x,T) = f(x) by assuming that for eachmole fraction x also its weak temperature dependence ispreserved. The Walden product in pure solvents representsa situation when the ion–ion interactions are completelyexcluded and only the interactions between ions andneighboring solvent molecules are of importance. In bi-nary mixtures, in addition to the ion interaction with twodifferent solvent molecules existing in different propor-tions, the existence of the solvent–solvent interactions cannot be neglected; with, in order to restore the physical si-tuation of the Walden product in pure solvent, the authorsuggested introducing the modified Walden productwhich is defined by20
(1)
where η10(T) and η2
0(T) are the viscosities of pure sol-vents at temperature T. Thus, the actual viscosity of themixture η(x,T) is replaced by the so-called ideal viscosityη#(x,T) which represents the sum of the additive contribu-tions from the viscosities of pure solvents. If the viscosityη(x,T) indirectly represents the actual solvent-solvent in-teractions, then the simple dilution effect, i.e. the gradualreplacement of solvent molecules in the mixture, is de-monstrated by η#(x,T). Depending on the system, η(x,T) isa complex function of composition, having concave

3Acta Chim. Slov. 2009, 56, 1–17
Apelblat: A New Look on the Representation of Electrical Conductivities in Mixed Solvents ...
downward or concave upward curvatures and sometimesexhibiting a maximum, minimum or both (e.g. maxima inthe alcohol with water mixtures21, a minimum in the etha-nol-cyclohexane mixtures22, both extrema in the methanolwith benzene or toluene mixtures22). It is supposed thatthe composition at extreme values of viscosity divides amixture into two solvent rich regions. On the other hand,the ideal viscosity η#(x,T) is an explicit, linear function ofmole fraction x and the difference, ηE(x,T) = η(x,T) –η#(x,T), is called the excess viscosity, in analogy with theexcess thermodynamic functions. Positive values ofηE(x,T) are usually associated with attractive interactionsbetween the components of the mixture (structure-makingeffects) whereas negative values of ηE(x,T) are attributedto repulsive interactions (structure-breaking effects). Evi-dently, if the excess viscosity changes sign, dividing theconcentration range, 0 ≤ x ≤ 1, into two regions, each eit-her dominated by the attraction or by the repulsion forces.
Similarly, the excess Walden product can be introdu-ced
(2)
If only dielectric constants of pure components areconsidered, in the case when one component has a low va-lue of D (say D <10), the limiting conductance as a func-tion of composition is a monotonic function which usual-ly has a concave upward curvature. The same form of theΛ0(x,T) curves is also preserved for larger values of die-lectric constants but often they have a minimum (e.g. inthe mixtures of water with alcohols) and less frequently,the Λ0(x,T) curve has a concave downward curvature (e.g.
in the acetotonitrile-methanol23 or the acetone-ethanolmixtures24). As a consequence, it is difficult á priori topredict the form of the products of the limiting conductan-ces and viscosities. The same is true for the magnitude ofΛ0(x, T)ηE(x,T). However, the sign of the excess Waldenproduct is known because it is given by the sign of the ex-cess viscosity, ηE(x,T). Thus, the modified Walden pro-duct is larger than the ordinary Walden product if ηE(x,T)> 0 and the modified Walden product is smaller than theordinary Walden product if ηE(x,T) > 0. If the excess vis-cosity changes sign, then the excess Walden product alsochanges sign in the 0 ≤ x ≤ 1 concentration interval. Thefirst two cases are illustrated in Figure 1 where over theentire concentration range, in the methanol (MeOH)-tetra-methylene sulfone (TMS)25 mixtures we have Λ0(LiCl;xTMS, T = 308.15K) ⋅ ηE(xTMS,T) > 0 and Λ0(NaCl; x1-PrOH,T = 298.15K) ⋅ ηE(x1-PrOH,T) < 0 in the 1-propanol (1-Pr-OH)-water mixtures26,27. The change of sign of the excessWalden product which occurs in the acetonitrile (AN)-wa-ter system28 is shown in Figure 2.
It is worthwhile to note that the modified Waldenproduct is better suited to indicate the limits between sol-vent-rich regions than the ordinary Walden product or theviscosity η(x,T). In each region, the modified Walden pro-duct can be nearly linearly approximated on x or on 1 – xand the crossing point of these straight lines gives the di-vision into two regions.
For the methanol-sulfolane mixtures, the viscosi-ties and dielectric constants are monotonic functions ofconcentration (∂η(x)/∂x > 0 and ∂D(x)/∂x > 0). The samecan be said for the observed ordinary Walden product ofLiCl (Figure 1). Unfortunately, in this system, in addi-tion to LiCl, only KClO4 was investigated29 at a differenttemperature T = 298.15 K. Taking into account only the-se two electrolytes, the universal conductivity curve (forthese curves see later) can be estimated from the metha-
Figure 1. Ordinary Walden products Λ0(x,T).η(x,T) (blue lines) and
modified Walden products Λ0(x,T).η#(x,T) (red lines) as a function of
mole fraction x. 1. Lithium chloride in the methanol-sulfolane mixtures
at T = 308.15 K; 2. Sodium chloride in the 1-propanol-water mixtures
at 298.15 K.
Figure 2. Ordinary Walden products Λ0(x,T).η(x,T) (blue line) and
modified Walden products Λ0(x,T).η#(x,T) (red line) of potassium
chloride as a function of mole fraction x of acetonitrile in the acetoni-
trile-water mixtures at T = 298.15 K.

4 Acta Chim. Slov. 2009, 56, 1–17
Apelblat: A New Look on the Representation of Electrical Conductivities in Mixed Solvents ...
nol and sulfolane sides and the division between regionsxTMS ∼ 0.3 as predicted by the modified Walden product(Figure 1).
Viscosities in the 1-propanol-water system have amaximum at x1-PrOH ∼ 0.3 and dielectric constants monoto-nically decrease with the mole fraction x1-PrOH. The ordi-nary Walden product has a maximum at x1-PrOH ∼ 0.10 (Fi-gure 1) but as was established previously for this system20
the water-rich region extends up to x1-PrOH ∼ 0.30 when themodified Walden product gives much smaller value of x1-PrOH ∼ 0.10.
A complex form of both Walden products in the ace-tonitrile-water mixtures (Figure 2) results due to the factthat the extreme values of viscosity (a maximum at thewater-rich mixture xAN ∼ 0.025) and the limiting conduc-tances (a minimum at xAN ∼ 0.40) are far from each other.Following the modified Walden product, the water-rich re-gion is relatively short xAN < 0.15.
3. Universal Curves of LimitingConductances of Electrolytes
in Mixed Solvents
Similarly as in water, different electrolytes in a par-ticular mixed-solvent system have different values of thelimiting conductances Λ0
j (x,T) where the subscript j deno-tes a given electrolyte. However, as was shown by the aut-hor20, in the solvent-rich regions, different electrolytes canbe shifted with a reasonable accuracy to a unique curveaccording to
(3)
or
(4)
Since the limiting conductances of electrolytes j andi in pure solvents are not equal, i.e. Λ0
j (0,T) ≠ Λ0j (1,T) and
Λ0j (0,T) ≠ Λ0
j (1,T), these constants are also not equal. Inthe case where one solvent has a very low dielectric con-stant, one of these equations covers almost the entire ran-ge of the mixture compositions. Thus, in principle, for aparticular mixed-solvent system, it is sufficient to deter-mine the limiting conductances for only one electrolytebecause the conductances of other electrolytes can be de-duced approximately from eqs. (3) and (4). The choice ofthis electrolyte which will be called the standard elec-trolyte is arbitrary, but the preferable electrolyte is thatwhich has, over a wide concentration range, many accura-te determinations of Λ0
j (x,T).As was demonstrated by the author,20 the limiting
conductivities of different ions can also be reduced to two
equations for cations and two equations for anions, i.e. toequations of the form
(5)
and
(6)
where arbitrarily a standard cation and a standard anionare chosen for a particular mixture of solvents.
Before discussing the behaviour of different elec-trolytes in a particular mixed-solvent system, let us consi-der the case of a particular electrolyte in a number of bi-nary mixtures that consist of one common component andthe second component belongs to the same group of sol-vents. An example of such mixtures, where there is a suf-ficient amount of experimental data to examine it, are aqu-eous solutions of low aliphatic alcohols (amphiprotichydrolytic solvents; for classification of solvents see13). Itis rather surprising to observe that in the water-rich re-gion, the limiting conductance of a given electrolyte is, toa great extent, independent of the alcohol.
In Figure 3 the limiting conductances of tetrabuty-lammonium bromide Λ0(Bu4NBr) are plotted as a func-tion of the dielectric constant D(x) (dielectric constantsare monotonic functions of x) in four different water-alip-hatic alcohol mixtures.
As can be observed, in the water-rich region, D(x) >68, Λ0(Bu4NBr) forms a common curve for mixtures withmethanol30, ethanol31, 1-propanol27 (Bu4NBr is replacedhere by Bu4NI but the anion contributions of Br– and I– arevery close) and tert-butanol32. Distinction between vari-ous alcohols is visible only in the alcohol-rich regions. Ot-her electrolytes behave in a similar way as can be seen inFigure 4 where sodium chloride with EtOH33, 1-PrOH27,
Figure 3. Limiting conductances of tetrabutylammonium bromide
Λ0(x) at 298.15 K as a function of dielectric constant D(x) in the alip-
hatic alcohol-water mixtures. 1 – ethanol; 2 – tert.- butanol ; 3 – met-
hanol and 4 – 1-propanol.

5Acta Chim. Slov. 2009, 56, 1–17
Apelblat: A New Look on the Representation of Electrical Conductivities in Mixed Solvents ...
tert.-BuOH32 and 2-butoxyethanol34 and potassium chlori-de with MeOH35, EtOH31,36 and tert.-BuOH32 are plottedin addition to Bu4NBr.
In order to obtain a quantitative indication about theresults presented in Figure 4 (i.e. for the water-rich re-gions), the mean standard deviations were calculated to be
σ(Λ0(NaCl)) = 1.24 S.cm2 mol–1, σ(Λ0(KCl)) = 1.18 S cm2
mol–1 and σ(Λ0(Bu4NBr)) = 0.81 S.cm2mol–1 (the units oflimiting conductances and the Walden products are omit-ted in the text or in the figures). Considering that the accu-racy of Λ0(x) values depends on how accurately the con-ductivities were determined and how the extrapolationprocess to infinite dilution was performed, the scatteringof points in the alcohol-water mixtures seems to be reaso-nable. However, whether similar behaviour can be obser-ved in other systems is uncertain and evidently should beexamined in the future when more experimental data willbe accumulated.
The application of eqs. (3)–(6) to a number of mixed-solvent mixtures with and without water was illustrated ina previous paper20. Some new results, mostly associatedwith binary mixtures having both organic components butalso some aqueous mixtures, will be considered here.
4. Limiting Conductances of Electrolytes in Mixed Solvents
4. 1. Limiting Conductances of Electrolytesin Mixtures with Acetone
Contrary to other common organic solvents, (ascompared for example with aliphatic alcohols or 1,4-dio-
xane with water) studies of the electrical conductances ofelectrolytes in systems with acetone are rather limited inthe literature. In aqueous solutions, measurements weremainly performed in narrow concentration ranges, and thenumber of investigated electrolytes is small. Non-aqueousmixtures that will be discussed here include ethanol, 2-propanol, 1,1,1,3,3,3,-hexafluoro-2-propanol (HFP),N,N-dimethylformamide (DMF) and 1,4-dioxane (DX).
Acetone is classified as an aprotic protophobic solvent13 with low viscosity and dielectric constants η = 0.303 cP and D = 20.56 as compared with water η = 0.9803 cP and D = 78.3613 (1 cP = mPa s). The limi-ting conductances of electrolytes in pure acetone are the-refore higher than those in pure water and Λ0(x) has a mi-nimum (Figure 5). The viscosity η(x) has a maximum inthe rich in the water region at x ∼ 0.12 when the dielectricconstant D(x) monotonically decreases with the molefraction of acetone x and Λ0(x).ηE(x) < 0.
Shifting the limiting conductances of electrolytes(eq. 3 for x < 0.2 and eq. 4 for x > 0.4) and using tetra-butylammonium bromide as the standard electrolyte theuniversal curve was calculated using the following elec-trolytes: NH4CNS38, (NH4)2S2O7
39, Na2S2O739, KCl40,
KI40, K2S2O739, AgCl41, AgNO3
41, Et4NClO438 and
Bu4NBr42 (Figure 5). If the ratio of the limiting conduc-tances of Bu4NBr (standard electrolyte) and an electrolyteXY in pure water is denoted by f(Bu4NBr; water) =Λ0(Bu4NBr)/Λ0(XY) and that in pure acetone byf(Bu4NBr; acetone) = Λ0(Bu4NBr)/ Λ0(XY), then the shiftof the limiting conductances in Figure 5 covers a widerange of electrolytes, 0.32 ≤ f(Bu4NBr; water) ≤ 1.00 and0.87 ≤ f (Bu4NBr; acetone) ≤ 2.00. The list includes notonly 1:1 but also 1:2 type electrolytes, however Λ0(x) va-lues were always calculated as for the 1:1 electrolytes39.Uncertainty associated with the universal curves and ex-
Figure 4. Limiting conductances of sodium chloride, potassium
chloride and tetrabutylammonium bromide Λ0(x) at 298.15 K as a
function of dielectric constant D(x) in the aliphatic alcohol-water
mixtures in the water-rich region. NaCl in the mixtures with ethanol,
1-propanol, tert.- butanol and 2-butoxyethanol. KCl in the mixtures
with methanol, ethanol and tert.- butanol. Bu4NBr in the mixtures
with methanol, ethanol, 1-propanol and tert.- butanol.
Figure 5. Limiting conductances of electrolytes Λ0(x) at 298.15 K
(calculated using eqs. 3 and 4) as a function of mole fraction of ace-
tone x in the acetone-water mixtures. 1 – Bu4NBr; 2 – AgCl; 3 – KI;
4 – KCl; 5 – K2S2O7; 6 – (NH4)2S2O7; 7 – Na2S2O7; 8 – AgNO3; 9 –
Et4NClO4; 10 – NH4CNS.

6 Acta Chim. Slov. 2009, 56, 1–17
Apelblat: A New Look on the Representation of Electrical Conductivities in Mixed Solvents ...
pressed by the mean standard deviations σ(Λ0(x)) is lowerfor the water-rich mixtures than for the acetone-rich mix-tures (Table 1), but the ratio σ(Λ0(x))/Λ0(Bu4NBr) is prac-tically the same at about 0.017.
Universal curves in the acetone-aliphatic alcoholmixtures cover practically the entire concentration range x< 0.95 (Figure 6). Acetone-ethanol and acetone-1-propa-nol mixtures behave in a similar way20. Here, the repeateduniversal curve of the acetone-ethanol mixtures is muchbetter documented, in addition to CsClO4
43 (standard elec-trolyte) and Et4ClO4
43, the mixtures with NaCl44 and CsCl44 are added. Two new alcohols are also considered:2-propanol45 and 1,1,1,3,3,3-hexafluoro-2-propanol(HFP)45. What characterizes the acetone-alcohol systemsis that they are almost isodielectric mixtures (D(acetone)= 20.56, D(EtOH) = 24.35, D(2-PrOH) = 19.40 andD(HFP) = 16.75 at 298.15 K) but with extreme values, theminima at x ∼ 0.85 in mixtures with EtOH, the minima at x ∼ 0.40 in mixtures with 2-PrOH and the maxima at x ∼ 0.50 in mixtures with HFP. The viscosity decreasesmonotonically with increasing mole fraction of acetone xin mixtures (i.e. always ∂Λ0(x)/∂x > 0; η(acetone) = 0.303 cP, η(EtOH) = 1.087 cP, η(2-PrOH) = 2.08 cP and η(HFP)= 1.62 cP) and the modified Walden products are in all ca-ses higher than the corresponding ordinary Walden pro-ducts. As can be observed in Figure 6, excellent universalcurves exist for the acetone mixtures with EtOH (0.97 ≤f(CsClO4; EtOH) ≤ 1.38), with 2-PrOH and with HFP (LiCl45, Bu4NCl45 (standard electrolyte), Bu4NClO4
45,
Bu4NBr45 and Bu4NI45). The ratios of the limiting conduc-tances of electrolytes are: 0.81 ≤ f(Bu4NCl; 2-PrOH) ≤1.06 and 0.85 ≤ f(Bu4NCl; HFP) ≤ 1.00.
N,N-dimethylformamide (protophilic H-bond donorsolvent13) has higher viscosity and dielectric constant thanacetone (η(DMF) = 0.794 cP13, D(DMF) = 36.7113) and intheir mixtures it is observed that ∂η(x)/∂x < 0 and∂D(x)/∂x < 0. The ordinary and the modified Walden pro-
Figure 6. Limiting conductances of electrolytes Λ0(x) at 298.15 K
(calculated using eq. 3) as a function of mole fraction of acetone x in
the acetone-alcohol mixtures. Ethanol: 1 – CsClO4; 2 – Et4NClO4; 3
– CsCl; 4 – NaCl. 2-Propanol: 5 – Bu4NCl; 6 – Bu4NBr; 7 – Bu4NI;
8 – Bu4NClO4; 9 – LiCl. 1,1,1,3,3,3-Hexafluoro-2-Propanol: 10 –
Bu4NCl; 11 – Bu4NBr; 12 – Bu4NI; 13 – Bu4NClO4; 14 – LiCl.
Table 1. Universal Curves of Limiting Conductances of Electrolytes in the Mixed – Solvent Mixtures at
298.15 K as Represented by Equation (7).
Units of Λ0, B and σ(Λ0) are S.cm2 mol–1; A is dimensionless.
x is the mole fraction of the first named component of the mixture.
System ΛΛ0 A B σσ (ΛΛ0)methanol – water, x < 0.40 149.74 0.7570 294.18 2.4
ethanol – water, x < 0.35 149.74 0.6592 413.88 2.6
1-propanol – water, x < 0.30 126.52 0.6145 365.98 2.0
tert-butanol – water, x < 0.22 149.74 0.5499 489.84 1.9
1,4-dioxane – water, x < 0.35 149.74 0.6798 415.00 1.9
acetone – water, x < 0.25 97.46 0.6421 191.52 2.2
acetone – water, x > 0.45 185.53 0.6297 514.07 3.0
DMF – water, x < 0.25 121.63 0.6952 346.04 2.4
DMF – water, x > 0.50 87.10 0.4365 210.04 1.7
TMS – water, x < 0.50 96.31 0.7755 286.21 2.4
EC – water, x < 0.35 149.74 0.8553 331.15 2.2
THF – water, x < 0.40 150.48 0.6149 407.31 2.4
methanol – AN, x > 0.58 109.67 0.6224 –225.31 1.6
ethanol – acetone, x > 0.10 58.04 0.2851 –527.38 1.5
1-propanol – acetone, x > 0.05 20.09 0.1835 –457.19 1.6
2-propanol – acetone, x > 0.15 20.63 0.2255 –472.66 1.2
FHP – acetone, x > 0.20 20.63 –0.0891 323.43 1.9
acetone – DMF, x > 0.20 132.50 0.4495 242.59 2.5
acetonitrile – PC, x > 0.30 170.17 0.6792 461.75 1.9
acetonitrile – DX, x > 0.35 172.99 0.2525 462.27 2.0
acetonitrile – CCl4, x > 0.35 152.27 0.4417 349.01 1.5
acetonitrile – toluene, x > 0.35 164.20 0.3259 303.02 1.3

7Acta Chim. Slov. 2009, 56, 1–17
Apelblat: A New Look on the Representation of Electrical Conductivities in Mixed Solvents ...
ducts predict that the DMF-rich region extends up to equi-molar mixtures of x* ∼ 0.50 and contrary to aqueous solu-tions Λ0(x).ηE(x) < 0. The universal curve of the limitingconductances (calculated from the DMF-rich region) of LiI46, LiClO4
46,47, NaI46, KI46, AgClO446, Bu4NI46,
Bu4NClO446, Bu4NBBu4
46 (tetrabutylammonium tetra-butylborate, standard electrolyte) is plotted in Figure 7(0.56 ≤ f (Bu4NBBu4) ≤ 1.00). It is evident that the limi-ting conductances of these electrolytes, if shifted toΛ0(Bu4NBBu4; x < x*), form an unique curve.
For the acetone-DMF system, Gill and Sharma46 alsoderived the limiting conductances of ions (without perfor-ming transference number measurements) by assuming thatΛ0(Bu4NBBu4; x) can be sub-divided into two ionic equalparts, i.e. λ0(Bu4N
+) = λ0(Bu4B–). Their values for the limi-
ting conductances of cations λ0(Me+; x < x*) where Me+ de-notes Li+, Na+, K+, Ag+ and Bu4N
+ (standard cation) and forthe limiting conductances of anions λ0(X–; x < x*) where X–
denotes I– and ClO4– (standard anion) were shifted by using
equation 5 and are plotted in Figure 8. As can be observed,the results presented in Figure 7 and 8 are consistent.
The last example of mixtures with acetone is 1,4-dioxane which is classified as a low permittivity electrondonor solvent13 (for aqueous solutions of 1.4-dioxanesee20). Since its dielectric constant is very low D(DX) =2.2113, the electrical conductances were investigated onlyin the acetone-rich region (Figure 7). Similarly to othersystems with acetone, we have Λ0(x).ηE(x) < 0 (η(DX) =1.20 cP13). The universal curve of the limiting conductan-ces as constructed from LiBr48, LiClO4
49(standard elec-trolyte), LiNO3
50 and NaClO451 electrolytes is plotted in
Figure 7 (0.90 ≤ f (LiClO4; acetone ) ≤ 1.00). Once again,equation 3 is very nicely satisfied.
4. 2. Limiting Conductances of Electrolytesin Mixtures with Acetonitrile
The conductivity of many electrolytes in a numberof nonaqueous mixtures with acetonitrile (AN) is reportedin the literature. Mixtures of acetonitrile (aprotic protop-hobic solvent; D(AN) = 35.95; η(AN) = 0.341 cP13) withmethanol, 1,4-dioxane, carbon tetrachloride and tolueneare considered here (for those with propylene carbonatesee20 and partly below).
The acetonitrile-methanol (amphiprotic hydroxylicsolvent13) mixtures are characterized by the strong sol-vent-solvent interactions considering that methanol is ex-tensively self-associated through H-bonding liquid (forcontroversial opinions about the structure of acetonitrilesee52). The dielectric constants of both pure components
Figure 7. Limiting conductances of electrolytes Λ0(x) at 298.15 K
(calculated using eq. 3) as a function of mole fraction of acetone x in
the acetone-1,4-dioxane and acetone-N,N-dimethylformamide mix-
tures. N,N-dimethylformamide: 1 – Bu4NBBu4; 2 – Bu4NI;
3 – Bu4NClO4; 4 – KI; 5 – NaI; 6 – LiClO4; 7 – AgClO4;
8 – LiI. 1,4-dioxane: 9 – LiClO4; 10 – LiBr ; 11 – NaClO4;
12 – LiNO3.
Figure 8. Limiting conductances of cations λ0(Me+,x) and anions
λ0(X–,x) at 298.15 K (calculated using eq. 5) as a function of mole
fraction of acetone x in the acetone-N,N-dimethylformamide mixtures.
1 – Bu4N+; 2 – Li+; 3 – Na+; 4 – K+; 5 – Ag+; 6 – I–; 7 – ClO4
–.
Figure 9. Excess viscosities ηE(x) in cP (upper curve) and excess
molar volumes VE(x) in cm3.mol–1 at 298.15 K as a function of mole
fraction of acetonitrile x in the acetonitrile – methanol mixtures.
Excess molar volumes: 1 – ref. 53; 2 – ref. 54; 3 – ref. 55.
Excess viscosities: 4 – ref. 53; 5 – ref. 54; 6 – ref. 55; 7 – ref. 56;
8 – ref. 24;

8 Acta Chim. Slov. 2009, 56, 1–17
Apelblat: A New Look on the Representation of Electrical Conductivities in Mixed Solvents ...
are close (D(MeOH) = 32.63; η(MeOH) = 0.543 cP13). Si-multaneously determined with electrical conductivities,viscosities53–55 and densities23,24,53–56 allow for the calcula-tion of the excess molar volumes VE(x) and the excess vis-cosity ηE(x). As can be observed in Figure 9, VE(x) < 0 andηE(x) < 0, and the excess properties are asymmetricalfunctions of x with minima close to the methanol region(the negative values of ηE(x) lead also to Λ0(x).ηE(x) < 0).The agreement between the dielectric constants in the ace-tonitrile-methanol mixtures as reported in various investi-gations is less satisfactory than that for the viscosities (Fi-gure 10, see reported by Gill and Chauhan56 values).
The conductivities of quaternary ammonium perch-lorates and halides were investigated in the acetonitri-le–methanol mixtures, Me4NClO4, Et4NClO4, Bu4NClO4,He4NClO4 by D’Aprano et al54; KClO4 by D’Aprano andDonato29 and by Conti and Pistoia53; LiClO4, NaClO4, KI,AgNO3, NaBPh4, Bu4NCl, Bu4NBr, Bu4NI, Bu4NClO4,Bu4NNO3, Bu4NBPh4 by Gill and Chauchan56; Et4NBr,Pr4NBr, Bu4NBr, Pen4NBr, Hex4NBr, Hep4NBr, Bu4NBPh4
by Das, and Saha23 and by Das et al24 whereas Coplan andFuoss55 considered triisoamyl-n-butylammonium iodide,picrate and tetraphenyborate (i-Am3BuNI, i-Am3BuNPic,i-Am3BuNBPh4). The acetonitrile-methanol mixtures we-re already considered by the author20 but only using theDas group results with Bu4NBr as the standard electrolyte.In this work, by taking Bu4NClO4 as the standard elec-trolyte, the shifting of the limiting conductances of elec-trolytes (according to equations 3 and 4, x* ∼ 0.42) is per-formed with a considerably larger number of electrolytes.However, LiClO4, Bu4NCl and NaBPh4
56 were excludedfrom further analysis, because their Λ0(x) values are pro-bably inaccurate. The obtained universal curve is plottedin Figure 11 (0.79 ≤ f (Bu4ClO4; MeOH) ≤ 1.50 and 0.84≤ f(Bu4ClO4; AN) ≤ 1.38). As can be observed, an excel-lent universal curve exists in the methanol-rich concentra-tion region. However, the scattering of Λ0(x) values in theacetonitrile-rich region is less satisfactory, especially con-
sidering the results of the Das group23,24 which are syste-matically lower than those obtained by others. Neverthe-less, there is no doubt that the shifting procedure producesa unique curve over the entire concentration range of ace-tonitrile-methanol mixtures.
Electrical conductivities of electrolytes of acetoni-trile mixtures with 1,4-dioxane and with carbon tetrachlo-ride (low polarity solvent of high polarizability, D(CCl4) =2.23 and η(CCl4) = 0.905 cP13) were only considered inthe acetonitrile-rich region where the limiting conductan-ces of LiClO4
49, NaClO451, Et4NClO4
57, Bu4NClO458 and
Figure 10. Dielectric constants D(x) at 298.15 K as a function of mo-
le fraction of acetonitrile x in the acetonitrile- methanol mixtures.
1 – ref. 56; 2 – ref. 24; 3 – ref. 53; 4 – ref. 54; 5 – ref. 55.
Figure 11. Limiting conductances of electrolytes Λ0(x) at 298.15 K
(calculated using eqs. 3 and 4) as a function of mole fraction of ace-
tonitrile x in the acetonitrile-methanol mixtures.
1 – Me4NClO4, Et4NClO4, Bu4NClO4, He4NClO4 ref. 54; 2 – KClO4
refs. 29 and 53; 3 – i-Am3BuNI, i-Am3BuNPic, i-Am3BuNBPh4 ref.
55; 4 – NaClO4, KI, AgNO3, Bu4NBr, Bu4NI, Bu4NClO4, Bu4NNO3,
Bu4NBPh4 ref. 56; 5 – Et4NBr, Pr4NBr, Bu4NBr, Pen4NBr, Hex4NBr,
Hep4NBr, Bu4NBPh4 refs. 23 and 24.
Figure 12. Limiting conductances of electrolytes Λ0(x) at 298.15 K
(calculated using eq. 4) as a function of mole fraction of acetonitrile
x in the acetonitrile-1,4-dioxane and acetonitrile-carbon tetrachloride
mixtures.
1.4-dioxane: 1 – NaClO4; 2 – LiClO4; 3 – Bu4NClO4; 4 – Bu4NI;
5 – Et4NI. carbon tetrachloride: 6 – Me4NBPh4; 7 – Et4NBPh4;
8 – Pr4NBPh4; 9 – Bu4NBPh4, ref. 59; 10 – Bu4NBPh4, ref. 55;
11 – Bu4NClO4.

9Acta Chim. Slov. 2009, 56, 1–17
Apelblat: A New Look on the Representation of Electrical Conductivities in Mixed Solvents ...
Bu4NI57 were determined in mixtures with 1,4-dioxaneand Bu4NClO4
58, Me4NBPh459, Et4NBPh4
59, Pr4NBPh459
and Bu4NBPh459,60 in mixtures with carbon tetrachloride (in
both mixtures Λ0(x).ηE(x) < 0; see also20). Using LiClO4
and Me4NBPh4 as the standard electrolytes, the universalcurves were evaluated and are presented in Figure 12(0.96 ≤ f(LiClO4; DX) ≤ 1.06 and 0.92 ≤ f(Me4NBPh4;CCl4) ≤ 1.27). As can be seen, the change of Λ0(x) withmole fraction of acetonitrile x is almost linear, which ex-presses a simple dilution effect, i.e. the universal curve co-vers nearly the entire concentration region and that sol-vent which has the larger dielectric constant is of impor-tance.
The same behaviour of limiting conductances is ob-served in the acetonitrile-toluene mixtures. Toluene, likecarbon tetrachloride, is classified as a low polarity solventof high polarizability with D(toluene) = 2.38 and η(tolue-ne) = 0.552 cP13. Electrolytes in the acetonitrile-toluenemixtures were investigated at three temperatures, 288.15K, 298.15 K and 308.15 K by Papadopoulos61 (NaBPh4),Papadopoulos and Ritzoulis62 (Bu4NI), Papadopoulos etal63 (Pr4NBr) and by Papadopoulos64 (Pr4NI, only at298.15 K). The universal curves of limiting conductanceswere evaluated for these temperatures choosing Bu4NI asthe standard electrolyte and they are plotted in Figure 13(0.95 ≤ f(Bu4NI; T = 298.15 K) ≤ 1.21). Once again, a su-perb confirmation of the existence of universal curves isobserved, this time from conductivities at different tempe-ratures.
308.15 K) is considered here. Sulfolane is an aprotic pro-tophilic solvent13 of intermediate dielectric constant andof high viscosity where water belongs to the group ofamphiprotic hydroxylic solvents13 having a high dielectricconstant and relatively low viscosity (D(TMS, 298.15 K)= 43.313, D(TMS, 308.15 K) = 42.765, η(TMS, 298.15 K)= 10.29 cP13 and η(TMS, 298.15 K) = 9.03 cP65 where thecorresponding values for water are: D(H2O, 298.15 K) =78.3613, D(H2O, 308.15 K) = 74.6465, η( H2O, 298.15 K)= 0.890 cP13 and η( H2O, 298.15 K) = 0.791 cP65). The ex-cess molar volumes in the sulfolane-water mixtures arenegative65–67 and since ηE(x) < 0, the modified Waldenproducts are larger than the ordinary Walden products (x*∼ 0.40 which is also close to the minimum of VE). Fromthe water-rich region, the universal curves of limiting con-ductances for the sulfolane-water mixtures were preparedusing LiCl65, NaCl68, KCl72, NaClO4
73 at 308.15 K andNaCl68, KBr69, KI69, KClO3
66, KClO470, Bu4NBPh4
69,Et4NBr69, Bu4NI69 at 298.15 K (at this temperature there’salso conductivity data for NaBr, KI and KNO3 in very di-luted TMS solutions71) and they are plotted in Figure 14.KCl (1.00 ≤ f(KCl; T = 308.15 K) ≤ 1.29) and NaCl (0.83≤ f(NaCl; T = 298.15 K) ≤ 3.24) were chosen as the stan-dard electrolytes. What is rather surprising in this systemis that the shifting of Λ0(x) by equation 3 is valid for x <0.9, i.e. considerably far from the x* value which is expec-ted from the division into concentration regions based onthe Walden products. It seems that only water governs theconductivity of electrolytes where sulfolane plays only a
Figure 13. Limiting conductances of electrolytes Λ0(x) at 288.15 K,
298.15 K and 308.15 K (calculated using eq. 4) as a function of mo-
le fraction of acetonitrile x in the acetonitrile-toluene mixtures.
1 – NaBPh4; 2 – Bu4NI; 3 – Pr4NI; 4 – Pr4NBr.
Figure 14. Limiting conductances of electrolytes Λ0(x) at 298.15 K
and at 308.15 K (calculated using eq. 3) as a function of mole frac-
tion x of sulfolane in the sulfolane-water mixtures.
298.15 K: 1 – KClO3; 2 – KClO4; 3 – NaCl; 4 – KI; 5 – KBr;
6 – Bu4NBPh4; 7 – Bu4NI; 8 – Et4NBr. 308.15 K: 9 – NaClO4;
10 – KCl; 11 – LiCl; 12 – NaCl.
4. 3. Limiting Conductances of Electrolytesin Mixtures with SulfolaneThe universal curve of the limiting conductances in
the water-sulfolane (tetramethylene sulfone denoted asTMS) mixtures at 303.15 K was already discussed.20 Con-ductivity data at two more temperatures (298.15 K and
role of inert diluent. Similarly as reported previously20 at303.15 K, at 298.15 K and 308.15 K, the universal curvesΛ0(x) are satisfied by a quite different groups of electroly-tes, alkali halides, alkali perchlorates and quaternary am-monium salts.

10 Acta Chim. Slov. 2009, 56, 1–17
Apelblat: A New Look on the Representation of Electrical Conductivities in Mixed Solvents ...
Our knowledge of the conductivities of electrolytesin mixtures of sulfolane with other solvents is very limited(LiCl in mixtures of methanol at 308.15 K25,74 and KClO4
in mixtures of methanol or acetonitrile at 298.15 K29). Ne-vertheless, it is possible to construct the universal curve ofelectrolytes for the sulfolane-methanol mixtures becauseviscosities η(x) at these temperatures are known. Usingthe ordinary Walden product, the values of Λ0(x, 308.15K) of potassium perchlorate were estimated and shiftedtogether with lithium chloride (Figure 15, f(KClO4; T =308.15 K) = 1.33; Λ0(x).ηE(x) < 0). As can be observed,over practically the entire concentration range, a sounduniversal curve is obtained which can be used to estimatethe limiting conductances of other electrolytes in the sul-folane-methanol mixtures.
number measurements), their values of Li+(standard ca-tion); Na+; K+; Rb+; Cs+; Bu4N
+; Br–(standard anion); ClO4
–; Pic– and Bu4B– were recalculated by using equa-
tion 6 and they are plotted in Figure 17. As can be obser-ved, the universal curves of limiting conductances of elec-trolytes and of ions in the sulfolane-γ-butyrolactane mix-tures (Figures 16 and 17) are consistent.
4. 4. Limiting Conductances of Electrolytesin Mixtures with Propylene Carbonate
Propylene carbonate (PC) is usually investigated inthe context of high-energy lithium batteries being a com-ponent of conducting media having at 298.15 K a relati-vely high dielectric constant D(PC) = 64.95 and viscosity
Figure 15. Limiting conductances of electrolytes Λ0(x) at 308.15 K
(calculated using eq. 3, see also text) as a function of mole fraction of
sulfolane x in the sulfolane-methanol mixtures.
1 – KClO4; 2 – LiCl.
Figure 16. Limiting conductances of electrolytes Λ0(x) at 308.15 K
(calculated using eq. 4) as a function of mole fraction of sulfolane xin the sulfolane-methanol mixtures.
1 – Bu4NBBu4; 2 – Bu4NClO4; 3 – Bu4NNO3; 4 – NaPic; 5 – RbPic;
6 – Bu4NPic; 7 – Bu4NBr; 8 – LiPic; 9 – KPic; 10 – CsPic.
Figure 17. Limiting conductances of cations λ0(Me+,x) and anions
λ0(X–,x) at 298.15 K (calculated using eq. 6) as a function of mole
fraction of sulfolane x in the sulfolane-γ-butyrolactone mixtures.
1 – Bu4N+; 2 – Li+; 3 – Na+; 4 – K+; 5 – Rb+; 6 – Cs+; 7 – Bu4B
–; 8 –
Pic–; 9 – ClO4–; 10 – Br–.
D’Aprano et al75 investigated electrical conductivi-ties of tetrabutylammonium salts (Bu4NBr, Bu4NClO4,Bu4NNO3, Bu4NBBu4) and picrates (LiPic, NaPic, KPic,RbPic, CsPic, Bu4BPic) in the γ-butyrolactane rich mixtu-res with sulfolane. γ-Butyrolactane (4-hydroxybutyricacid lactone) is an aprotic protophobic solvent with D(γ-BL) = 39.1 and η(γ-BL, 298.15 K) = 1.732 cP13, i.e. con-siderably less viscous liquid than sulfolane but nearly ofthe same dielectric constant. Their limiting conductancesare shifted with potassium picrate (0.84 ≤ f(KPic) ≤ 1.35)chosen as the standard electrolyte . The modified Waldenproduct undoubtedly predicts a division of concentrationregions at x* ∼ 0.45 where the ordinary Walden producthas a nearly constant value (Λ0(x).ηE(x) < 0). This is inagreement with the universal curve presented in Figure 16indicating once more the superiority of the modified Wal-den product.
Since D’Aprano et al75 also estimated the limitingconductances of ions (without performing transference

11Acta Chim. Slov. 2009, 56, 1–17
Apelblat: A New Look on the Representation of Electrical Conductivities in Mixed Solvents ...
η(PC) = 2.51 cP13. The existence of an excellent universalcurve of limiting conductances for LiBr, LiClO4, LiAsF6
(lithium hexafluoroarsenate), Bu4NClO4 and Bu4NBPh476–80 (from PC side) in the acetonitrile-propylene carbona-te mixtures was already reported elewhere20
. Since con-ductivity measurements are mainly limited to lithiumsalts, the role of propylene carbonate (4-methyl-1,3-dio-xolane-2-one; aprotic protophobic solvent13) for the sameelectrolyte but with different solvents is illustrated here(for a similar example of water with various alcohols seeearlier). Two cases will be considered LiClO4 and LiBr.
In the case of lithium perchlorate, conductances we-re determined by Barthel et al77 in the acetonitrile (AN) –PC mixtures, by Salomon and Plichta81,82 in the dimet-hoxymethane (DMM) – PC mixtures and in the dimethox-yethane (DME) – PC mixtures. Moumouzias and Ritzou-lis83 reported limiting conductances in the toluene – PCmixtures and Wawrzyniak and Jasiñski84 in the methanol– PC mixtures. Thus, using the classification given in theBarthel et al book13, PC (aprotic protophobic solvent) ismixed with a solvent of similar character (AN), with a lowpermittivity electron donor solvents (DMM and DME),with a low polarity solvent of high polarizability (toluene)and finally with a amphiprotic hydroxylic solvent (Me-OH). Evidently, these solvents differ considerably whentheir relevant physical properties are compared: D(PC) =64.9513; D(AN) = 35.9513; D(DMM) = 2.7181; D(DME) =7.0813,82,85; D(toluene) = 2.3813; D(MeOH) = 32.6313 andη(PC) = 2.51 cP13; η(AN) = 0.341 cP13; η(DMM) = 0.329cP81; η(DME) = 0.41 cP13,82,85; η(toluene) = 0.552 cP13,82;η(MeOH) = 0.543 cP13,82. With the exception of the Wa-wrzyniak and Jasiñski result for the limiting conductanceof lithium perchlorate in pure propylene carbonate Λ0(LiClO4) = 28.1184, other reported values are in a goodagreement Λ0(LiClO4) = 26.7777; Λ0(LiClO4) = 26.7581;Λ0(LiClO4) = 26.3483 and therefore their values of Λ0(LiClO4;x) in the propylene carbonate-methanol mixtu-res were multiplied by a constant factor of 0.95 beforeputting them together with other solvents in Figure 18. Ascan be observed, if we limit ourselves to the PC-rich mix-tures (x > 0.50) and if it is assumed that in this concentra-tion region the effect of a co-solvent is secondary then on-ly Λ0(LiClO4;x) in the propylene carbonate-toluene mixtu-res are systematically lower than those in other mixtures.At this point, the reason for such behaviour is not clear(there is also an inconsistency between the conductivitiesof LiClO4
83, Bu4NBPh483 and Bu4NClO4
79 if the universalcurve is prepared for the propylene-toluene mixtures).
In the next example lithium bromide is considered inthe PC – AN76, PC – MeOH84 and PC – DME85 mixtures(Λ0(LiBr) = 27.1576; Λ0(LiBr) = 27.8084; Λ0(LiBr) = 27.1585). The limiting conductances Λ0(LiBr;x) are plotted in Figure 19 together with two more salts whichhave similar limiting conductances in pure propylene car-bonate (LiAsF6 in the PC – AN mixtures, Λ0(LiAsF6) =24.9378 and Bu4NClO4 in the PC – toluene mixtures,
Λ0(Bu4NClO4) = 28.0679). Once again for x > 0.50, theexistence of a common curve Λ0(LiBr;x) is observedwhich indicates that in the propylene carbonate rich mix-tures, the limiting conductivities very weakly depend onthe type of the second component in the mixture and evenon the type of the dissolved electrolyte.
5. Formal Representation of Limiting Conductances
of Electrolytes in Mixed Solvents The limiting conductances of electrolytes in mixed-
solvent systems Λ0(x,T) as a function of composition (or theWalden products Λ0(x,T).η(x,T) = f(x)) are usually reportedonly in tabular form. It seems worthwhile to present them
Figure 18. Limiting conductances of lithium perchlorate Λ0(x) at
298.15 K as a function of mole fraction of propylene carbonate x in
the propylene carbonate-solvent mixtures.
1 – acetonitrile; 2 – dimethoxyethane; 3 – dimethoxymethane; 4 – to-
luene; 5 – methanol;
Figure 19. Limiting conductances of lithium bromide Λ0(x) at
298.15 K as a function of mole fraction of propylene carbonate x in
the propylene-solvent mixtures.
3 – methanol; 1 – dimethoxyethane; 2 – acetonitrile; 3 – methanol;
4 – toluene (Bu4NClO4, see text); 5 – acetonitrile (LiAsF6, see text).

12 Acta Chim. Slov. 2009, 56, 1–17
Apelblat: A New Look on the Representation of Electrical Conductivities in Mixed Solvents ...
also by using formal mathematical expressions which willbe convenient in further calculations and allow, if neces-sary, to obtain the intermediate values of Λ0(x,T). Since atpresent-day there is no theoretical guiding about the formof such expressions, any empirical equation which is able torepresent accurately the data can be chosen. However, thepreferable equation should be simple and with a small num-ber of adjustable parameters which are easy to evaluate.The simplest case is evidently the polynomials of variousorders of x but they have two disadvantages. Usually to ob-tain a desired accuracy, a large number of terms is requiredand because 0 < x < 1, the absolute value coefficients in-crease considerably when passing from one to the nextcoefficient. If a two-parameter fitting of the universal curvein mixed solvents is desired at a given temperature T (limi-ting conductances of the standard electrolyte XY in the cor-responding concentration regions, e.g. for 0 ≤ x < x*) thenthe following equation is proposed
(7)
This equation was found to be very suitable to repre-sent with a reasonable accuracy the universal curves ofelectrolytes. Selected A, B and x values are reported whe-re x = x* is the mole fraction of the first named componentof the mixture in Table 1. In calculations, conductivity da-ta was taken from the previous paper20 and from the sys-tems considered here. The mean standard deviationsσ(Λ0(x,T)) which characterize the scattering of the limi-ting conductances in the investigated mixtures are also re-ported in Table 1. The values of σ(Λ0(x,T)) represent thecombined effect of the accuracy of derived limiting con-ductances for different electrolytes, of the suitability ofthe applied equation 7 and, most importantly, of the cor-rectness of the assumption that the universal curves exist.
On the other hand, when the limiting conductancesof a particular electrolyte Λ0(x,T) over entire concentra-tion range 0 ≤ x ≤ 1 are required (or for a limited range ofcompositions, x > 0 , for example when measurements arelimited by a low value of dielectric constant, see 1,4-dio-xane – water mixtures), the knowledge of the viscositiesη(x,T) and the dielectric constants D(x,T) allows for onlymeasurable physical quantities to be involved in the repre-sentation of Λ0(x,T). From the functional dependencef(Λ0,η, D; x) = 0, the composition x can be excluded andtherefore given only indirectly. Following a frequently ap-plied engineering practice (see for example37), thesephysical quantities are raised to various powers and ex-pressed as the modified product of them
(8)
i.e. the fit of Λ0(x,T) is a three-adjustable parameter (α, βand C) equation which for the ordinary Walden product
takes the form
(9)
It was found that eq. (8) represents reasonably wellexperimental results and the evaluation of parameters iseasy because the logarithmic form of it is linear (the mul-tivariate least-square method was applied to obtain theseparameters whereas larger weight factors were introducedin the case of pure solvents). Values of α, β, C andσ(Λ0(x,T)) for a number of electrolytes in mixed-solventsystems with and without water are reported in Table 2. Inorder to limit the number of them, only these mixtureswhich were repeatedly investigated in the literature areconsidered. Once again it should be stressed thatσ(Λ0(x,T)) depends on the accuracy of the determinedΛ0(x,T), η(x,T) and D(x,T) values and the capability ofequation 8 to represent conductivity data of electrolytes indifferent solvent-mixed systems (the ratio σ(Λ0(x))/Λ0 forall reported in Table 2 mixtures is less than 0.02).
Formally, it follows that in a given mixed-solventsystem, equation (8) leads to the universal curve for elec-trolytes (eqs. (3) and (4)). However this will happen only
Electrolyte αα ββ C σσ(ΛΛ0)methanol – water
LiCl 0.8161 0.7270 4.414 0.8
LiBr 0.7942 0.7874 3.435 1.3
NaBr 0.7547 0.7077 5.429 1.2
NaI 0.7703 0.6206 7.775 0.5
NaNO3 0.7431 0.5835 8.781 0.2
KNO3 0.7408 0.7037 6.186 0.3
CsCl 0.8042 0.7876 4.465 0.4
Et4NPic 0.7872 –0.1838 128.02 0.3
NaBPh4 0.6585 0.1682 31.209 0.6
Et4NCl 0.8389 0.4534 13.715 1.2
Et4NBr 0.8414 0.4166 16.298 0.7
Et4NI 0.8366 0.3402 22.462 0.6
Et4NClO4 0.8148 0.1457 48.011 0.5
ethanol – water
LiCl 0.6026 0.8061 3.182 1.0
LiBr 0.7258 0.7668 3.782 0.6
LiNO3 0.6673 0.8150 5.202 0.8
NaCl 0.7093 0.8281 3.351 1.0
NaNO3 0.6700 0.8818 5.004 0.9
KCl 0.6974 0.6910 3.759 1.4
KBr 0.6887 0.8751 3.005 0.8
KClO4 0.7163 0.6815 6.397 1.1
KNO3 0.6651 0.7146 3.923 1.2
CsCl 0.6636 0.8109 3.114 0.5
Me4NBr 0.7488 0.5796 8.970 0.2
Et4NBr 0.7662 0.4946 11.668 0.3
Pr4NBr 0.7639 0.5241 9.410 0.4
Bu4NBr 0.7535 0.5535 7.945 0.6
Table 2. Limiting Conductances of Electrolytes in the Mixed – Sol-
vent Mixtures at 298.15 K as Represented by Equation (8).

13Acta Chim. Slov. 2009, 56, 1–17
Apelblat: A New Look on the Representation of Electrical Conductivities in Mixed Solvents ...
1-propanol – water
NaCl 0.4700 0.9861 1.618 1.2
NaBr 0.5233 0.9750 1.716 1.5
NaI 0.5566 0.8808 2.535 1.8
NaClO4 0.5394 0.7467 4.220 1.6
NaBPh4 0.7024 0.4968 7.371 0.7
Bu4NI 0.6047 0.6495 5.236 1.3
tert.-butanol – water
LiBr, x < 0.15 0.7635 0.2819 31.313 0.7
LiClO4, x < 0.89 0.6222 0.5814 7.739 1.4
NaBr, x < 0.20 0.6514 0.5442 11.085 0.6
NaClO4, x < 0.59 0.6773 0.5262 10.995 0.8
KCl, x < 0.20 0.6170 0.6648 7.687 1.0
KBr, x < 0.50 0.5365 0.9166 2.602 1.5
KClO4, x < 0.50 0.6627 0.6140 8.942 0.6
Me4NBr, x < 0.20 0.7040 0.4529 15.693 0.8
Me4NI, x < 0.20 0.7314 0.3688 22.321 0.6
Bu4NBr, x < 0.70 0.6542 0.5862 6.969 1.0
1,4-dioxane – water
HCl, x < 0.48 0.2823 0.9582 6.313 1.5
LiF, x < 0.17 0.6614 0.3799 16.627 0.1
LiCl, x < 0.43 0.6741 0.3864 19.707 0.2
LiClO3, x < 0.54 0.5887 0.3504 20.725 0.8
LiClO4, x < 0.45 0.8802 0.2038 39.333 0.4
NaF, x < 0.26 0.5929 0.4463 14.066 0.1
NaCl, x < 0.50 0.5613 0.4804 14.547 0.9
NaBr, x < 0.43 0.6627 0.4003 20.751 0.5
NaClO4, x < 0.48 0.8118 0.2710 32.608 1.1
NaBrO3, x < 0.20 0.6480 0.3109 25.285 0.2
NaNO3, x < 0.44 0.5646 0.4163 18.481 1.2
KCl, x < 0.44 0.6368 0.5007 15.651 0.5
KBr, x < 0.15 0.6549 0.5078 15.332 0.3
KClO3, x < 0.43 0.6199 0.4323 19.476 1.5
KClO4, x < 0.48 0.8177 0.3420 28.712 0.9
KNO3, x < 0.40 0.7220 0.3719 26.303 0.5
RbCl, x < 0.46 0.6502 0.4993 16.121 0.4
RbBr, x < 0.44 0.6398 0.5009 16.191 0.9
RbI, x < 0.41 0.7681 0.4049 24.067 0.4
RbClO4, x < 0.38 0.8899 0.2956 35.808 0.2
CsCl, x < 0.54 0.5903 0.5358 13.775 0.9
CsBr, x < 0.52 0.6636 0.4739 18.131 1.0
CsI, x < 0.43 0.7510 0.4216 22.396 0.9
Bu4NBr, x < 0.09 0.9050 0.0960 57.745 0.3
Bu4NI, x < 0.18 1.0358 0.0680 63.458 0.2
Et4NClO4, x < 0.43 0.9139 0.1485 46.574 0.9
Bu4NClO4, x < 0.43 1.0496 0.0565 59.952 0.6
Me4NPic, x < 0.33 –0.0914 1.0398 0.8171 0.4
N,N-dimethylformamide – water
NH4NO3 0.8508 0.6839 6.722 2.8
LiNO3 0.9804 0.5527 8.860 1.6
NaNO3 0.8474 0.5967 8.266 2.7
NaClO4 0.9205 0.6074 7.451 0.4
NaBPh4 0.7935 0.4324 9.699 0.4
KNO3 0.8423 0.7944 4.144 2.1
KSCN 0.9212 0.7294 5.228 1.1
KPic 0.8300 0.6790 4.891 0.4
i-Am3BuNI 0.9888 0.4475 12.115 0.8
tetrahydrofuran – water
HCl, x < 0.78 0.4762 1.1323 2.897 3.1
NaClO4, x < 0.37 0.9468 0.3414 23.896 0.7
KCl, x < 0.58 0.7915 0.7260 5.776 1.8
KI, x < 0.48 0.7473 0.6855 6.944 1.6
KClO4, x < 0.58 0.8864 0.5186 13.244 1.3
CsCl, x < 0.74 0.9519 0.7161 6.044 2.2
CsBr, x < 0.70 0.7445 0.7098 6.463 1.9
CsNO3, x < 0.37 0.6595 0.6920 6.562 0.5
tetramethylene sulfone – water, 303.15 K
NaBr 0.8641 0.4855 14.226 1.4
NaI 0.9715 0.4755 14.302 2.8
NaBPh4 0.9615 0.4675 8.330 2.2
Bu4NCl 0.7270 0.5454 8.351 2.3
Bu4NBr 0.8150 0.5444 8.451 1.5
Bu4NI 0.8950 0.5560 7.711 2.5
Bu4NClO4 0.9555 0.4195 12.441 2.4
i-Am3BuNI 0.9215 0.4575 11.872 3.3
methanol – acetonitrile
NaClO4 0.8682 0.3666 19.115 0.8
KI 0.9561 0.2880 23.732 0.7
KClO4 0.8818 0.1847 37.863 0.7
AgNO3 1.0738 –0.1583 106.62 0.4
Et4NBr 0.6527 1.6995 0.2087 1.2
Pr4NBr 0.6367 2.2975 0.02298 1.4
Bu4NBr 0.5920 2.6279 6.9993e-3 1.2
Pen4NBr 0.6063 2.6506 6.1276e-3 1.4
Hep4NBr 0.5522 3.0273 1.5916e-3 1.1
Hex4NBr 0.6201 2.7020 4.8588e-3 1.4
Bu4NI 0.9021 0.5487 8.7030 0.3
Me4NClO4 0.9675 –0.9319 1997.1 0.4
Et4NClO4 0.9013 –0.4859 413.07 0.5
Bu4NClO4 0.9380 –0.1905 120.55 0.7
Hex4NClO4 0.9472 –0.2120 120.43 0.3
Bu4NNO3 0.9034 0.3960 15.330 0.9
Bu4NBPh4 0.8920 0.5238 7.060 0.5
i-Am3BuNI 0.7435 1.4164 0.4550 0.5
i-Am3BuNPic 0.7682 1.3214 0.5251 0.5
i-Am3BuNBPh4 0.8972 0.5199 6.943 0.1
methanol – 1,4-dioxane, x > 0.61
LiBr 2.5992 –0.2568 48.283 0.5
NaClO4 5.7108 –0.6260 31.699 0.7
KNO3 –1.5139 0.6304 31.764 0.4
RbCl 2.5296 –0.0141 24.362 0.8
RbBr 0.5782 0.1944 40.362 0.3
RbNO3 –0.2579 0.3847 35.619 0.8
CsCl 0.3034 0.2356 41.464 0.5
CsNO3 0.1752 0.3014 38.988 0.6
Et4NBr –0.3193 0.3580 42.195 1.2
acetonitrile – propylene carbonate
LiBr 0.7896 –0.4181 322.16 0.3
LiClO4 0.8343 –0.3267 225.79 0.1
LiAsF6 0.8902 –0.2390 153.58 0.3
Bu4NBPh4 0.9971 0.0895 29.999 0.2

14 Acta Chim. Slov. 2009, 56, 1–17
Apelblat: A New Look on the Representation of Electrical Conductivities in Mixed Solvents ...
acetonitrile – 1,4-dioxane
LiClO4, x > 0.38 0.0277 0.6300 17.573 0.2
NaClO4, x > 0.38 1.0530 0.0144 55.852 0.9
Bu4NClO4, x > 0.36 –0.2993 0.7743 14.096 0.6
Bu4NI, x > 0.45 –5.1329 3.8976 0.0332 1.5
acetonitrile – carbon tetrachloride
Bu4NClO4, x > 0.53 0.0035 0.6232 17.628 0.8
Me4NBPh4, x > 0.43 0.0139 0.5832 18.553 0.1
Et4NBPh4, x > 0.48 0.3390 0.3972 23.948 0.6
Pr4NBPh4, x > 0.40 0.2536 0.4265 21.249 0.3
Bu4NBPh4, x > 0.15 1.2968 –0.0912 41.616 0.3
acetonitrile – toluene
Pr4Br, x > 0.48 0.1038 0.2832 55.562 0.9
Pr4NI, x > 0.34 0.1405 0.2807 54.542 0.5
Bu4NI, x > 0.34 0.0350 0.3245 49.572 1.0
NaBPh4, x > 0.48 0.0971 0.2873 43.610 0.6
acetone – ethanol
NaCl 1.7816 4.3818 4.1394e-5 1.0
CsCl 1.7817 4.5967 2.1441e-5 1.4
CsClO4 0.9967 0.2263 30.629 0.1
Et4NClO4 1.0962 0.8583 4.2695 0.6
acetone – N,N-dimethylformamide
LiI –0.0454 –1.5991 25945 1.6
LiClO4 0.3806 –0.8471 1539.0 1.0
NaI 0.4509 –0.6991 941.06 1.3
KI 0.7640 –0.2009 145.03 0.6
AgClO4 0.3909 –0.7134 1068.7 0.6
Bu4NI 0.9644 0.1131 41.421 0.4
Bu4NClO4 1.0486 0.2662 23.392 0.5
Bu4NBBu4 1.2629 0.5466 5.6316 0.3
acetone – 1-propanol
LiCl 1.2311 3.5070 1.1620e-3 1.1
Bu4NCl 1.1246 2.1208 0.07497 1.5
Bu4NBr 1.1135 2.3335 0.04240 1.7
Bu4NI 1.0810 1.6912 0.3089 1.3
Bu4NClO4 1.0069 0.2883 22.272 1.2
acetone – 2-propanol
LiCl 1.1080 2.7387 0.01307 1.5
Bu4NCl 1.0500 1.6227 0.3627 1.1
Bu4NBr 1.0563 1.6723 0.3278 1.3
Bu4NI 1.0370 1.2621 1.1666 0.9
Bu4NClO4 0.9959 0.3576 18.185 0.4
tetramethylene sulfone – γ-butyrolactane, x < 0.68
LiPic 0.9755 0.5338 6.854 0.9
NaPic 0.8316 0.4855 8.154 0.7
KPic 1.0120 0.4950 9.984 0.4
CsPic 0.8498 0.5465 7.798 0.8
RbPic 0.8984 0.5635 7.305 0.5
Bu4NPic 0.8921 –0.2909 150.86 0.1
Bu4NBr 0.8518 0.5050 10.056 0.6
BU4NClO4 0.8448 –0.0220 71.006 0.1
Bu4NNO3 0.7950 1.1321 0.9645 0.3
Bu4NBBu4 0.9585 1.5742 0.1274 0.1
propylene carbonate – dimethoxymethane
LiClO4 0.5308 –0.1730 90.044 1.1
LiAsF6 0.7534 –0.0815 63.664 0.6
Bu4NClO4 0.6008 –0.1075 77.015 0.5
Bu4NBPh4 0.7926 –0.0569 45.325 1.0
propylene carbonate – 1,2-dimethoxyethane
LiBr, x < 0.81 0.1091 –0.5586 417.44 0.3
LiClO4 0.2437 –0.6068 411.53 1.2
LiAsF6, x < 0.24 0.4446 –0.3076 168.93 0.1
Bu4NCl –0.2347 –0.9080 987.55 0.7
Bu4NClO4 0.3926 –0.3653 184.69 0.5
Bu4NBBu4 0.5002 –0.4666 190.60 0.5
α and β are dimensionless; C is in S cm2.mol–1 cP–1 and σ(Λ0) in
S.cm2.mol–1.
x is the mole fraction of the first named component of the mixture.
if the parameters α and β will be the same for any pair ofelectrolytes because then Λ0
j (x,T)/Λ0i (x,T) = Cj/Ci = const.
(η(x,T) and D(x,T) are the same for all electrolytes). Un-fortunately, such situation is rarely observed, because αand β have different values for electrolytes (Table 2).
6. Conclusions and Remarks
Considering its importance, the ordinary Waldenproduct, Λ0(x,T).η(x,T), (even when unverified for a num-ber of temperatures) is routinely discussed in the analysisof conductivity experiments of electrolytes in mixed sol-vents. Previously20 and here, it is suggested to use it toget-her with the modified Walden product, Λ0 (x,T)η# (x,T),and the excess Walden product Λ0(x,T)ηΕ (x,T). Both the-se Walden products are often superior when the divisionof mixtures into concentration regions is desired. An alter-native indicator of such division, the maximum of visco-sity or the ordinary Walden product are less adequatetools. The sign and magnitude of the excess viscosity ηΕ
(x,T) which is included in the excess Walden product, is ofsignificance because usually it is associated with the typeof interactions between solvents in the mixture.
For the first time, it is proposed to correlate, by aformal mathematical expression, the universal curves oflimiting conductances as a function of mole fraction x andthe limiting conductances Λ0(x,T) as a function of measu-rable physical properties of the mixture η(x,T) and D(x,T).This will provide a convenient additional tool when beha-vior of electrolytes in various mixed solvent systems isquantitatively compared.
Here and earlier20, the existence of universal curvesof limiting conductances was satisfactorily verified formany mixed solvent systems with various types of elec-trolytes or ions and there is no doubt that they can serve to

15Acta Chim. Slov. 2009, 56, 1–17
Apelblat: A New Look on the Representation of Electrical Conductivities in Mixed Solvents ...
estimate the unknown values of Λ0(x,T) and to give someindication about the quality of the performed conductivitymeasurements. This is of importance because from theanalysis of conductivity data it is clear that the results re-ported in the literature have unequal value if the accuracyis taken into account. This is evident when viscosities ordielectric constants from different investigations are com-pared. It is not clear why nitrates are usually a less suitab-le choice to be the standard electrolyte than for examplemetal halides or tetraalkylammonium salts. It is also rat-her surprising that the water-acetonitrile mixtures, the uni-versal curves are very short as compared with otherhydrogen-bonded systems. It seems that the water-aceto-nitrile system needs to be reexamined and much better do-cumented by performing new measurements. Many elec-trolytes were already investigated in this system but moreaccurate and systematic measurements are necessary tosupplement those which often were limited to narrow con-centration regions. The same situation exists for a numberof aqueous and organic systems with nitrates.
There is not enough experimental conductivity datato examine in a detail the general behaviour of electrolytesin mixtures including one solvent together with the seriesof solvents which have similar structure. Two examplespresented here, aqueous solutions of low aliphatic alco-hols and propylene carbonate with different-type solvents,indicate that in the limited concentration regions, Λ0(x,T)depend very weakly on the type of the second componentin the mixture and even on the type of the dissolved elec-trolyte. At this point, it is not clear to what extent such be-haviour is of a general character. Nevertheless, these twoexamples support the hypothesis that influence of themixture properties on the mobility of electrolytes is lessimportant than the differences associated with the structu-re of pure solvents and the mechanism of charge transferof various ions in them. To the great extent, this fact canbe interpreted as a simple dilution effect.
7. Acknowledgments
Starting in the late seventies, I have difficulty toimagine numerous conferences, meetings, seminars, vi-sits, conversations and letters without an extraordinarycouple such as Professor Josef Barthel and his wife Mar-ga. They played personal and scientific important roles inthe life of everybody who was involved in solution chemi-stry. I am in a deep debt and in a profound appreciation oftheir friendship, kindness, help, good advice, jovial andpleasant atmosphere in personal relations and warm hos-pitality always directed toward my wife and myself. Myclose scientific collaboration with Professor Barthel wasinitiated after a short stay in Regensburg in 1990 and itcontinues today with a very fruitful investigation of elec-trical conductance of asymmetrical electrolytes in aque-ous solutions, especially of many polybasic organic acids.
Behind the subject presented in this paper – the electricalconductance in mixed solvent mixtures – stands ProfessorBarthel who rather incidentally involved me in this fieldand gave me a strong encouragement during the initial pe-riod of investigation. I am deeply grateful for that and forall that I received from him and cherish the moments thatwere spent together. As mentioned previously, anyone,students, collaborators and guest scientists, who had theprivilege to work or to meet Professor Barthel are to a va-rious degree thankful for having such an opportunity. Ho-wever, in my opinion, the personal gratitude of everyoneis only a small part comparing with what we owe to himas the entire community of solution chemists. I am in noposition and have not the possibility here to discuss thevery long, highly valued list of scientific achievements ofProfessor Barthel, I will only mention one special contri-bution which probably no other was able to donate to allof us and which influenced our work so much. This wasthe organization and a long leading of the centre of elec-trochemical studies at the Regensburg University. Therewas no other place where so many theoretical and experi-mental aspects of modern electrochemistry were investi-gated in such deep detail, where the highest standards foraccuracy in measurements were established and served asguidance for other laboratories. Professor Barthel was ab-le to lead a large group of scientists investigating so manysubjects and on such a wide scale that a “critical mass”was reached, and for many, Regensburg started to be con-sidered the “Mecca of modern electrochemistry” and Pro-fessor Barthel as the highest authority in this field ofphysical chemistry. Finally, on the occasion his 80th birth-day, I would like to wish Josef and also Marga many moreyears in good health and the continuation of their verysuccessful and productive personal and scientific activity.
8. References
1. R. M. Fuoss, F. Accascina, Electrolytic Conductance. Inters-
cience Publishers, Inc., New York, 1959.
2. R. M. Fuoss, Proc. Nat. Acad. Sci. 1959, 45, 807–813.
3. R. M. Fuoss, The Conductance of Symmetrical Electrolytes.
In Chemical Physics of Ionic Solutions. B. E.Conway, R. G.
Barradas, (Eds.) J. Wiley and Sons, New York, 1966 pp.
463–485.
4. F. Accascina, S. Schiavo, Ion-Pair Formation and Conduc-tance Behavior in Solvents of Low Dielectric Constant. In
Chemical Physics of Ionic Solutions. B. E. Conway, R. G.
Barradas, (Eds.) J. Wiley and Sons, New York, 1966 pp.
515–520.
5. J. Barthel, Angew. Chem. 1968, 7, 260–277.
6. R. L. Kay, G. P. Cunningham, D. Fennell, The Effect of Sol-vent Structure on Ionic Mobilities in Aqueous Solvent Mixtu-res. In Hydrogen-Bonded Solvent Systems. A. K. Covington,
P. Jones, (Eds.) Taylor and Francis Ltd. London, 1968 pp.
249–260.

16 Acta Chim. Slov. 2009, 56, 1–17
Apelblat: A New Look on the Representation of Electrical Conductivities in Mixed Solvents ...
7. J. Padova, Ionic Solvation in Nonaqueous and Mixed Solu-tions. In Modern Aspects of Electrochemistry, No.7. B. E.
Conway, J.O’M. Bockris, Butterworths, London, 1972 pp.1-
82.
8. R. L. Kay, IonicTransport in Water and Mixed Aqueous Sol-vents. In Water A Comprehensive Treatise. Vol. 3. F. Franks
(Ed.) Plenum Press New York, 1973 pp. 173–209.
9. Fuoss, R. M. J. Solution Chem. 1978, 7, 771–782.
10. J. Barthel, R. Wachter, H. J. Gores, Temperature Dependenceof Conductance of Electrolytes in Nonaqueous Solutions. In
Modern Aspects of Electrochemistry, No.13. B. E. Conway,
J. O’M. Bockris, Plenum Press, New York, 1979 pp.1–79.
11. J. C. Justice, Conductance of Electrolyte Solutions. In Com-
prehensive Treatise of Electrochemistry, Vol. 5. Conway, B.
E.; Bockris, J. O’M.; Yeager, E., (Eds.) Plenum Press, New
York, 1983 pp.223–337.
12. R. L. Kay, Pure Appl. Chem. 1991, 63, 1393–1399.
13. J. M. G. Barthel, H. Krienke, W. Kunz, Physical Chemistry
of Electrolyte Solutions – Modern Aspects. Springer, Darm-
stadt, 1998.
14. J. Barthel, J.; ELDAR: Electrolyte Data Base Regensburg,
Dechema, Frankfurt, 1991.
15. P. Walden, Z. Physik. Chem. 1906, 55, 207, 246.
16. R. Zwanzig, J. Chem. Phys. 1970, 52, 3625–3628.
17. J. Hubbard, L. Onsager, J. Chem. Phys. 1977, 67, 4850–
4857.
18. J. B. Hubbard, J. Chem. Phys. 1978, 68, 1649–1664.
19. S. Glasstone, K. J. Laidler, H. Eyring, The Theory of Rate
Processes. McGraw-Hill Book Company, New York, 1941.
20. A. Apelblat, J. Phys. Chem. B 2008, 112, 7032–7044.
21. R. Macías-Salinas, F. García-Sánchez, G. Eliosa-Jiménez,
Fluid Phase Equilibria 2003, 210, 319–344.
22. L. Qunfang, H. Yu-Chun, Fluid Phase Equilibria 1999, 154,
153–163.
23. B. Das, N. Saha, J. Chem. Eng. Data 2000, 45, 2–5.
24. B. Das, N. Saha, D. K. Hazra, J. Chem. Eng. Data 2000, 45,
353–357.
25. G. Petrella, A. Sacco, M. Castagnolo, Adv. Chem. Series1979, 171, 77–98.
26. M. Goffredi, T. Shedlovsky, J. Phys. Chem., 1967, 71, 2176–
2181.
27. A. Wypych-Stasiewicz, A. Szejgis, A. Chmielewska, A.
Bald, J. Mol. Liq. 2007, 130, 34–37.
28. G. Petrella, M. Castagnolo, A. Sacco, M. Petrella, J. SolutionChem., 1980, 9, 331–339.
29. A. D’Aprano, I. D. Donato, J. Chem. Soc., Faraday Trans. I
1973, 69, 1685–1693.
30. A. Chatterjee, B. Das, J. Chem. Eng. Data 2006, 51,
1352–1355.
31. R. L. Kay, T. L. Broadwater, J. Solution Chem. 1976, 5, 57–76.
32. R. L. Kay, T. L. Broadwater, J. Phys. Chem., 1970, 74, 3802–
3812.
33. A. Arevalo, A. Vivo, M.A. Esteso, M. L. Llorente, Ann.Quim. 1977, 73, 195–199.
34. H. Piekarski, M. Tkaczyk, A. Bald, A. Szejgis, J. Mol. Liq.1997, 73/74, 209–221.
35. N. G. Foster, E. S. Amis, Z. Physik. Chem. NF 1955, 3,
365–381.
36. M. Ueno, K. Ito, N. Tsuchihashi, K. Shimizu, Bull. Chem.Soc. Jpn. 1986, 59, 1175–1180.
37. A. Apelblat, P. S. Fialho, C.A. Nieto de Castro, Fluid PhaseEquilibria 2005, 227, 215–223.
38. O. L. Hughes, H. Hartley, Phil. Mag. 1933, 15, 610–637.
39. U. N. Dash, M. R. Patnik, Fluid Phase Equilibria 1999, 157,
159–168.
40. G. J. Janz, R. P. T. Tomkins, Nonaqueous Electrolytes Hand-
book. Vol.1. Academic Press, New York, 1972.
41. D. S. Gill, B. Arora, K. C. Pathak, I. M. Joshi, M. S. Bakshi
JCS Faraday Trans. I, 992, 88 57–60.
42. S. Schiavo, B. Scrosati, Z. Physik. Chem. NF 1976, 102,
9–24.
43. G. Pistoia, G. Pecci, J. Phys. Chem., 1970, 74, 1450–1454.
44. G. Pistoia, Ric. Sci. 1968, 38, 1250–1256.
45. D. F. Evans, M. I. McElroy, J. Solution Chem. 1975, 4, 413–
430.
46. D. S. Gill, A. N. Sharma, J. Chem. Soc., Faraday Trans. I
1982, 78, 465–474.
47. M. S. K. Niazi, Bull. Chem. Soc. Jpn. 1988, 61, 2165–2170.
48. G. Pistoia, M. Polcaro, S. Schiavo, Ric. Sci. 1967, 37, 227–
233.
49. F. Accascina, G. Pistoia, S. Schiavo, Ric. Sci. 1966, 36, 560–
566.
50. G. Pistoia, M. Polcaro, S. Schiavo, Ric. Sci. 1967, 37, 300–
308.
51. G. Pistoia, M. Polcaro, S. Schiavo, Ric. Sci. 1967, 37, 309–
314.
52. K. Jerie, A. Baranowski, S. Koziol, J. Glinski, A. Burakow-
ski, Chem. Physics 2005, 309, 277–282.
53. F. Conti, G. Pistoia, J. Chem. Phys. 1968, 72, 2245–2248.
54. A. D’Aprano, M. Goffredi, R. Triolo, J. Chem. Soc., FaradayTrans. I 1976, 72, 72–84.
55. M. Coplan, R. Fuoss, J. Chem. Phys. 1964, 68, 1181–1185.
56. D. S. Gill, M. S. Chauhan, Z. Physik. Chem. NF 1984, 140,
139–148.
57. D. Singh, I. P. Aggarwal, Acad. Chim. Sci. Hung. 1972, 73,
325–333.
58. M. Goffredi, R. Triolo, J. Chem. Soc., Faraday Trans. I
1972, 68, 2324–2331.
59. D. S. Berns, R. M. Fuoss, J. Am. Chem. Soc. 1960, 82, 5585–
5588.
60. F. Accascina, S. Petrucci, R. M. Fuoss, J. Am. Chem. Soc..1959, 81, 1301–1305.
61. N. Papadopoulos, Can. J. Chem. 1986, 67, 1624–1627.
62. N. Papadopoulos, G. Ritzoulis, J. Solution Chem. 1987, 16,
31–37.
63. N. Papadopoulos, G. Ritzoulis, D. Jannakoudakis, Ann.Chim, Soc. Chim. Ital. 1986, 76, 307–314.
64. N. Papadopoulos, Electrochim. Acta 1986, 31, 181–183.
65. G. Petrella, M. Castagnolo, A. Sacco, L. Lasalandra, Z. Na-
turfors., A: Phys. Sci. 1972, 27, 1345–1349.
66. A. D’Aprano, D. Donato, Gazz. Chim. Ital. 1977, 102, 923–
928.

17Acta Chim. Slov. 2009, 56, 1–17
Apelblat: A New Look on the Representation of Electrical Conductivities in Mixed Solvents ...
67. Y. X. Yu, J. G. Liu, G. H. Gao, J. Chem. Eng. Data 2000, 45,
570–574.
68. M. Castagnolo, L. Jannelli, G. Petrella, A. Sacco, Z. Natur-
fors., A: Phys. Sci. 1971, 26, 755–759.
69. A. K. Srivastava, A. R. Desai, J. Chem. Eng. Data 1992, 37,
322–327.
70. A. D’Aprano, I. D. Donato, R. Palombo, J. Phys. Chem..1972, 76, 2923–2925.
71. A. D’Aprano, A. Capalbi, M. Battistini, J. Electroanal.Chem. 1993, 353, 121–130.
72. A. Sacco, G. Petrella, M. Castagnolo, Z. Naturfors., A: Phys.Sci. 1971, 26, 1306–1308.
73. G. Petrella, M. Castagnolo, A. Sacco, Z. Naturfors., A: Phys.Sci. 1975, 30, 533–536.
74. G. Petrella, M. Castagnolo, Z. Naturfors., A: Phys. Sci. 1973,2, 1149– 1151.
75. A. D’Aprano, D. I. Donato, A. Carrubba, J. Solution Chem.
1983, 12, 209–213.
76. J. Barthel, R. Neueder, P. Rawytsch, H. Roch, J. Electroanal.
Chem. 1999, 471, 78–87.
77. J. Barthel, R. Neueder, M. Poxleitner, J. Seitz-Beywl, L.
Werblan, J. Electroanal. Chem. 1993, 344, 249–267.
78. A. Ba¦kowska, A. Kowalska, W. Góral, L. Werblan, J. Elec-troanal. Chem. 1993, 354, 11–23.
79. G. Moumouzias, G. Ritzoulis, J. Solution Chem. 1996, 25,
1271–1280.
80. G. Moumouzias, G. Ritzoulis, J. Chem. Eng. Data 1996, 41,
326–330.
81. M. Salomon, E. J. Plichta, Electrochim. Acta, 1983, 28,
1681–1686.
82. M. Salomon, E. J. Plichta, Electrochim. Acta, 1985, 30,
113–119.
83. G. Moumouzias, G. Ritzoulis, Ber. Bunsenges. Phys. Chem.1998, 102, 786–791.
84. G. Wawrzyniak, T. Jasiñski, Polish J. Chem. 1985, 58,
1181–1187.
85. H. Roch, Dissertation, Regensburg, 1991.
PovzetekDelo obravnava vpeljavo modificiranega in prese`nega Waldenovega produkta, primerjavo z obi~ajnim Waldenovim
produktom ter podaja splo{no odvisnost molske ter ionske elektri~ne prevodnosti pri neskon~nem razred~enju razli~nih
elektrolitov v {tevilnih me{anicah topil: etanol, 2-propanol, 1,1,1,3,3,3-heksafluoro-2-propanol, N,N,-dimetilformamid,
1,4-dioksan + aceton; metanol, 1,4-dioksan, CCl4, toluen + acetonitril; voda, metanol, γ-butirolakton + tetrametilen sul-
fon; metanol, acetonitril, toluen, dimetoksimetan, dimetoksietan + propilen karbonat. Dobljena odvisnost omogo~a
oceno elektri~ne prevodnosti pri neskon~nem razred~enju, preverja zanesljivost izvedenih meritev elektri~ne prevod-
nosti ter ka`e na dejstvo, da se lastnosti elektrolitov v ~istih topilih ve~inoma ohranijo tudi v me{anicah. Izka`e se, da je
splo{no odvisnost molske oz. ionske elektri~ne prevodnosti pri neskon~nem razred~enju mo`no zapisati z enostavnimi
matemati~nimi izrazi.