
A New Approach to Measure the Wettability of Porous Media ......wettability of reservoir rocks under...
36
2 The Aramco Journal of Technology Fall 2019 The wettability — specifically the wettability of the porous structure within rocks — is one of the key parameters that determine fluid flow, which determines the potential oil producibility from reservoirs. The oil wetting preference on the pore surface of reservoir rock influences the reservoir performance in various steps of oil production, such as waterflooding and enhanced oil recovery. The surface relaxation times of nuclear magnetic resonance (NMR) are sensitive to the wettability of the pore’s surface since they are mainly determined by the strength of fluid-rock interaction. Therefore, the surface’s effective activation energy (∆E ), which is determined by the properties of fluid and pore surface, is the key parameter that determines the NMR surface relaxation times and the wettability. Since the ∆E is related to temperature by the Arrhenius laws for the correlation time, the wettability of the pore surface can be acquired from the temperature sensitivity of NMR surface relaxation times. A new wettability measurement method for reservoir rocks has been developed based on this temperature dependence of NMR relaxation time. The proposed method is also capable of measuring the wettability of porous media under any saturation level, which conventional methods cannot provide. The verification of the method has been conducted with one sandstone and four carbonate rock cores. A New Approach to Measure the Wettability of Porous Media under Different Saturation Conditions by Temperature Sensitivity of Nuclear Magnetic Resonance Relaxation Time Dr. Hyung T. Kwak, Jun Gao, and Dr. Ahmad M. Al-Harbi Abstract / Introduction The wettability measures the degree of wetting, the ability of a liquid to maintain contact with a solid surface, and is the product of a force balance between adhesive and cohesive forces. Adhesion is the tendency of liquid molecules to create an attraction to a different substance. On the other hand, cohesion causes the liquid drop to create the minimum possible surface area. Therefore, the wettability is a material parameter characteristic of reservoir rocks, and depends on factors such as surface roughness, surface area, the existence of primary adsorption sites, and specific ion effect. In other words, the wettability of reservoir rocks is one of the key parameters that determine the internal fluid flow through, which determines the potential hydrocarbon producibility from reservoirs. The oil wetting preference on the pore surface of reservoir rocks influences the reservoir performance in various steps of oil production, including waterflooding and enhanced oil recovery. This is specifically due to the dynamic nature of the pore surface wettability during the injection of various types of fluids, where monitoring the wettability at specific saturation conditions is crucial 1, 2 . Currently, however, there are no methods that can measure the wettability of reservoir rocks under different saturation states. The surface relaxation times of nuclear magnetic resonance (NMR), T 1,surface and T 2,surface , are well-known to be sensitive to the wettability of the pore surface because they are mainly determined by the strength of fluid-rock interaction 3-5 . Since NMR surface relaxation times measure the magnetic spin relaxation times of the NMR’s active nuclei, such as the protons of water and hydrocarbon, near the relaxation centers on the pore surface, it can provide the information related to the adhesion force of the wettability between fluids and rocks. For reservoir rocks, the paramagnetic ions on the pore surfaces, such as Fe 3+ and Mn 2+ , acts as a NMR relaxation center. The NMR surface relaxation time, however, can be considered only as an indicator of wettability, which can lead to the wrong information if considered as an exact measurement of the wettability. In other words, the NMR surface relaxation time is determined not only by fluid-solid adhesion force, but also by other factors such as the concentration of the paramagnetic ions on the surface of solids, which is not directly related to the wettability. The introduction of a new NMR method called NMR dispersion (NMRD) measurement by fast field cycling NMR (FFC-NMR) has provided more detailed insights of the relationship between the NMR relaxation time and the wettability 6-10 . Two surface correlation times measured by NMRD, a translational correlation time ( τ m ) and a surface residence time ( τ s ), provide information related to the fluid rock interaction 11-13 . The τ m and τ s is the time between a molecular jump among the NMR relaxation centers on the surface and between the absorption and desorption of a molecule, respectively. These correlation times at certain temperatures can be calculated
Transcript of A New Approach to Measure the Wettability of Porous Media ......wettability of reservoir rocks under...

2 The Aramco Journal of Technology Fall 2019
The wettability — specifically the wettability of the porous structure within rocks — is one of the key parameters that determine fluid flow, which determines the potential oil producibility from reservoirs. The oil wetting preference on the pore surface of reservoir rock influences the reservoir performance in various steps of oil production, such as waterflooding and enhanced oil recovery.
The surface relaxation times of nuclear magnetic resonance (NMR) are sensitive to the wettability of the pore’s surface since they are mainly determined by the strength of fluid-rock interaction. Therefore, the surface’s effective activation energy (∆E), which is determined by the properties of fluid and pore surface, is the key parameter that determines the NMR surface relaxation times and the wettability. Since the ∆E is related to temperature by the Arrhenius laws for the correlation time, the wettability of the pore surface can be acquired from the temperature sensitivity of NMR surface relaxation times.
A new wettability measurement method for reservoir rocks has been developed based on this temperature dependence of NMR relaxation time. The proposed method is also capable of measuring the wettability of porous media under any saturation level, which conventional methods cannot provide. The verification of the method has been conducted with one sandstone and four carbonate rock cores.
A New Approach to Measure the Wettability of Porous Media under Different Saturation Conditions by Temperature Sensitivity of Nuclear Magnetic Resonance Relaxation TimeDr. Hyung T. Kwak, Jun Gao, and Dr. Ahmad M. Al-Harbi
Abstract /
IntroductionThe wettability measures the degree of wetting, the ability of a liquid to maintain contact with a solid surface, and is the product of a force balance between adhesive and cohesive forces. Adhesion is the tendency of liquid molecules to create an attraction to a different substance. On the other hand, cohesion causes the liquid drop to create the minimum possible surface area. Therefore, the wettability is a material parameter characteristic of reservoir rocks, and depends on factors such as surface roughness, surface area, the existence of primary adsorption sites, and specific ion effect. In other words, the wettability of reservoir rocks is one of the key parameters that determine the internal fluid flow through, which determines the potential hydrocarbon producibility from reservoirs.
The oil wetting preference on the pore surface of reservoir rocks influences the reservoir performance in various steps of oil production, including waterflooding and enhanced oil recovery. This is specifically due to the dynamic nature of the pore surface wettability during the injection of various types of fluids, where monitoring the wettability at specific saturation conditions is crucial1, 2. Currently, however, there are no methods that can measure the wettability of reservoir rocks under different saturation states.
The surface relaxation times of nuclear magnetic resonance (NMR), T1,surface and T2,surface, are well-known to be sensitive to the wettability of the pore surface because they are mainly determined by the strength of fluid-rock interaction3-5. Since NMR surface relaxation times measure the magnetic spin relaxation times of the NMR’s active nuclei, such as the protons of water and hydrocarbon, near the relaxation centers on the pore surface, it can provide the information related to the adhesion force of the wettability between fluids and rocks. For reservoir rocks, the paramagnetic ions on the pore surfaces, such as Fe3+ and Mn2+, acts as a NMR relaxation center. The NMR surface relaxation time, however, can be considered only as an indicator of wettability, which can lead to the wrong information if considered as an exact measurement of the wettability. In other words, the NMR surface relaxation time is determined not only by fluid-solid adhesion force, but also by other factors such as the concentration of the paramagnetic ions on the surface of solids, which is not directly related to the wettability.
The introduction of a new NMR method called NMR dispersion (NMRD) measurement by fast field cycling NMR (FFC-NMR) has provided more detailed insights of the relationship between the NMR relaxation time and the wettability6-10. Two surface correlation times measured by NMRD, a translational correlation time (τm) and a surface residence time (τs), provide information related to the fluid rock interaction11-13. The τm and τs is the time between a molecular jump among the NMR relaxation centers on the surface and between the absorption and desorption of a molecule, respectively. These correlation times at certain temperatures can be calculated
3 The Aramco Journal of TechnologyFall 2019
from the Arrhenius laws for the correlation times12, 14:
Saudi Aramco: Company General Use
𝜏𝜏"(𝑇𝑇) = 𝜏𝜏"'exp ,
-./-012
3 = 𝜏𝜏"'exp ,∆-123 (1)
𝜏𝜏5(𝑇𝑇) = 𝜏𝜏5'exp ,
-0123 (2)
tm ts tmo tso DE
𝑇𝑇6,589:;<=; = 𝑇𝑇6,589:;<=> 𝑒𝑒𝑒𝑒𝑒𝑒 B− ∆-1, D2E− D
2F3G (3)
𝑇𝑇6,589:;<=; 𝑇𝑇6,589:;<=>
D2H,0IJKELM,NO
= D2H,EPP.NO
− D2H,FIRS
(4)
1
Saudi Aramco: Company General Use
𝜏𝜏"(𝑇𝑇) = 𝜏𝜏"'exp ,
-./-012
3 = 𝜏𝜏"'exp ,∆-123 (1)
𝜏𝜏5(𝑇𝑇) = 𝜏𝜏5'exp ,
-0123 (2)
tm ts tmo tso DE
𝑇𝑇6,589:;<=; = 𝑇𝑇6,589:;<=> 𝑒𝑒𝑒𝑒𝑒𝑒 B− ∆-1, D2E− D
2F3G (3)
𝑇𝑇6,589:;<=; 𝑇𝑇6,589:;<=>
D2H,0IJKELM,NO
= D2H,EPP.NO
− D2H,FIRS
(4)
2
where τm(T) and τs(T) are the translation correlation time and surface residence time at temperature, T, respectively. Both τmo and τso are those at the standard condition. The Em and Es are the activation energy for liquid molecular translational diffusion and for potential binding between liquid molecules and the solid surface, respectively. R is the gas constant. The Em – Es in Eqn. 1 is an apparent activation energy of liquid molecules on the solid surface, which can be expressed as ∆E. If we look more closely, we can see the τs that liquid molecules reside before leaving the solid surface by desorption, is more related to the adhesion force of wettability compared to the τm.
The latter is more related to the total number of magnetic relaxation centers on the solid surface and the diffusion between them, which is somewhat related to the adhesion force of wettability, but to a lesser degree than τs. Therefore, the wettability can be measured by monitoring the surface activation energy changes, ∆E, from two surface correlation times measured by NMRD14. The FFC-NMR technology, however, is not always available compared to the low-field NMR one, which became one of the main technologies for special core analysis. Therefore, in the current study, we focused on the potential of wettability measurement by low-field NMR technology.
The ∆E can be also measured by the NMR surface relaxation time at different temperatures from low-field NMR14,
Saudi Aramco: Company General Use
𝜏𝜏"(𝑇𝑇) = 𝜏𝜏"'exp ,
-./-012
3 = 𝜏𝜏"'exp ,∆-123 (1)
𝜏𝜏5(𝑇𝑇) = 𝜏𝜏5'exp ,
-0123 (2)
tm ts tmo tso DE
𝑇𝑇6,589:;<=; = 𝑇𝑇6,589:;<=> 𝑒𝑒𝑒𝑒𝑒𝑒 B− ∆-1, D2E− D
2F3G (3)
𝑇𝑇6,589:;<=; 𝑇𝑇6,589:;<=>
D2H,0IJKELM,NO
= D2H,EPP.NO
− D2H,FIRS
(4)
3
where
Saudi Aramco: Company General Use
𝜏𝜏"(𝑇𝑇) = 𝜏𝜏"'exp ,
-./-012
3 = 𝜏𝜏"'exp ,∆-123 (1)
𝜏𝜏5(𝑇𝑇) = 𝜏𝜏5'exp ,
-0123 (2)
tm ts tmo tso DE
𝑇𝑇6,589:;<=; = 𝑇𝑇6,589:;<=> 𝑒𝑒𝑒𝑒𝑒𝑒 B− ∆-1, D2E− D
2F3G (3)
𝑇𝑇6,589:;<=; 𝑇𝑇6,589:;<=>
D2H,0IJKELM,NO
= D2H,EPP.NO
− D2H,FIRS
(4)
and
Saudi Aramco: Company General Use
𝜏𝜏"(𝑇𝑇) = 𝜏𝜏"'exp ,
-./-012
3 = 𝜏𝜏"'exp ,∆-123 (1)
𝜏𝜏5(𝑇𝑇) = 𝜏𝜏5'exp ,
-0123 (2)
tm ts tmo tso DE
𝑇𝑇6,589:;<=; = 𝑇𝑇6,589:;<=> 𝑒𝑒𝑒𝑒𝑒𝑒 B− ∆-1, D2E− D
2F3G (3)
𝑇𝑇6,589:;<=; 𝑇𝑇6,589:;<=>
D2H,0IJKELM,NO
= D2H,EPP.NO
− D2H,FIRS
(4)
are the NMR T2 surface relaxation time at temperature a and b, respectively. Ta and Tb are the temperature a and b, respectively. ∆E is the surface activation energy and R is the gas constant. The ∆Es in Eqns. 1 and 3 are the same and can be acquired by
either FFC-NMR or low-field NMR. This relationship is exactly identical to the NMR T1 relaxation time.
For the current study, the T2 relaxation time has been selected since it is more robust and quick compared to the T1 relaxation time measurement. The ∆E can be derived by measuring NMR T2 relaxation times at the two different temperatures by using Eqn. 3. When the adhesion force between the liquid molecules and the solid surface is increased, ∆E is decreased owing to the increase of Es, the energy of potential binding between the liquid molecules and the solid surface. In other words, when the wettability of a specific liquid on a specific solid surface is increased by increasing temperatures, ∆E will be decreased.
Therefore, this property can be used to develop the wettability measurement method at various saturation levels. To be more specific, the wettability alteration in the process of flooding by any types of fluids can be monitored by the method proposed by the current work. In the field of reservoir engineering, the wettability is one of the key parameters that affect fluid flow through reservoir rocks, which makes it a very important property in producing hydrocarbon throughout the lifetime of the reservoir15-18.
ExperimentSample
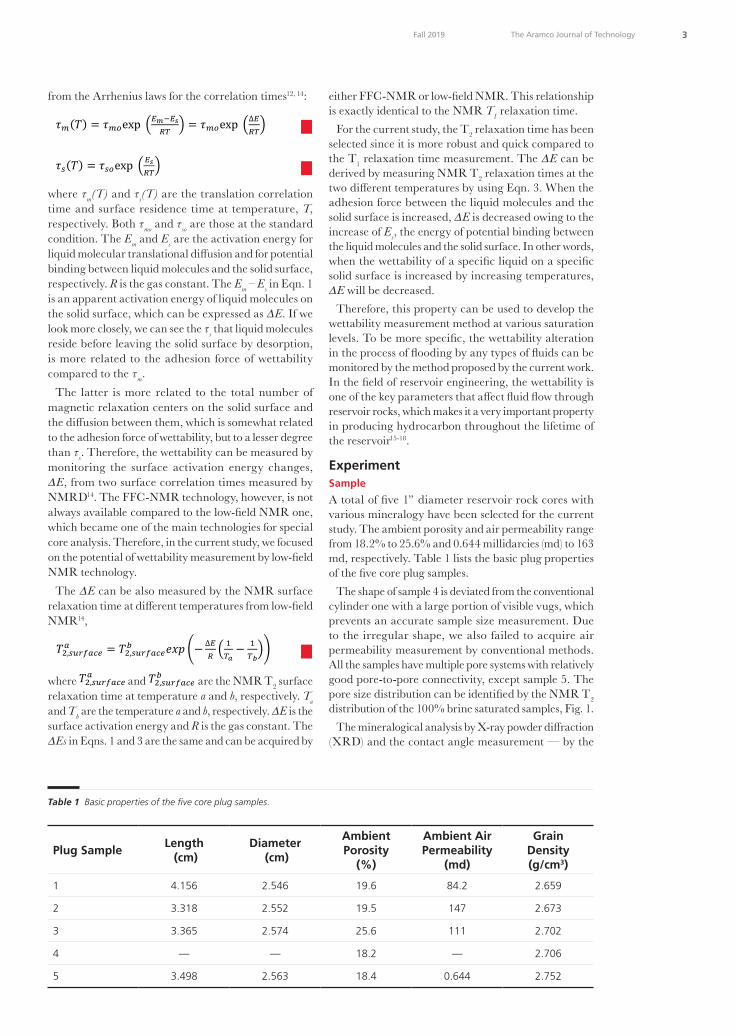
A total of five 1” diameter reservoir rock cores with various mineralogy have been selected for the current study. The ambient porosity and air permeability range from 18.2% to 25.6% and 0.644 millidarcies (md) to 163 md, respectively. Table 1 lists the basic plug properties of the five core plug samples.
The shape of sample 4 is deviated from the conventional cylinder one with a large portion of visible vugs, which prevents an accurate sample size measurement. Due to the irregular shape, we also failed to acquire air permeability measurement by conventional methods. All the samples have multiple pore systems with relatively good pore-to-pore connectivity, except sample 5. The pore size distribution can be identified by the NMR T2 distribution of the 100% brine saturated samples, Fig. 1.
The mineralogical analysis by X-ray powder diffraction (XRD) and the contact angle measurement — by the
Plug SampleLength (cm)
Diameter (cm)
Ambient Porosity
(%)
Ambient Air Permeability
(md)
Grain Density (g/cm3)
1 4.156 2.546 19.6 84.2 2.659
2 3.318 2.552 19.5 147 2.673
3 3.365 2.574 25.6 111 2.702
4 — — 18.2 — 2.706
5 3.498 2.563 18.4 0.644 2.752
Table 1 Basic properties of the five core plug samples.

4 The Aramco Journal of Technology Fall 2019
pendant drop method — were conducted at the end of the designed experimental workflow, Table 2. The contact angles of all samples are in the range between 26.1° and 36.6°, which are water-wet by the properties of the pore surface minerals. Based on the mineralogy analysis by XRD, samples 2, 3, and 4 consisted of only calcite (CaCO3), whereas sample 1 is comprised of only quartz (SiO2). Finally, sample 5 is composed of mainly calcite with an appreciable amount of dolomite (CaMg(CO3)2), anhydrite (CaSO4), and quartz.
Dead crude oil collected from a Middle Eastern carbonate reservoir and heavy water (D2O) with 99.75% purity purchased from ACROS Organics has been used for the current study. The oil was filtrated through a 5 µm filter for test use. At room temperature, the density and viscosity were 0.8663 g/cm3 and 12.0 centipoise, respectively.
Hardware
The NMR systems used for the current study are the Oxford GeoSpec2 12 MHz with 3D electromagnetic gradient coils. Both 53 mm diameter normal ambient
and high-pressure, high temperature (HPHT) NMR probes have been used. The HPHT probe was used for the T2 measurement at two different temperatures, 35 °C and 90 °C.
Experimental Methods and Procedures
Figure 2 describes the experimental workflow of the current study. The NMR T2 relaxation times for all the samples, including the fluids in the bulk and rock cores, are measured by Carr-Purcell-Meiboom-Gill pulse sequence. Since the NMR T2 relaxation time distributions of water and crude oil we used are not well resolved within the rock samples, D2O instead of H2O has been used for the current study. In this way, we can monitor the alteration of the T2 relaxation time of crude oil only for monitoring the wettability. The characteristics of D2O, chemically equivalent with H2O but invisible in 1H NMR, make it a common brine replacement for fluid typing methods in laboratory NMR. This eventually enhances the contrast between oil and brine19, 20.
Except for the T2 measurement in step 5, all NMR measurements were conducted at two different
Saudi Aramco: Company General Use
Plug Sample
Length (cm)
Diameter (cm)
Ambient Porosity (%)
Ambient Air Permeability (mD)
Grain Density (g/cm3)
1 4.156 2.546 19.6 84.2 2.659 2 3.318 2.552 19.5 147 2.673 3 3.365 2.574 25.6 111 2.702 4 — — 18.2 — 2.706 5 3.498 2.563 18.4 0.644 2.752
Table 1 Basic properties of the five core plug samples.
Fig. 1 The T2 distribution of the 100% brine saturated samples selected for the current study.
Plug Sample
Contact Angle XRD CaCO3 SiO2 CaMg(CO3)2 CaSO4
1 31.5° ± 0.5 — 100 — — 2 26.5° ± 2.3 100 — — — 3 26.1° ± 0.2 100 — — — 4 36.6° ± 0.01 100 — — — 5 33.3° ± 0.03 70.9 0.3 23.4 5.4
Table 2 The contact angles and mineralogy of the five core plug samples.
0.00.10.20.30.40.50.60.70.80.91.0
0.01 0.1 1 10 100 1000 10000
Poro
sity
(p.u
.)
T2 (msec)1 2 3 4 5
Fig. 1 The T2 distribution of the 100% brine saturated samples selected for the current study.
Plug Sample Contact AngleXRD
CaCO3 SiO2 CaMg(CO3)2 CaSO4
1 31.5° ± 0.5 — 100 — —
2 26.5° ± 2.3 100 — — —
3 26.1° ± 0.2 100 — — —
4 36.6° ± 0.01 100 — — —
5 33.3° ± 0.03 70.9 0.3 23.4 5.4
Table 2 The contact angles and mineralogy of the five core plug samples.
5 The Aramco Journal of TechnologyFall 2019
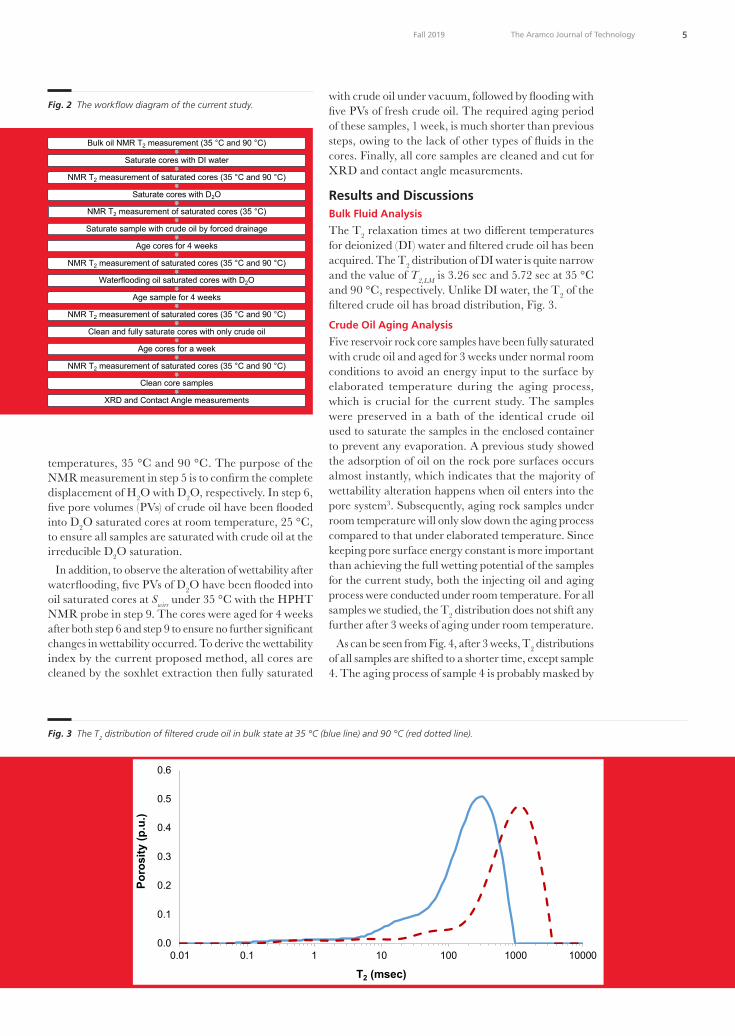
temperatures, 35 °C and 90 °C. The purpose of the NMR measurement in step 5 is to confirm the complete displacement of H2O with D2O, respectively. In step 6, five pore volumes (PVs) of crude oil have been flooded into D2O saturated cores at room temperature, 25 °C, to ensure all samples are saturated with crude oil at the irreducible D2O saturation.
In addition, to observe the alteration of wettability after waterflooding, five PVs of D2O have been flooded into oil saturated cores at Swirr under 35 °C with the HPHT NMR probe in step 9. The cores were aged for 4 weeks after both step 6 and step 9 to ensure no further significant changes in wettability occurred. To derive the wettability index by the current proposed method, all cores are cleaned by the soxhlet extraction then fully saturated
with crude oil under vacuum, followed by flooding with five PVs of fresh crude oil. The required aging period of these samples, 1 week, is much shorter than previous steps, owing to the lack of other types of fluids in the cores. Finally, all core samples are cleaned and cut for XRD and contact angle measurements.
Results and DiscussionsBulk Fluid Analysis
The T2 relaxation times at two different temperatures for deionized (DI) water and filtered crude oil has been acquired. The T2 distribution of DI water is quite narrow and the value of T2,LM is 3.26 sec and 5.72 sec at 35 °C and 90 °C, respectively. Unlike DI water, the T2 of the filtered crude oil has broad distribution, Fig. 3.
Crude Oil Aging Analysis
Five reservoir rock core samples have been fully saturated with crude oil and aged for 3 weeks under normal room conditions to avoid an energy input to the surface by elaborated temperature during the aging process, which is crucial for the current study. The samples were preserved in a bath of the identical crude oil used to saturate the samples in the enclosed container to prevent any evaporation. A previous study showed the adsorption of oil on the rock pore surfaces occurs almost instantly, which indicates that the majority of wettability alteration happens when oil enters into the pore system3. Subsequently, aging rock samples under room temperature will only slow down the aging process compared to that under elaborated temperature. Since keeping pore surface energy constant is more important than achieving the full wetting potential of the samples for the current study, both the injecting oil and aging process were conducted under room temperature. For all samples we studied, the T2 distribution does not shift any further after 3 weeks of aging under room temperature.
As can be seen from Fig. 4, after 3 weeks, T2 distributions of all samples are shifted to a shorter time, except sample 4. The aging process of sample 4 is probably masked by
Saudi Aramco: Company General Use
Fig. 2 The workflow diagram of the current study.
Fig. 3 The T2 distribution of filtered crude oil in bulk state at 35 °C (blue line) and 90 °C (red dotted line).
Bulk oil NMR T2 measurement (35 °C and 90 °C)
Saturate cores with DI water
NMR T2 measurement of saturated cores (35 °C and 90 °C)
Saturate cores with D2O
NMR T2 measurement of saturated cores (35 °C)
Saturate sample with crude oil by forced drainage
Age cores for 4 weeks
NMR T2 measurement of saturated cores (35 °C and 90 °C)
Waterflooding oil saturated cores with D2O
Age sample for 4 weeks
NMR T2 measurement of saturated cores (35 °C and 90 °C)
Clean and fully saturate cores with only crude oil
Age cores for a week
NMR T2 measurement of saturated cores (35 °C and 90 °C)
Clean core samples
XRD and Contact Angle measurements
0.0
0.1
0.2
0.3
0.4
0.5
0.6
0.01 0.1 1 10 100 1000 10000
Poro
sity
(p.u
.)
T2 (msec)
Fig. 2 The workflow diagram of the current study.
Fig. 3 The T2 distribution of filtered crude oil in bulk state at 35 °C (blue line) and 90 °C (red dotted line).
Saudi Aramco: Company General Use
Fig. 2 The workflow diagram of the current study.
Fig. 3 The T2 distribution of filtered crude oil in bulk state at 35 °C (blue line) and 90 °C (red dotted line).
Bulk oil NMR T2 measurement (35 °C and 90 °C)
Saturate cores with DI water
NMR T2 measurement of saturated cores (35 °C and 90 °C)
Saturate cores with D2O
NMR T2 measurement of saturated cores (35 °C)
Saturate sample with crude oil by forced drainage
Age cores for 4 weeks
NMR T2 measurement of saturated cores (35 °C and 90 °C)
Waterflooding oil saturated cores with D2O
Age sample for 4 weeks
NMR T2 measurement of saturated cores (35 °C and 90 °C)
Clean and fully saturate cores with only crude oil
Age cores for a week
NMR T2 measurement of saturated cores (35 °C and 90 °C)
Clean core samples
XRD and Contact Angle measurements
0.0
0.1
0.2
0.3
0.4
0.5
0.6
0.01 0.1 1 10 100 1000 10000
Poro
sity
(p.u
.)
T2 (msec)

6 The Aramco Journal of Technology Fall 2019
the NMR T2 relaxation time distribution from vugs, which is a major pore type of this sample. The small degree of porosity increases for all of the samples after aging are mainly caused by a further introduction of crude oil in the preserved container into the samples.
Figures 5a and 5b are the plot of the aging time vs. the apparent T2,LM (T2,app,LM) and the surface T2,LM (T2,surface,LM), respectively. T2,surface,LM can be derived11 by:
Saudi Aramco: Company General Use
𝜏𝜏"(𝑇𝑇) = 𝜏𝜏"'exp ,
-./-012
3 = 𝜏𝜏"'exp ,∆-123 (1)
𝜏𝜏5(𝑇𝑇) = 𝜏𝜏5'exp ,
-0123 (2)
tm ts tmo tso DE
𝑇𝑇6,589:;<=; = 𝑇𝑇6,589:;<=> 𝑒𝑒𝑒𝑒𝑒𝑒 B− ∆-1, D2E− D
2F3G (3)
𝑇𝑇6,589:;<=; 𝑇𝑇6,589:;<=>
D2H,0IJKELM,NO
= D2H,EPP.NO
− D2H,FIRS
(4)
4
where T2,surface,LM is the logarithmic mean of the NMR T2 surface relaxation time, T2,app,LM is that of NMR T2 apparent relaxation time, and T2,bulk is that of the NMR T2 bulk relaxation time. Since the T2 surface relaxation time (T2,surface) is a more direct indication of wettability alteration than the T2 apparent relaxation time (T2,app) with the contribution from the T2 bulk relaxation time (T2,bulk), it is used to analyze the tendency of pore surface wetting during the aging period, Fig. 5b. Table 3 shows the percentage of change before and after 3 weeks of aging, where the T2,surface,LM of sample 3 shifted the most followed by sample 5, sample 2, sample 1, and sample 4.
Again, it is hard to accurately assess the aging process of sample 4 due to the masking effect of the NMR bulk relaxation time of oil in vugs, which occupies ~70% of the total porosity.
Saudi Aramco: Company General Use
00.10.20.30.40.50.60.70.80.9
0.01 1 100 10000
T2 (msec)
00.10.20.30.40.50.60.70.80.9
0.01 1 100 10000T2 (msec)
00.10.20.30.40.50.60.70.80.9
0.01 1 100 10000T2 (msec)
(a)
(b)
(c)
Fig. 4 T2 distribution of before (---) and after (-) aging for 3 weeks for five selected reservoir rock core samples. Here, (a), (b), (c), (d), and (e) represents the T2 distribution of samples 1, 2, 3, 4, and 5, respectively.
Saudi Aramco: Company General Use
Fig. 4 T2 distribution of before (---) and after (-) aging for 3 weeks for five selected reservoir rock core samples. Here, (a), (b), (c), (d), and (e) represents the T2 distribution of samples 1, 2, 3, 4, and 5, respectively.
00.10.20.30.40.50.60.70.80.9
0.01 1 100 10000T2 (msec)
00.10.20.30.40.50.60.70.80.9
0.01 1 100 10000T2 (msec)
(d)
(e)
Saudi Aramco: Company General Use
Fig. 5 The plots of (a) the T2,app,LM vs. aging time, and (b) the T2,surface,LM vs. aging time. Note the y-axis of plot (a) is linear and plot (b) is logarithmic, respectively. The symbols indicate each sample: blue circle (sample 1), red square (sample 2), green rhombus (sample 3), purple star (sample 4), and light-blue triangle (sample 5).
Plug Sample
T2,app,LM Shift (%)
T2,surface,LM Shift (%)
T2,app,LM Shift in Log Scale (%)
T2,surface,LM Shift in Log Scale (%)
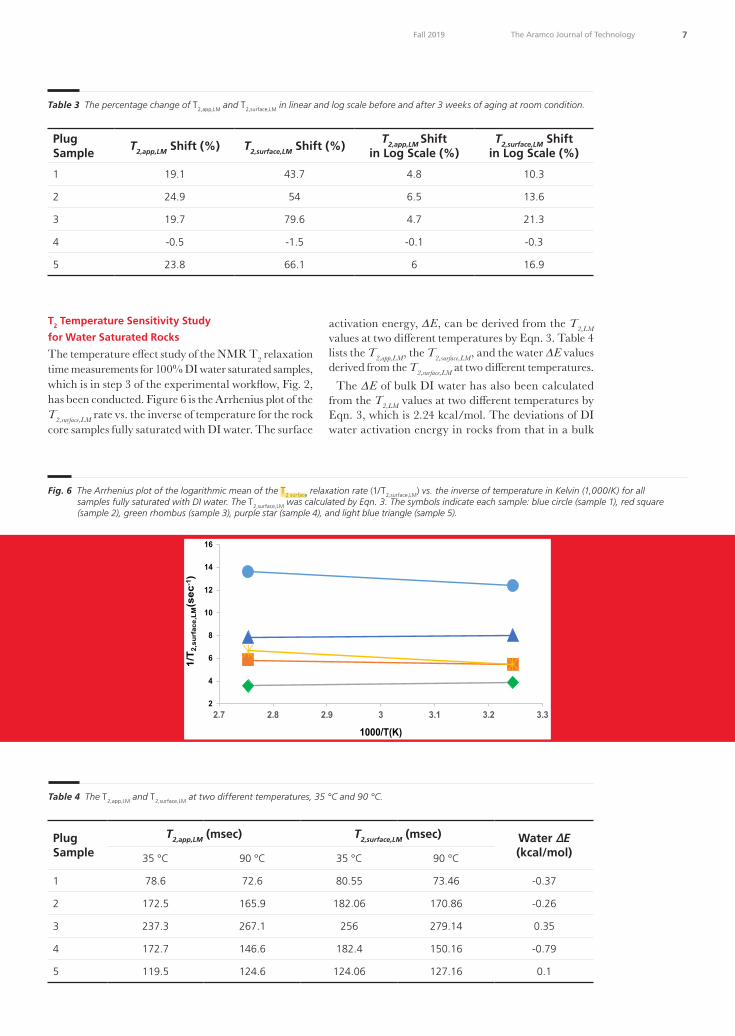
1 19.1 43.7 4.8 10.3 2 24.9 54 6.5 13.6 3 19.7 79.6 4.7 21.3 4 -0.5 -1.5 -0.1 -0.3 5 23.8 66.1 6 16.9
Table 3 The percentage change of T2,app,LM and T2,surface,LM in linear and log scale before and after 3 weeks of aging at room condition.
6065707580859095
100105110
0 1 2 3
T 2,a
pp,L
M(m
sec)
Aging Time (weeks)(a)
100
1000
0 1 2 3
T 2,s
urfa
ce,L
M(m
sec)
Aging Time (weeks)(b)
Fig. 5 The plots of (a) the T2,app,LM vs. aging time, and (b) the T2,surface,LM vs. aging time. Note the y-axis of plot (a) is linear and plot (b) is logarithmic, respectively. The symbols indicate each sample: blue circle (sample 1), red square (sample 2), green rhombus (sample 3), purple star (sample 4), and light-blue triangle (sample 5).
7 The Aramco Journal of TechnologyFall 2019
T2 Temperature Sensitivity Study
for Water Saturated Rocks
The temperature effect study of the NMR T2 relaxation time measurements for 100% DI water saturated samples, which is in step 3 of the experimental workflow, Fig. 2, has been conducted. Figure 6 is the Arrhenius plot of the T2,surface,LM rate vs. the inverse of temperature for the rock core samples fully saturated with DI water. The surface
activation energy, ∆E, can be derived from the T2,LM values at two different temperatures by Eqn. 3. Table 4 lists the T2,app,LM, the T2,surface,LM, and the water ∆E values derived from the T2,surface,LM at two different temperatures.
The ∆E of bulk DI water has also been calculated from the T2,LM values at two different temperatures by Eqn. 3, which is 2.24 kcal/mol. The deviations of DI water activation energy in rocks from that in a bulk
Plug Sample
T2,app,LM Shift (%) T2,surface,LM Shift (%)T2,app,LM Shift
in Log Scale (%)T2,surface,LM Shift
in Log Scale (%)
1 19.1 43.7 4.8 10.3
2 24.9 54 6.5 13.6
3 19.7 79.6 4.7 21.3
4 -0.5 -1.5 -0.1 -0.3
5 23.8 66.1 6 16.9
Table 3 The percentage change of T2,app,LM and T2,surface,LM in linear and log scale before and after 3 weeks of aging at room condition.
Plug Sample
T2,app,LM (msec) T2,surface,LM (msec) Water ∆E (kcal/mol)35 °C 90 °C 35 °C 90 °C
1 78.6 72.6 80.55 73.46 -0.37
2 172.5 165.9 182.06 170.86 -0.26
3 237.3 267.1 256 279.14 0.35
4 172.7 146.6 182.4 150.16 -0.79
5 119.5 124.6 124.06 127.16 0.1
Table 4 The T2,app,LM and T2,surface,LM at two different temperatures, 35 °C and 90 °C.
Saudi Aramco: Company General Use
Fig. 6 The Arrhenius plot of the logarithmic mean of the T2 surface relaxation rate (1/T2,surface,LM) vs. the inverse of temperature in Kelvin (1,000/K) for all samples fully saturated with DI water. The T2,surface,LM was calculated by Eqn. 3. The symbols indicate each sample: blue circle (sample 1), red square (sample 2), green rhombus (sample 3), purple star (sample 4), and light blue triangle (sample 5).
Plug Sample
T2,app,LM (msec) T2,surface,LM (msec) Water DE (kcal/mol) 35 °C 90 °C 35 °C 90 °C
1 78.6 72.6 80.55 73.46 -0.37 2 172.5 165.9 182.06 170.86 -0.26 3 237.3 267.1 256 279.14 0.35 4 172.7 146.6 182.4 150.16 -0.79 5 119.5 124.6 124.06 127.16 0.1
Table 4 The T2,app,LM and T2,surface,LM at two different temperatures, 35 °C and 90 °C.
2
4
6
8
10
12
14
16
2.7 2.8 2.9 3 3.1 3.2 3.3
1/T 2
,sur
face
,LM
(sec
-1)
1000/T(K)
Fig. 6 The Arrhenius plot of the logarithmic mean of the T2 surface relaxation rate (1/T2,surface,LM) vs. the inverse of temperature in Kelvin (1,000/K) for all samples fully saturated with DI water. The T2,surface,LM was calculated by Eqn. 3. The symbols indicate each sample: blue circle (sample 1), red square (sample 2), green rhombus (sample 3), purple star (sample 4), and light blue triangle (sample 5).
bradwe0a
Highlight

8 The Aramco Journal of Technology Fall 2019
state indicate the contact of water with the pore surface for all samples. The ∆E values of samples 1, 2, and 4 are negative, which indicates that the water surface affinity of these samples are relatively strong. On the other hand, those of samples 3 and 5 are positive, which indicate the weaker water surface affinity compared to samples 1, 2, and 4. These observations from the ∆E values driven from the NMR T2 relaxation time at two different temperatures only agree with a few samples — samples 1, 2, and 4. Therefore, the actual wettability of the pore’s surface from reservoir rocks could be varied considerably from the contact angle values for the rock with a clean and smooth outer surface.
T2 Temperature Sensitivity Study
for 100% Oil Saturated Rocks
The temperature effect study of the NMR T2 relaxation time for 100% saturated crude oil, which is in steps 12 to 14 of the experimental workflow, Fig. 2, have been conducted. Figure 7 is the Arrhenius plot of the T2,surface,LM rate vs. the inverse of temperature for the rock core samples fully saturated with crude oil. As in the 100% water saturated study, the activation energy, ∆E, can be derived from T2,LM at two different temperatures by
Eqn. 3. Table 5 lists the T2,app,LM, the T2,surface,LM, and the oil ∆E values derived from T2,surface,LM at two different temperatures.
The activation energy of bulk oil also has been calculated from the T2,LM values at two different temperatures by Eqn. 3, which is 5.59 kcal/mol. As in the case of DI water, the deviations of crude oil activation energy in rocks from that in a bulk state indicate the contact of oil with the pore surface for all samples. It is quite obvious that the T2,surface of sample 2 is the most sensitive to temperature changes. Compared to other samples, the oil surface affinity of sample 2 is the weakest since the surface activation energy of oil is the largest.
In the next section, we investigated how this oil wetness measurement from the surface activation energy of oil from the 100% oil saturated sample affects the wettability of each sample.
T2 Temperature Sensitivity Study for Rocks Saturated
with Oil at Swirr Pre- and Post-Waterflooding
The temperature effect study of the NMR T2 relaxation time for samples saturated with crude oil at Swirr with D2O pre- and post-waterflooding, which is in steps 6
Plug Sample
T2,app,LM (msec) T2,surface,LM (msec) Water ∆E (kcal/mol)35 °C 90 °C 35 °C 90 °C
1 70.6 125.7 142.11 164.2 0.58
2 43.3 142.8 63.9 194.7 4.5
3 91.4 205.3 262.24 332.71 0.96
4 65 128.8 121.11 169.53 1.36
5 91.9 182.38 265.56 276.42 0.16
Table 5 The T2,app,LM and T2,surface,LM at two different temperatures, 35 °C and 90 °C.
Saudi Aramco: Company General Use
Fig. 7 The Arrhenius plot of the logarithmic mean of the T2 surface relaxation rate (1/T2,surface,LM) vs. the inverse of temperature in Kelvin (1,000/K) for all samples fully saturated with crude oil. The T2,surface,LM was calculated by Eqn. 3. The symbols indicate each sample: blue circle (sample 1), red square (sample 2), green rhombus (sample 3), purple star (sample 4), and light blue triangle (sample 5).
Plug Sample
T2,app,LM (msec) T2,surface,LM (msec) Oil DE (kcal/mol) 35 °C 90 °C 35 °C 90 °C
1 70.6 125.7 142.11 164.2 0.58 2 43.3 142.8 63.9 194.7 4.5 3 91.4 205.3 262.24 332.71 0.96 4 65 128.8 121.11 169.53 1.36 5 91.9 182.38 265.56 276.42 0.16
Table 5 The T2,app,LM and T2,surface,LM at two different temperatures, 35 °C and 90 °C.
2
4
6
8
10
12
14
16
2.7 2.8 2.9 3 3.1 3.2 3.3
1/T 2
,sur
face
,LM
(sec
-1)
1000/T(K)
Fig. 7 The Arrhenius plot of the logarithmic mean of the T2 surface relaxation rate (1/T2,surface,LM ) vs. the inverse of temperature in Kelvin (1,000/K) for all samples fully saturated with crude oil. The T2,surface,LM was calculated by Eqn. 3. The symbols indicate each sample: blue circle (sample 1), red square (sample 2), green rhombus (sample 3), purple star (sample 4), and light blue triangle (sample 5).
bradwe0a
Highlight
9 The Aramco Journal of TechnologyFall 2019
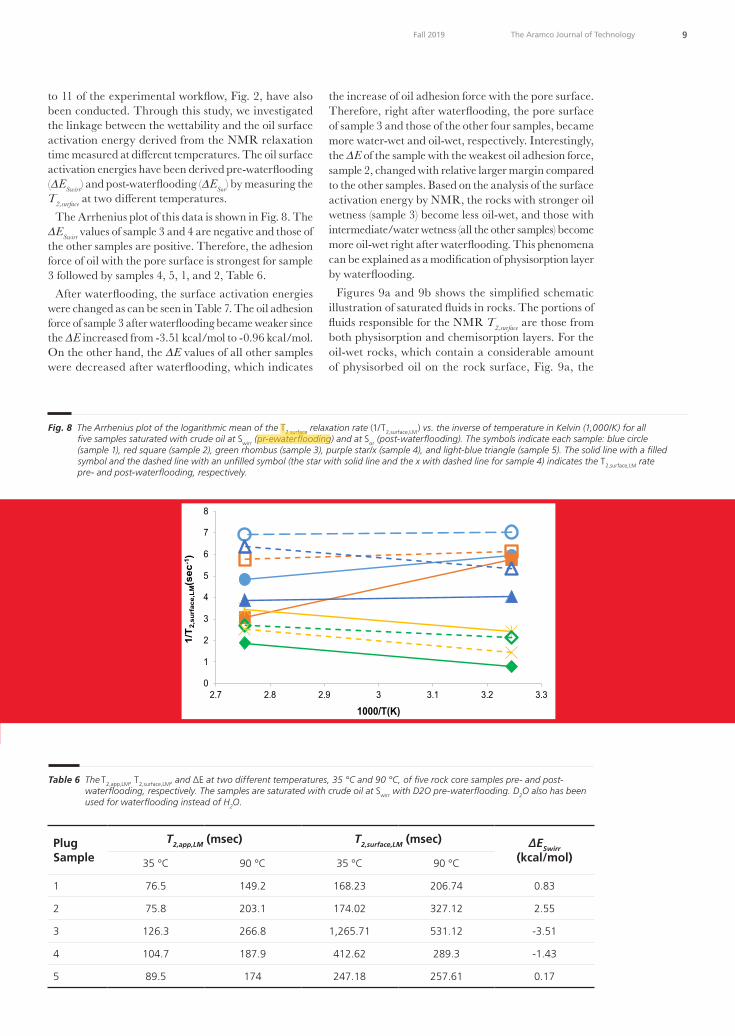
to 11 of the experimental workflow, Fig. 2, have also been conducted. Through this study, we investigated the linkage between the wettability and the oil surface activation energy derived from the NMR relaxation time measured at different temperatures. The oil surface activation energies have been derived pre-waterflooding (∆ESwirr) and post-waterflooding (∆ESor) by measuring the T2,surface at two different temperatures.
The Arrhenius plot of this data is shown in Fig. 8. The ∆ESwirr values of sample 3 and 4 are negative and those of the other samples are positive. Therefore, the adhesion force of oil with the pore surface is strongest for sample 3 followed by samples 4, 5, 1, and 2, Table 6.
After waterflooding, the surface activation energies were changed as can be seen in Table 7. The oil adhesion force of sample 3 after waterflooding became weaker since the ∆E increased from -3.51 kcal/mol to -0.96 kcal/mol. On the other hand, the ∆E values of all other samples were decreased after waterflooding, which indicates
the increase of oil adhesion force with the pore surface. Therefore, right after waterflooding, the pore surface of sample 3 and those of the other four samples, became more water-wet and oil-wet, respectively. Interestingly, the ∆E of the sample with the weakest oil adhesion force, sample 2, changed with relative larger margin compared to the other samples. Based on the analysis of the surface activation energy by NMR, the rocks with stronger oil wetness (sample 3) become less oil-wet, and those with intermediate/water wetness (all the other samples) become more oil-wet right after waterflooding. This phenomena can be explained as a modification of physisorption layer by waterflooding.
Figures 9a and 9b shows the simplified schematic illustration of saturated fluids in rocks. The portions of fluids responsible for the NMR T2,surface are those from both physisorption and chemisorption layers. For the oil-wet rocks, which contain a considerable amount of physisorbed oil on the rock surface, Fig. 9a, the
Plug Sample
T2,app,LM (msec) T2,surface,LM (msec) ∆ESwirr (kcal/mol)35 °C 90 °C 35 °C 90 °C
1 76.5 149.2 168.23 206.74 0.83
2 75.8 203.1 174.02 327.12 2.55
3 126.3 266.8 1,265.71 531.12 -3.51
4 104.7 187.9 412.62 289.3 -1.43
5 89.5 174 247.18 257.61 0.17
Table 6 The T2,app,LM, T2,surface,LM, and ∆E at two different temperatures, 35 °C and 90 °C, of five rock core samples pre- and post- waterflooding, respectively. The samples are saturated with crude oil at Swirr with D2O pre-waterflooding. D2O also has been used for waterflooding instead of H2O.
Saudi Aramco: Company General Use
Fig. 8 The Arrhenius plot of the logarithmic mean of the T2 surface relaxation rate (1/T2,surface,LM) vs. the inverse of temperature in Kelvin (1,000/K) for all five samples saturated with crude oil at Swirr (pre-waterflooding) and at Sor (post-waterflooding). The symbols indicate each sample: blue circle (sample 1), red square (sample 2), green rhombus (sample 3), purple star/x (sample 4), and light-blue triangle (sample 5). The solid line with a filled symbol and the dashed line with an unfilled symbol (the star with solid line and the x with dashed line for sample 4) indicates the T2,surface,LM rate pre- and post-waterflooding, respectively.
Plug Sample
T2,app,LM (msec) T2,surface,LM (msec) DESwirr (kcal/mol) 35 °C 90 °C 35 °C 90 °C
1 76.5 149.2 168.23 206.74 0.83 2 75.8 203.1 174.02 327.12 2.55 3 126.3 266.8 1,265.71 531.12 -3.51 4 104.7 187.9 412.62 289.3 -1.43 5 89.5 174 247.18 257.61 0.17
Table 6 The T2,app,LM, T2,surface,LM, and DE at two different temperatures, 35 °C and 90 °C, of five rock core samples pre- and post-waterflooding, respectively. The samples are saturated with crude oil at Swirr with D2O pre-waterflooding. D2O also has been used for waterflooding instead of H2O.
0
1
2
3
4
5
6
7
8
2.7 2.8 2.9 3 3.1 3.2 3.3
1/T 2
,sur
face
,LM(s
ec-1
)
1000/T(K)
Fig. 8 The Arrhenius plot of the logarithmic mean of the T2 surface relaxation rate (1/T2,surface,LM) vs. the inverse of temperature in Kelvin (1,000/K) for all five samples saturated with crude oil at Swirr (pr-ewaterflooding) and at Sor (post-waterflooding). The symbols indicate each sample: blue circle (sample 1), red square (sample 2), green rhombus (sample 3), purple star/x (sample 4), and light-blue triangle (sample 5). The solid line with a filled symbol and the dashed line with an unfilled symbol (the star with solid line and the x with dashed line for sample 4) indicates the T2,surface,LM rate pre- and post-waterflooding, respectively.
bradwe0a
Highlight
bradwe0a
Highlight

10 The Aramco Journal of Technology Fall 2019
flooded water will easily strip away oils and bring more water from the pore space into the physisorption layer. Therefore, waterflooding produces a less oil-wet surface for oil-wet rocks. On the other hand, for intermediate/water-wet rocks, which contains a considerable amount of physisorbed water on the rock surface, Fig. 9b, the flooded water will easily strip away water and bring more oil from the pore space in the physisorption layer. In turn, waterflooding produces a less water-wet surface for intermediate/water-wet rocks. This phenomena can be also explained with the change of surface activation energy. The striping mechanism of physisorbed oil from the oil-wet rock by waterflooding results in weakening the oil-rock interaction, which led to the decreasing of Es, in turn increasing ∆E. On the other hand, that of physisorbed water from the intermediate/water-wet rock by waterflooding results in strengthening the oil-rock interaction, which led to the increasing of Es, in turn decreasing ∆E. This hypothetical description of wettability alteration by waterflooding, however, needs to be further verified.
In Figs. 10a and 10b, the surface activation energies pre- and post-waterflooding, ∆ESwirr and ∆ESor, were plotted with the oil recovery factor derived from the change of oil volume by NMR. From the plot of ∆ESwirr
vs. the recovery factor in Fig. 10a, we observed the trend of higher recovery factors for samples with higher ∆E, which are marked by dotted red lines. This tells us that the less oil-wet samples produce more oil by waterflooding for intermediate wetness samples. The outliers, which are strongly water-wet and oil-wet samples (samples 2 and 3, respectively), from this trend were also observed, which shows the recovery factor by waterflooding is not solely dependent on the wettability of reservoir rocks. One of most probable causes of this out-of-trend behavior is pore structures, such as pore connectivity. The T2 distribution of samples 2 and 3 show the existence of micropores, which are those with a T2 shorter than 1 msec, Fig. 1. Depending on the connectivity of these micropores with macropores, the T2,LM used to derive DE could vary considerably.
On the other hand, the ∆ESor values are relatively well correlated with recovery factors, Fig. 10b. The samples with higher oil recovery factors will have a higher ∆ESor after waterflooding. In other words, the sample with the lower oil recovery rate by waterflooding will become more oil-wet after waterflooding. This assessment of ∆E after waterflooding provides an important insight of fluid-rock interaction during the waterflooding process.
Table 8 lists the data used to plot Figs. 10a and 10b.
Plug Sample
T2,app,LM (msec) T2,surface,LM (msec) ∆ESor (kcal/mol)
∆ESwirr - ∆ESor (kcal/mol)35 °C 90 °C 35 °C 90 °C
1 70.6 113.7 142.11 144.31 0.06 -0.77
2 73.6 130.7 162.84 172.88 0.24 -2.31
3 107.9 218.4 467.23 368.54 -0.96 2.55
4 116.6 227.6 690.25 395.51 -2.25 -0.82
5 80.2 121.4 187.22 156.94 -0.71 -0.88
Table 7 The T2,app,LM, T2,surface,LM, and ∆E at two different temperatures, 35 °C and 90 °C, of five rock core samples pre- and post- waterflooding, respectively. The samples are saturated with crude oil at Sor with D2O post-waterflooding. D2O also has been used for waterflooding instead of H2O.
Fig. 9 The simplified schematic illustration of two phases of fluids, oil and water, in (a) oil-wet rock, and (b) intermediate/water-wet rock.

11 The Aramco Journal of TechnologyFall 2019
Fig. 10 (a) The plot of the activation energy of oil saturated at irreducible D2O saturation (∆ESwirr ) vs. the recovery factor of waterflooding. (b) The plot of the activation energy of the sample at residual oil saturation after waterflooding (∆ESor ) vs. the recovery factor of waterflooding. The blue dotted line is the linear fitting of all data.
Plug Sample
Recovery Factor (%) ∆ESwirr (kcal/mol) of Oil Sor∆ESor (kcal/mol) of Oil
1 57.69 0.83 0.06
2 45.1 2.55 0.24
3 44.46 -3.51 -0.96
4 28.67 -1.43 -2.25
5 52.2 0.17 -0.71
Table 8 The data plotted in the plot Figs. 10a and 10b.
Saudi Aramco: Company General Use
Plug Sample
Recovery Factor (%)
DESwirr (kcal/mol) of Oil
SorDESor (kcal/mol) of Oil
1 57.69 0.83 0.06 2 45.1 2.55 0.24 3 44.46 -3.51 -0.96 4 28.67 -1.43 -2.25 5 52.2 0.17 -0.71
Table 8 The data plotted in the plot Figs. 10a and 10b.
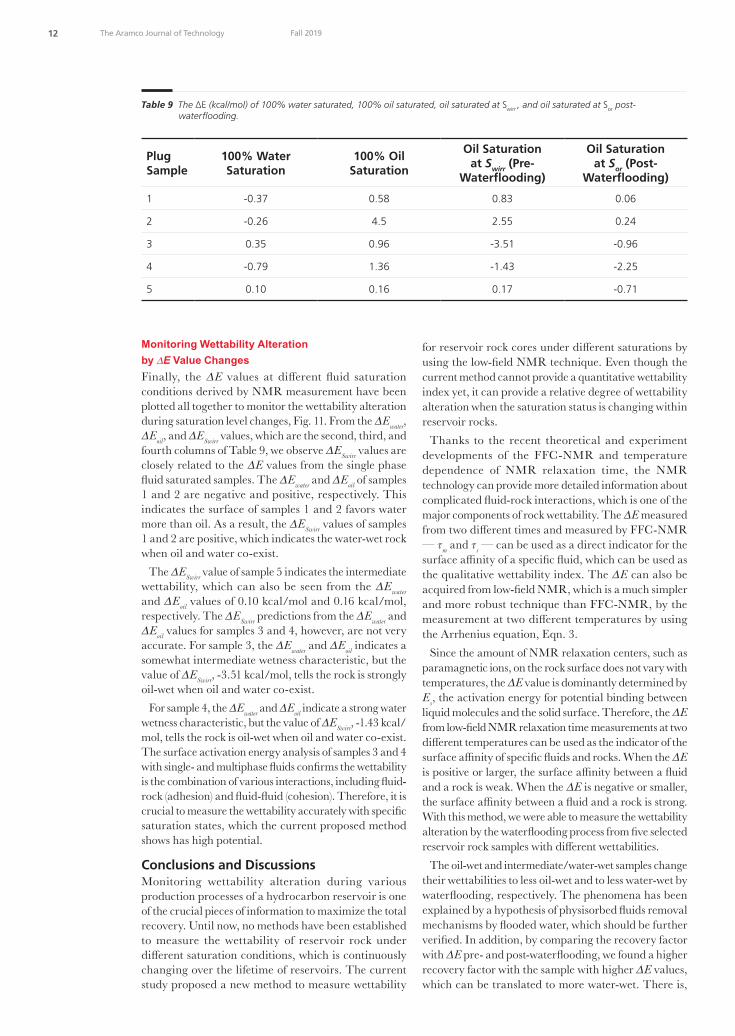
Fig. 11 The DE of 100% water saturated, 100% oil saturated, oil saturated at Swirr, and oil saturated at Sor after waterflooding are marked with blue, black, red, and yellow, respectively.
Plug Sample
100% Water Saturation
100% Oil Saturation
Oil Saturation at Swirr (Pre-
Waterflooding)
Oil Saturation at Sor (Post-
Waterflooding) 1 -0.37 0.58 0.83 0.06 2 -0.26 4.5 2.55 0.24 3 0.35 0.96 -3.51 -0.96 4 -0.79 1.36 -1.43 -2.25 5 0.10 0.16 0.17 -0.71
Table 9 The DE (kcal/mol) of 100% water saturated, 100% oil saturated, oil saturated at Swirr, and oil saturated at Sor post-waterflooding.
-4
-3
-2
-1
0
1
2
3
4
5
1 2 3 4 5
DE
(kca
l/mol
)
Sample Number
Fig. 11 The ∆E of 100% water saturated, 100% oil saturated, oil saturated at Swirr, and oil saturated at Sor after waterflooding are marked with blue, black, red, and yellow, respectively.
12 The Aramco Journal of Technology Fall 2019
Monitoring Wettability Alteration by ∆E Value ChangesFinally, the ∆E values at different fluid saturation conditions derived by NMR measurement have been plotted all together to monitor the wettability alteration during saturation level changes, Fig. 11. From the ∆Ewater, ∆Eoil, and ∆ESwirr values, which are the second, third, and fourth columns of Table 9, we observe ∆ESwirr values are closely related to the ∆E values from the single phase fluid saturated samples. The ∆Ewater and ∆Eoil of samples 1 and 2 are negative and positive, respectively. This indicates the surface of samples 1 and 2 favors water more than oil. As a result, the ∆ESwirr values of samples 1 and 2 are positive, which indicates the water-wet rock when oil and water co-exist.
The ∆ESwirr value of sample 5 indicates the intermediate wettability, which can also be seen from the ∆Ewater and ∆Eoil values of 0.10 kcal/mol and 0.16 kcal/mol, respectively. The ∆ESwirr predictions from the ∆Ewater and ∆Eoil values for samples 3 and 4, however, are not very accurate. For sample 3, the ∆Ewater and ∆Eoil indicates a somewhat intermediate wetness characteristic, but the value of ∆ESwirr, -3.51 kcal/mol, tells the rock is strongly oil-wet when oil and water co-exist.
For sample 4, the ∆Ewater and ∆Eoil indicate a strong water wetness characteristic, but the value of ∆ESwirr, -1.43 kcal/mol, tells the rock is oil-wet when oil and water co-exist. The surface activation energy analysis of samples 3 and 4 with single- and multiphase fluids confirms the wettability is the combination of various interactions, including fluid-rock (adhesion) and fluid-fluid (cohesion). Therefore, it is crucial to measure the wettability accurately with specific saturation states, which the current proposed method shows has high potential.
Conclusions and DiscussionsMonitoring wettability alteration during various production processes of a hydrocarbon reservoir is one of the crucial pieces of information to maximize the total recovery. Until now, no methods have been established to measure the wettability of reservoir rock under different saturation conditions, which is continuously changing over the lifetime of reservoirs. The current study proposed a new method to measure wettability
for reservoir rock cores under different saturations by using the low-field NMR technique. Even though the current method cannot provide a quantitative wettability index yet, it can provide a relative degree of wettability alteration when the saturation status is changing within reservoir rocks.
Thanks to the recent theoretical and experiment developments of the FFC-NMR and temperature dependence of NMR relaxation time, the NMR technology can provide more detailed information about complicated fluid-rock interactions, which is one of the major components of rock wettability. The ∆E measured from two different times and measured by FFC-NMR — τm and τs — can be used as a direct indicator for the surface affinity of a specific fluid, which can be used as the qualitative wettability index. The ∆E can also be acquired from low-field NMR, which is a much simpler and more robust technique than FFC-NMR, by the measurement at two different temperatures by using the Arrhenius equation, Eqn. 3.
Since the amount of NMR relaxation centers, such as paramagnetic ions, on the rock surface does not vary with temperatures, the ∆E value is dominantly determined by Es, the activation energy for potential binding between liquid molecules and the solid surface. Therefore, the ∆E from low-field NMR relaxation time measurements at two different temperatures can be used as the indicator of the surface affinity of specific fluids and rocks. When the ∆E is positive or larger, the surface affinity between a fluid and a rock is weak. When the ∆E is negative or smaller, the surface affinity between a fluid and a rock is strong. With this method, we were able to measure the wettability alteration by the waterflooding process from five selected reservoir rock samples with different wettabilities.
The oil-wet and intermediate/water-wet samples change their wettabilities to less oil-wet and to less water-wet by waterflooding, respectively. The phenomena has been explained by a hypothesis of physisorbed fluids removal mechanisms by flooded water, which should be further verified. In addition, by comparing the recovery factor with ∆E pre- and post-waterflooding, we found a higher recovery factor with the sample with higher ∆E values, which can be translated to more water-wet. There is,
Plug Sample
100% Water Saturation
100% Oil Saturation
Oil Saturation at Swirr (Pre-
Waterflooding)
Oil Saturation at Sor (Post-
Waterflooding)
1 -0.37 0.58 0.83 0.06
2 -0.26 4.5 2.55 0.24
3 0.35 0.96 -3.51 -0.96
4 -0.79 1.36 -1.43 -2.25
5 0.10 0.16 0.17 -0.71
Table 9 The ∆E (kcal/mol) of 100% water saturated, 100% oil saturated, oil saturated at Swirr , and oil saturated at Sor post- waterflooding.

13 The Aramco Journal of TechnologyFall 2019
however, outliers that do not follow the observed trend, which tells us that there are other factors than wettability, which affects the hydrocarbon recovery, such as pore structures.
There are a few uncertainties involved in the current study. One of the most prominent ones is the accuracy of the T2LM from a multiporous system. Depending on the strength of the pore connectivity, known as diffusion coupling, among different pore systems, the ∆E value derived from T2LM from the whole T2 distribution could vary considerably. Therefore, the connectivity among pores for a multiporous system should be considered to increase the accuracy of the current method. In addition, it is not possible to estimate experimental uncertainties when the activation energy was derived from NMR relaxation times at two temperatures only.
Finally, it is very interesting to observe the continuous wettability alteration after waterflooding by the proposed method, which will be one of the most critical pieces of information to design and optimize tertiary recovery methods. Currently, we are conducting this type of study with field specific fluids and rocks by a suite of wettability assessment methods, including the proposed method.
AcknowledgmentsThe authors would like to thank the management of Saudi Aramco for their support and permission to publish this article. The authors would also like to thank Mustafa Satrawi and Ziyad Kaidar for assisting in the sample preparations and conducting the contact angle measurement.
This article was presented at the SPE Kingdom of Saudi Arabia Annual Technical Symposium and Exhibition, Dammam, Saudi Arabia, April 16-18, 2019.
References1. Jadhunandan, P.P. and Morrow, N.R.: “Effect of Wettability
on Waterflood Recovery for Crude Oil/Brine/Rock Systems,” SPE Reservoir Engineering, Vol. 10, Issue 1, February 1995, pp. 40-46.
2. Mjos, J.E.S., Strand, S., Puntervold, T. and Gaybaliyev, H.: “Effect of Initial Wetting on SmartWater Potential in Carbonates,” SPE paper 190414, presented at the SPE EOR Conference at Oil and Gas West Asia, Muscat, Oman, March 26-28, 2018.
3. Dullien, F.A.L.: Porous Media: Fluid Transport and Pore Structure, 2nd edition, Academic Press: San Diego, 1992, 574 p.
4. Howard, J.J.: “Quantitative Estimates of Porous Media Wettability from Proton NMR Measurements,” Magnetic Resonance Imaging, Vol. 16, Issues 5-6, June-July 1998, pp. 529-533.
5. Fleury, M. and Deflandre, F.: “Quantitative Evaluation of Porous Media Wettability Using NMR Relaxometry,” Magnetic Resonance Imaging, Vol. 21, Issues 3-4, April-May 2003, pp. 385-387.
6. Noack, F.: “NMR Field-Cycling Spectroscopy: Principles and Applications,” Progress in Nuclear Magnetic Resonance Spectroscopy, Vol. 18, Issue 3, 1986, pp. 171-276.
7. Kimmich, R. and Weber, H.W.: “NMR Relaxation and the Orientational Structure Factor,” Physical Review B, Vol. 47, Issue 18, May 1993, p. 788.
8. Whaley, M., Lawrence, A.J., Korb, J-P. and Bryant, R.G.: “Magnetic Cross-Relaxation and Chemical Exchange between Microporous Solid and Mobile Liquid Phases,” Solid State Nuclear Magnetic Resonance, Vol. 7, Issue 3, December 1996, pp. 247-252.
9. Korb, J-P., Whaley-Hodges, M. and Bryant, R.G.: “Translational Diffusion of Liquids at Surfaces of Microporous Materials: Theoretical Analysis of Field-Cycling Magnetic Relaxation Measurements,” Physical Review E, Vol. 56, Issue 2, August 1997, p. 1934.
10. Korb, J-P., Whaley-Hodges, M., Gobron, T. and Bryant, R.G.: “Anomalous Surface Diffusion of Water Compared to Aprotic Liquids in Nanopores,” Physical Review E, Vol. 60, Issue 3, October 1999, pp. 3097-3106.
11. Korb, J-P., Freiman, G., Nicot, B. and Ligneul, P.: “Dynamical Surface Affinity of Diphasic Liquids as a Probe of Wettability of Multimodal Porous Media,” Physical Review E, Vol. 80, Issue 6, December 2009, p. 1601.
12. Godefroy, S., Korb, J-P., Fleury, M. and Bryant, R.G.: “Surface Nuclear Magnetic Relaxation and Dynamics of Water and Oil in Macroporous Media,” Physical Review E, Vol. 64, Issue 2, August 2001, p. 1605.
13. Kimmich, R. and Anoardo, E.: “Field-Cycling NMR Relaxometry,” Progress in Nuclear Magnetic Resonance Spectroscopy, Vol. 44, 2004, pp. 257-320.
14. Godefroy, S., Fleury, M., Deflandre, F. and Korb, J-P.: “Temperature Effect on NMR Surface Relaxation in Rocks for Well Logging Applications,” The Journal of Physical Chemistry B, Vol. 106, Issue 43, October 2002, pp. 11183-11190.
15. Ogunberu, A.L. and Ayub, M.: “The Role of Wettability in Petroleum Recovery,” Petroleum Science and Technology, Vol. 23, Issue 2, 2005, pp. 169-188.
16. Morrow, N.R.: “Wettability and its Effect on Oil Recovery,” Journal of Petroleum Technology, Vol. 42, Issue 12, December 1990, pp. 1476-1484.
17. Agbalaka, C.C., Dandekar, A.Y., Patil, S.L., Khataniar, S., et al.: “The Effect of Wettability on Oil Recovery: A Review,” SPE paper 114496, presented at the SPE Asia Pacific Oil and Gas Conference and Exhibition, Perth, Australia, October 20-22, 2008.
18. Kennedy, H.T., Burja, E.O. and Boykin, R.S.: “An Investigation of the Effects of Wettability on Oil Recovery by Waterflooding,” Journal of Physical Chemistry, Vol. 59, Issue 9, September 1955, pp. 867-869.
19. Freedman, R., Heaton, N., Flaum, M., Hirasaki, G.J., et al.: “Wettability, Saturation, and Viscosity from NMR Measurements,” SPE Journal, Vol. 8, Issue 4, December 2003, pp. 317-327.
20. Kwak, H.T., Wang, J. and AlSofi, A.M.: “Close Monitoring of Gel-based Conformance Control by NMR Techniques,” SPE paper 183719, presented at the SPE Middle East Oil and Gas Show and Conference, Manama, Kingdom of Bahrain, March 6-9, 2017.

14 The Aramco Journal of Technology Fall 2019
Dr. Hyung T. Kwak joined Saudi Aramco in April 2010 as a Petroleum Engineer with Saudi Aramco’s Exploration and Petroleum Engineering Center – Advance Research Center (EXPEC ARC). He had been a member of the Pore Scale Physics focus area (2010 to 2012) and SmartWater Flooding focus area (2013 to 2014) of the Reservoir Engineering Technology Division. Currently, Hyung is a focus area champion of the Pore Scale Physics focus area. His main research focus is seeking deeper understanding of fluid-rock interaction in pore scale of the Kingdom’s reservoirs.
Since joining Saudi Aramco in 2010, Hyung has been involved with various improved oil recovery and enhanced oil recovery (EOR) research projects, such as SmartWater Flooding, carbon dioxide EOR, and
chemical EOR. Prior to joining Saudi Aramco, Hyung was a Research Scientist at Baker Hughes, with a main area of research related to nuclear magnetic resonance (NMR)/magnetic resonance imaging technology.
In 1996, Hyung received a B.S. degree in Chemistry from the University of Pittsburgh, Pittsburgh, PA, and in 2001, he received his Ph.D. degree in Physical Chemistry from Ohio State University, Columbus, Ohio.
Before moving into the oil and gas industry, Hyung was involved — as a postdoctoral fellow for 2 years — in a project developing the world’s largest wide bore superconducting magnet NMR spectrometer, 900 MHz, at the National High Magnetic Field Laboratory.
He has more than 100 publications, including peer-reviewed articles and patents.
About the Authors
Dr. Hyung T. Kwak
Ph.D. in Physical Chemistry, Ohio State University
Jun Gao
M.S. in Petroleum Engineering, University of Calgary
Jun Gao joined Saudi Aramco in October 2015 and is currently working in Saudi Aramco’s Exploration and Petroleum Engineering Center – Advanced Research Center (EXPEC ARC) as a Petroleum Scientist with the Reservoir Engineering Technology Division. Prior to joining Saudi Aramco, he worked as a Research Scientist on multiple advanced enhanced oil recovery (EOR) studies for oil companies at Tomographic Imaging and Porous Media Laboratory (TIPM lab) in Perm Inc. and the University of Calgary. Prior to that, Jun worked as a Petroleum Engineer on national chemical EOR research projects at the Geological Scientific Research Institute, Shengli Oil Field Company,
and China Petroleum & Chemical Corporation (Sinopec).
He has over 25 years of research experience in special core analysis and EOR, including chemical, thermal, and carbon dioxide techniques, assisted by imaging technologies such as X-ray computer tomography and nuclear magnetic resonance imaging.
Jun received his B.S. degree in Physics from Shandong University, Shandong, China, his B.Eng. degree in Petroleum Engineering from the China University of Petroleum (East China), Qingdao, China, and his M.S. degree in Petroleum Engineering from the University of Calgary, Calgary, Alberta, Canada.
Dr. Ahmad M. Al-Harbi
Ph.D. in Petroleum Engineering, University of Calgary
Dr. Ahmad M. Al-Harbi is a Petroleum Engineer in the Pore Scale Physics Group of the Reservoir Engineering Technology Division in Saudi Aramco’s Exploration and Petroleum Engineering Center – Advanced Research Center (EXPEC ARC). His current research focus is seeking solutions for ultimate recovery from Saudi Arabian reservoirs by acquiring deeper understandings of fluid dispersion, pore connectivity, and fluid-rock interaction in porous media.
Ahmad has 15 years of experience in the oil industry
with Saudi Aramco. He has been involved with various enhanced oil recovery (EOR) research projects, such as chemical EOR.
In 2001, Ahmad received his B.S. degree in Chemical Engineering from King Fahd University of Petroleum and Minerals (KFUPM), Dhahran, Saudi Arabia, and in 2013, he received his Ph.D. degree in Petroleum Engineering from the University of Calgary, Calgary, Alberta, Canada.
2 The Aramco Journal of Technology Fall 2019
The objective of this work is to establish communications between the tight hydrocarbon-bearing formation and the wellbore by using high power laser technology. This article presents different methods of utilizing the energy of the laser to enhance and improve the flow in unconventional reservoirs, including tight formations. The successful results are used for field deployment strategy.
High power lasers are an innovative alternative to several currently used downhole stimulation methods and technologies. The system consists of the laser source, which is mounted on the surface of a coiled tubing unit, and fiber optic cables to transmit the energy and the downhole tool. The advantages of utilizing laser technology are the ability to control and orient the laser energy precisely. This energy generates heat, which impacts the rock samples by dehydrates, and collapses and dissociates minerals near the wellbore, while also creating microfractures and macrofractures in the formation. In addition, the heat effect removes the blockage around the wellbore and extends into the tight formation for production.
Continuous efforts over the past two decades have proven that the high power lasers provide a controllable heat source while penetrating the formation. This mechanism enhances flow properties, especially in tight formations. Low permeability in these formations restricts the flow and reduces production. Shale, sandstones (including tight sandstones) and carbonate rocks have been treated. Pre- and post-treatment measurements are conducted for comparison; the results from all rock types show improvement in permeability and flow. The results of advanced core characterizations, imaging and visualization are presented. The success of the lab experiments leads to the development of a field deployment strategy to use a high power laser for in situ treatment in unconventional wells.
Utilizing state-of-the-art high power laser technology downhole provides innovative and safe stimulation methods. Reliability, accuracy, and precision in controlling the power, orientation, and the shape of the beam are some of the properties of the technology that made it attractive for downhole applications. Different tools have been developed for different applications that can fit any slim holes.
Unleash Unconventional Resourses with the Power of Light-Laser TechnologyDr. Sameeh I. Batarseh, Abdullah M. Alharith, Dr. Haitham A. Othman, and Dr. Hameed H. Al-Badairy
Abstract /
IntroductionLasers have revolutionized and changed several industries in the past decades. The innovative technology attracted the oil and gas industry, and became the focus for several downhole applications based to its unique properties; such as the ability to control and orient the high energy beam in any direction, and control the shape and the size of the beam, precision, reliability, and portability.
Lasers have evolved rapidly in the past few years, progressing to become more compact, efficient, and cost-effective. The system footprint has been dramatically reduced and the power level increased. The low power lasers are already advanced, and are used in several applications in the oil and gas industry, including measurement and sensing. The early high power lasers did not have the power required to penetrate the rocks. Recent advances in the lasers allowed laser manufacturers to make high power diode-based lasers that are commercially available, Fig. 11. The selection of downhole laser candidates are limited. Lasers must have the following criteria: high power; portable; beam delivery via fiber optic cables; efficient; and cost-effective.
The transformation of the laser from the lab to the field requires the integration of four main components: (1) the laser energy source, (2) the surface unit, (3) the fiber optic cable to convey the energy downhole, and (4) the tool2. The main components of the downhole tool are the optics. The beam geometry is obtained by manipulating the optical components, which are based on coated lenses, mirrors, and prisms; each will provide different beam shape, size, and orientation.
Lenses are used to reshape the beam with different sizes and geometries, and mirrors are used to reflect the beam while prisms are used to split the beam. Laser energy is generated at the surface and the beam transmits via fiber optics to the downhole tool at the target. The tool combines all the optical, mechanical, and electronic systems to achieve diverse functions. The beam exits the fiber optics and is controlled by a set of optics. Figure 2 presents two simplified optical configurations of beam manipulation and control by lenses. The raw beam enters the first

3 The Aramco Journal of TechnologyFall 2019
lens and it focuses the beam at a distance from the lens (focal point), then the beam expands in divergence mode. The beam diameter will expand beyond the original size of the beam, and this beam is used to heat up the formation. The heating is the mechanism that will be responsible for the physical and chemical changes in the formation, and is used for stimulation. The beam can be controlled by adding another lens to achieve a fixed beam diameter, which is called collimation.
Heat delivered to the formation depends on the laser energy of absorption of the sample. The beam shape determines the amount of the energy delivered at the surface of the rock sample, e.g., the focused beam delivers high energy when the rock sample is placed before or at the focal point, while the energy will be reduced when the sample is placed after the focal point. This is due to the intensity of the beam, which is defined as the power over the beam size. In the case of the collimated beam, the beam size is constant, which results in delivering constant energy at any distance. In this study, a fixed beam size was used to have consistency in the energy delivered to the formation.
When the beam interacts with the surface of the rock sample, part of the energy will be reflected and part of the energy will be absorbed3, which are important fundamentals that govern the interaction between lasers and rocks. Reflection reduces the amount of energy that is transferred to the rock, and the absorbed energy determines the level of energy transferred to the sample. The absorption and reflection are related to the wavelength (l) and the surface of the sample being bombarded. An example of the sample absorption as a function of the wavelength is presented in Fig. 3; in this example, different limestone samples were tested.
Figure 3 demonstrates that even with the same rock types being exposed to high power laser energy at
Fig. 2 Simplified optical beam control showing beam shapes and sizes.
Fig. 1 The development of diode laser power levels in recent years.
Fig. 3 Optical absorption of different limestone samples as a function of wavelength.
Saudi Aramco: Company General Use
Fig. 3 Optical absorption of different limestone samples as a function of wavelength. Fig. 4 Reflectivity of the laser energy based on the rock color for 1,064 nm wavelength.
0%10%20%30%40%50%60%70%80%90%
100%
900 1100 1300 1500 1700 1900 2100 2300 2500
Abs
orpt
ion
Wavelength (nm)
Generic Limestone Edward Brown Dolomite Indiana Limestone
Desert Pink Limestone Yellow Limestone
0
20
40
60
80
100
120
Berea Shale 7 Shale 16 Shale 5
Ref
lect
ivity
(%)
Sample

4 The Aramco Journal of Technology Fall 2019
different wavelengths, the abortions are still varied, and this variation also depends on the color of the rock. The brighter the color of the rock, the less absorption to the sample.
Figure 4 illustrates another example using Berea sandstone and three types of unconventional shale samples. The samples were selected because of their color variation. Berea is the brightest, followed by Shale 7, Shale 16, and Shale 5, which is the darkest. Berea has the most reflection due to its brightest color and the shale samples have different reflections based on their color.
The brighter the color the more reflective the beam is. The laser wavelength used for this study was constant at 1,064 nanometers (nm).
The reflection presents energy loss; power should be adjusted based on the reflectivity of the rock sample. For example, if Berea sandstone requires 2 kW of laser power to make changes in the rock, and reflectivity is high, then more power should be adjusted to make up for the power reflected. This is based on the reflectivity percentage of each rock type. These values are predetermined in the lab prior to field deployment.
Lab Experimental FrameworkPermeability Measurements
The impact of a high power laser on the rock samples was evaluated using different equipment, and a pre- and post-analysis was carried out for different rock types, including unconventional shale and tight formations. The integrated analytical approach combines both chemical and physical changes of the rock samples. Permeability is measured by using the Autoscan, X-ray diffraction is used for mineralogy and clay characterization, a computed tomography (CT) scan is used for the characterization of microcracks, and a thermogravimetric analyzer (TGA) is used to determine the behavior of the rock samples at different temperatures.
The permeability measurement was conducted using the AutoScan system, Fig. 5a. Permeability is measured using a steady-state gas injection technique. Permeability ranging from 0.1 millidarcies to 3 Darcie’s are measured with the standard 4.0 mm permeability probe, Fig. 5b. The accuracy and reducing measurement uncertainty is critical, especially for tight and unconventional samples. The sample was divided into grids for multiple measurements; each point was measured three times
Fig. 4 Reflectivity of the laser energy based on the rock color for 1,064 nm wavelength.
Fig. 5 (a) Autoscan system prepared for measurements, (b) permeability probe, and (c) schematic of how air flows from the permeability probe into a sample.
Saudi Aramco: Company General Use
Fig. 5 (a) Autoscan system prepared for measurements, (b) permeability probe, and (c) schematic of how air flow from the permeability probe into a sample.
Fig. 6 (a) A sandstone rock sample before treatment, and (b) the sample after laser treatment.
Measurement Grids
Laser Treatment Area
(a) (b)

5 The Aramco Journal of TechnologyFall 2019
and the distance between the grids was 5 mm. This is performed to obtain a high-definition measurement and characterization, and to cover all the rock samples. The fully automatic mode is set to automatic grid measurement. The acquisition software allows the user to select the pressure control or flow control-based measurements, enabling detailed studies of the Klinkenberg effects at low pressures, and inertial and turbulence effects at high flow rates. The software allows the system to optimize measurement control parameters during the actual measurement to increase measurement speed, available range, and precision.
The specific interval for a specimen depended upon the size of the measurement’s surface area. The permeability probe, Fig. 5b, has a special soft tip made from special soft material to assure fit contact between the tip and the sample, and to prevent any leakage between the tip and the sample as a pressurized gas will flow from the permeability probe into the sample for permeability measurement, Fig. 5c.
Nitrogen gas was used in this work as the fluid for permeability measurement. Once a steady-state flow through the specimen is achieved, Darcy’s law is employed to determine the surface gas permeability using the following equation — neglecting gas slippage and high velocity flow effects:
Kapparent = !"#$&'(
)*($!,$!&'() (1)
Kk =
.&//&012'34(
56789:
) (2)
3.;= 3.=− 𝐹𝐹ℎ. 𝑄𝑄 (3)
1
where Kapparent is the apparent permeability, Q is the flow rate of gas at P atm, μ is the gas viscosity, P is the injection pressure of the gas, P atm is the atmospheric pressure, a is the internal tip-seal radius, and Go is a geometrical factor.
The initial P and Q can be adjusted to achieve steady-state conditions more quickly, and the maximum time limit for a sample reading can be specified such that the device will not record a measurement unless steady-state conditions have been reached in the allotted time. In cases where permeability varied greatly across a single specimen and measurements could not be obtained in the time allotted, the specimens were rerun with different initial P and Q values.
The measured apparent permeability is then corrected (Kk) for gas slippage effects at low gas injection pressures:
Kapparent = !"#$&'(
)*($!,$!&'() (1)
Kk =
.&//&012'34(
56789:
) (2)
3.;= 3.=− 𝐹𝐹ℎ. 𝑄𝑄 (3)
2
where B is the Klinkenberg slip factor and Pmean is the mean pressure measurement; Pmean = (P + Patm)/2.
The permeability computed using Eqn. 2 is further corrected (Ko) for high velocity flow effects (turbulence and inertial) using a Forchheimer factor (Fh):
Kapparent = !"#$&'(
)*($!,$!&'() (1)
Kk =
.&//&012'34(
56789:
) (2)
3.;= 3.=− 𝐹𝐹ℎ. 𝑄𝑄 (3)
3
The Autoscan system determines the Klinkenberg and Fh at each measurement location4.
Sandstone Rock Sample
A sandstone sample (8” in length by 3.5” in width and 1.5” in height) is used, Fig. 6a. The middle of the sample
surface was treated (scanned) with a laser beam; Fig. 6b. The laser beam is 1” in diameter and with 1.5 kW in power. The permeability of the sample is measured with the Autoscan system across the sample covering both the treated area and the non-treated area for comparison.
The permeability of the sample was measured in a grid mode, and the distance between the measurement points is 5 mm. The grid mode creates a multiple series of measurements as multiple lines across the Y-axis of the sample. Figure 7 shows the permeability behavior across the sample after the laser treatment. The permeability increases as the measurement approaches the middle of
Fig. 6 (a) A sandstone rock sample before treatment, and (b) the sample after laser treatment.
Saudi Aramco: Company General Use
Fig. 7 The permeability measurement (behavior) of the treated surface of the sandstone sample.
0
100
200
300
400
500
600
700
800
900
1 2 3 4 5 6 7 8 9
Perm
eabi
lity
(mD)
Distance (cm)
Fig. 7 The permeability measurement (behavior) of the treated surface of the sandstone sample.

6 The Aramco Journal of Technology Fall 2019
the sample where the sample was exposed to the high energy laser beam. The permeability increased in the treated area significantly.
The laser energy generates heat in the sample, which is responsible for the cause of the physical and chemical changes in the rock. To quantify the effect, an infrared camera is used to capture and measure the temperature at the surface of the rock sample. In this case, the thermal imaging of the sample shows that the temperature on the surface of the sample reaches more than 700 °C, Fig. 8.
At 700 °C, clays will collapse and microcracks will develop. These changes will increase the void space, and if these are connected, the permeability will be improved in all rocks types, including unconventional samples.
Unconventional Rock Sample
A laser treatment was conducted on tight unconventional core samples to examine the effect of a high power laser on an unconventional formation, Fig. 9. Laser pretreatment is presented in Fig. 9a and post-treatment in Fig. 9b. Three laser power levels were used to conduct this experiment
to evaluate the laser power required to stimulate the formation power levels are at 1 kW, 2 kW, and 3 kW. The permeability of the core sample were measured in the middle of the sample using line scanning. Twenty permeability measurement points were recorded on a straight line. The sample was then treated by a high power laser on the exact same measurement points. The result of the permeability measurement before and after the laser treatment is presented in Fig. 10.
The result shows significant improvement of the sample post-treatment. This is due to the sudden change (increase) in temperature caused by the laser energy. The increase in the temperature causes a thermal shock and creates microcracks in the sample. The microcracks create new channels for the fluid to flow through, which is reflected by an increment in permeability. The temperature on the surface of the core sample is measured by a thermal camera, which reaches more than 1,000 °C, Fig. 11.
Another example is the shale sample. Permeability of the shale sample was mapped and contoured based on the
Fig. 8 Thermal imaging at different positions on the sample during the laser treatment using a thermal camera.
Saudi Aramco: Company General Use
Fig. 8 Thermal imaging at different positions on the sample during the laser treatment using a thermal camera.
Fig. 9 (a) Unconventional core sample before laser treatment, and (b) the core sample after the treatment.
Laser Heated Zone
(a) (b)
Saudi Aramco: Company General Use
Fig. 8 Thermal imaging at different positions on the sample during the laser treatment using a thermal camera.
Fig. 9 (a) Unconventional core sample before laser treatment, and (b) the core sample after the treatment.
Laser Heated Zone
(a) (b)
Fig. 9 (a) Unconventional core sample before laser treatment, and (b) the core sample after the treatment.
Saudi Aramco: Company General Use
Fig. 8 Thermal imaging at different positions on the sample during the laser treatment using a thermal camera.
Fig. 9 (a) Unconventional core sample before laser treatment, and (b) the core sample after the treatment.
Laser Heated Zone
(a) (b)
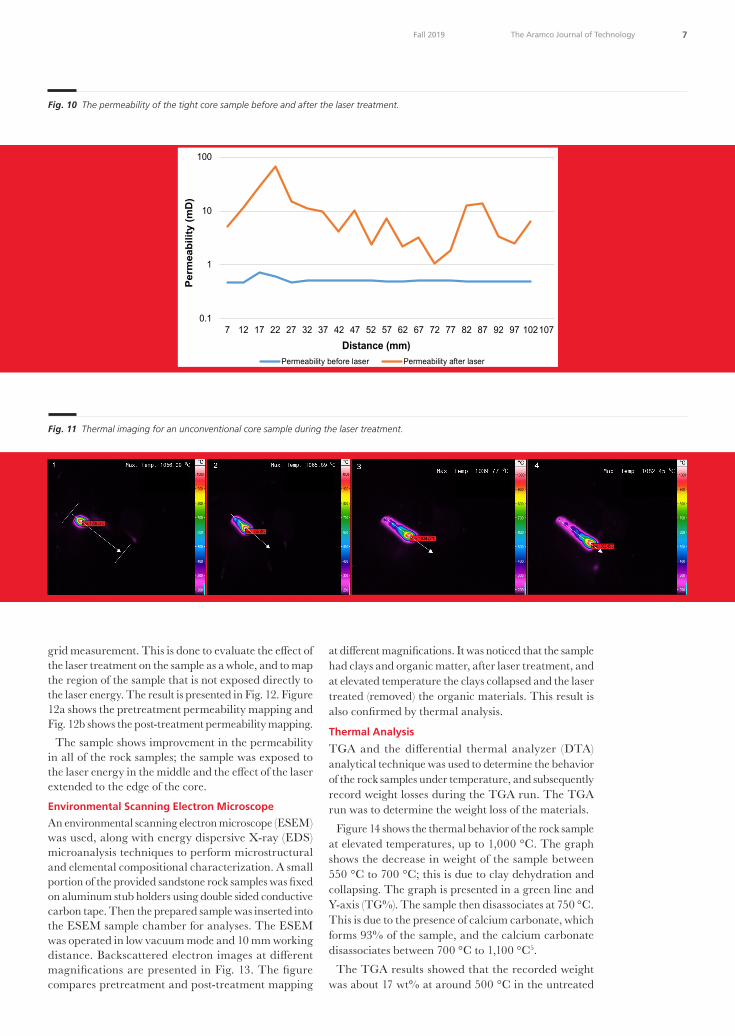
7 The Aramco Journal of TechnologyFall 2019
grid measurement. This is done to evaluate the effect of the laser treatment on the sample as a whole, and to map the region of the sample that is not exposed directly to the laser energy. The result is presented in Fig. 12. Figure 12a shows the pretreatment permeability mapping and Fig. 12b shows the post-treatment permeability mapping.
The sample shows improvement in the permeability in all of the rock samples; the sample was exposed to the laser energy in the middle and the effect of the laser extended to the edge of the core.
Environmental Scanning Electron Microscope
An environmental scanning electron microscope (ESEM) was used, along with energy dispersive X-ray (EDS) microanalysis techniques to perform microstructural and elemental compositional characterization. A small portion of the provided sandstone rock samples was fixed on aluminum stub holders using double sided conductive carbon tape. Then the prepared sample was inserted into the ESEM sample chamber for analyses. The ESEM was operated in low vacuum mode and 10 mm working distance. Backscattered electron images at different magnifications are presented in Fig. 13. The figure compares pretreatment and post-treatment mapping
at different magnifications. It was noticed that the sample had clays and organic matter, after laser treatment, and at elevated temperature the clays collapsed and the laser treated (removed) the organic materials. This result is also confirmed by thermal analysis.
Thermal Analysis
TGA and the differential thermal analyzer (DTA) analytical technique was used to determine the behavior of the rock samples under temperature, and subsequently record weight losses during the TGA run. The TGA run was to determine the weight loss of the materials.
Figure 14 shows the thermal behavior of the rock sample at elevated temperatures, up to 1,000 °C. The graph shows the decrease in weight of the sample between 550 °C to 700 °C; this is due to clay dehydration and collapsing. The graph is presented in a green line and Y-axis (TG%). The sample then disassociates at 750 °C. This is due to the presence of calcium carbonate, which forms 93% of the sample, and the calcium carbonate disassociates between 700 °C to 1,100 °C5.
The TGA results showed that the recorded weight was about 17 wt% at around 500 °C in the untreated
Fig. 11 Thermal imaging for an unconventional core sample during the laser treatment.
Saudi Aramco: Company General Use
Fig. 10 The permeability of the tight core sample before and after the laser treatment.
Fig. 11 Thermal imaging for an unconventional core sample during the laser treatment.
0.1
1
10
100
7 12 17 22 27 32 37 42 47 52 57 62 67 72 77 82 87 92 97 102107
Perm
eabi
lity
(mD
)
Distance (mm)Permeability before laser Permeability after laser
Fig. 10 The permeability of the tight core sample before and after the laser treatment.
Saudi Aramco: Company General Use
Fig. 10 The permeability of the tight core sample before and after the laser treatment.
Fig. 11 Thermal imaging for an unconventional core sample during the laser treatment.
0.1
1
10
100
7 12 17 22 27 32 37 42 47 52 57 62 67 72 77 82 87 92 97 102107
Perm
eabi
lity
(mD
)
Distance (mm)Permeability before laser Permeability after laser
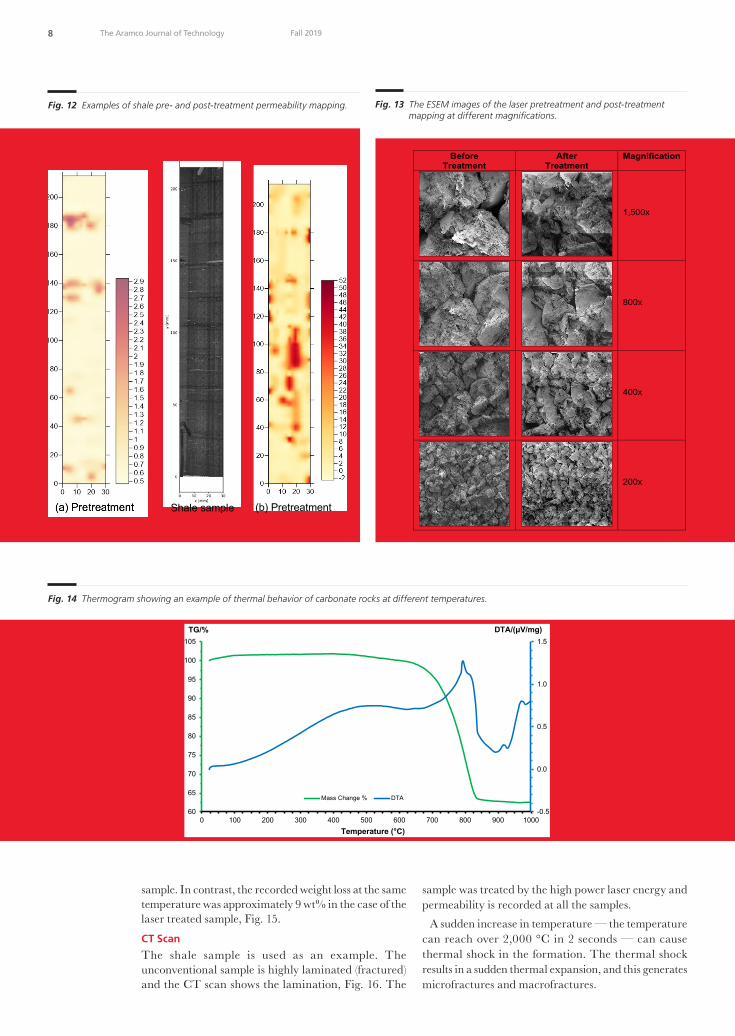
8 The Aramco Journal of Technology Fall 2019
sample. In contrast, the recorded weight loss at the same temperature was approximately 9 wt% in the case of the laser treated sample, Fig. 15.
CT Scan
The shale sample is used as an example. The unconventional sample is highly laminated (fractured) and the CT scan shows the lamination, Fig. 16. The
sample was treated by the high power laser energy and permeability is recorded at all the samples.
A sudden increase in temperature — the temperature can reach over 2,000 °C in 2 seconds — can cause thermal shock in the formation. The thermal shock results in a sudden thermal expansion, and this generates microfractures and macrofractures.
Fig. 12 Examples of shale pre- and post-treatment permeability mapping.
Saudi Aramco: Company General Use
Fig. 12 Examples of shale pre- and post-treatment permeability mapping. Note: You can squeeze this figure together.
(a) Pre-treatment Shale sample B- Post- treatment (b) Pretreatment
Saudi Aramco: Company General Use
Fig. 12 Examples of shale pre- and post-treatment permeability mapping. Note: You can squeeze this figure together.
(a) Pre-treatment Shale sample B- Post- treatment (b) Pretreatment
Fig. 13 The ESEM images of the laser pretreatment and post-treatment mapping at different magnifications.
Saudi Aramco: Company General Use
Before Treatment
After Treatment
Magnification
1,500x
800x
400x
200x
Fig. 13 The ESEM images of the laser pretreatment and post-treatment mapping at different magnifications.
Fig. 14 Thermogram showing an example of thermal behavior of carbonate rocks at different temperatures.
Saudi Aramco: Company General Use
Fig. 14
-0.5
0.0
0.5
1.0
1.5
60
65
70
75
80
85
90
95
100
105
0 100 200 300 400 500 600 700 800 900 1000
Mass Change % DTA
Temperature (°C)
TG/% DTA/(μV/mg)

9 The Aramco Journal of TechnologyFall 2019
ConclusionsThe advantages of using laser technology to treat and stimulate unconventional wellbores are in the precision of controlling the beam orientation, shape, and magnitude. The laser is used as a controlled heat source that enhances the rock flow properties. A laser generates heat, and this heat can increase the temperature, reaching a highly elevated temperature in seconds. For example, the sample’s temperature can reach 2,000 °C in 2 seconds, and this sudden change in temperature causes thermal shock in the rock sample. The effect of the heat on rocks causes clays to collapse, dehydrate, and develop microfractures and macrofractures, and these changes will improve the flow in the formation. Several samples were tested using a high power laser, and in all rock types the permeability improved; including in tight and unconventional formations. Table 1 summarizes the permeability and porosity characterizations of different rock types.
The analyses to evaluate the effect of the laser on the samples uses an integrated approach of multiple equipment. The Autoscan is used for permeability measurement, and ESEM and EDS microanalysis techniques were applied to perform microstructural and elemental compositional characterization. TGA and DTA analytical techniques were used to determine the behavior of the rock samples under temperature, and subsequently record weight loss during the TGA run. A CT scan is used to characterize the fractures of the rock, which confirm the result of the analysis.
Permeability mapping is used to cover all the rock samples using multiple measurements and several points for more accurate characterization. The equipment performs point measurement and spacing as needed; the more points measured, the more information and details are known.
AcknowledgmentsThe authors would like to thank the management of Saudi Aramco for their support and permission to publish this article.
This article was presented at the SPE Middle East Oil and Gas Show and Conference, Manama, Kingdom of Bahrain, March 18-21, 2019.
Fig. 15 TGA thermogram showing the level of weight loss for laser pretreatment and post-treatment.
Saudi Aramco: Company General Use
Fig. 14 Thermogram showing an example of thermal behavior of carbonate rocks at different temperatures.
Fig. 15 TGA thermogram showing the level of weight loss for laser pretreatment and post-treatment.
0246810121416
Wei
ght L
oss
%
Sample Number
Fig. 16 The CT scan of the unconventional shale sample showing lamination and fractures.
Sample Permeability Increase % Porosity Increase %
Berea Yellow 2 57
Berea Gray 22 50
Reservoir Tight Sandstone 171 150
Limestone 33 15
Shale 1 28 700
Shale 2 11 250
Table 1 Permeability and porosity increase measurements of the laser pretreatment and post-treatment2.
10 The Aramco Journal of Technology Fall 2019
References1. Batarseh, S.I., San-Roman-Alerigi, D.P., Reece, J.
and Othman, H.: “Downhole High-Power Laser Tools Development and Evolutions,” SPE paper 193064, presented at the Abu Dhabi International Petroleum Exhibition and Conference, Abu Dhabi, UAE, November 12-15, 2018.
2. Batarseh, S.I., Graves, R., San-Roman-Alerigi, D.P. and Chand, K.: “Laser Perforation: Lab to the Field,” SPE paper 188729, presented at the Abu Dhabi International Petroleum Exhibition and Conference, Abu Dhabi, UAE, November 13-16, 2017.
3. Batarseh, S.I.: “Application of Laser Technology in the Oil and Gas Industry: An Analysis of High Power Laser-Rock Interaction and its Effect on Altering Rock Properties and Behavior,” Ph.D. thesis, Colorado School of Mines, 2001, 386 p.
4. Grover, D., Savidge, C.R., Townsend, L., Rosari, O., et al.: “Surface Permeability of Natural and Engineered Porous Building Materials,” Construction and Building Materials, Vol. 112, June 2016, pp. 1088-1100.
5. Somerton, W.H.: Thermal Properties and Temperature-related Behavior of Rock/Fluid Systems, Volume 37, 1st edition, Elsevier Science Publications, March 1992, 256 p.
Dr. Sameeh I. Batarseh is a Petroleum Engineering Consultant working with the Production Technology Team of Saudi Aramco’s Exploration and Petroleum Engineering Center – Advanced Research Center (EXPEC ARC). Currently, he is the Focus Area Champion of the Unconventional Resources, and leading the High-Power Laser Program. Sameeh’s area of interest is to develop an in situ laser application in drilling, perforation and fracturing, among many other applications with a focus on unconventional reservoirs.
He is an active member of the Society of Petroleum Engineers (SPE), serving the society for several years while holding different positions, including the SPE Executive Advisory Committee Chair, Program Committee and Subcommittee Chair. Sameeh was also
on the board and the Vice Chair for the Western Region USA San Joaquin Valley chapter. His service has been recognized worldwide as he received several awards, including the SPE President Section Award of Excellence, the Regional Service Award, and the Distinguished Membership Award. Sameeh is also a SPE Distinguished Lecturer. He has organized over 54 SPE technical workshops.
Sameeh has authored or coauthored more than 74 articles with high-impact publications, and has an H-Index of 34. He holds 13 granted patents and has 31 patents in progress.
Sameeh received his Ph.D. degree in Petroleum Engineering from the Colorado School of Mines, Golden, CO.
About the Authors
Dr. Sameeh I. Batarseh
Ph.D. in Petroleum Engineering, Colorado School of Mines
Abdullah M. Al-Harith
B.S. degree in Chemistry, University of Indianapolis
Abdullah M. Al-Harith is a Laboratory Technician Specialist working in the Production Technology Division of Saudi Aramco’s Exploration and Petroleum Engineering Center – Advanced Research Center (EXPEC ARC). He has more than 15 years of experience working in different laboratory studies focusing on production enhancement technologies and research, specifically in stimulation and formation damages
studies. In addition, Abdullah works on different unconventional resources research, including water treatment, microwave, laser and acoustic studies to increase oil recovery.
He received his A.S. degree in Industrial Laboratory Techniques from Jubail Industrial College, Jubail, Saudi Arabia. Abdullah received his B.S. degree in Chemistry from the University of Indianapolis, Indianapolis, IN.
Dr. Haitham A. Othman
Ph.D. in Petroleum Engineering, Texas Tech University
Dr. Haitham A. Othman is a Petroleum Engineer working with the Production Technology Team (PTT) of Saudi Aramco’s Exploration and Petroleum Engineering Center – Advanced Research Center (EXPEC ARC). Upon graduation in 2015, Haitham joined the High Power Laser Team. He is working on developing tools
and methods for high power laser applications to tackle several Upstream production challenges.
Haitham has published several technical papers in international conferences.
He received his Ph.D. degree in Petroleum Engineering from Texas Tech University, Lubbock, TX.
Dr. Hameed H. Al-Badairy is currently working as a Research Science Consultant at Saudi Aramco’s Research & Development Center. He has 25 years of academic and industrial experience in the fields of materials science and electron microscopy. Prior to joining Saudi Aramco, Hameed worked for 14 years as a Senior Research Associate at the Department of Materials Science and Engineering, Liverpool University.
He has authored and coauthored three patents, and more than 70 technical papers and articles. Hameed has participated in over 45 conferences/workshops and has been an invited keynote speaker in four
international conferences. He has participated in several technical committees and chaired technical sessions at 13 international and national conferences in America, Africa, and the Middle East.
Hameed is a member of National Association of Corrosion Engineering (NACE), Institute of Materials, Minerals and Mining (IOM3), and the Northwest & Liverpool Engineering Society.
He received his Ph.D. degree in Materials Science and Engineering from the University of Liverpool, Liverpool, U.K.
Dr. Hameed H. Al-Badairy
Ph.D. in Materials Science and Engineering, University of Liverpool
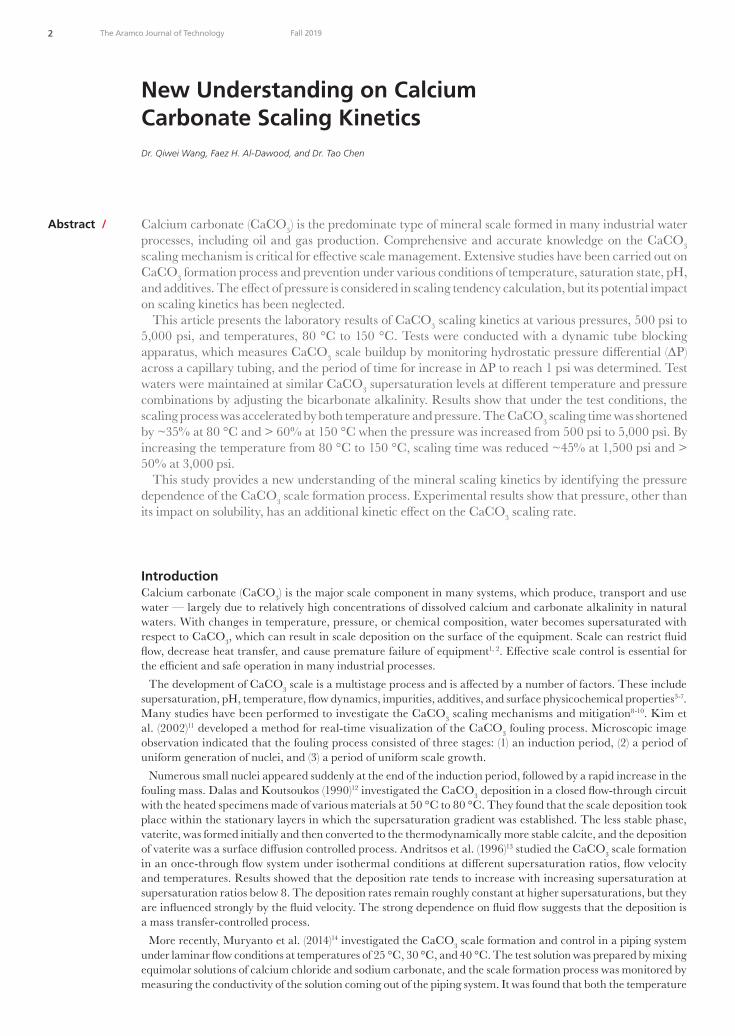
2 The Aramco Journal of Technology Fall 2019
Calcium carbonate (CaCO3) is the predominate type of mineral scale formed in many industrial water processes, including oil and gas production. Comprehensive and accurate knowledge on the CaCO3 scaling mechanism is critical for effective scale management. Extensive studies have been carried out on CaCO3 formation process and prevention under various conditions of temperature, saturation state, pH, and additives. The effect of pressure is considered in scaling tendency calculation, but its potential impact on scaling kinetics has been neglected.
This article presents the laboratory results of CaCO3 scaling kinetics at various pressures, 500 psi to 5,000 psi, and temperatures, 80 °C to 150 °C. Tests were conducted with a dynamic tube blocking apparatus, which measures CaCO3 scale buildup by monitoring hydrostatic pressure differential (∆P) across a capillary tubing, and the period of time for increase in ∆P to reach 1 psi was determined. Test waters were maintained at similar CaCO3 supersaturation levels at different temperature and pressure combinations by adjusting the bicarbonate alkalinity. Results show that under the test conditions, the scaling process was accelerated by both temperature and pressure. The CaCO3 scaling time was shortened by ~35% at 80 °C and > 60% at 150 °C when the pressure was increased from 500 psi to 5,000 psi. By increasing the temperature from 80 °C to 150 °C, scaling time was reduced ~45% at 1,500 psi and > 50% at 3,000 psi.
This study provides a new understanding of the mineral scaling kinetics by identifying the pressure dependence of the CaCO3 scale formation process. Experimental results show that pressure, other than its impact on solubility, has an additional kinetic effect on the CaCO3 scaling rate.
New Understanding on Calcium Carbonate Scaling KineticsDr. Qiwei Wang, Faez H. Al-Dawood, and Dr. Tao Chen
Abstract /
IntroductionCalcium carbonate (CaCO3) is the major scale component in many systems, which produce, transport and use water — largely due to relatively high concentrations of dissolved calcium and carbonate alkalinity in natural waters. With changes in temperature, pressure, or chemical composition, water becomes supersaturated with respect to CaCO3, which can result in scale deposition on the surface of the equipment. Scale can restrict fluid flow, decrease heat transfer, and cause premature failure of equipment1, 2. Effective scale control is essential for the efficient and safe operation in many industrial processes.
The development of CaCO3 scale is a multistage process and is affected by a number of factors. These include supersaturation, pH, temperature, flow dynamics, impurities, additives, and surface physicochemical properties3-7. Many studies have been performed to investigate the CaCO3 scaling mechanisms and mitigation8-10. Kim et al. (2002)11 developed a method for real-time visualization of the CaCO3 fouling process. Microscopic image observation indicated that the fouling process consisted of three stages: (1) an induction period, (2) a period of uniform generation of nuclei, and (3) a period of uniform scale growth.
Numerous small nuclei appeared suddenly at the end of the induction period, followed by a rapid increase in the fouling mass. Dalas and Koutsoukos (1990)12 investigated the CaCO3 deposition in a closed flow-through circuit with the heated specimens made of various materials at 50 °C to 80 °C. They found that the scale deposition took place within the stationary layers in which the supersaturation gradient was established. The less stable phase, vaterite, was formed initially and then converted to the thermodynamically more stable calcite, and the deposition of vaterite was a surface diffusion controlled process. Andritsos et al. (1996)13 studied the CaCO3 scale formation in an once‐through flow system under isothermal conditions at different supersaturation ratios, flow velocity and temperatures. Results showed that the deposition rate tends to increase with increasing supersaturation at supersaturation ratios below 8. The deposition rates remain roughly constant at higher supersaturations, but they are influenced strongly by the fluid velocity. The strong dependence on fluid flow suggests that the deposition is a mass transfer‐controlled process.
More recently, Muryanto et al. (2014)14 investigated the CaCO3 scale formation and control in a piping system under laminar flow conditions at temperatures of 25 °C, 30 °C, and 40 °C. The test solution was prepared by mixing equimolar solutions of calcium chloride and sodium carbonate, and the scale formation process was monitored by measuring the conductivity of the solution coming out of the piping system. It was found that both the temperature

3 The Aramco Journal of TechnologyFall 2019
and fluid flow enhance the scale formation process. Several studies were also carried out to differentiate
the precipitation in bulk solution and deposition on the surface. Chen et al. (2005)15 studied the calcareous scale formation in the bulk solution and on the metal surface in solutions representing typical waters encountered in oil and gas production. A rotating disk electrode was used to quantify the scale formation on the metal surface, and inductively coupled plasma was used for analyzing the quantity of the precipitate formed in the bulk solution. The results demonstrated that bulk precipitation and surface deposition have different dependencies on supersaturation, and it was concluded that two processes should be studied independently.
Wang et al. (2013)16 examined the CaCO3 bulk precipitation, nucleation, and crystal growth on stainless steel and silica materials at different temperatures. The results demonstrated that temperature has a major influence on the formation and growth of CaCO3 crystals, both in the bulk precipitation and on the surface deposition. At 25 °C, a mixture of all three CaCO3 crystalline polymorphs, as well as amorphous particles, was observed in a bulk solution, while only calcite was formed on the surface. At 55 °C, aragonite dominates and the content of calcite increases with time in the bulk solution, and distorted calcite and flowerlike aragonite dominate on the surface.
The researchers concluded that the rhombohedral-shaped calcite more favorably adheres to solid surfaces than other types of crystals, and the scaling process is determined by surface orientation. Surface nucleation occurs on vertically placed surfaces, and sedimentation of particles formed in a bulk solution dominates the deposited layer when the surfaces are oriented horizontally.
Most of the previous studies were carried out at relatively low temperatures (≤ 80 °C) without applied pressure. This article presents the experimental results attained at elevated temperatures — 80 °C to 150 °C — and pressures — 500 psi to 5,000 psi — using a dynamic tube blocking test method. The CaCO3 scaling times at high supersaturation levels were determined at different combinations of pressure and temperature to elucidate their kinetic effects on the scaling process.
ExperimentalExperiments were conducted using a high-pressure, high temperature dynamic tube blocking loop at pressures of 500 psi, 1,500 psi, 3,000 psi, and 5,000 psi, and temperatures of 80 °C, 100 °C, 125 °C, and 150 °C. Cation brine was prepared with divalent metal salts and potassium chloride, and anion brine was initially prepared with sodium sulfate. Sodium chloride salt was divided in the cation and anion brines. Synthetic brines were filtered through the 0.45 m Millipore membrane filter and degassed under vacuum for 2 hours before use.
Sodium bicarbonate was added after the filtration and degassing treatment to minimize dissolved carbon dioxide loss. Cation and anion brines were pumped into the preheating coils separately at 5 ml/min. The preheated brines were mixed in a mixing tee and then
entered into the stainless steel capillary coil (ID = 0.8 mm). The pressure differential (∆P) across the capillary coil was measured continuously and recorded every 10 seconds. Formation of scale deposition was judged by the increase of the ∆P with time, and the scaling time (tscaling) was defined as the time-lapse for the ∆P increase to reach 1 psi from the initially stabilized value. After each run, the scaling coil was cleaned with 10 wt% acetic acid for 15 minutes and deionized water for 20 minutes. The experiments were repeated for all pressure and temperature combinations.
Table 1 lists the initial brine composition used in this study. At 80 °C and 500 psi, the calculated saturation index (SI) for calcite was 1.92 using a measured pH value of 7.45. To maintain the similar SI value, bicarbonate concentrations were adjusted with tests conducted at different conditions to compensate for the changes of thermodynamic constants with pressures and temperatures. Change in the bicarbonate concentration also affected other water chemistry parameters such as the pH, sodium concentration, and total dissolved solids. All of these changes were considered in the scale prediction calculations.
The saturation state of the test brines with respect to CaCO3 (calcite) was calculated using the SI17:
(1)
r = k ´ 1/tscaling (2)
r = A ´ exp(-Ea/RT) (3)
k ´ 1/tscaling = A ´ exp(-Ea/RT) (4)
tscaling = k/A ´ exp(Ea/RT) (5)
ln(tscaling) = ln(k/A) + Ea/RT (6)
ïþ
ïýü
ïî
ïíì
=ïþ
ïýü
ïî
ïíì
º-+-+
-+
P)(T,K
)γ(CO)γ(CaLog
P)(T,K
aaLog)SI(calcite
calcitesp,
CO23Ca
2
10calcitesp,
COCa10
23
223
2
(1)
r = k ´ 1/tscaling (2)
r = A ´ exp(-Ea/RT) (3)
k ´ 1/tscaling = A ´ exp(-Ea/RT) (4)
tscaling = k/A ´ exp(Ea/RT) (5)
ln(tscaling) = ln(k/A) + Ea/RT (6)
ïþ
ïýü
ïî
ïíì
=ïþ
ïýü
ïî
ïíì
º-+-+
-+
P)(T,K
)γ(CO)γ(CaLog
P)(T,K
aaLog)SI(calcite
calcitesp,
CO23Ca
2
10calcitesp,
COCa10
23
223
2
1
where (ion) denotes ion concentration; g represents activity coefficient; and Ksp,calcite(T,P) is the calcite thermodynamic solubility at a given temperature and pressure.
Results and DiscussionTo achieve the similar CaCO3 supersaturation level, the bicarbonate concentration was changed over a range from 160 mg/L for a test at 150 °C and 500 psi to 640
Ion mg/L
Sodium 16,650
Potassium 337
Calcium 3,326
Magnesium 643
Strontium 55
Bicarbonate 270
Sulfate 886
Chloride 32,380
Total Dissolved Solids 54,480
Table 1 Synthetic brine composition used in the study.

4 The Aramco Journal of Technology Fall 2019
mg/L for a test at 80 °C and 5,000 psi. The brine’s pH increased almost linearly with the bicarbonate concentration in this study, Fig. 1. The calculated SI (calcite) values varied within 1.93 ± 0.04. These small variations in SI value shouldn’t have a major impact on
the test results. Also, it should be noted that the CaCO3 was the only inorganic salt showing a scaling tendency (SI > 0) under test conditions.
The dynamic tube blocking test results are summarized in Fig. 2. Duplicate tests showed good reproducibility. The variation in scaling times in repeated tests was less than 10%, or within 3 minutes. The calculated SI values are listed in the figures along with the test pressure.
These experimental results demonstrated that the CaCO3 scaling process can be accelerated by the applied pressure. At 80 °C, the CaCO3 scaling time was ~70 minutes at 500 psi and changed to ~61 minutes at 1,500 psi. With an additional increase in pressure, the scaling time was further reduced to ~52 minutes at 3,000 psi and ~45 minutes at 5,000 psi, Fig. 2a.
At 100 °C, the CaCO3 scaling time at 500 psi was ~58 minutes. When the applied pressure was increased to 1,500 psi and 3,000 psi, the scaling time was decreased to, respectively, ~50 minutes and ~40 minutes. At 5,000 psi, the ∆P increase reached 1 psi after ~31 minutes, Fig. 2b.
At 125 °C, the scaling time was reduced from ~48 minutes at 500 psi to ~41 minutes at 1,500 psi, ~31 minutes at 3,000 psi, and less than 26 minutes at 5,000 psi, Fig. 2c.
Similar behaviors were also noted at 150 °C. The
Fig. 1 Bicarbonate and pH values of the test brines.
0.0
1.0
2.0
3.0
4.0
0 10 20 30 40 50 60 70 80 90
Delte
-P (p
si)
Time (min.)
0.0
1.0
2.0
3.0
4.0
0 10 20 30 40 50 60 70 80
Delte
-P (p
si)
Time (min.)
5,000 psi (1.96)
3,000 psi (1.96) 1,500 psi
(1.95)
500 psi (1.97)
(a) 80 °C
5,000 psi (1.90)
3,000 psi (1.91)
1,500 psi (1.93)
500 psi (1.95) (b) 100 °C
Fig. 2 Summary of dynamic tube blocking test results (SI value inside parenthesis).
0.0
1.0
2.0
3.0
4.0
0 10 20 30 40 50 60 70
Delte
-P (p
si)
Time (min.)
0.0
1.0
2.0
3.0
4.0
0 10 20 30 40 50 60
Delte
-P (p
si)
Time (min.)
5,000 psi (1.94) 3,000 psi
(1.96)
1,500 psi (1.93) (c) 125 °C 500 psi
(1.92)
5,000 psi (1.96)
3,000 psi (1.96)
1,500 psi (1.95)
500 psi (1.97)
(d) 150 °C
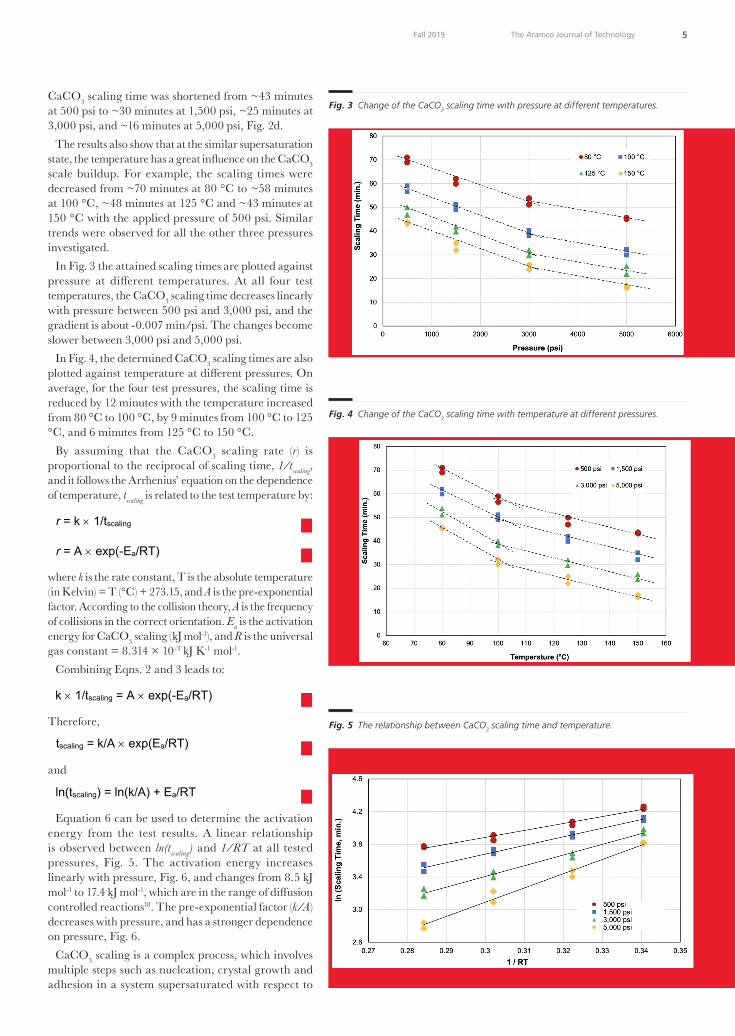
5 The Aramco Journal of TechnologyFall 2019
CaCO3 scaling time was shortened from ~43 minutes at 500 psi to ~30 minutes at 1,500 psi, ~25 minutes at 3,000 psi, and ~16 minutes at 5,000 psi, Fig. 2d.
The results also show that at the similar supersaturation state, the temperature has a great influence on the CaCO3 scale buildup. For example, the scaling times were decreased from ~70 minutes at 80 °C to ~58 minutes at 100 °C, ~48 minutes at 125 °C and ~43 minutes at 150 °C with the applied pressure of 500 psi. Similar trends were observed for all the other three pressures investigated.
In Fig. 3 the attained scaling times are plotted against pressure at different temperatures. At all four test temperatures, the CaCO3 scaling time decreases linearly with pressure between 500 psi and 3,000 psi, and the gradient is about -0.007 min/psi. The changes become slower between 3,000 psi and 5,000 psi.
In Fig. 4, the determined CaCO3 scaling times are also plotted against temperature at different pressures. On average, for the four test pressures, the scaling time is reduced by 12 minutes with the temperature increased from 80 °C to 100 °C, by 9 minutes from 100 °C to 125 °C, and 6 minutes from 125 °C to 150 °C.
By assuming that the CaCO3 scaling rate (r) is proportional to the reciprocal of scaling time, 1/tscaling, and it follows the Arrhenius’ equation on the dependence of temperature, tscaling is related to the test temperature by:
(1)
r = k ´ 1/tscaling (2)
r = A ´ exp(-Ea/RT) (3)
k ´ 1/tscaling = A ´ exp(-Ea/RT) (4)
tscaling = k/A ´ exp(Ea/RT) (5)
ln(tscaling) = ln(k/A) + Ea/RT (6)
ïþ
ïýü
ïî
ïíì
=ïþ
ïýü
ïî
ïíì
º-+-+
-+
P)(T,K
)γ(CO)γ(CaLog
P)(T,K
aaLog)SI(calcite
calcitesp,
CO23Ca
2
10calcitesp,
COCa10
23
223
2
2
(1)
r = k ´ 1/tscaling (2)
r = A ´ exp(-Ea/RT) (3)
k ´ 1/tscaling = A ´ exp(-Ea/RT) (4)
tscaling = k/A ´ exp(Ea/RT) (5)
ln(tscaling) = ln(k/A) + Ea/RT (6)
ïþ
ïýü
ïî
ïíì
=ïþ
ïýü
ïî
ïíì
º-+-+
-+
P)(T,K
)γ(CO)γ(CaLog
P)(T,K
aaLog)SI(calcite
calcitesp,
CO23Ca
2
10calcitesp,
COCa10
23
223
2
3
where k is the rate constant, T is the absolute temperature (in Kelvin) = T (°C) + 273.15, and A is the pre-exponential factor. According to the collision theory, A is the frequency of collisions in the correct orientation. Ea is the activation energy for CaCO3 scaling (kJ mol-1), and R is the universal gas constant = 8.314 × 10⁻³ kJ K-1 mol-1.
Combining Eqns. 2 and 3 leads to:
(1)
r = k ´ 1/tscaling (2)
r = A ´ exp(-Ea/RT) (3)
k ´ 1/tscaling = A ´ exp(-Ea/RT) (4)
tscaling = k/A ´ exp(Ea/RT) (5)
ln(tscaling) = ln(k/A) + Ea/RT (6)
ïþ
ïýü
ïî
ïíì
=ïþ
ïýü
ïî
ïíì
º-+-+
-+
P)(T,K
)γ(CO)γ(CaLog
P)(T,K
aaLog)SI(calcite
calcitesp,
CO23Ca
2
10calcitesp,
COCa10
23
223
2
4
Therefore,
(1)
r = k ´ 1/tscaling (2)
r = A ´ exp(-Ea/RT) (3)
k ´ 1/tscaling = A ´ exp(-Ea/RT) (4)
tscaling = k/A ´ exp(Ea/RT) (5)
ln(tscaling) = ln(k/A) + Ea/RT (6)
ïþ
ïýü
ïî
ïíì
=ïþ
ïýü
ïî
ïíì
º-+-+
-+
P)(T,K
)γ(CO)γ(CaLog
P)(T,K
aaLog)SI(calcite
calcitesp,
CO23Ca
2
10calcitesp,
COCa10
23
223
2
5
and
(1)
r = k ´ 1/tscaling (2)
r = A ´ exp(-Ea/RT) (3)
k ´ 1/tscaling = A ´ exp(-Ea/RT) (4)
tscaling = k/A ´ exp(Ea/RT) (5)
ln(tscaling) = ln(k/A) + Ea/RT (6)
ïþ
ïýü
ïî
ïíì
=ïþ
ïýü
ïî
ïíì
º-+-+
-+
P)(T,K
)γ(CO)γ(CaLog
P)(T,K
aaLog)SI(calcite
calcitesp,
CO23Ca
2
10calcitesp,
COCa10
23
223
2
6
Equation 6 can be used to determine the activation energy from the test results. A linear relationship is observed between ln(tscaling) and 1/RT at all tested pressures, Fig. 5. The activation energy increases linearly with pressure, Fig. 6, and changes from 8.5 kJ mol-1 to 17.4 kJ mol-1, which are in the range of diffusion controlled reactions18. The pre-exponential factor (k/A) decreases with pressure, and has a stronger dependence on pressure, Fig. 6.
CaCO3 scaling is a complex process, which involves multiple steps such as nucleation, crystal growth and adhesion in a system supersaturated with respect to
Fig. 3 Change of the CaCO3 scaling time with pressure at different temperatures.
Fig. 4 Change of the CaCO3 scaling time with temperature at different pressures.
Fig. 5 The relationship between CaCO3 scaling time and temperature.

6 The Aramco Journal of Technology Fall 2019
CaCO3, Fig. 7. While supersaturation is the prerequisite, it does not directly guide the scale formation. The process begins via nucleation. For nucleation to proceed, an energy barrier resulting from the cost of creating an interface between the new phase and the surrounding matrix has to be overcome.
At low supersaturations, heterogeneous nucleation on the existing surface is favored because it requires less energy. As supersaturation increases, homogeneous nucleation in a bulk solution gradually becomes the dominant mechanism. A scale layer is formed through simultaneous crystal growth and adhesion of the microsized particles.
In highly supersaturated solutions, CaCO3 nucleation
may follow a multiple step pathway, Fig. 819. Gebauer et al. (2008)20 showed that the composition of a highly supersaturated solution is more complex than the classical thermodynamic models. Aqueous species larger than ion pairs are present in the solution and nucleation occurs via aggregation of these the “pre-nucleation clusters,” in contrast to the classical theory, which treats the nucleation process as successive and reversible attachments of single ions or molecules, i.e., monomers, to and from the new phase.
Many studies have been published on the temperature impacts of CaCO3 nucleation and crystal growth in bulk solutions and surface deposition at relatively low temperatures — ≤ 80 °C. The impact of pressure on thermodynamics is well understood, but its influence on CaCO3 reaction kinetics is rarely studied. It has been recently reported that the nucleation rate of sulfate minerals is a strong function of applied pressure, and the nucleation time at very high-pressure, e.g., 15,000 psi, could be more than two orders of magnitude faster than expected when the kinetic effect of the pressure is neglected21, 22. It was also found that the crystal growth of barite increases with pressure22.
Considering the high supersaturation level and high temperatures, it is postulated that the rate controlling step of the CaCO3 scaling process in this study is the adhesion reaction. More studies are required to confirm this hypothesis and understand how pressure affects the adhesion kinetics.
It is worth noting that for a given water composition, the scaling kinetics is slowed by pressure, due to the reduction in the superstation degree. The pressure influence on the CaCO3 solubility is more significant than on the kinetic factors revealed here.
ConclusionsThe scaling kinetics of CaCO3 is investigated over a temperature range of 80 °C to 150 °C, and a pressure range of 500 psi to 5,000 psi at similar thermodynamic driving forces (supersaturation level). Results obtained in this study show that:
• Pressure has a kinetic effect on the CaCO3 scaling rate. At a given saturation state and temperature, the CaCO3 scaling process increases with pressure.
• Temperature has a significant impact on the CaCO3 scaling kinetics, even at the same supersaturation level.
• The activation energy of CaCO3 scaling is 8.5 kJ mol-1 to 17.4 kJ mol-1 under test conditions of this study, which is in the range of diffusion controlled reactions.
These results suggest that in the scaling risk assessment, the kinetic effect of pressure should be considered, especially for high-pressure applications.
AcknowledgmentsThe authors would like to thank the management of Saudi Aramco for their support and permission to publish this article. The authors would also like to thank Mohammed Ghzwani, Tawfiq Shafai, and Ammar Sowaygh for their contributions in lab testing.
Fig. 6 Change of activation energy and ln(k/A) with pressures.
Fig. 7 Illustration of the scale formation process. Fig. 8 Classical and multiple step (nonclassical) CaCO3 nucleation pathways.
Scale
Heterogeneous nucleation
Supersaturation
Homogeneous nucleation
Crystal Growth
Deposition
Reversible addition of ions to cluster
Nucleus
Addition of ions to nucleus
Supersaturated solution
Multiple step
pathway
Classical pathway
Nanocrystals Nanodroplets Polymers
Oriented aggregates Amorphous Dense liquid droplets
Crystal
Fig. 7 Illustration of the scale formation process.

7 The Aramco Journal of TechnologyFall 2019
References1. Vetter, O.J.: “Oil Field Scale — Can We Handle It?”
Journal of Petroleum Engineers, Vol. 28, Issue 12, December 1976, pp. 1402-1408.
2. Hinrichsen, C.J.: “Preventing Scale Deposition in Oil Production Facilities: An Industry Review,” paper presented at CORROSION 98, San Diego, California, March 22-27, 1998.
3. MacAdam, J. and Parsons, S.A.: “Calcium Carbonate Scale Formation and Control,” Reviews in Environmental Science & Bio/Technology, Vol. 3, Issue 2, June 2004, pp. 159-169.
4. MacAdam, J. and Parsons, S.A.: “Calcium Carbonate Scale Control, Effect of Material and Inhibitors,” Water Science Technology, Vol. 49, Issue 2, 2004, pp. 153-159.
5. Zhang, Y., Shaw, H., Farquhar, R. and Dawe, R.: “The Kinetics of Carbonate Scaling — Application for the Prediction of Downhole Carbonate Scaling,” Journal of Petroleum Science and Engineering, Vol. 29, Issue 2, April 2001, pp. 85-95.
6. Chen, T., Wang, Q. and Chang, F.: “CaCO3 Scale Risk Assessment — Thermodynamics vs. Kinetics,” paper presented at CORROSION 2016, Vancouver, British Columbia, Canada, March 6-10, 2016.
7. Ferguson, R.J. and Standish, C.: “Developing Test Methods for Modeling Scale Inhibitor Minimum Effective Dosage: Calcium Carbonate,” paper presented at CORROSION 2018, Phoenix, Arizona, April 15-19, 2018.
8. Amjad, Z. and Zuhl, R.W.: “Kinetic and Morphological Investigation on the Precipitation of Calcium Carbonate in the Presence of Inhibitors,” paper presented at CORROSION 2006, San Diego, California, March 12-16, 2006.
9. Amjad, Z.: “Influence of Iron Oxide (Rust) on the Performance of Phosphonates as Calcium Carbonate Inhibitors,” paper presented at CORROSION 2016, Vancouver, British Columbia, Canada, March 6-10, 2016.
10. Natsi, P.D., Rokidi, S. and Koutsoukos, P.G.: “Calcium Carbonate Scale Formation and Prevention in Aqueous Solutions and Mixed Solvents,” paper presented at
CORROSION 2016, Vancouver, British Columbia, Canada, March 6-10, 2016.
11. Kim, W.T., Bai, C. and Cho, Y.I.: “A Study of CaCO3 Fouling with a Microscopic Imaging Technique,” International Journal of Heat and Mass Transfer, Vol. 45, Issue 3, January 2002, pp. 597-607.
12. Dalas, E. and Koutsoukos, P.G.: “Calcium Carbonate Scale Formation and Prevention in a Flow-through System at Various Temperatures,” Desalination, Vol. 78, Issue 3, October 1990, pp. 403-416.
13. Andritsos, N., Kontopoulou, M., Karabelas, A.J. and Koutsoukos, P.G.: “Calcium Carbonate Deposit Formation under Isothermal Conditions,” The Canadian Journal of Chemical Engineering, Vol. 74, Issue 6, December 1996, pp. 911-919.
14. Muryanto, S., Bayuseno, A.P., Ma’mun, H., Usamah, M., et al.: “Calcium Carbonate Scale Formation in Pipes: Effect of Flow Rates, Temperature, and Malic Acid as Additives on the Mass and Morphology of the Scale,” Procedia Chemistry, Vol. 9, December 2014, pp. 69-76.
15. Chen, T., Neville, A. and Yuan, M.: “Calcium Carbonate Scale Formation — Assessing the Initial Stages of Precipitation and Deposition,” Journal of Petroleum Science and Engineering, Vol. 46, Issue 3, March 2005, pp. 185-194.
16. Wang, H., Alfredsson, V., Tropsch, J., Ettl, R., et al.: “Formation of CaCO3 Deposits on Hard Surfaces — Effect of Bulk Solution Conditions and Surface Properties,” ACS Applied Materials Interfaces, Vol. 5, Issue 10, 2013, pp. 4035-4045.
17. Kan, A.T. and Tomson, M.B.: “Scale Prediction for Oil and Gas Production,” SPE Journal, Vol. 17, Issue 2, June 2012, pp. 362-378.
18. Mullin, J.W.: Crystallization, 4th edition, Boston: Butterworth-Heinemann, 2001, 600 p.
19. Koishi, A.: “Carbonate Mineral Nucleation Pathways,” Ph.D. Dissertation, University of Grenoble, October 2017, 174 p.
Fig. 8 Classical and multiple step (nonclassical) CaCO3 nucleation pathways.

8 The Aramco Journal of Technology Fall 2019
20. Gebauer, D., Völkel, A. and Cölfen, H.: “Stable Prenucleation Calcium Carbonate Clusters,” Science, Vol. 322, Issue 5909, December 2008, pp. 1819-1822.
21. Bhandari, N., Kan, A.T., Zhang, F., Dai, Z., et al.: “The Effect of Pressure and TDS on Barite Scaling Kinetics,” SPE paper 173790, presented at the SPE International Symposium on Oil Field Chemistry, The Woodlands, Texas, April 13-15, 2015.
22. Bhandari, N., Kan, A.T., Dai, Z., Zhang, F., et al.: “Effect of Hydrodynamic Pressure on Mineral Precipitation Kinetics and Scaling Risk at HPHT,” SPE paper 179873, presented at the SPE International Oil Field Scale Conference and Exhibition, Aberdeen, Scotland, U.K., May 11-12, 2016.
Dr. Qiwei Wang works in Saudi Aramco’s Research & Development Center as a Science Specialist in oil field scale mitigation. Since joining Saudi Aramco in 2011, he has played a key role in all major scale mitigation activities and led the completion of over 60 projects. Before joining Saudi Aramco, Qiwei worked for Nalco Champion as a R&D Coordinator on flow management and as a Senior Specialist on scale management. He has over 25 years of R&D and technical support experience in oil field production chemistry, scale management, and water treatment.
Qiwei is an active member of the Society of Petroleum Engineers (SPE) and National Association of
Corrosion Engineers (NACE). He has organized workshops, served on technical committees, and has chaired several conferences for both organizations.
He has authored and coauthored over 140 publications and 16 U.S. patent applications.
Qiwei received his B.Eng. degree in Chemical Engineering from Taiyuan University of Science and Technology, Taiyuan, China; an M.Eng. degree in Material Sciences from Harbin Institute of Technology, Harbin, China; an M.S. degree in Chemistry from the University of Ryukyus, Okinawa, Japan; and a Ph.D. degree in Oceanography from Texas A&M University, College Station, TX.
About the Authors
Dr. Qiwei Wang
Ph.D. in Oceanography, Texas A&M University
Faez H. Al-Dawood
B.S. in Chemistry with Chemical Engineering, University of Huddersfield
Faez H. Al-Dawood joined Saudi Aramco in May 1998 as a Lab Scientist working within the Chemical Analysis Unit/Oil Field Scale Group at Saudi Aramco’s Research and Development Center. During this time, he was involved in scale research projects. Throughout his career, Faez has gained experience in laboratory testing on geophysical properties of core plugs, well stimulation and fracturing, and scale formation and control. His area of expertise includes scale prediction,
prevention, and monitoring. Currently, Faez is working as a Chemist at the
Analytical Laboratory Unit in the Ras Tanura Cluster Shared Services Department, where his focus in on troubleshooting downstream process operations.
Faez received his B.S. degree in Chemistry with Chemical Engineering from the University of Huddersfield, Huddersfield, U.K.
Dr. Tao Chen
Ph.D. in Chemical Engineering, Heriot-Watt University
Dr. Tao Chen is a Petroleum Engineering Specialist working with the Production Technology Team of Saudi Aramco’s Exploration and Petroleum Engineering Center – Advanced Research Center (EXPEC ARC). His interests are production chemistry and flow assurance in the oil and gas industry, specializing in oil field scale management.
Prior to joining Saudi Aramco in 2014, Tao spent more than 15 years on oil field scale management and worked at Clariant, Champion Technologies, Nalco
Champion, and LR Senergy in Aberdeen, U.K.He has published nearly 90 technical publications
about scale management in oil fields.Tao received both his B.S. and M.S. degrees in
Chemical Engineering from Dalian University of Technology, China, and his Ph.D. degree in Chemical Engineering from Heriot-Watt University, Edinburgh, U.K. Tao also received an MBA from Warwick University, Coventry, U.K.

2 The Aramco Journal of Technology Fall 2019
Polymer flooding is one of the most mature enhanced oil recovery methods. In such projects, polymer consumption — a requirement — depends heavily on polymer retention. Retention is commonly measured through single-phase displacement experiments. Often, clean cores, i.e., not preserved nor restored, are used in such experiments. Recent studies in sandstones suggest that neglecting residual oil affects the polymer retention estimates, which are substantially exaggerated. Moreover, the effects of wettability on retention estimates have not been addressed. In this study, we study the retention of a sulfonated polyacrylamide (PAM) polymer in carbonate. We focus on investigating the effects of residual oil and wettability. Both single-phase and two-phase (at residual oil) displacement experiments were performed at reservoir conditions using representative reservoir fluids and core samples. Double banks of polymer solution with a potassium iodine (KI) tracer were injected. The effluent polymer and tracer concentrations were analyzed to determine the polymer retention and inaccessible pore volumes (IPVs).
Results show that the studied polymer in the carbonate cores exhibits relatively low retention, ranging from 26 µg/g-rock to 60.8 µg/g-rock. The IPV ranges from 11% PV to 12% PV. This demonstrates the potential of this polymer for carbonate reservoir applications. The presence of residual oil significantly reduces polymer retention; a reduction of more than 50% was observed in this study. Subsequently, the residual oil has an insignificant impact on the polymer’s IPV.
The results in this work demonstrate that wettability has negligible effects on polymer retention estimates, while the presence of residual oil has a positive impact on polymer retention. While we still believe single-phase displacement experiments provide a quick robust route to obtain retention estimates, the conservative nature of those estimates should be kept in mind or factored in for the upscaling and design of polymer flooding projects.
Wettability and Residual Oil Effects on Polymer Retention EstimatesDr. Jinxun Wang and Dr. Abdulkarim M. Al-Sofi
Abstract /
IntroductionPolymer flooding is one of the most mature enhanced oil recovery methods. It has been successfully applied in different reservoirs worldwide1-8. The water soluble polymer viscosifies the injection water, leading to a more favorable mobility ratio. Therefore, polymer flooding achieves enhanced oil mobilization through improving macroscopic sweep efficiency. One of the key parameters in determining the feasibility of a polymer flooding project is polymer retention. The retention will delay the polymer propagation through porous media. In addition to delaying the oil displacement by polymer flooding, high polymer retention also means more polymer consumption.
The retention of polymer in porous media is usually attributed to physical surface adsorption, mechanical entrapment and hydrodynamic retention9. Generally, polymer adsorption is the main retention mechanism in common reservoir applications. The polymer retention is influenced by many properties of rock, polymer, and reservoir fluids. Manichand and Seright (2014)10 reviewed many of the key influencing factors on polymer retention in porous media. Literature research has shown that the clay content, the rock surface charge, and the accessible surface area play more significant roles in polymer retention11-14. The presence of clay minerals may significantly increase polymer retention.
Physical adsorption is directly related to the rock surface area and ion charges. Polymer properties that may impact polymer retention include the polymer type, molecular weight, and architecture8, 11, 14, 15. The polymer concentration also has some impact on retention in porous media, depending on the concentration range16-19. The higher brine salinity tends to increase the retention of hydrolyzed polyacrylamide (HPAM) polymer20, and the presence of divalent cation may increase the adsorption of HPAM onto quartzite. The effects of lower salinity SmartWater on polymer retention, as well as the propagation and injectivity, was investigated by AlSofi et al. (2018)21. There are also some studies on the effects of residual oil and wettability on polymer retention, but contradictory results of their impacts have been reported. Broseta et al. (1995)22 found that residual oil has an insignificant effect on the retention of PAM in water-wet sandpacks. Another study23 showed that the presence of residual oil increased the retention of xanthan on water-wet Berea sandstone. The results by Broseta et al. (1995)22 showed residual oil increased HPAM retention in oil-wet cores; however, some other research24, 25 found that the presence of residual oil reduced polymer retention in porous media.
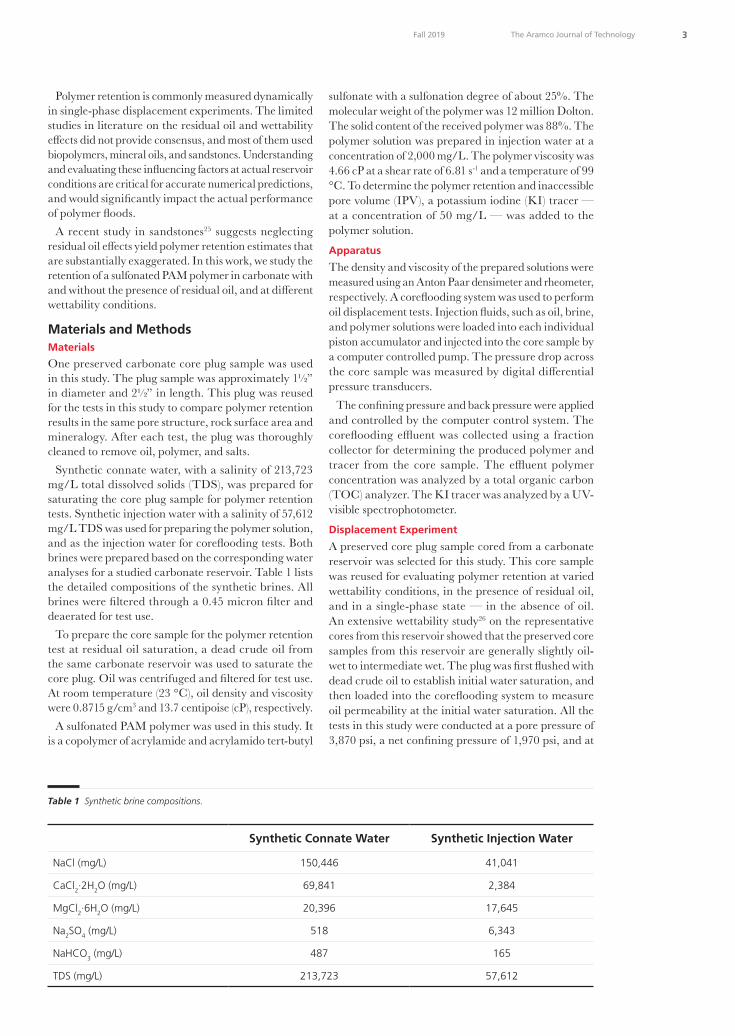
3 The Aramco Journal of TechnologyFall 2019
Polymer retention is commonly measured dynamically in single-phase displacement experiments. The limited studies in literature on the residual oil and wettability effects did not provide consensus, and most of them used biopolymers, mineral oils, and sandstones. Understanding and evaluating these influencing factors at actual reservoir conditions are critical for accurate numerical predictions, and would significantly impact the actual performance of polymer floods.
A recent study in sandstones25 suggests neglecting residual oil effects yield polymer retention estimates that are substantially exaggerated. In this work, we study the retention of a sulfonated PAM polymer in carbonate with and without the presence of residual oil, and at different wettability conditions.
Materials and MethodsMaterials
One preserved carbonate core plug sample was used in this study. The plug sample was approximately 1½” in diameter and 2½” in length. This plug was reused for the tests in this study to compare polymer retention results in the same pore structure, rock surface area and mineralogy. After each test, the plug was thoroughly cleaned to remove oil, polymer, and salts.
Synthetic connate water, with a salinity of 213,723 mg/L total dissolved solids (TDS), was prepared for saturating the core plug sample for polymer retention tests. Synthetic injection water with a salinity of 57,612 mg/L TDS was used for preparing the polymer solution, and as the injection water for coreflooding tests. Both brines were prepared based on the corresponding water analyses for a studied carbonate reservoir. Table 1 lists the detailed compositions of the synthetic brines. All brines were filtered through a 0.45 micron filter and deaerated for test use.
To prepare the core sample for the polymer retention test at residual oil saturation, a dead crude oil from the same carbonate reservoir was used to saturate the core plug. Oil was centrifuged and filtered for test use. At room temperature (23 °C), oil density and viscosity were 0.8715 g/cm3 and 13.7 centipoise (cP), respectively.
A sulfonated PAM polymer was used in this study. It is a copolymer of acrylamide and acrylamido tert-butyl
sulfonate with a sulfonation degree of about 25%. The molecular weight of the polymer was 12 million Dolton. The solid content of the received polymer was 88%. The polymer solution was prepared in injection water at a concentration of 2,000 mg/L. The polymer viscosity was 4.66 cP at a shear rate of 6.81 s-1 and a temperature of 99 °C. To determine the polymer retention and inaccessible pore volume (IPV), a potassium iodine (KI) tracer — at a concentration of 50 mg/L — was added to the polymer solution.
Apparatus
The density and viscosity of the prepared solutions were measured using an Anton Paar densimeter and rheometer, respectively. A coreflooding system was used to perform oil displacement tests. Injection fluids, such as oil, brine, and polymer solutions were loaded into each individual piston accumulator and injected into the core sample by a computer controlled pump. The pressure drop across the core sample was measured by digital differential pressure transducers.
The confining pressure and back pressure were applied and controlled by the computer control system. The coreflooding effluent was collected using a fraction collector for determining the produced polymer and tracer from the core sample. The effluent polymer concentration was analyzed by a total organic carbon (TOC) analyzer. The KI tracer was analyzed by a UV-visible spectrophotometer.
Displacement Experiment
A preserved core plug sample cored from a carbonate reservoir was selected for this study. This core sample was reused for evaluating polymer retention at varied wettability conditions, in the presence of residual oil, and in a single-phase state — in the absence of oil. An extensive wettability study26 on the representative cores from this reservoir showed that the preserved core samples from this reservoir are generally slightly oil-wet to intermediate wet. The plug was first flushed with dead crude oil to establish initial water saturation, and then loaded into the coreflooding system to measure oil permeability at the initial water saturation. All the tests in this study were conducted at a pore pressure of 3,870 psi, a net confining pressure of 1,970 psi, and at
Synthetic Connate Water Synthetic Injection Water
NaCl (mg/L) 150,446 41,041
CaCl2∙2H2O (mg/L) 69,841 2,384
MgCl2∙6H2O (mg/L) 20,396 17,645
Na2SO4 (mg/L) 518 6,343
NaHCO3 (mg/L) 487 165
TDS (mg/L) 213,723 57,612
Table 1 Synthetic brine compositions.

4 The Aramco Journal of Technology Fall 2019
a temperature of 99 °C. Waterflooding was first conducted using injection water
at a constant flow rate of 0.5 ml/min to reach residual oil condition, and then followed by a polymer retention test in the presence of residual oil, and at the initial wettability condition. Around 10 PV of polymer solution was injected, and then followed by post-waterflooding using injection water. The coreflooding effluent was collected for chemical concentration analysis. After the test, a Dean-Stark analysis was performed on the core sample to determine the volumes of residual fluids in the core. The basic properties of the core sample, e.g., grain density, ambient porosity, and air permeability, were finally measured after the oil, polymer, and salts in the core were thoroughly cleaned.
After oil was removed from the core sample using toluene, an oxidant degradation method was used to clean the polymer. The plug was flushed with more than 10 PV of the mixture of 2% sodium hypochlorite and 2% potassium chloride (KCl). Then the sample was submerged under the same solution in a sealed container, and put into a 95 °C oven for 2 hours. After that, the plug was then flushed with 5 PV of 2% KCl; and finally, the salts in the core were cleaned out using methanol.
A second round of polymer retention tests were performed on the cleaned plug in a single-phase displacement test — without residual oil. Double banks of polymer with a KI tracer were injected. Between the two chemical banks, extensive waterflooding was conducted to remove all mobile polymers and tracers. The effluents were collected for determining the produced polymer and tracer concentrations during all of these injection processes. After the test, the same core sample cleaning sequence as that used in the first round of testing was applied, except for the oil cleaning step. Finally, the porosity, grain density, and air permeability of the dried core sample were measured.
Following that, a third round of polymer retention tests were conducted in the presence of residual oil and at water-wet conditions. The core plug sample was first fully saturated with the synthetic connate water under vacuum, and then desaturated to initial water saturation by centrifugation. After saturation with dead crude oil, the core sample was loaded into the coreflooding system and further flushed with dead oil to measure the oil permeability at initial water saturation. Waterflooding was then conducted to reach residual oil saturation. Following that, a polymer retention test in the presence of residual oil was performed. Since the plug was prepared without aging for wettability restoration, it was assumed that the core sample was at a water-wet condition. Similarly, two banks of polymer/tracer were injected for evaluating polymer retention and IPV. The coreflooding effluents were collected to determine the produced polymer and tracer during the polymer retention test.
Polymer Retention and IPV
Different methods have been applied to evaluate the polymer retention and IPV in the literature10, 13, 19, 23, 27-30. In this study, we used both the material balance and the
double bank methods for assessing the polymer retention. The material balance method requires the injection of
only one polymer slug followed by a post-flush with brine. The retention of polymer can be determined by evaluating the total polymer loss to the core sample during the displacement test. The total amount of polymer retained in the core sample is calculated by subtracting the total amount of polymer produced from the total amount of polymer injected.
In the double bank method, one bank of polymer with a tracer is injected first, and is followed by brine injection to displace all the mobile polymers and tracers. After that, a second bank of polymer and a tracer is injected. The double bank method is used to distinguish the delaying effect caused by polymer retention and the accelerating effect caused by the polymer’s IPV. It is usually observed that the breakthrough of polymer is retarded compared to that of the tracer during the first polymer bank injection, whereas the opposite occurs during the second bank injection.
It is assumed that polymer retention occurs only in the first polymer injection cycle, and the IPV dominates the propagation of polymer during the second injection cycle. Only the front part of the effluent concentration profiles during the two injection cycles are used to evaluate the polymer retention and IPV. The IPV is determined by the difference between the polymer and tracer breakout curves during the second injection cycle. The polymer retention can be determined by a few different approaches. We used the difference between the polymer concentration breakthroughs during the two injection cycles.
We used the TOC method for analyzing polymer concentrations in the effluents after the coreflooding test. The effluent’s KI tracer concentration was analyzed by using an UV-visible spectrophotometer at the wavelength of 230 nm.
Results and DiscussionPolymer retention was evaluated at reservoir conditions with and without residual oil, and at varied wettability conditions. The first test (Run 1) was conducted using the core at a preserved state, and in the presence of residual oil. Its wettability is slightly oil-wet to intermediate wet. The second test (Run 2) was performed in a single-phase state — absence of oil — and at a water-wet state. The third test (Run 3) was conducted on a water-wet state, and in the presence of residual oil.
The first test, Run 1, started with preparing a preserved carbonate core plug to reach a residual oil state. The plug was loaded into a coreflooding system, and extensive waterflooding — more than 20 PV — was conducted at reservoir conditions. At the end of the waterflooding, rate bumps were performed to ensure no more oil could be produced by injection water. After that, approximately 10 PVs of polymer solution was injected, and then followed by a post-flush using injection water. The coreflooding effluents during the polymer injection and post-waterflooding processes were analyzed for overall polymer concentration.

5 The Aramco Journal of TechnologyFall 2019
Figure 1 shows the results of the effluent polymer concentration profile. In this plot, the normalized effluent polymer concentration — the ratio of the effluent concentration to the injected concentration — is plotted as a function of the fluid injected. The plots start from the beginning of the polymer injection and end when the effluent polymer concentration is negligible. Only one polymer slug was injected in this test, therefore, polymer retention was determined using the material balance method. The estimated polymer retention in this test was 29.9 µg/g-rock.
The second test, Run 2, was performed as a single-phase displacement. In other words, the polymer retention was evaluated on the water-wet core and in the absence of oil. Double banks of polymer/tracer were injected for the evaluation.
Figure 2 presents the profiles of polymer and tracer fronts during the two cycles of chemical injection. The effluent concentration at 50% of the injected concentration was used to determine the front breakthrough. From the difference between the polymer and tracer breakthroughs during the second injection cycle, it was estimated that the IPV of this test was 11% PV. The polymer retention was determined from the difference between the two polymer fronts during the two injection cycles. It was calculated to be 60.8 µg/g-rock. The material balance method was also used to estimate the polymer retention from the polymer profile during the first injection cycle.
Figure 3 shows the polymer profile during the first polymer/tracer bank followed by the waterflooding processes. Using this polymer profile, the material balance method determined the polymer retention was 58.5 µg/g-rock, which was very close to the results by the double bank method.
In the third test, Run 3, the polymer retention was evaluated in a water-wet state and in the presence of residual oil. After the initial water saturation state was established in the thoroughly cleaned core plug, without aging, extensive waterflooding was performed at reservoir conditions to reach residual oil saturation. Flow rate bumps was also conducted to ensure no more oil is produced by water injection. Polymer retention was evaluated by injecting double banks of polymer/tracer at reservoir conditions.
Figure 4 shows the profiles of polymer and tracer fronts during the two cycles of chemical injection. The polymer’s IPV was determined from the difference between the polymer and tracer breakthroughs during the second injection cycle, and it was approximately 12% PV. From the difference between the two polymer fronts during the two injection cycles, the polymer retention of this test was determined to be 26 µg/g-rock.
Table 2 summarizes the results of all three tests. In general, the retention of the studied polymer in carbonate is relatively low, ranging from 26 µg/g-rock to 60.8 µg/g-rock. The polymer retention determined from the single-phase displacement test was around two times higher than those measured in the presence of residual oil. Both tests of Run 1 and Run 3 were conducted in the presence of residual oil. Although they have varied wettability
Saudi Aramco: Company General Use
Synthetic Connate Water Synthetic Injection Water NaCl (mg/L) 150,446 41,041 CaCl2∙2H2O (mg/L) 69,841 2,384 MgCl2∙6H2O (mg/L) 20,396 17,645 Na2SO4 (mg/L) 518 6,343 NaHCO3 (mg/L) 487 165 TDS (mg/L) 213,723 57,612
Table 1 Synthetic brine compositions.
Fig. 1 The polymer concentration profile of test Run 1.
0.0
0.2
0.4
0.6
0.8
1.0
1.2
0 5 10 15 20
Nor
mal
ized
Pol
ymer
Con
cent
ratio
n (F
ract
ion)
Fluid Injected (PV)
Fig. 1 The polymer concentration profile of test Run 1.
Saudi Aramco: Company General Use
Fig. 2 The polymer and tracer front concentration profiles during the two cycles of chemical injection, test Run 2.
Fig. 3 The polymer concentration profile of Run 2 during the first injection cycle.
0.0
0.2
0.4
0.6
0.8
1.0
1.2
0.0 0.5 1.0 1.5 2.0 2.5 3.0 3.5 4.0 4.5 5.0
Nor
mal
ized
Effl
uent
Con
cent
ratio
ns
(Fra
ctio
n)
Fluid Injected (PV)
1st tracer front
1st polymer front
2nd Tracer Front
2nd Polymer Front
0.0
0.2
0.4
0.6
0.8
1.0
1.2
0 2 4 6 8 10 12
Nor
mal
ized
Pol
ymer
Con
cent
ratio
n (F
ract
ion)
Fluid Injected (PV)
Fig. 2 The polymer and tracer front concentration profiles during the two cycles of chemical injection, test Run 2.
Saudi Aramco: Company General Use
Fig. 2 The polymer and tracer front concentration profiles during the two cycles of chemical injection, test Run 2.
Fig. 3 The polymer concentration profile of Run 2 during the first injection cycle.
0.0
0.2
0.4
0.6
0.8
1.0
1.2
0.0 0.5 1.0 1.5 2.0 2.5 3.0 3.5 4.0 4.5 5.0
Nor
mal
ized
Effl
uent
Con
cent
ratio
ns
(Fra
ctio
n)
Fluid Injected (PV)
1st tracer front
1st polymer front
2nd Tracer Front
2nd Polymer Front
0.0
0.2
0.4
0.6
0.8
1.0
1.2
0 2 4 6 8 10 12
Nor
mal
ized
Pol
ymer
Con
cent
ratio
n (F
ract
ion)
Fluid Injected (PV)
Fig. 3 The polymer concentration profile of Run 2 during the first injection cycle.

6 The Aramco Journal of Technology Fall 2019
conditions, the polymer retention results from these two tests were very close. This indicates that, contrary to expectations, wettability does not have an appreciable effect on polymer retention.
It should be noted that the retention result of Run 1 was determined by the material balance method only. Different evaluation methods might cause some difference, but the general trend is that the presence of residual oil reduces polymer retention, and the wettability effect on retention is minimal. For the oil-wet and mixed wet cores, Wever et al. (2018)25 attributed the reduced polymer retention to the decrease in surface area by oil. Therefore, physical adsorption is suppressed in the presence of residual oil. But this may not explain the lowered retention for water-wet conditions. Using xanthan polymer and Berea sandstone, Kolodziej (1988)24 found that the polymer retention in the presence of oil was around half of that without oil. He explained the possible reason is pore wall exclusion effects, which is greater in smaller pores. When a fraction of larger pores are occupied by residual oil, the adsorption in larger pores is expected to decrease. On the other hand, the stronger pore wall exclusion effects in smaller pores might restrict the polymer to invade. This might be similar to the depletion layer mechanism9, 31. According to this concept,
the large polymer molecule cannot get too close to the rock surface, or the region of fluid closest to the rock surface is depleted of polymer.
The results from Runs 2 and 3 showed almost the same value of polymer IPV, ranging from 11% PV and 12% PV. This indicates that the presence of oil has an insignificant impact on the polymer’s IPV. There are a few different mechanisms to explain the polymer’s IPV9, 10, 27, 31, 32, but it is usually attributed to the narrower pore throats that prevent polymer molecules propagation through them. As a result, a fraction of the porous medium is not accessible to the polymer. The insignificant effect of residual oil on the polymer’s IPV might indicate that the residual oil does not add further restrictions to polymer access, at least for the water-wet system.
While single-phase displacement experiments tend to give higher polymer retention results than that in the presence of residual oil, this test can provide quick evaluations of retention. When only single-phase displacement results are available, this conservative retention estimate might need to be factored in for simulating the propagation of polymer in the flow regions above the oil-water contact.
ConclusionsThe retention of a sulfonated PAM polymer in carbonate was evaluated by coreflooding experiments at reservoir conditions using representative reservoir fluids and core samples. Both single-phase and two-phase — at residual oil — displacement experiments were performed to investigate the effects of residual oil and wettability on the retention of the polymer. The following conclusions were drawn from this study:1. The retention of the studied polymer in a carbonate
core is relatively low, ranging from 26 µg/g-rock to 60.8 µg/g-rock. This demonstrates the potential use of this polymer for carbonate reservoir application.
2. The presence of residual oil significantly reduces polymer retention; more than 50% reduction was observed in this study. This means the presence of residual oil has a positive impact on the retention of the polymer.
3. There is an insignificant difference in the polymer retention results obtained from different wettability conditions, demonstrating that wettability has
Saudi Aramco: Company General Use
Fig. 4 The polymer and tracer front concentration profiles during the two cycles of chemical injection, test Run 3.
Test Core Status Sor (%) Evaluation
Method Polymer
Retention (µg/g-rock)
Polymer IPV (PV%)
Run 1 Slightly oil-wet to intermediate wet, at Sor
28.8 Material balance 29.9 /
Run 2 Water-wet, single phase 0.0 Double bank 60.8 11.0 Material balance 58.5 /
Run 3 Water-wet, at Sor 33.4 Double bank 26.0 12.0 Table 2 Summary of polymer retention and IPV results.
0.0
0.2
0.4
0.6
0.8
1.0
1.2
0.0 0.5 1.0 1.5 2.0 2.5 3.0 3.5 4.0 4.5 5.0
Nor
mal
ized
Effl
uent
Con
cent
ratio
ns
(Fra
ctio
n)
Fluid Injected (PV)
1st Tracer Front
1st Polymer Front
2nd Tracer Front
2nd Polymer Front
Fig. 4 The polymer and tracer front concentration profiles during the two cycles of chemical injection, test Run 3.
Test Core Status Sor (%) Evaluation MethodPolymer Retention
(µg/g-rock)Polymer IPV (PV%)
Run 1Slightly oil-wet to
intermediate wet, at Sor
28.8 Material balance 29.9 /
Run 2 Water-wet, single phase 0.0Double bank 60.8 11.0
Material balance 58.5 /
Run 3 Water-wet, at Sor 33.4 Double bank 26.0 12.0
Table 2 Summary of polymer retention and IPV results.

7 The Aramco Journal of TechnologyFall 2019
negligible effects on the polymer retention estimates.4. The polymer’s IPV ranges from 11% PV to 12%
PV for the two tests with and without residual oil, respectively. This indicates that the presence of oil has an insignificant impact on the polymer’s IPV.
5. It is recommended to evaluate polymer retention by both the single-phase displacement test, and in the presence of residual oil at representative conditions. At the same time, we also believe single-phase displacement experiments can provide a robust route to obtain retention estimates. The conservative nature of those estimates should be kept in mind or factored into the upscaling and design of polymer flooding projects when only single-phase displacement retention results are available.
AcknowledgmentsThe authors would like to thank the management of Saudi Aramco for their support and permission to publish this article. The authors would also like to thank Salah Saleh and Abdulaziz Kulaibi for the help on the TOC measurements.
This article was presented at the SPE Kingdom of Saudi Arabia Annual Technical Symposium and Exhibition, Dammam, Saudi Arabia, April 16-18, 2019.
References1. Maitin, B.K. and Volz, H.: “Performance of Deutsche
Texaco Ag’s Oerrel and Hankensbuettel Polymer Floods,” SPE paper 9794, presented at the SPE/DOE Enhanced Oil Recovery Symposium, Tulsa, Oklahoma, April 5-8, 1981.
2. Needham, R.B. and Doe, P.H.: “Polymer Flooding Review,” Journal of Petroleum Technology, Vol. 39, Issue 12, December 1987, pp. 1503-1507.
3. Weiss, W.W.: “Performance Review of a Large-Scale Polymer Flood,” SPE paper 24145, presented at the SPE/DOE Enhanced Oil Recovery Symposium, Tulsa, Oklahoma, April 22-24, 1992.
4. Wang, D., Dong, H., Lv, C., Fu, X., et al.: “Review of Practical Experience by Polymer Flooding at Daqing,” SPE Reservoir Evaluation & Engineering, Vol. 12, Issue 3, June 2009, pp. 470-476.
5. Wassmuth, F.R., Green, K., Arnold, W. and Cameron, N.: “Polymer Flooding Application to Improve Heavy Oil Recovery at East Bodo,” Journal of Canadian Petroleum Technology, Vol. 48, Issue 2, February 2009, pp. 55-61.
6. Thakuria, C., Al-Amri, M.S., Al-Saqri, K.A., Jaspers, H.F., et al.: “Performance Review of Polymer Flooding in a Major Brown Oil Field of Sultanate of Oman,” SPE paper 165262, presented at the SPE Enhanced Oil Recovery Conference, Kuala Lumpur, Malaysia, July 2-4, 2013.
7. Delamaide, E., Zaitoun, A., Renard, G. and Tabary, R.: “Pelican Lake Field: First Successful Application of Polymer Flooding in a Heavy Oil Reservoir,” SPE Reservoir Evaluation & Engineering, Vol. 17, Issue 3, August 2014, pp. 340-354.
8. Sheng, J.J., Leonhardt, B. and Azri, N.: “Status of Polymer Flooding Technology,” Journal of Canadian Petroleum Technology, Vol. 54, Issue 2, March 2015, pp. 116-126.
9. Sorbie, K.S.: Polymer-Improved Oil Recovery, Boca Raton, Florida, USA, CRC Press Inc., 1991, 359 p.
10. Manichand, R.N. and Seright, R.S.: “Field vs.
Laboratory Polymer Retention Values for a Polymer Flood in Tambaredjo Field,” SPE Reservoir Evaluation & Engineering, Vol. 17, Issue 3, August 2014, pp. 314-324.
11. Meister, J.J., Pledger Jr., H., Hogen-Esch, T.E. and Butler, G.B.: “Retention of Polyacrylamide by Berea Sandstone, Baker Dolomite, and Sodium Kaolinite during Polymer Flooding,” SPE paper 8981, presented at the SPE Oil Field and Geothermal Chemistry Symposium, Stanford, California, May 28-30, 1980.
12. Chauveteau, G., Lecourtier, J. and Lee, L.T.: “Reduction of Polymer Adsorption on Reservoir Rocks,” Oil and Gas Science and Technology, Vol. 43, Issue 4, July 1988, pp. 533-543.
13. Hughes, D.S., Teeuw, D., Cottrell, C.W. and Toilas, J.M.: “Appraisal of the Use of Polymer Injection to Suppress Aquifer Influx and to Improve Volumetric Sweep in a Viscous Oil Reservoir,” SPE Reservoir Engineering, Vol. 5, Issue 1, February 1990, pp. 33-40.
14. Chiappa, L., Mennella, A., Lockhart, T.P. and Burrafato, G.: “Polymer Adsorption at the Brine/Rock Interface: The Role of Electrostatic Interactions and Wettability,” Journal of Petroleum Science and Engineering, Vol. 24, Issues 2-4, December 1999, pp. 113-122.
15. Vermolen, E.C.M., Van Haasterecht, M.J.T., Masalmeh, S.K., Faber, M.J., et al.: “Pushing the Envelope for Polymer Flooding toward High Temperature and High Salinity Reservoirs with Polyacrylamide-based Terpolymers,” SPE paper 141497, presented at the SPE Middle East Oil and Gas Show and Conference, Manama, Kingdom of Bahrain, September 25-28, 2011.
16. Zheng, C.G., Gall, B.L., Gao, H.W., Miller, A.E., et al.: “Effects of Polymer Adsorption and Flow Behavior on Two-Phase Flow in Porous Media,” SPE Reservoir Evaluation & Engineering, Vol. 3, Issue 3, June 2000, pp. 216-223.
17. Friedmann, F.: “Surfactant and Polymer Losses during Flow through Porous Media,” SPE Reservoir Engineering, Vol. 1, Issue 3, May 1986, pp. 261-271.
18. Huang, Y. and Sorbie, K.S.: “Scleroglucan Behavior in Flow through Porous Media: Comparison of Adsorption and In Situ Rheology with Xanthan,” SPE paper 25173, presented at the SPE International Symposium on Oil Field Chemistry, New Orleans, Louisiana, March 2-5, 1993.
19. Zhang, G. and Seright, R.S.: “Effect of Concentration on HPAM Retention in Porous Media,” SPE paper 166265, presented at the SPE Annual Technical Conference and Exhibition, New Orleans, Louisiana, September 30-October 2, 2013.
20. Martin, F.D., Hatch, M.J., Shepitka, J.S. and Ward, J.S.: “Improved Water-Soluble Polymers for Enhanced Recovery of Oil,” SPE paper 11786, presented at the SPE Oil Field and Geothermal Chemistry Symposium, Denver, Colorado, June 1-3, 1983.
21. AlSofi, A.M., Wang, J. and Kaidar, Z.F.: “SmartWater Synergy with Chemical EOR: Effects on Polymer Injectivity, Retention and Acceleration,” Journal of Petroleum Science and Engineering, Vol. 166, July 2018, pp. 274-282.
22. Broseta, D., Medjahed, F., Lecourtier, J. and Robin, M.: “Polymer Adsorption/Retention in Porous Media: Effects of Core Wettability and Residual Oil,” SPE Advanced Technology Series, Vol. 3, Issue 1, March 1995, pp. 103-112.
23. Huh, C., Lange, E.A. and Cannella, W.J.: “Polymer Retention in Porous Media,” SPE paper 20235, presented at the SPE/DOE Enhanced Oil Recovery Symposium, Tulsa, Oklahoma, April 22-25, 1990.

8 The Aramco Journal of Technology Fall 2019
24. Kolodziej, E.J.: “Transport Mechanisms of Xanthan Biopolymer Solutions in Porous Media,” SPE paper 18090, presented at the SPE Annual Technical Conference and Exhibition, Houston, Texas, October 2-5, 1988.
25. Wever, D.A.Z., Bartlema, H., Berge, A.B.G.M., Al-Mjeni, R., et al.: “The Effect of the Presence of Oil on Polymer Retention in Porous Media from Clastic Reservoirs in the Sultanate of Oman,” SPE paper 190430, presented at the SPE EOR Conference at Oil and Gas West Asia, Muscat, Oman, March 26-28, 2018.
26. Okasha, T.M., Funk, J.J. and Rashidi, H.N.: “Fifty Years of Wettability Measurements in the Arab-D Carbonate Reservoir,” SPE paper 105114, presented at the SPE Middle East Oil and Gas Show and Conference, Manama, Kingdom of Bahrain, March 11-14, 2007.
27. Dawson, R. and Lantz, R.B.: “Inaccessible Pore Volume in Polymer Flooding,” Society of Petroleum Engineers Journal, Vol. 12, Issue 5, October 1972, pp. 448-452.
28. Dominguez, J.G. and Willhite, G.P.: “Retention and Flow Characteristics of Polymer Solutions in Porous Media,” Society of Petroleum Engineers Journal, Vol. 17, Issue 2, April 1977, pp. 111-121.
29. Lotsch, T., Muller, T. and Pusch, G.: “The Effect of Inaccessible Pore Volume on Polymer Coreflood Experiments,” SPE paper 13590, presented at the SPE Oil Field and Geothermal Chemistry Symposium, Phoenix, Arizona, March 9-11, 1985.
30. Osterloh, W.T. and Law, E.J.: “Polymer Transport and Rheological Properties for Polymer Flooding in the North Sea,” SPE paper 39694, presented at the SPE/DOE Improved Oil Recovery Symposium, Tulsa, Oklahoma, April 19-22, 1998.
31. Chauveteau, G.: “Molecular Interpretation of Several Different Properties of Flow of Coiled Polymer Solutions through Porous Media in Oil Recovery Conditions,” SPE paper 10060, presented at the SPE Annual Technical Conference and Exhibition, San Antonio, Texas, October 4-7, 1981.
32. Liauh, W.C., Duda, J.L. and Klaus, E.E.: “An Investigation of the Inaccessible Pore Volume Phenomena,” SPE paper 8751, 1979.
Dr. Abdulkarim M. Al-Sofi is a Reservoir Engineer with Saudi Aramco’s Exploration and Petroleum Engineering Center – Advanced Research Center (EXPEC ARC). He is currently the Champion of the Chemical Enhanced Oil Recovery Focus Area and is leading a new research initiative on heavy oil mobilization and recovery. Abdulkarim has also worked with the Reservoir Management, Reservoir Description and Simulation, and Reserves Assessment Departments.
He is the recipient of the 2009 Society of Petroleum Engineers (SPE) Annual Technical Conference and
Exhibition Young Professional Best Paper Award in reservoir engineering, the recipient of the 2011 EXPEC ARC Best Presentation Award and the recipient of the 2013 Middle East Young Engineer of the Year Award.
Abdulkarim has authored 15 conference papers and seven peer-reviewed journal papers.
In 2006, he received his B.S. degree from the University of Texas at Austin, Austin, TX, and in 2010, Abdulkarim received his Ph.D. degree from Imperial College London, London, U.K., both degrees in Petroleum Engineering.
About the Authors
Dr. Abdulkarim M. Al-Sofi
Ph.D. in Petroleum Engineering, Imperial College London
Dr. Jinxun Wang
Ph.D. in Petroleum Engineering, Research Institute of Petroleum Exploration and Development
Ph.D. in Chemical Engineering, University of Calgary
Dr. Jinxun Wang works at Saudi Aramco’s Exploration and Petroleum Engineering Center – Advanced Research Center (EXPEC ARC) as a Petroleum Engineer in the chemical enhanced oil recovery focus area of the Reservoir Engineering Technology Division. Before joining Saudi Aramco, he worked with Core Laboratories Canada Ltd. as a Project Engineer in their Advanced Rock Properties group. Jinxun’s experience also includes 10 years of research and teaching reservoir engineering at petroleum universities in China.
Jinxun received his B.S. degree from the China University of Petroleum, his M.S. degree from the Southwest Petroleum Institute, China, and his Ph.D. degree from the Research Institute of Petroleum Exploration and Development, Beijing, China, all in Petroleum Engineering. He received a second Ph.D. degree in Chemical Engineering from the University of Calgary, Calgary, Alberta, Canada.
Jinxun is a member of the Society of Petroleum Engineers (SPE) and the Society of Core Analysts (SCA).


