A new approach for describing the relationship between electrical conductivity and major anion...
7
A new approach for describing the relationship between electrical conductivity and major anion concentration in natural waters Andres Marandi ⇑ , Maile Polikarpus, Argo Jõeleht Department of Geology, Institute of Ecology and Earth Sciences, University of Tartu, Ravila 14A, 50411 Tartu, Estonia article info Article history: Received 26 November 2012 Accepted 3 September 2013 Available online 8 September 2013 Editorial handling by R. Fuge abstract The concentrations of dissolved cations and anions are fundamental to the water quality of groundwa- ters, particularily pertaining to their use as a drinking water source. Currently, assessment of total dis- solved solids requires laboratory-based analysis of each ionic species, and cannot be reliably tested in the field. Here, a new method is developed that distinguishes between changes in ion concentration or water type based upon field measurement of Electric Conductivity (EC) and the concentration of only one anion. The approach operates under the assumption that all cations contribute equally to EC, whereas almost twice as much of the HCO 3 ion is needed to produce the same effect on total solute EC as those of Cl or SO 2 4 ions for waters at neutral pH. Therefore, many groundwater systems can be treated as two anion systems when the groundwater chemical type and solute EC relationship is assessed. Moreover, by assuming neutral charge and that the correlation between anion concentration and EC is adequately described, changes to anion concentrations will produce corresponding change to cation concentrations. A database consisting of 3555 analyses of major chemical composition from Estonian groundwaters was used to develop the correlations described here, and data for 320 samples with measured EC values together with major chemical constituents was used to verify the new method. As a result, a binary plot has been compiled which can be used: (1) for prediction of chemical composition of groundwater if ana- lytical results of Cl or HCO 3 from anions and measured values of EC are available, or (2) for description of temporal changes in groundwater chemistry if the time series of the same measurements are available. Ó 2013 Elsevier Ltd. All rights reserved. 1. Introduction Electrical conductivity (EC), or conductivity, is the ability of a substance to conduct an electric current. Specific electrical conduc- tivity is the conductivity of a body of unit length and unit cross sec- tion at a specified temperature (Hem, 1989). Electrical conductivity is widely applied as a basic tool to assess water quality. The rela- tionship between total dissolved solids (TDS) (mg/L) and EC (lS/ cm) is often described by a parameter that varies according to chemical composition: TDS = A EC, where the constant A is in the range of 0.55 to 0.9 in most conductivity meters, reflecting the unique molar masses and charges of the most common anions: Cl , HCO 3 and SO 2 4 . Typically this parameter is high for Cl -rich waters and low for SO 2 4 -rich waters (UNEP, 2004). Due to its simplicity, measurements of EC have become fre- quent in water quality related research (Laxen, 1977; Pawlowicz, 2008; Visconti et al., 2010; Siosemarde et al., 2010; McNeil and Cox, 2000; McCleskey, 2011). In water quality studies, electrical conductivity is used in ground water monitoring as an indication of the presence of ions of chemical substances that may reflect the natural variations in water quality or the presence of contam- ination. Fast measurement and low cost have allowed EC to be ap- plied in a wide range of hydrogeological applications where ‘‘in the field’’ water quality information is desired. Despite its widespread use and benefits, EC has largely re- mained a qualitative parameter used either as an indicator of changes in water quality, or as a quality control in chemical analyses. The reason for this is that EC depends on the concentration of solutes in water and its change may be caused by variations of any component in water, making it difficult to predict the reasons by measuring the EC only. Additionally, as the influence of different solutes on EC is not equal, then the same trends in changes of EC could be either due to the changes in concentration of solutes (total dissolved solids) or changes of component ratios (water type). Therefore, the measurements of EC are combined with sampling and analyses of groundwater in most cases which limits the real- time and in-field applicability of the method. The dependence of electrical conductivity on concentration of solutes has been extensively investigated for aqueous solutions. A limiting law for conductivity was developed by Onsager (1926) by using the Debye–Hückel (1924) equilibrium distribution functions. After that several studies dealt with relationship be- tween conductivity and chemical composition of natural waters (Logan, 1961; Rossum, 1975; Hem, 1989; Hughes et al., 1994; 0883-2927/$ - see front matter Ó 2013 Elsevier Ltd. All rights reserved. http://dx.doi.org/10.1016/j.apgeochem.2013.09.003 ⇑ Corresponding author. Tel.: +372 5058116. E-mail address: [email protected] (A. Marandi). Applied Geochemistry 38 (2013) 103–109 Contents lists available at ScienceDirect Applied Geochemistry journal homepage: www.elsevier.com/locate/apgeochem
Transcript of A new approach for describing the relationship between electrical conductivity and major anion...

Applied Geochemistry 38 (2013) 103–109
Contents lists available at ScienceDirect
Applied Geochemistry
journal homepage: www.elsevier .com/ locate/apgeochem
A new approach for describing the relationship between electricalconductivity and major anion concentration in natural waters
0883-2927/$ - see front matter � 2013 Elsevier Ltd. All rights reserved.http://dx.doi.org/10.1016/j.apgeochem.2013.09.003
⇑ Corresponding author. Tel.: +372 5058116.E-mail address: [email protected] (A. Marandi).
Andres Marandi ⇑, Maile Polikarpus, Argo JõelehtDepartment of Geology, Institute of Ecology and Earth Sciences, University of Tartu, Ravila 14A, 50411 Tartu, Estonia
a r t i c l e i n f o
Article history:Received 26 November 2012Accepted 3 September 2013Available online 8 September 2013Editorial handling by R. Fuge
a b s t r a c t
The concentrations of dissolved cations and anions are fundamental to the water quality of groundwa-ters, particularily pertaining to their use as a drinking water source. Currently, assessment of total dis-solved solids requires laboratory-based analysis of each ionic species, and cannot be reliably tested inthe field. Here, a new method is developed that distinguishes between changes in ion concentration orwater type based upon field measurement of Electric Conductivity (EC) and the concentration of onlyone anion. The approach operates under the assumption that all cations contribute equally to EC, whereasalmost twice as much of the HCO�3 ion is needed to produce the same effect on total solute EC as those ofCl� or SO2�
4 ions for waters at neutral pH. Therefore, many groundwater systems can be treated as twoanion systems when the groundwater chemical type and solute EC relationship is assessed. Moreover,by assuming neutral charge and that the correlation between anion concentration and EC is adequatelydescribed, changes to anion concentrations will produce corresponding change to cation concentrations.A database consisting of 3555 analyses of major chemical composition from Estonian groundwaters wasused to develop the correlations described here, and data for 320 samples with measured EC valuestogether with major chemical constituents was used to verify the new method. As a result, a binary plothas been compiled which can be used: (1) for prediction of chemical composition of groundwater if ana-lytical results of Cl� or HCO�3 from anions and measured values of EC are available, or (2) for description oftemporal changes in groundwater chemistry if the time series of the same measurements are available.
� 2013 Elsevier Ltd. All rights reserved.
1. Introduction
Electrical conductivity (EC), or conductivity, is the ability of asubstance to conduct an electric current. Specific electrical conduc-tivity is the conductivity of a body of unit length and unit cross sec-tion at a specified temperature (Hem, 1989). Electrical conductivityis widely applied as a basic tool to assess water quality. The rela-tionship between total dissolved solids (TDS) (mg/L) and EC (lS/cm) is often described by a parameter that varies according tochemical composition: TDS = A � EC, where the constant A is inthe range of 0.55 to 0.9 in most conductivity meters, reflectingthe unique molar masses and charges of the most common anions:Cl�, HCO�3 and SO2�
4 . Typically this parameter is high for Cl�-richwaters and low for SO2�
4 -rich waters (UNEP, 2004).Due to its simplicity, measurements of EC have become fre-
quent in water quality related research (Laxen, 1977; Pawlowicz,2008; Visconti et al., 2010; Siosemarde et al., 2010; McNeil andCox, 2000; McCleskey, 2011). In water quality studies, electricalconductivity is used in ground water monitoring as an indicationof the presence of ions of chemical substances that may reflect
the natural variations in water quality or the presence of contam-ination. Fast measurement and low cost have allowed EC to be ap-plied in a wide range of hydrogeological applications where ‘‘in thefield’’ water quality information is desired.
Despite its widespread use and benefits, EC has largely re-mained a qualitative parameter used either as an indicator ofchanges in water quality, or as a quality control in chemicalanalyses. The reason for this is that EC depends on the concentrationof solutes in water and its change may be caused by variations ofany component in water, making it difficult to predict the reasonsby measuring the EC only. Additionally, as the influence of differentsolutes on EC is not equal, then the same trends in changes of ECcould be either due to the changes in concentration of solutes (totaldissolved solids) or changes of component ratios (water type).Therefore, the measurements of EC are combined with samplingand analyses of groundwater in most cases which limits the real-time and in-field applicability of the method.
The dependence of electrical conductivity on concentration ofsolutes has been extensively investigated for aqueous solutions.A limiting law for conductivity was developed by Onsager (1926)by using the Debye–Hückel (1924) equilibrium distributionfunctions. After that several studies dealt with relationship be-tween conductivity and chemical composition of natural waters(Logan, 1961; Rossum, 1975; Hem, 1989; Hughes et al., 1994;

Fig. 1. Piper diagram of studied Estonian groundwater samples from.
104 A. Marandi et al. / Applied Geochemistry 38 (2013) 103–109
McNeil and Cox, 2000). Most of the aforementioned research con-centrates on finding the statistical correlation between the concen-tration of solutes and electrical conductivity in order to calculateconductivity based on the chemical composition of natural waters.The goal of developing such a method has been to provide as pre-cise quality control method for checking water analyses as possi-ble. The result is usually a conversion constant for a specificlocation and specific waters. McNeil and Cox (2000) found thatEC is not a precise surrogate for TDS, particularly in waters of var-iable composition. The median ratios of TDS/conductivity obtainedfrom the surface water data base were between 0.59 and 0.72,which compares well with previous studies. However, the normalvariability ranges from as low as 0.35 to greater than 1.00, partic-ularly at low salinities (McNeil and Cox, 2000). The latest improve-ment was provided by McCleskey et al. (2012) when the WATEQ4Fdatabase (Ball and Nordstrom, 1991) was modified and incorpo-rated with a method to calculate the conductivity of natural watersusing molal conductivities based on the electrical conductivitymeasurements performed in the McCleskey (2011) study. Theirmethod calculates accurately the electrical conductivity of naturalwater samples having a large range of speciated ionic strength(0.0004–0.7), temperature (0–95.5 �C), pH (1.1–9.8), and conduc-tivity (33–70,000 lS/cm).
Global monitoring programs of natural aquatic systems requirequick and cost-effective sampling and measurement approaches.Unfortunately the chemical type of natural waters can vary in timeand space, and as the change in conductivity has a strong depen-dence on types of dissolved ions, then the conductivity cannot betreated as a direct reflection of salinity. Therefore, the conductivityalone can be used for monitoring of salinity changes in well-de-fined systems only, where the changes in water chemistry can beneglected.
Even though the applicability of ion selective electrodes hasgrown lately, due to technical and financial issues it is not likelythat sensors for all major groundwater chemical components willbe widely available in the near future. However, the presence ofions in natural waters is not sporadic and depends on availabilityand on solubility of minerals present within the aquifer system.There is often a strong correlation between some of the major an-ions and cations in natural waters (Hem, 1989; Appelo and Postma,1993), due to the presence of soluble minerals with fixed stoichi-ometry, such as calcite, gypsum or halite. Based on predictable an-ion-cation ratios for certain water types, a method is developedthat distinguishes changes in concentrations or water types basedon EC and the concentration of only one anion for natural waters ata neutral pH. The method is tested on water quality data, whereSO2�
4 is not dominant and, therefore, a 2-anion system (HCO3–Cl)can be assumed.
2. Materials and methods
Groundwater in Estonia occurs in a variety of porous aquifers insiliciclastic rocks and in fractured aquifers in carbonate rocks (Pe-rens and Vallner, 1997). Groundwater chemistry and salinity de-pends on water–rock interaction during the present water cyclebut it also reflects the result of past processes, such as subglacialrecharge during the Pleistocene (Perens and Vallner, 1997;Vaikmäe et al., 2001). The salinity of groundwater in Estonia rangesfrom 102 to 104 mg L�1, with concentrations usually <1000 mg L�1.
Information from a State Groundwater Monitoring Databaseand the State Water Well Database, which contains measured con-ductivities, were used for development and verification of the ECcalculation method. The State Groundwater Monitoring Databasecontains groundwater quality analyses, including time series data,starting from the 1950s. The State Water Well Database contains
groundwater samples taken from newly completed wells duringthe approval process and it includes measured EC (corrected to25 �C; i.e., EC25) coupled with major ionic concentrations collectedfrom 2011–2013. Both of the databases are maintained by the Min-istry of Environment of Estonia, and the samples for both databaseswere collected by certified persons and analyzed by accreditedlaboratories.
The range of the chemical composition data used for the newmethod is given in Fig. 1. An ion balance control was performedfor historical data and only 3555 samples with an error <5% wereselected for calculations and 320 analyses for verification in thecurrent study. Descriptive statistics of the data used are presentedin Table 1. The conductivity of solutes varies by several percentdepending on solute temperature, therefore, the conductivity cal-culation was performed for a 25 �C reference temperature (EC25).
McCleskey et al. (2012), Pawlowicz (2008) and the extendedmodified Rossum (EMRM) (Hughes et al., 1994) models were usedto calculate EC25. Calculation results outside of the 10th and 90thpercentiles were not included in the regressions (Fig. 2). All threemethods perform equally well (maximum difference of 3.5% wasfound between the calculation results of three methods) althoughEMRM showed slightly better agreement with measured values.
There was a need to count either Na+ or Mg2+ as 100% of all cat-ions in order to develop a new method (see the description below).Since all tested methods perform well with the dataset, the sim-plest EMRM was used for solute EC25 calculations and also forthe calculations of isolines of molal percentages:
EMRM ¼ G0þ þ G0
� �WK0
K1ðZþ þ Z�Þþ K2
� �½ðZþ þ Z�ÞC�1:5
þmC2 1�W½ðZþ þ Z�ÞC�0:5
K1
" #;
where
W ¼ ZþZ�2Q
1þffiffiffiffiQp
Q ¼ ZþZ�K0
ðZþ þ Z�ÞðZþk� þ Z�kþÞ
G0þ ¼
Xcþk
0þ
G0� ¼
Xc�k
0�
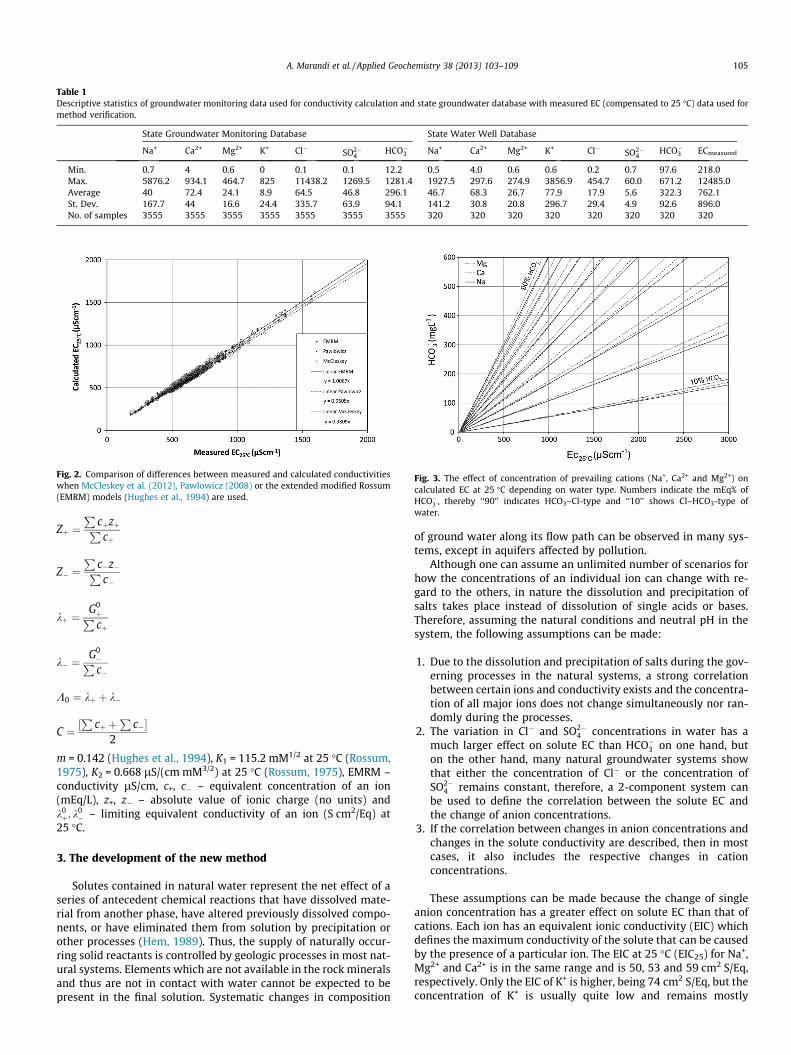
Table 1Descriptive statistics of groundwater monitoring data used for conductivity calculation and state groundwater database with measured EC (compensated to 25 �C) data used formethod verification.
State Groundwater Monitoring Database State Water Well Database
Na+ Ca2+ Mg2+ K+ Cl� SO2�4
HCO�3 Na+ Ca2+ Mg2+ K+ Cl� SO2�4
HCO�3 ECmeasured
Min. 0.7 4 0.6 0 0.1 0.1 12.2 0.5 4.0 0.6 0.6 0.2 0.7 97.6 218.0Max. 5876.2 934.1 464.7 825 11438.2 1269.5 1281.4 1927.5 297.6 274.9 3856.9 454.7 60.0 671.2 12485.0Average 40 72.4 24.1 8.9 64.5 46.8 296.1 46.7 68.3 26.7 77.9 17.9 5.6 322.3 762.1St. Dev. 167.7 44 16.6 24.4 335.7 63.9 94.1 141.2 30.8 20.8 296.7 29.4 4.9 92.6 896.0No. of samples 3555 3555 3555 3555 3555 3555 3555 320 320 320 320 320 320 320 320
Fig. 2. Comparison of differences between measured and calculated conductivitieswhen McCleskey et al. (2012), Pawlowicz (2008) or the extended modified Rossum(EMRM) models (Hughes et al., 1994) are used.
Fig. 3. The effect of concentration of prevailing cations (Na+, Ca2+ and Mg2+) oncalculated EC at 25 �C depending on water type. Numbers indicate the mEq% ofHCO�3 , thereby ‘‘90’’ indicates HCO3–Cl-type and ‘‘10’’ shows Cl–HCO3-type ofwater.
A. Marandi et al. / Applied Geochemistry 38 (2013) 103–109 105
Zþ ¼P
cþzþPcþ
Z� ¼P
c�z�Pc�
kþ ¼G0þPcþ
k� ¼G0�Pc�
K0 ¼ kþ þ k�
C ¼ ½P
cþ þP
c��2
m = 0.142 (Hughes et al., 1994), K1 = 115.2 mM1/2 at 25 �C (Rossum,1975), K2 = 0.668 lS/(cm mM3/2) at 25 �C (Rossum, 1975), EMRM –conductivity lS/cm, c+, c� – equivalent concentration of an ion(mEq/L), z+, z� – absolute value of ionic charge (no units) andk0þ; k
0� – limiting equivalent conductivity of an ion (S cm2/Eq) at
25 �C.
3. The development of the new method
Solutes contained in natural water represent the net effect of aseries of antecedent chemical reactions that have dissolved mate-rial from another phase, have altered previously dissolved compo-nents, or have eliminated them from solution by precipitation orother processes (Hem, 1989). Thus, the supply of naturally occur-ring solid reactants is controlled by geologic processes in most nat-ural systems. Elements which are not available in the rock mineralsand thus are not in contact with water cannot be expected to bepresent in the final solution. Systematic changes in composition
of ground water along its flow path can be observed in many sys-tems, except in aquifers affected by pollution.
Although one can assume an unlimited number of scenarios forhow the concentrations of an individual ion can change with re-gard to the others, in nature the dissolution and precipitation ofsalts takes place instead of dissolution of single acids or bases.Therefore, assuming the natural conditions and neutral pH in thesystem, the following assumptions can be made:
1. Due to the dissolution and precipitation of salts during the gov-erning processes in the natural systems, a strong correlationbetween certain ions and conductivity exists and the concentra-tion of all major ions does not change simultaneously nor ran-domly during the processes.
2. The variation in Cl� and SO2�4 concentrations in water has a
much larger effect on solute EC than HCO�3 on one hand, buton the other hand, many natural groundwater systems showthat either the concentration of Cl� or the concentration ofSO2�
4 remains constant, therefore, a 2-component system canbe used to define the correlation between the solute EC andthe change of anion concentrations.
3. If the correlation between changes in anion concentrations andchanges in the solute conductivity are described, then in mostcases, it also includes the respective changes in cationconcentrations.
These assumptions can be made because the change of singleanion concentration has a greater effect on solute EC than that ofcations. Each ion has an equivalent ionic conductivity (EIC) whichdefines the maximum conductivity of the solute that can be causedby the presence of a particular ion. The EIC at 25 �C (EIC25) for Na+,Mg2+ and Ca2+ is in the same range and is 50, 53 and 59 cm2 S/Eq,respectively. Only the EIC of K+ is higher, being 74 cm2 S/Eq, but theconcentration of K+ is usually quite low and remains mostly

Fig. 4. Binary-anion plot presenting calculated EC at 25 �C dependence on concentrations and molal percentages of HCO�3 (top) and Cl� (below).
106 A. Marandi et al. / Applied Geochemistry 38 (2013) 103–109
constant in natural groundwater. The EIC25 of anions differs muchmore being 79.8, 76.3 and 44.5 cm2 S/Eq for SO2�
4 , Cl� and HCO�3 ,respectively (Rossum, 1975). Consequently, the EIC25 data showsthat all cations have a similar effect to total solute EC, whereas al-most twice as much of the HCO�3 ion is needed to get the same ef-fect on total solute EC created by either Cl� or SO2�
4 ions. Note thatthe assumption holds for the solutes with neutral pH, where a sig-nificant influence of H+ or OH� on the EC can be neglected.
In order to show the effect of cations, the EC of solutes has beencalculated with the assumption of a 2-anion systemðCl� þHCO�3 ¼ 100% mEq of anions) with only one cation (100%mEq of cations). Fig. 3 shows that the maximum EC values are de-fined by Na+ content whereas the minimum values are defined byMg2+ content. It is important to note that there is only minor differ-ence on solute EC for Na+ and Ca2+ compared to the effects of Mg2+.
The dominant effect of anions on solute EC and the existence ofa binary-anion component system is shown on Fig. 4, where calcu-lated EC results based on the State Groundwater Monitoring Data-base data are presented. The EC dependence on anions in binarysystems was verified by measured groundwater EC and chemistry
from the State Water Well Database (Fig. 5). Calculated and mea-sured data points on Figs. 4 and 5 were grouped (marked with dif-ferent symbols) according to molal percentages of Cl� and HCO�3ions ðCl� þHCO�3 ¼ 100% mEqÞ. The isolines of molal percentagesof Cl� and HCO�3 where drawn according to the following equation:
ECat25 ¼ ðEMRMðMG;CL;HCOÞ þ EMRMðNA;CL;HCOÞÞ=2;
When calculating HCO3 isolines:
HCO is 0.1. . .1000 HCO�3 mg/L.CL = HCO/MHCO3 � (100 � PHCO3)/PHCO3 �MCl.MG = (CL/MCl + HCO/MHCO3) �MMg/2.NA = (CL/MCl + HCO/MHCO3) �MNa.PHCO3 = molal percentage of calculated HCO�3 (the value ofisoline).MCl, MHCO3, MMg and MNa are respective atomic masses.
When calculating Cl isolines:
CL is 0.1. . .1000 Cl� mg/L

Fig. 5. Binary-anion plot presenting measured EC at 25 �C dependence on concentrations and molal percentages of HCO�3 (top) and Cl� (below).
A. Marandi et al. / Applied Geochemistry 38 (2013) 103–109 107
HCO = CL/MCl �MHCO3 � (100 � PCl)/PCl.MG = (CL/MCl + HCO/MHCO3) �MMg/2.NA = (CL/MCl + HCO/MHCO3) �MNa.PCl = molal percentage of calculated Cl (the value of isoline).MCl, MHCO3, MMg and MNa are respective atomic masses.
Assuming that Na+ has the least effect on the calculation resultsfor one end-member and that Mg2+ has the biggest effect on calcu-lation for the other end-member (Fig. 4), the final position of iso-lines of molal percentages were calculated as the average ofthese two values.
4. Discussion
The EC25 calculation method above depends on water qualitydata where SO2�
4 is usually not dominant and, therefore the systemcan be approximated as a 2-anion system. However, SO2�
4 is a ma-jor anion component that can be abundant in some waters. For the
waters in which anions evolve along the flowpath, the anion evo-lution sequence (Chebotarev, 1955) is explained in terms of twomain variables; mineral availability and mineral solubility. Bicar-bonate is almost invariably the dominant anion in recharge areasor high water exchange zones as all sedimentary basins containcarbonate minerals which have relatively high solubility. Theabundance of SO2�
4 - or Cl� -ions depends mostly on the presencein aquifer rocks of evaporite minerals that are less common thancarbonates (Freeze and Cherry, 1979). High SO2�
4 content may alsobe produced during pyrite (FeS2) oxidation as a result of enhancedrecharge due to lowered groundwater tables (Appelo and Postma,1993). In the case of FeS2 oxidation, the buffer capacity of host rockis very important and either low pH waters are formed or the pH isbuffered by Ca2+ or Mg2+ (Puura et al., 1999) when carbonate min-erals are present. When carbonates are absent, the H+ can be buf-fered by Al3+ as a result of weathering of primary silicates. Thecurrent method was developed and tested for neutral pH condi-tions where the buffering occurred by carbonate minerals andCa2+ and Mg2+ are the dominant dissolved cations.

Fig. 6. Application of binary-anion plot for water type prediction and for presentation of time series results.
108 A. Marandi et al. / Applied Geochemistry 38 (2013) 103–109
Calcium and Mg carbonates are practically the only source ofdissolved ions to the HCO3–Ca–Mg type groundwater observedwithin the active water exchange zone in Estonia (Karise, 1997).Exceptions occur in areas affected by seawater intrusion, wheregroundwaters become Cl–HCO3–Na–Mg–Ca type, and in oil-shalemining areas, where groundwaters become HCO3–SO4–Ca–Mgtype as a result of pyrite oxidation in carbonate-rich aquifer (Pe-rens et al., 2011). In the passive exchange zone HCO3–Cl–Na–Mg–Ca water is more widespread, but HCO3–Ca–Mg type can alsobe found (Karise, 1997). The exception to that occurs in the Cam-brian–Vendian aquifer system, where the water, which rechargedduring the Quaternary glaciation, has variations in water type fromCl–Na to Cl–HCO3–Ca–Na (Karro et al., 2009). Sulfate type waterscan only be found in one aquifer in the passive exchange zonewhere gypsum is present, forming a SO4–Cl–Ca–Na type water.
The previous example shows that in many cases the freshwatersystem can be treated as a 2-component system with regard to dis-solved anions because HCO�3 is the most abundant anion in freshwater and the addition of Cl� or SO2�
4 depends on local circum-stances. As the presence of Cl� or SO2�
4 depends on the availabilityof particular minerals then it can be assumed that when one isadded to the system then the concentration of the other ion canbe treated as a constant. For example if there is an aquifer systemwhere groundwater chemistry is controlled by carbonate rocks andis distant from the ocean, then usually the major changes will beobserved in HCO�3 and SO2�
4 concentrations rather than Cl�, sinceCl� depends on precipitation and is low, and can be consideredas constant as it shown in Estonia and in other large carbonate rockaquifer systems in Pennsylvania, Florida and Manitoba (Freeze andCherry, 1979). Conversely, if there is a system where SO2�
4 concen-tration is constantly low and Cl� and HCO�3 show most change,then by knowing the conductivity and concentration of eitherHCO�3 or Cl� the concentration of the other one can be predicted.
A major difficulty rises when both Cl� and SO2�4 are added to
the system as the EIC25 of both of these ions is similar. A twocomponent system can only be considered when the ratio ofCl� and SO2�
4 is known in such a setting. Unfortunately, Estoniadoes not provide enough data to control the scenarios whereCl� and SO2�
4 are both added to the system or when the oxidationof FeS2 takes place in carbonate poor sediments and low pH
waters are formed. Therefore, current research results are limitedto 10 meq% of SO2�
4 and SO2�4 -rich case studies are needed in the
future.If a 2-component system can be assumed, then the example in
Fig. 6 explains how the concentration of a second anion in thebinary-anion system can be predicted. Only a field measurementof either Cl� or HCO�3 is needed in addition to conductivity toundertake the analysis. As an example, Fig. 6 is entered fromthe lower left corner if the field measured Cl� concentration isknown. As an example this is 388 mg/L. A horizontal line is drawnacross the chart along the 388 mg/L axis. Another perpendicularline, crossing the field measured EC25 is drawn on the chart. Inthe example it is 1521 lS/cm. The point Cl%, which is situatedon intersections of the two crossing lines, indicates the molalconcentration of Cl�. In the example it is 77 mEq%. If is assumedthat it is mostly a 2-component system with SO2�
4 content of lessthan 10 mEq%, then the HCO�3 content would be 23 mEq%. Thesecond line crossing the EC25 value will now be extended to the23 mEq% isoline of HCO�3 on the HCO�3 side of Fig. 6. Finally, theperpendicular line from the 23 mEq% of HCO�3 will be drawnand the intersection with the y axis will indicate the concentra-tion HCO�3 in the water, which is 183 mg/L in the example. Theopposite way may be used where the field measurements ofHCO�3 and EC25 are available. The results of such a predictionare not precise but rather give ratios of two anions dependingon concentrations and measured conductivity. Errors can be in-volved because of cation effects and because of the presence ofthe third anion.
Nevertheless, the same procedure and calculation steps can beused for assessment of changes when a long time series is availablefor a well. The data shown in Fig. 6 can be used to qualitatively de-scribe the changes in groundwater chemistry of samples takenfrom the same monitoring well. An example is fully described inMarandi et al. (2012), however in that case the observed changein chemistry was caused by groundwater abstraction.
The example describes the conceptual model of formation ofthe baseline chemical composition of a confined groundwater bodyin Estonia formed during the most-recent glaciations, where glacialmelt water intruded into water-bearing rocks. Two main processesthat can change the water quality at the present time include (1)

A. Marandi et al. / Applied Geochemistry 38 (2013) 103–109 109
seawater intrusion and (2) groundwater mixing of the buried val-ley aquifer and bedrock aquifer, both caused by overexploitation ofthe aquifer system. The HCO�3 /Cl� ratio fluctuates from 0.9 to 1.3 inwaters of natural background composition and any sustained trendunder or above these values can be caused either by seawaterintrusion or by leakage from buried valleys. The HCO�3 /Cl� valuewas found to be the best parameter to describe the fluctuationsin natural background chemistry in the groundwater body and toassess significant trends induced by abstraction. Fig. 6 representsthe calculated EC25 values for the historical data used in theMarandi et al. (2012) study. Any significant trend across the molalpercentage isolines on Fig. 6 indicates a change in water type whilethe movement along the isoline indicates the changes in TDS with-out any significant changes in chemistry. Data from the monitoringwell suggest, that there was no significant change in abstractedgroundwater chemistry before 2004, after which a significant shiftto a more Cl� type of water can be seen in the example.
5. Conclusions, constraints, suggestions
Based on the results of current study following conclusions canbe reached:
1. Due to the similarities of cation EIC, variations in each cationconcentration have similar effects on total solute EC25.
2. Changes to SO2�4 or Cl� concentrations have a greater effect on
EC25 than HCO�3 concentrations.3. Many natural groundwater systems can be treated as 2 anion
systems in cases where water type and solute EC25 relationshipsare assessed.
4. If a 2-anion system can be applied, measurement of EC25 and ofthe concentration of one anion are needed in order to monitorthe changes in water type.
5. A binary-anion plot can be used to predict the concentration ofa second ion if EC25 and the concentration of one ion are known.Alternatively, it can also be used to follow the changes in watertype if long data series are available.
The equation to construct the base gridline for a binary plot isprovided as a result of the current study. The use of a binary anionsystem for water type and EC25 relationship assessment is achievedby several simplifications of natural systems. Therefore, the meth-od has limits, with the most important limitation being difficultiesarising when Cl� and SO2�
4 are changing simultaneously. The prob-lem can be overcome if the ratios of Cl� and SO2�
4 are known be-cause the similarity in EIC produces a similar effect on EC25. Still,the current study did not deal with data for systems where highconcentrations of Cl� and SO2�
4 are both present; therefore, furtherresearch for such case studies is needed in the future.
Acknowledgements
The activities of the present study were partially supported byMOBILITAS Postdoctoral Research Grant 2009 MJD17 and EstonianResearch Council Grants SF0180048s08 and SF0180069s08.Groundwater quality data for calculations was provided by the
Estonian Environment Information Centre. The authors are gratefulto Scott Jasechko for useful tips and editing the English in themanuscript.
References
Appelo, C.A.J., Postma, D., 1993. Geochemistry, Groundwater and Pollution. A.A.Balkema Publishers, Rotterdam.
Ball, J.W., Nordstrom, D.K., 1991. User’s Manual for WATEQ4F, with RevisedThermodynamic Data Base and Test Cases for Calculating Speciation of Major,Trace, and Redox Elements in Natural Waters. U.S. Geol. Surv. Open-File Report.
Chebotarev, I.J., 1955. Metamorphism of natural water in the crust of weathering.Geochim. Cosmochim. Acta 8, 22–212.
Debye, P., Hückel, E., 1924. Theory of electrolytes. I. Lowering of freezing point andrelated phenomena. Phys. Z. 24, 185.
Freeze, R.A., Cherry, J.A., 1979. Groundwater. Prentice-Hall, New Jersey.Hem, J.D., 1989. The Study and Interpretation of the Chemical Characteristics of
Natural Water, third ed. U.S. Geol. Surv. Water Supply Paper 2254.Hughes, S.G., Taylor, E.L., Wentzell, P.D., 1994. Models for conductance
measurements in guallity assurance of water analysis. Anal. Chem. 66, 830–835.Karise, V., 1997. Composition and properties of groundwater under natural
conditions. In: Raukas, A., Teedumäe, A. (Eds.), Geology and MineralResources of Estonia. Estonian Academy Publishers, Tallinn, pp. 152–156.
Karro, E., Marandi, A., Vaikmäe, R., Uppin, M., 2009. Chemical peculiarities ofSilurian, Ordovician and Cambrian Vendian aquifer systems in Estonia: anoverview of hydrochemical studies. Estonian J. Earth Sci. 58 (342), 352.
Laxen, D.P.H., 1977. A specific conductance method for quality control in wateranalysis. Water Res. 11, 91–94.
Logan, J., 1961. Estimation of electrical conductivity from chemical analyses ofnatural waters. J. Geophys. Res. 66, 2479–2483.
Marandi, A., Karro, E., Raidla, V., Vaikmäe, R., 2012. Conceptual model ofgroundwater quality for the monitoring and management of Voronkagroundwater body, Estonia. Estonian J. Earth Sci. 61, 328–339.
McCleskey, R.B., 2011. Electrical conductivity of electrolytes found in natural watersfrom (5 to 90) �C. J. Chem. Eng. Data 56, 317–327.
McCleskey, R.B., Nordstrom, D.K., Ryan, J.N., Ball, J.W., 2012. A new method ofcalculating electrical conductivity with applications to natural waters.Geochim. Cosmochim. Acta 77, 369–382.
McNeil, V.H., Cox, M.E., 2000. Relationship between conductivity and analysedcomposition in a large set of natural surface-water samples, Queensland,Australia. Environ. Geol. 39, 1325–1333.
Onsager, L., 1926. The theory of electrolytes. Phys. Z. 27, 388.Pawlowicz, R., 2008. Calculating the conductivity of natural waters. Limnol.
Oceanogr. Methods 4, 489–501.Perens, R., Vallner, L., 1997. Water-bearing formation. In: Raukas, A., Teedumäe, A.
(Eds.), Geology and Mineral Resources of Estonia. Estonian Academy Publishers,Tallinn, pp. 137–145.
Perens, R., Boldõreva, N., Truu, M., Jaštšuk, S., Lelgus, M., 2011. GroundwaterMonitoring (Report on State Groundwater Monitoring in 2010). EestiGeoloogiakeskus OÜ. Hüdrogeoloogia osakond, Tallinn (in Estonian).
Puura, E., Neretnieks, I., Kirsimae, K., 1999. Atmospheric oxidation of the pyriticwaste rock in Maardu, Estonia. 1 Field study and modelling. Environ. Geol. 39,1–19.
Rossum, J.R., 1975. Checking the accuracy of water analyses through the use ofconductivity. J. Am. Water Works Assoc. 67, 204–205.
Siosemarde, M., Kave, F., Pazira, E., Sedghi, H., Ghaderi, S.J., 2010. Determine ofconstant coefficients to relate total dissolved solids to electrical conductivity.World Acad. Sci. Eng. Technol. 70, 258–260.
UNEP, 2004. Manual for National Training Programme. Malé Declaration on Controland Prevention of Air Pollution and Its likely Transboundary Effects for SouthAsia. United Nations Environment Programme. <http://www.rrcap.unep.org/male/>.
Vaikmäe, R., Vallner, L., Loosli, H.H., Blaser, P.C., Juillard- Tardent, M., 2001.Palaeogroundwater of glacial origin in the Cambrian Vendian aquifer ofnorthern Estonia. In: Edmunds, W.M., Milne, C.J. (Eds.), Palaeowaters ofCoastal Europe: Evolution of Groundwater Since the Late Pleistocene.Geological Society, London, pp. 17–27.
Visconti, F., De Paz, J.M., Rubio, J.L., 2010. An empirical equation to calculate soilsolution electrical conductivity at 25 �C from major ion concentrations. Eur. J.Soil Sci. 61, 980–993.